| Peak Oil and "The Limits to Growth": two parallel stories | The Oil Drum: Europe | Energy For a Changing World: A Credible European Energy Strategy for the 21st Century |
Oilwatch Monthly - February 2008
Posted by Rembrandt on February 24, 2008 - 11:00am in The Oil Drum: Europe
The February 2008 edition of Oilwatch Monthly can be downloaded at this weblink (PDF, 1.6 MB, 21 pp).
A summary and latest graphics below the fold.
Latest Developments:
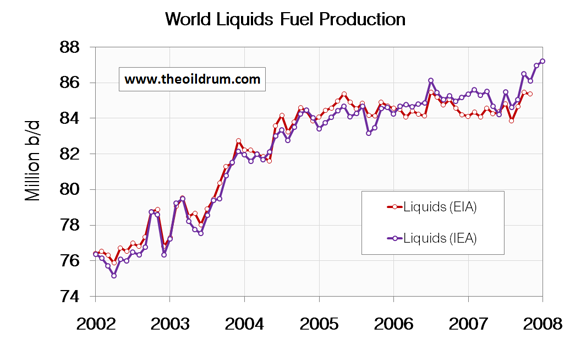
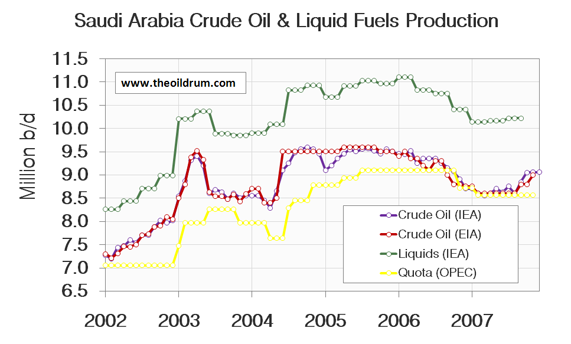
1) Total liquids - In December world production of total liquids increased by 745,000 barrels per day from October according to the latest figures of the International Energy Agency (IEA). Resulting in total world liquids production of 87.20 million b/d, which is the all time maximum liquids production. For the third consecutive month world production has increased significantly. The IEA figures result in an average global production in 2007 of 85.26 million b/d, more than the average 2006 production of 85.00 million b/d and the average 2005 production of 84.10 million b/d. The EIA in their International Petroleum Monthly puts the average global 2007 production up to November at 84.53 million b/d, slightly lower than the average 2006 production of 84.60 million b/d and the average 2005 production of 84.63 million b/d.
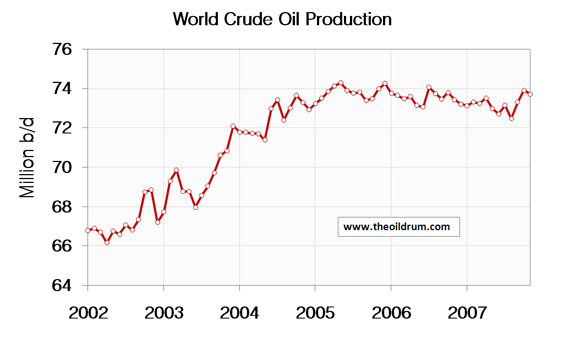
2) Conventional crude - Latest available figures from the Energy Information Administration (EIA) show that crude oil production including lease condensates decreased by 202,000 b/d from October to November. Total production in November was estimated at 73.17 million b/d, which is 518,000 b/d lower than the all time high crude oil production of 74.30 million b/d reached in May 2005.
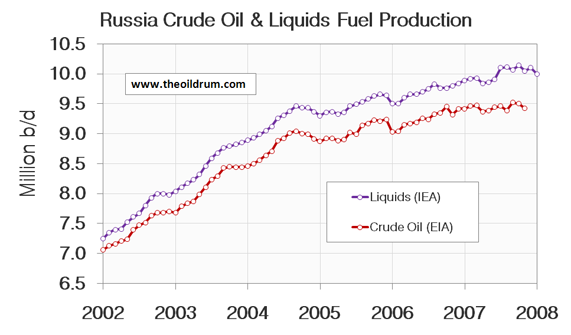
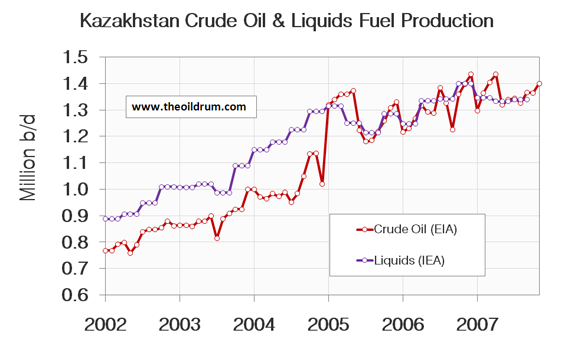
A selection of charts from this edition:
Personnel
Editors
Contributors
Peak Oil Primers
Archives
- November 2010 (3)
- October 2010 (6)
- September 2010 (4)
- August 2010 (7)
- July 2010 (6)
- June 2010 (7)
- May 2010 (2)
- April 2010 (8)
- March 2010 (4)
- February 2010 (6)
- January 2010 (3)
- December 2009 (5)
- November 2009 (8)
- October 2009 (12)
- September 2009 (6)
- August 2009 (5)
- July 2009 (11)
- June 2009 (8)
- May 2009 (16)
- April 2009 (10)
- March 2009 (7)
- February 2009 (10)
- January 2009 (15)
- December 2008 (9)
- November 2008 (9)
- October 2008 (9)
- September 2008 (13)
- August 2008 (10)
- July 2008 (14)
- June 2008 (23)
- May 2008 (16)
- April 2008 (12)
- March 2008 (16)
- February 2008 (9)
- January 2008 (13)
- December 2007 (13)
- November 2007 (16)
- October 2007 (22)
- September 2007 (8)
- August 2007 (9)
- July 2007 (16)
- June 2007 (8)
- May 2007 (7)
- April 2007 (7)
- March 2007 (10)
- February 2007 (10)
- January 2007 (12)
- December 2006 (9)
- November 2006 (15)
- October 2006 (4)
- September 2006 (5)
- August 2006 (5)
- July 2006 (9)
- June 2006 (5)
- May 2006 (10)
- April 2006 (9)
- March 2006 (13)
Vital Trivia
License

This work is licensed under a Creative Commons Attribution-Share Alike 3.0 United States License.
The decembher IEA data should be corrected in your graphs. Their initial release for december was indeed 87.0 Mb/d. But they overestimated some countries in the january report and corrected that figure in the february one.
In their February report (http://omrpublic.iea.org/), they say "January world oil supply rose 745 kb/d to 87.2 mb/d". Which implies that the december output was revised down to 86.455 Mb/d. Which is definitely high but still lower than october 2007.
And probably that their figure for january will be revised the same way but we still have to wait a few weeks...
I second that. Unfortunately, we only get free data for 3 months of estimates, from the IEA. From the data so far, we have:
October: 86.51 (the last revision that was available for free)
November: 86.08 (second revision)
December: 86.45 (first revision)
January: 87.2 (initial estimate)
This is not reflected in Rembrandt's graph.
Also, the first paragraph under the initial graph is wrong. The IEA figure of 87.2 is for January, not December, and that was an increase on December, not October.
Furthermore, in that first paragraph, Rembrandt says, "For the third consecutive month world production has increased significantly." Again, this is wrong, given the revised figures. Production actually decreased in November, and rose only 375,000 bpd in December, which I suppose could be thought of as significant. What is true is that the IEA initially reported significant increases for the last four OMRs, but this was only possible because of significant downward revisions for the previous month.
Edit:
Spotted more potential errors in the article. It says that the IEA reported production of 87.20. This implies a precision of two decimal points. If the article's figures are based only on the OMR summary, the precision there is only 1 decimal point, for the latest production. For example, in the January OMR, they reported 87.0 mbpd, but the full report had 86.95. That may be a small reduction but it would be good to publish accurate quotes, rather than slightly misleading ones, since there is no reason not to.
In the figures given for yearly production for 2005, 2006 and 2007, those numbers seem to be at odds with the figures that were published in the January OMR, with the figures being higher than Rembrandt gives here. The January OMR gives figures of 84.6, 85.4 and 85.5 for 2005, 2006 and 2007 (though the last figure may have been revised down in the latest OMR; we'll have to wait and see). Rembrandt has these figures as 84.10, 85.00 and 85.26, respectively. Is he somehow removing some liquid category (e.g. ethanol)? If so, why not remove it from the monthly figures?
About the number of significant figures in the data, the only reason that it seems important at all is that it does provide a bit of paper trail and you might be able to track the origin of the data by matching all the digits. Otherwise, plotting the numbers on a graph it doesn't make a bit of difference, and the noise swamps out precision.
It seems to me that a logical approach would be to basically ignore the near term IEA data, which appear to be guesstimates, and wait for the EIA to update their data, so that it would be somewhat more of an apples to apples comparison, so the last two months of IEA data on the graph would be chopped off, and the revised IEA data for November would be shown.
Yeah, that would be better. If a high production figure is posted in the initial OMR, we get a bunch of deniers saying "told you so". In the last two OMR's, the previous monthly figure has been revised sharply down, but that never seems to make the headlines. The IEA only says production increased by huge amounts, because of this that or the other. It is all analysis that is made worthless the following month when it's not unheard of to find that the figure actually went down, not up.
But I've asked a number of times if anyone has access to the full data. The figures posted here are, presumably, using the last publicly available figures but revisions can go on for months after that. Are the figures used in Oilwatch Monthly (when they're correct) from the actually data base or from the free information?
And by the way, thank you for your work :-)
Russian government is very concerned about declining oil production
http://www.russiatoday.ru/business/news/21270
February 23, 2008, 6:03
Russia’s oil taxation to be reformed
For unconventional liquids: Polar oil?
What is this?
Was that figure for crude oil in Nov. 07 supposed to be 73.71 mbpd not the 73.17 mbpd listed?
The former would fit with the Nov. figure being 0.52 mbpd less than the all time high in 2005 of 74.30.
So obviously the oil production did increase within the last few months. The oil price, however, did indeed reach new records. What does this show to us? In spite of rising production price is rising as well.
It will be interesting what will happen to oil prices, when the production will start to decline significantly.
I bet I can guess what will happen to prices.
Next two factors need to be taken into account. For OPEC/KSA we need to see production increases for up to 6 months to ensure its not coming from spare storage or over production that cannot last. Spare capacity is defined as only lasting for 90 days.
http://globalpublicmedia.com/transcripts/2647
I could dig out the exact one but this link is pretty good.
Next we have error bars on the actual numbers. In many cases these numbers are taken effectively on faith from producing nations no controls exist to ensure that the reported numbers are backed by real oil production. Tanker tracking is about the only way to get at least a reasonable check on the numbers.
Overall and this has been discussed before or measure of global production has error bars of about +/- 1-2mpd. So until we see oil production move either up or down by about this we can say for certain that we have left the platuae region either up or down. How ever until we see a real movement we can watch the price signal and adjust it for growth. So far it looks like the price is increasing in line with effectively flat production and growing potential demand.
We can look for anomalous price signals which should precede the real data on oil production so if we suddenly spike to say 120-130 then see a drop we can be pretty sure oil is headed down. The current strong pricing signal even as the US economy weakens makes be skeptical of the currently reported numbers.
I think we will see downward revisions. However as I said until we see a obvious move either in price or real changes in reported production or both we are effectively at plateau.
And thus its not obvious whats going on and probably won't be until end of 2008-2009. But once we are down 2mpd from peak production the changes of attaining a second higher peak or effectively zero. Thats when its obvious.
Yet no new record was established for crude production. And just as interestingly, despite record prices, despite a near trebling since $38 per barrel April 2005 prices, production remains flat. And that compares to prices doubling from 2002 to April 2005 yet production increasing by roughly 7 mbpd during that prior doubling in price.
There's evidence there but that's a camel's nose in the tent that some people refuse to acknowledge.
I couldn't agree more. The key issue is CRUDE OIL PRODUCTION. It is logic, that in the case of Peak CRUDE OIL, the production of ethanol, biodiesel et al is increasing.
I also agree. Our economy was built on conventional crude. It is the best measure of sustainable infrastructure.
Unlike the 1973 Oil Embargo where we had a finite shock. Stagflation will slowly suffocate the economy. Without steady growth of energy or efficiency, the economy cannot grow. If China and India are growing, someplace has to shrink. They have cash, we have to borrow. Creates an interesting situation.
BillJames, Thanks for posting that figure to the right. The history behind it is that I had been looking at modeling total liquids production based on discovery data for a few years. But then late last year when I wrote a post on TOD, I had a minor epiphany that the discovery data truly applies to crude only (and not total liquids). In actuality, total liquids has antecedents in natural gas discoveries and other sources, which is not reflected in crude-only discoveries. So what happened is that applying the discovery data fit to a model that included crude reserve growth and extrapolated crude discoveries, we may see a plateauing through this year, as I pegged the real crude oil peak at 2008 and not the earlier pessimistic date I had calculated.
As for your comments on the economic situation, I agree that it will continue to be an interesting situation.
Here is the post that the right-side figure is originally referenced in:
http://www.theoildrum.com/node/3287
(If we use the Shell Oil data for discoveries, which includes discoveries of "barrels of oil equivalent", then the total liquids shows a peak at 2010. This shows the importance of understanding what discoveries should be applied to.)
our economy is built on everything. oil is only 30% of our energy. can you show that our total energy is falling? oil is important but so are wages, debt, natural resources, workers and everything else you can think of.
90% of the energy for transportation comes from oil.
Best wishes for an economy without transportation.
"90% of the energy for transportation comes from oil."
we waste tons of oil getting to work with one driver in one huge car remember? tons of efficiency to be gained is the flip side of waste.
besides, that we won't run out of oil tomorrow. you also ignore using electricity for powering cars.
328. PEAK LIQUIDS ≠ PEAK ENERGY
http://peakoildebunked.blogspot.com/2008/01/328-peak-liquids-peak-energy...
thanks JD!
So you don't see any side effect of market-driven, forced carpooling on the average American citizen? Sure it will save a ton of fuel if everyone is carpooling, but if we have gotten to the point where carpooling is seen as a necessity, do you really think people will still be in the mood for that viente latte and that plasma screen and that granite kitchen and that expensive gym membership, etc.? By then they will have effectively stopped consuming as before and there's no denying that our entire economy is built on perpetual growth. As in never-ending.
What I'm saying is that you have the think of the psychological effects of this 'deprivation' on a society that for the most part has never been deprived. I just can't see a future where people are effectively forced to carpool - a huge lifestyle adjustment for 2 income families by the way - while at the same time continue to not just maintain but increase their level of consumer spending to infinity. If our economy isn't growing, it is dying.
our economy is built on boom and bust cycles. recessions are a part of that which is what you described. the world isn't going to end if we have to car pool.
when we car pool we create communities and friendships, that's what you guys want, right?
http://en.wikipedia.org/wiki/Fallacy_of_many_questions
Boom and bust, yes. But the overall trend has to be growth. And have the majority of us ever endured a bust so strong where free market dictated - because gas become so expensive - that the only cost-effective way to get to work was to carpool? To me, something on that level would be far outside of what we normally consider a bust cycle.
I'm just focusing on what was said in the above post, that we waste a lot of oil by driving around individually. No doubt about that statement. My argument is that 'driving around individually' is pretty much integral for a normal functioning economy the way we've set it up. If the economics of 'driving around individually' have changed dramatically enough for 'everyone' to carpool, to me that means huge adjustments to our collective psyche and our economy. And perpetual growth isn't in the cards in that case.
JD's work is biased and sloppy. For example, putting natural gas in as an alternative to skew his numbers. We all know natural gas decline will likely closely follow PO.
Another is the 2% decline rate for oil. That's a joke that nobody thinks is funny. The most conservative PO resisters (big oil and CERA) don't even try to claim that. This is an obvious agenda being supported with misleading "facts." In other words, useless.
Yet another is his ignoring that all fuels are not created equal. Even if total energy grows, you will still have problems with interchangeability. E.g., you can't lube an ICE with coal, natural gas, or electricity. You parrot that here by dismissing the point about petroleum being such a high percentage of transportation energy. Like a parrot, you're making a lot of noise but actually communicating anything.
People with agendas... chrissakes... Intelligent points raised by inquiring minds are so much more interesting and so much more useful.
Cheers
You use the initials "JD" as if everyone knows which poster he is. I can't work it out from your post, and without knowing which poster he/she the main thrust of your comment doesn't make any sense to me since I don't have the context to interpret it, I'm afraid. Maybe many who read your post will know who JD is, but not everyone.
http://www.theoildrum.com/user/JD
http://www.nizkor.org/features/fallacies/appeal-to-popularity.html
It's both ironic and funny that you launch straight into a fallacy to "prove" JD's work is biased and sloppy.
Ironic, funny, and rather telling.
Refute his argument, then. It's here.
It comes fairly directly from analyses by SS, Campbell, and Laherrere, though, so it's not clear that it's as much of a joke as you seem to be assuming.
As he says in the story:
"To those doomers who remain unconvinced: I hereby issue a challenge. Post in the comments. Show me the argument that proves Stuart Staniford, Colin Campbell and Jean Laherrere have got it all wrong about peak oil."
You obviously don't understand what they're saying, then.
They're not saying supply is going to decline at 4.5% per year; they're saying that supply would decline at 4.5% per year if no new fields were ever added.
New fields are being added, so the decline rate is less than 4.5% (and, in fact, is less than zero right now, meaning supply is growing).
Coal and NG can both be turned into liquid fuel via well-known technologies like fischer-tropsch. That you don't know about these technologies doesn't change that.
And, oddly enough, a US lab just came out with a method to generate gasoline from electricity, atmospheric CO2, and water, with - apparently - about 30% efficiency. Not industrial yet, of course, but neither is there a liquid fuels crisis yet.
So don't assume that something can't be done just because you don't know how to do it. Remember: that you believe something does not make it true.
Pit the Elder, You seem to have a forthright stance on much of this analysis. Do you have any numerical analysis on-line somewhere? Something that you have done on your own?
For example, the whole discussion around decline rates certainly could use a good chart. What is the decline rate doing over time? You say it is below zero, meaning the reserve is increasing. But is the decline rate below zero and accelerating upward? In other words, what is the slope of the decline rate at this point in time?
That would be depletion rate, I believe. Decline rate just refers to production; as production has been at record levels for the last few months, the recent decline rate must have been below zero, since production needed to increase to those record levels.
In my opinion? Far too noisy to meaningfully calculate.
I agree with your analysis BillJames. So much effort is made to discern all the numbers, but really it's quite simple. Crude oil provided the cheap energy for the economy to grow to its current level, and without increasing production to maintain growth, stagflation will suffocate the economy. Right now the only thing holding it together is a plateau of crude production with anything else that can be squeezed to produce fuel in a desperate attempt to supply demand. Trouble is the price of a barrel keeps rising and other liquids will only help bridge the gap between supply and demand for so long, until panic sets in and oil producing country's start hoarding supply for the survival of their own people. Based on a 14 mbd importation dependency, it seems most likely that the US will suffer the most. As the US economy is shocked into retreat, globalization will be rendered as a very short historical footnote to the ascent and decline of modern civilization via cheap oil.
Actually globalization has been around for a long time. Whats different is in the past regions specialized. Tea/China from China etc. Modern engineering practices allowed any region to produce any good give the infrastructure. And cheap transportation aka oil made it feasible to ship goods and more importantly raw materials around the world. This opened up global wage arbitrage. Resource exhaustion makes global wage arbitrage a smaller and smaller part of your costs. Who cares if you can build something for 10 dollars labor cost in China if shipping and raw materials eat up 150 dollars. Also of course the flow of wealth out of the consuming nations to the producing nations cannot continue forever.
So the whole grand scheme falls apart on two counts the consumers run out of cash and the planet runs low on critical raw resources. At this point low wages are no longer the draw the once where. Globalization is complete and we are all at the same level poor hungry and with no resources.
The only other choice we could have made would have been to lower population and focus on quality goods and services. A painting uses about the same amount of materials as a cheap poster. And one solid wood bed that lasts for 100 years uses far less materials than a 100 cheap press board throw away beds. So in a lot of ways the rejection of quality for quantity played a huge role in allowing us to take the wrong direction.
Cheap oil plays a big role here since it can provide quantity but not quality by making transport of large numbers of finished goods from around the world competitive with hand crafted high quality goods.
"Cheap oil plays a big role here since it can provide quantity but not quality by making transport of large numbers of finished goods from around the world competitive with hand crafted high quality goods."
There are "chinoiserie" exhibits at the Royal Ontario Museum; pieces of furniture imported to Europe or North America from China by old-style, wind powered ships. I question whether bulk shipments by big, slow ships will be much impeded even by ridiculous oil prices. Remember the gold-rush era stories about San Francisco shipping laundry to China for cleaning.
Suppose that prices go from $500/tonne to $5000/tonne [I am guessing at numbers here], and we are shipping 0.0005 tonne t-shirts. As prices go up from $0.25 to $2.50 per shirt, we probably won't see any major change.
Things that are huge, heavy, and cheap (bricks and gravel) are localized. But anything with large value-added is likely to remain subject to wage arbitration. For example, modular furniture that can be assembled with screwdrivers is probably highly value-added (over un-worked wood); it seams reasonable that the pieces will continue to be made remotely for local assembly. Ditto the fabric for said furniture. The stuffing may well be added locally.
That said, local transportation costs may be prohibitive. It may be easy to get stuff from Beijing to Ottawa, on a great big slow boat, but impossibly expensive to get stuff from Ottawa to Saskatchewan. So we may find that port cities continue to have cheap inter-continental trade, while landlocked regions do local or do without [until the railroads come back].
Non-rhetorical question to the crowd: what manufactured items have a significant transportation cost which will become prohibitive as oil peaks? For example, pool tables, granite countertops. What other items? (Coal, asphalt)
portland cement. expensive to manufacture and expensive to transport(energy wise). except for the relatively small amount transported by rail.
good luck with transporting portland cement via tall ship.
fly ash will probably be abundant for the near future. maybe adobe will come back in widespread use.
Hello Elwoodelmore,
Good point on portland cement--where substitution is possible, it will be done in response to rising prices [adobe, mud huts, etc].
Contrast that with the need for industrial [I] or organic sources [O] of NPK and other trace minerals for photosynthesis--no substitution possible for I-NPK & O-NPK -- unless we can figure out how to make plants thrive on toxic wastes.
Before FF-powered shipping and I-NPK, tall ships readily transported heavy, bulky loads of guano and human bones at enormous relative costs across trans-oceanic distances, especially if one incorporates the expense of the Guano Wars and the other military and piracy forays for resources to support this trade. They had no choice because there were NO SUBSTITUTES until the advent of I-NPK.
Now, with the double whammy depletion of FFs and I-NPK, I expect the eventual global trade of O-NPK to return, but the shipping economics will probably force them to condense this O-NPK as much as possible before they load it into the ships.
Bob Shaw in Phx,Az Are Humans Smarter than Yeast?
Shipping is so cheap that even during the wind-powered era, people were shipping bricks halfway around the world. Hiking in the California coastal mountains, I regularly find 19th century lime kilns made out of bricks imported from Europe. (I can tell where the bricks came from because until recently, standard practice was to stamp the name of the manufacturer on each brick)
I'm not disagreeing. I agree that globalization has been going on for sometime in general limited only by shipping technology. I think you missed the part about moving raw materials. Japan is a perfect example it has effectively no raw materials only as long as the price differential between shipping raw materials and finished goods makes sense do you have manufacturing located based only on wage arbitrage. In general in the past production was local to the resources where possible and only high value goods where shipped. And yes in some cases this means shipping bricks around the world.
To counter your California example if a source of bricks was available locally in the past then it was used. New York for example was built and in many ways possible because of local sources of raw materials. SF was built using local redwoods.
Also California is a bad example because gold rush/rail expansion economics distorted trade patterns.
It was cheaper to ship laundry to China for example because the ships where shipping laborers from China to work in the gold fields and primarily on the rail roads.
In general its best to make some money on both legs of a voyage since returning empty
is a loss. So you always have this underlying economic incentive to fill the ships hold with something.
Right now trade is so distorted that ships return empty to china or filled with scrap.
I think rail will allow the internal regions to continue to prosper from trade but its bilateral trade that makes sense. Not the warped wage arbitrage driven trade underpinned by cheap oil that we have today. Bilateral trade is good and will continue and has existed for thousands of years even if we go back to wind.
If one only considers the price of fuel, this may be so. However, one should also consider the total expense of ocean shipping, including the price of building and maintaining the ship, expense of paying and feeding the crew, etc. etc. We may find that this time around things are different in that the total resources required to ship via ocean are more constrained than in the past. Remember stories of Britain running short of wood for ships and how this changed with the exploitation of timber from the 'New' world.
But the reality is that as oil has gone from $10 to $100 the shipping of goods from China to North America has actually increased. It appears likely that eventually a 50" Plasma TV manufactured in China will retail in the USA for less than the cost of a barrel of oil (i.e. the Suburban commuter will pay the same price for the TV or to fill up his SUV). I think EVENTUALLY you guys are correct, but way way down the road (after the entire USA society has been turned upside down).
wherever it costs the least is where we will make stuff. the only reason we produce tvs in china is that it costs less.
I had Canadian Atlantic Salmon for dinner last night-here in Honolulu the price was 75% of the price in Toronto-so at $100 oil you can ship it all the way to Hawaii cheaper than you can get it from Halifax to Toronto.I don't think the long distance shipping is going away overnight.
Yes, it's likely to be a long-term thing. But EVENTUALLY could come around quicker than we think. On another thread someone was talking about how the price of steel would rise-- or is already rising-- in part because of the much greater demand from the oil exploration, extraction, refining and delivery business. This comes on top of the increased demand of other energy industries (including the nascent alternative or renewable energy industry), as well as the increased demand from normal global growth (which has been going asymptotic in the past few years). Altogether suggesting much higher shipping costs. I can see where ocean shipping will likely still maintain its relative cheapness vis-a-vis ground shipping, but will rise significantly nevertheless in the overall proportions of the expense of a given product.
I'd like to add one thing. If a lot of our current production is coming from technically enhanced extraction methods then the production curve is not symmetric it rises to a plateau that lasts for a indeterminate amount of time related to the depletion rate the drops of steeply. If our depletion rates are around 10% or so then the plateau period should be about 10 years. If close to 20% then its five years. In any case its between 5-10 years. This year is the earliest we can probably discern if its a big issue or not. But the longer we hover around a plateau the higher the probability that we have a asymmetric production curve. I'd rather see us either increase at a obvious rate or decrease at a obvious rate. If we start to see gentle decreases soon then at least we have hope that the curve will be relatively symmetric and we still have room for technical advances to slow its decline rate. A slow but steady increase is even better. However given the uncertainties in world production a broad peak lasting 4-7 years with a gentle decline is highly probable.
Texas peaked in 1972 and decline was not obvious till 1979-1980. So using this
as a metric its comfortable to assume we may not know for sure how post peak production we look for 7-8 years. I've done the fast collapse scenario a lot of different ways and they all seem to point to a plateau till the end of 2008 and swift and obvious declines setting by 2009. So if we really get the wall of oil expected in 2008 and potentially show increases we may be able to pretty much discount the swift decline theory.
Plateau is bad.
Questions: Memmel, given credit to your theory, is it pertinent to use Texas 1972 - 80 as a reference metric, factoring in that todays technically enhanced extraction methods are much more effective, thus usually precipitating the depletion rate into very steep decline ?
For importing counties, taking into account ELM, wouldn't the effect be just as bad, even if the production decline rate is "gentle" ? Not to mention "hording" effects and precipitous "strategic reserves" built up by several (rich) importing nations ?
Well my point is no I don't think we are going to look like Texas. A big part of Texas's gentle decline was a massive drilling campaign and later the introduction of the technical methods we use today.
I actually use 1990 as a start date for when "technical extraction" had a significant impact on oil production. You can't compare the extraction rates post 1990 to extraction rates before then. We made huge leaps in our ability to extract oil.
This technical extraction issue is on top of ELM or rather I prefer Multi-tiered ELM.
Next although its not been quantified ELM is important because governments control the bulk of the remaining resources and that under the control of oil companies has been extracted using advanced methods. So they are not unrelated.
I think the majority of people still believe in a slow gentle decline. However the only model that works if you assume or ability to extract has increased with time far greater then increases in recovery is a plateau followed by steep declines.
Although its not mentioned that much on the oil drum all the symmetric models did not predict this long plateau. The only way it comes about is with my assumptions that I know of.
Read both of these.
http://www.touchbriefings.com/pdf/2590/Ferro.pdf
http://mobjectivist.blogspot.com/2005/11/can-we-delay-peak-by-upping-ext...
Assuming Hubbert was right and a symetric peak should have been in 1995
add in the 8 years delay for advanced extraction and you get
2003.
Next give us 2-3 years because a lot of production was shutin thus delaying peak a bit and we have had some success on increasing recovery and better search ability.
And you get 2005-2006.
Essentially production could start declining steeply any day now.
Every year we don't see increases or gentle declines makes this more likely to be correct. Given the nature of the model i.e a fairly long platuae followed by steep declines and the uncertainty of the data the onset of steep decline is anywhere from 2007-2010 we won't know till after the second year of declines.
Right now I think its started last quarter of 2007 so thats why I'm thinking it will be obvious by 4th quarter 2008 too first half of 2009.
If I've got it right I'm thinking we will end 2008 down by about 2mbd and then 4mbpd by end of 2009. Thence 4-8mpd for several years afterwards till extraction is effectively limited by water handling. The only good news is I think that we can at that point do 30-40mpd for quite some time at a low rate of decline in production since extraction is not limited by technology but the volume of water that needs processing. Once your over about 80% water cut then your extraction rate is limited by the water and your actually getting additional recovery. ELM political factors etc should be added on top of this.
Given the MegaProjects list if we do actually increase production in 2008 then it means that reserve additions are valid and we probably will see a gentle decline. If its another year of plateau then all I know is I've guessed wrong on the year. But ELM itself becomes a factor.
I happen to hate my model but I've not figured out a way to disprove it given the data we have. And the data itself is so poor that trying to get a reasonable guess mathematically is effectively impossible if you question reserve additions. However inclusion of reserve additions results in production still increasing so as of now it seems my assertion that we should throw most of the reserve additions out and attribute current production to simply better extraction methods is true. If you throw them out and assume that extraction efficiency has doubled to tripled with a symmetric peak in 1995 you get our current production profile with some shifting due to shut in production and a double peak despite advances in extraction. With reserve additions included you get the wrong answer. With reserve additions excluded and constant extraction rate you get the wrong answer.
Humm.., after much pondering, and IMHO, you nailed it! (given the data around)
Just wondering what the rest of the gang has to say ?
Any important points missing ?
Can this model be refined with more "objective" data around ?
Seems to me that this could have tremendous impact on those decision makers and policy makers who follow the match!
Thank You for this enlightening add-on Memmel. I'm afraid you are in the 'hood' of something here.
The limiting factors regarding oil-extraction are all-over-the-place these days, so predicting next years flow is like predicting .... whatever. The thing is that Govt's must wake up to this now there aint no more time to waste.
PS the Gold rush in '49' lasted for .... eh 6 years ! After that 'done'
The California Gold Rush (1848–1855) began on January 24, 1848, when gold was discovered at Sutter's Mill in Coloma.[1] News of the discovery soon spread, resulting in some 300,000 people coming to California from the rest of the United States and abroad.
"Gold Rush" dynamics differ from oil discoveries mainly in terms of scale and variability. For a given area, the intense prospecting pressure leads to virtually no dispersion in the search space, and the activity collapses quickly after reaching the peak. Look at the curve labeled "no dispersion" in the following chart:
On the other hand, the large volume that oil encompasses and the differing accelerations in prospecting and search rates leads to a smoothed discovery profile which essentially removes the collapse in discoveries.
BTW, mass extinctions caused by intense harvesting, such as in the passenger pigeon era, look very similar to the gold rush dynamics in that the collapse after peak is severe (and ultimately final). There was no variability in the efficiency in harvesting pigeons; it accelerated quickly from guns to explosives, the hunters knew where every last bird was, and the pigeons didn't stand a chance.
I am not saying that we have much to be positive about WRT oil, but that the math modeling behind it differs from gold rush dynamics, see http://www.theoildrum.com/node/2712.
Well did I say otherwise?
That mentioning of the gold-rush was just a philosophical anecdote, serving as a reminder… of something..
As opposed to oil/fossil-extraction and combustion, that gold from 1949 is still around and kicking and shining for you WebHubbleTelescope.
I think one day I may have to look into your linked guest-post, looks educational .thx
It gave me a chance to do some expository writing. That's what makes this interesting. These topics are all related in potentially explainable ways.
But once a field or better region is found to contain oil. In field drilling and discovery of smaller fields that can be exploited using existing infrastructure follow gold rush like discovery curves not the smooth dispersive curve of initial discoveries. There is a big difference between finding a new region or field in a previously unexplored block and exploiting reserves in a known oil producing region.
Its this intense exploitation of known basins that has driven oil production to its current levels not the discovery curve which is pretty much well in the past now.
So its really a mix of both both modes in my opinion. Look at the North Sea for example.
http://home.entouch.net/dmd/northsea.htm
In my opinion this is a convolution of dispersive and non dispersive discovery.
If anything non-dispersive is a better fit.
Or in short once commercial quantities of oil are found and produced in a region most of the oil in the region is discovered and produced. Or finding oil using dispersive discovery results in non dispersive search.
The problem is we get a significant amount of oil from the non-dispersive discoveries.
And with depletion rates reaching 20% a year from these concentrated sources we can't replace oil found via these localized searches without finding new basins.
If you assume that this intensive search started about 1990 and that we succeeded in replacing oil depleted from discoveries using intensive search once. And be generous and give these fields 10 year life spans you end up have effectively exhausted most of the oil in known basins by 2010. This excludes the super giants which have different dynamics. In the real world its not two waves but dispersion of start dates does not really change the result.
The reason I think this is important is because oil prices are sensitive to production and given the above the chances of the aggregate of smaller fields which provide 40% of the world production to suffer 10+% annual declines because of lack or replacement is real. This gives the 2mbd-4mpd steep drop in production that has me concerned.
Its not the super giants that determine overall production but these thousands of smaller fields produced at furious rates with no prospect for replacement.
How are you going to replace production in the GOM or North Sea ? These regions are fully exploited and production decline rates are matching field decline rates.
In the swarm of small fields case once you can't add new fields production drops of swiftly.
There were some reports predicting rising production in the GOM as more deep fields will be brought into production. Shipyards were busy building deep sea drilling rigs. They are needed all over the world. Rigs were leased into the next decade. There are discoveries and prospects full of oil, but not enough rigs and qualified people to produce the oil.
In Canada there is the Athabasca Basin that yielded oil after intense development. There were shortages of experienced workers and infrastructure to support them. In Venezuela there was lack of a stable government, else production might be rising there too, except for OPEC quotas limiting oil development. These areas might be more fully utilized on the downside of the world oil production curve in ways similar to the Bakken strata development in Montana and North Dakota long after the United States peaked in oil production about 37 years ago.
Some areas had recent discoveries, Tupi in Brazil at about 5 billion barrels and Jack in the GOM with as much as 10-15 billion barrels (in place?) that you cannot yet rule out in one 300 square mile field. There were other fields under the GOM deep-waters also, not all of them small. Why was there so much oil in these deep locations? Is it really possible that they might extract it, or were they being boastful?
The Caspian area has not peaked either, yet peak oil is coming and the fossil fuel era will eventually end.
Writing was invented about 5000 years ago. Some new innovations might be required if civilization will exist another 5000 years.
"In my opinion this is a convolution of dispersive and non dispersive discovery."
Deterministic effects take place in smaller volumes while stochastic effects rule over large volumes. In other words, the statistical effects of smaller volumes lead to more noise in a discovery curve like the North Sea. So I don't necessarily think that convolution in the way you describe has anything to do with it. Plus, I don't know what exactly you mean by this. The dispersive discovery model is essentially an integration over a range of rates comprising non-dispersive discovery curves.
You may be basically reiterating the tenets of the model.
The problem I have is dispersive discovery has a broad discovery period post peak discovery. We see this to a large extent in the data if reserve growth is included.
For the sake of argument if you remove reserve growth. By convolution I'm simply saying that search is correctly modeled as dispersive during the initial discovery phase but once a region is mapped the dispersive term goes rapidly to zero and non-dispersive discovery curves are primary in effect a constant and small discovery rate. To me at least the dispersion effect only holds as long as new basins are open for discovery. With reserve growth it seems that the dispersive search model holds. The problem is backdated discoveries fits the dispersive model.
Where if you look at real data from a single important basin we don't see dispersion.
So if we looked at original discoveries is it dispersive ?
I'd say yes for the initial search phase but further sampling or searching does not add significantly to the original discoveries.
"By convolution I'm simply saying that search is correctly modeled as dispersive during the initial discovery phase but once a region is mapped the dispersive term goes rapidly to zero and non-dispersive discovery curves are primary in effect a constant and small discovery rate."
But the tails in dispersive discovery are due to slower rates of search which lead to smaller number of discoveries late in the game. This is all part of the mathematical model of dispersion: the fast search rates lead while the slow search rates lag. The slow searches map out the far reach pockets and difficult locations. These may not be slow in the absolute sense, due to technology, but they are slower than the faster searches that preceded them on the prime/easy volumes.
Dispersive Discovery as it relates to reserve growth on a single reservoir/area differs slightly in the dynamics. Empirically we see what looks like parabolic growth (i.e. sqrt growth) which I contend can arise from slower diffusive characteristics in the search. Described here:
http://mobjectivist.blogspot.com/2007/12/dispersive-diffusion-model-of-r...
So reserve growth mas a macroscopic or global component and a micro/local component which gets folded into the global model through backdating.
I'm no disagreeing I'm just saying I don't believe the reserve growth numbers.
http://www.tiscali.co.uk/news/newswire.php/news/reuters/2005/06/14/busin...
What happened in 2005 that caused reserver growth to suddenly slow ??
Nothing.
However extraction capability of our current reserves seems to have hit a peak.
This shows that production rate is playing a big role in the reserve growth calculations.
It pretty fair to estimate that our extraction capability has doubled and even tripled since the 1960's. Thus for example I contend if Purdhoe Bay was discovered today it would be booked as a 20GB+ field and quickly ramped to 3mbd or more of production.
Suddenly ten years later the experts would be puzzling over the sudden decline of this huge field. New imaging technology also plays a large role in overestimating reserves
we can see whats down there much better today and we can extract faster therefore the natural assumption is to assume we have more oil.
Also as far as backdated discovery goes although its difficult to find it seems the trend has been for backdating to became a larger fraction of total reported reserves over time. Reserve estimates from the 1950-1980's did not seem to change all that much
and seemed inline with the actual recovery. One reason Hubbert was successful in predicting peak US production. Certainly in some cases i.e water injection in the North Sea real recovery increased. Given the amount of oil added via backdated discoveries our actual reserves could be 2-3 times less than reported.
I've actually not seen compelling evidence that remaining reserves are signifcantly higher than the 1250 GB predicted by Hubbert for the world in 1980. At best maybe 50GB or real additional reserves have been added and in my opinion even thats questionable.
On the other hand by taking into account technical advances its relatively easy to convince yourself we could maintain high production rates well past 50% URR.
Symmetric HL plots generally give a peak at 60% URR assuming a asymmetric curve can push out peak production to 70-80% of final URR and potentially even further up to about 90% of URR in the best cases. Look at Cantrell for example.
Another smoking gun that backdated discovery may be bogus is to look at the non-backdated curves the smoothly increase in time.
http://www.oilcrisis.com/laherrere/disctrnd.htm
The problem is that yes backdating corrects the trend but the original has to be wrong since even if its applied to the current year we would have seen the curve flatten.
Correct non-backdated reserve additions should also reach a maximum.
By dispersing this incorrect data into the original discoveries your simply inflating the estimated URR. My opinion is that your current dispersive model can't detect inflated reserves. For example the large leaps in reserves in opec countries would look reasonable if they had been done over several years and backdated. The data would have looked just like for the US. In fact in one of the papers from KSA justifying the reserve additions they produced a figure very similar to that shown for the US.
I don't have a link for the paper handy.
Nothing wrong with the dispersive model its just that it can accept incorrect data.
A oldie but goodie on reserve growth.
http://europe.theoildrum.com/story/2006/12/14/175156/19
And in particular the second part.
http://www.theoildrum.com/story/2006/12/21/124953/88
Thus even without backdating a lot of reserve growth is questionable and continuous reserve growth is almost certainly bogus. I use this as a example because it ties reserve growth to a valid reason there are other valid reasons for reserve growth.
Regardless the growth curve itself should be asymptotic and normally it would be driven
by a correction in the original assumptions.
If reserve growth did not make up such a large portion of our current predicted reserves up to 50% depending on the data you accept then it would not matter. Considering that real world examples show a wide range of different reserve growth you have to question the use of backdated discovery data with the dispersive model. This means the model must be robust agianst inflated backdating of reserves often caused by incorrect attribution of enhanced extraction with enhanced recovery.
I can't see that the dispersive model you have presented is capable of detecting bogus reserve growth. As Rembrandt's paper shows real reserve growth does happen but its often for widely varying reasons.
I'm not disagreeing with the model as it is just that it suffers from being unable to detect reserve growth that not correct.
Yes, I agree that most reserve growth occurs in the first 6 years or so, and that gives you a fairly short and concise window for doing an effective backdating for discoveries that occur over 6 years ago.
So most of the fit to the Dispersive Discovery model uses historical data that includes backfit data from decades past and so the extrapolations also include the potential for modeling future reserve growth. This is proof by induction basically.
This is what I've not seen.
1.) Dispersive Discovery with no backdating.
2.) Dispersive with a cut off say 6 years to full characterize a field.
3.) Dispersive with other affects ( original URR did not include water/gas drive )
Etc. The dispersive model should be able to detect anomalies in reserve additions.
And at least from my research our future hinges on the validity of reserve growth.
The OPEC sudden jump is so obvious its easy to dismiss.
The US reserve additions not back dated should have still followed a creaming curve thus they are highly suspect.
The North Sea ones may have also been overestimates. Although of the bunch they and the Russian ones seem to have been done for valid reasons.
Ghawar well the field been under peripheral water injection since early in its production history I can't image how if you have drilled wells that way your going to get significant reserve additions. And this is true for a lot of other fields in KSA.
Just the production pattern alone indicates that the size of the reserve is well understood. They are claiming high recovery rates which is the weakest and least proven of the reasons to increase reserves.
So overall almost all of the reserve additions outside of defining the field in the first six years or so are suspect. This is about 750GB or more or so of our current claimed reserves so its a big deal. It depends on how you do the math but the bulk of the current reserve claims are from reserve additions since the 1980's.
And in general from my readings the foundation for making these reserve additions is weak at best in most cases.
I think since the north sea is well document and already well in decline allowing a number of ways to estimate its final URR it could easily work as a "true" case.
Also the same is true of a number of fields on land in the US. We have enough data thats valid I think to form a trust worthy baseline. Other regions like the GOM are suspect.
Along with recent Russian data.
1) N/A, so it will scale, big deal
2) N/A, same deal
3) N/A, this is statistics not physics
The rest of your statements are also inapplicable, because better statistics come out of taking aggregates as opposed to singling out individual areas. I learned this long ago; you don't understand a circuit by following the path of a single electron, but if you take enough electrons you can predict the behavior.
Bummer you feel this way.
So as far as I'm concerned the model is GIGO.
The electron analogy does not hold because the physics of the single electron are well known and proven true so you can believe the ensemble case.
If you don't believe the detailed behavior the ensemble is junk science.
Not if you consider that you cannot track the path of a single electron without influencing its behavior, i.e. the uncertainty principle.
And we do know the physics of sucking on a straw, which is what oil depletion amounts to, yet we do not wish to express the sucking of one straw in a determinate way because of the huge variability in possible outcomes of multiple straws. This is really pretty basic stuff, and whether you think the model is GIGO or not, somebody really ought to look at it from this perspective.
As Obama says, what I see are "only words" :) :) :)
Come on Web my PhD work was in semi-classical quantum chaos theory. I think I know how this stuff works. And I'm pretty good at statistical thermo dynamics. You know as well as I do that probing a electron for its states and developing the ensemble to determine bulk properties have nothing to do with each other. In fact in the case of electron flow its actually a energy band and is well modeled using classical assumptions. Quantum effects are low. Now getting electron flow through a insulator is a different ball game and heavily influenced by quantum mechanics. Passing a electric current down a plastic pipe is full of cool quantum stuff. Its why we where able to develop electromagnetic theory for conductors before quantum mechanics was invented. They only got stumped by the photoelectric effect and some black body anomalies. Insulators however where never well explained by classical electromagnetic theory.
Now all I'm saying is the reserve growth for the US is simply not physical even if you believe the numbers or not it still should have leveled off.
How can Brazil drill one exploratory well and do some seismic and get a good value for a reserve that in deep water ?
How can we do horizontal drilling in a thin layer of oil of many km and make it work ?
How can we now drill small offshore deposits and also find bypassed oil in old reservoirs ?
How can we not have a good handle on our oil reserves for fields that have been in production for decades and have to up the URR year after year ?
Explain how we are so good at finding new deposits yet so bad at characterizing what we have found ?
The answer is simple most of the upward reserve revisions are based on advances in extraction capability and the assumption that recovery rates are now much higher then in the past. If your production is higher and your dreaming you can get 50% or more of the oil out of a deposit then you can publish any number you wish. I think KSA is now claiming 80% recovery rates to support their reserve estimates.
The main reason that this site exists is because the official numbers and story from the oil industry does not seem to be true. Why do you believe these reserve additions ?
You may not like HL but one of its most important properties is you really don't have to believe the production numbers to use it. Either they fit the empirical equation or they don't. Given that all numbers out of the oil industry are suspect I've got a lot more faith in a empirical model than in propagating what may be seriously invalid data through a complex model to predict the future.
It may be wrong etc but its robust agianst invalid data.
Hell I link your work all the time. I think your models are good.
But you know as well as I do if a substantial amount of the reserve additions that have been made over the years are paper barrels then we are in serious trouble.
All of them are not wrong but enough is questionable that I think taking the data on faith is not a good idea. In fact you have already run the extraction shocks on your website. What you have not done is test the assumptions behind reserve additions.
Given that you have already shown that multiplying extraction rates can keep production high agianst significantly lower reserves why not at least consider that the reserve additions that have been published are doubtful ?
You know full well that its fairly easy if your able to increase extraction rates to assume that you have had a increase and URR and the truth is not known till near the end. And if you can keep replacement up you can pull it off for decades. Its like continuously refinancing a billion dollar debt on a 10 million yearly income. Party on till you can't pay the interest.
Boltzmann statistics arise from distributions of energy levels of particles which enable some particles to exceed energy thresholds. No difference in some of the fundamental math there and for dispersive discovery. I'm sorry that I have to keep using words where the model is the natural notation for getting the concepts across.
And the model is in fact conservative because no where else do we see discoveries extrapolated into the out years, with backdating included (which adds to the conservative estimate).
Right I agree about Boltzman. Actually discovery and oil extraction should follow boltzman statistics at the lowest level. I'd say fractional flow could be converted to a bulk solution using Boltzman like statistical methods. The key is the the microscopic properties are well defined and understood before you can get good numbers doing partitioning and integration. In the case of metals the energy levels are effectively a band so the quantum details don't influence the macroscopic behavior all that much. Actually the crystal lattice is more important. Although offtopic its quite similar to the problem of oil extraction the oil viscosity is one issue but also the lattice or rock type. A simple but powerful model for oil and water moving through a reservior could probably be two balls which experience to different lattice effects. The oil sees a smaller lattice vs water. This dual lattice is a simple model for fractional flow.
Higher viscosity oil would see a smaller lattice. The water lattice is constant.
Gas would see a even larger lattice. I think that these flows through a lattice have good closed approximations.
Web the only issue is that I'm concerned about the quality of the data and the resistance if you will of the model to incorrect data. In general this means the model has a small number of parameters and is robust to changes in the inputs. I.e small changes in the data do not lead to large changes in the important results.
Back to HL since it has only one tuneable parameter its robust to the time of peak. And despites its critics fairly robust to URR out to the tail regions. It can give large changes in URR but if you look at the graph this is generally distributed out in the long tails. Peak date and initial post peak decline rates don't move much. Also initial decline rates are fixed since they mirror production rates. And these are the variables of interest the long tail and URR change is not all that important despite the bickering on the oildrum. Our civilization wont exist in this tail.
So how does Dispersive discovery change with and without backdating. The key is how does the model change with changing datasets and most important your interpretation of the changes. Obviously the variable of interest is initial discovery URR estimates vs backdating vs final URR for depleted fields. If you tally up the current reserve estimates like I've said the bulk of our current reserves come from reserve increases made well after the original discovery. These late additions are the ones least likely to be real and more important even if they are least likely to be produced at high production rates give the age of the field. Thus they simply represent potential for a long tail of production if the field remains economically viable as world production drops.
My thesis is fairly simple our "fast" oil that can be produced at high production rates is best estimated using the initial discovery data with only well vetted and understood reserve additions included on a case by case basis just like we have excluded the jumps in OPEC. This give a pool of oil that we are confident can be produced at near current production rates.
This pool is only about 1250 GB. And we are over 1100GB and producing 30GB a year.
A global water cut of 80% is consistent with this assumption. And it fits Hubberts global estimates.
If you do what I'm saying and discount the reserve addittions correctly and roll all this back into the shock model and include a extraction shock then I think you will see what I'm saying. The reserves of oil extractable at high rates has not changed much if at all from Hubberts original estimates. The combination of capacity exceeding demand at peak in 1995 coupled with increasing extraction rates has allowed us to keep capacity on a high plateau for 20 years and recently production at the cost of a overall asymmetric production profile. Next advanced extraction methods have the probability of continuing to provide oil production in the future but at a production rate about 50% less than today and we will drop to this rate fairly quickly post peak.
All this stuff is on your website as far as I know the only real problem is your not heavily discounting reserve additions in old fields/small fields like you need to.
Its driving me crazy that your missing one puzzle piece.
"All this stuff is on your website as far as I know the only real problem is your not heavily discounting reserve additions in old fields/small fields like you need to."
If I did discount reserve additions, my estimates would be less conservative and the peak would arrive more quickly (and actually would be in the past). That is why I call it a conservative estimate.
Unless I am misunderstanding what you mean by discounting, which I take to mean as reduce as in a sales discount.
So it is a conservative/optimistic estimate. A non-conservative/pessimistic estimate as you suggest would drive in the peak much more quickly.
True but thats not the real issue. The issue is the political, monetary, lifestyle effects of various decline rates.
A turn upwards and gentle decline in oil is ok. Even though gasoline demand and prices are high society can adjust we have plenty of waste in the system.
A slow decline 2% or so a year ditto.
If we see production declines greater than 4% esp if they accelerate then the chances of discord increase significantly. And its a feedback type issue if one region has problems in general it will spread.
Peak oil at its heart is a lifestyle problem. In general the world has invested in a economic model that would be devalued almost instantly if we see a steep drop in oil production. The losses are staggering. In the US for example you would effectively see most of the value of suburban infrastructure drop. Taxes would be problematic and many cities would default etc. And this is just from oil not to mention that the recent economic bubble has the whole system poised to do this anyway.
So given that the downside risks increase substantially it important in my opinion to make a fair assessment of the worst case scenarios and try to understand the probability. These are the only ones that are seriously worrisome. In all the other cases peak oil is painful but can be dealt with. I'm not saying they will be pleasant just that they don't in general result in a high chance of break down.
Even Simmons is giving the probability of a rapid decline 25%.
http://www.simmonsco-intl.com/files/Kayne%20Anderson%20Energy%20Funds.pdf
His arguments are effectively the same as mine. And notice he is very critical of the reserve additions.
The best case scenario is that we could actually prove the worst cases have a low probability. So far all of the scenarios that result in gentle declines are wrong.
You want worst case. I can only give what I consider a most probable outcome with the best data at hand. A worst case would have to have a probability attached to it and same with a best case.
Memmel, I like to get back to your "baseline" mentioned in the beginning. I would like to get some sense of reality timeline for your model. I will take a production of 85 mbd as "Today" (And one can argue that..)
"If" we take a depletion of 2 mbd in 08 and 4mbd in 09, and a "medium case" for simplification purpose afterward of 6mbd, we will need about 7 years to get to about 35 mbd medium case production (in 2016). Take or give 1-2 years... Are my assumptions correct ?
From there on, another plateau of X (?) years.
My point is to find out how much mbd will be left to importing countries in your model, all along the line.
Seems to me we will have to very seriously work out an economic model for this one.
Maybe Matt Simmons can led us some of his people ?
One quibble these are production declines not depletion. This is assuming that technical progress can keep production levels high well past 60% depletion and further that we are well past 60% globally anywhere from 80%-90% depleted. If any of these assumptions are false the the whole argument falls down. If for example technology can keep production levels high and we are 50%-60% depleted than we should either see slowly increasing production rates are a very slow post peak decline for at least a decade. So the key argument is that we passed 50% URR well in the past about 1995 and technology both induced a oil glut at peak capacity and gave us ten years of extra production in exchange for a asymmetric curve. If you look at capacity arguments then we have managed to keep capacity pretty close to today production levels for almost 30 years. If demand has been high enough at any point in the past 3 decades the oil industry would have been able to increase production to meet demand. The rapid increase in production once oil prices increased lend validity to these assumptions.
I'm just pointing out that there are a lot of preconditions.
Next your estimates are inline with what I'm saying the world drop to 30-40mpd of total production by 2015. But note I expect it can be stabilized somewhere around here and declines will be gentle. We are in a sense back on a symmetric curve at that point.
On the economic side I don't see the point this scenario leads directly to global resource wars. Its too fast for any sort of peacful response. I'm not saying its the end of the world but free market concepts are out the window and we are looking at a return to conditions that preceded WWI and WWII. Its different but military power plays to big of a role to consider economic models.
Ooops, sorry for the typo, "production" it is of course (!) my mind was wandering...
more questions, If I might ?
What's your definition of "multi-tiered LEM" ?
Regarding "resource wars" are we not already way into it, looking at the Middle East and Africa (it's not yet Global, but already pretty much about oil anyway).
After around 2009, I guess we will hit a critical point in geopolitical and socio political behavior. On top of energy worries, we will have a financial crisis in full swing, and a climate crisis starting to really hurt. Any chaos theory model fitting here ?
Multi-Tiered ELM is pretty simple. The heart of ELM is that local markets are well supplied before excess is sold. Thus Saudia Arabia and the US supply the local market first. Politics are a big part of why ELM works. So primary ELM is the flow of crude oil into various markets. Secondary ELM is the flow of finished products from Refiners to markets. Right now we have a large global secondary market for oil products with Refiners not located in the final country where products are used. The US is the biggest importer of spare refining products. Once primary ELM becomes a force and Refiners are having problems getting oil at a price that the local market will bear they will attempt to adjust their purchases and supply to the local markets. Also if the export market is not paying a premium then they will slow final exports. Obviously in general at no point are they going to export finished products if it means shortages at home. Thats the key point. So once ELM is in force we would expect that importers of finished products Gasoline Diesel etc are going to see the first wave of increased prices even as the supply of oil is not obviously a problem.
This continues down the chain. For example if India imports finished products then if they are having supply problems they lower the amounts sold to Burma or increase the price. Thus the last consumer gets hit hardest. So you see ELM is really a cascade of imports and exports with the problems starting at the branches.
Actually ELM is simply a variant of the long supply line problem so its well understood.
As far as resource wars go. Despite my dislike of the Iraq situation. If I'm right then it coupled with the invasion of Afghanistan represent a brilliant strategic move on the part of the US. Don't forget that Pakistan has nuclear weapons. The problem with this is its only so obvious and compelling and worth the cost in both lives and equipment if we are really facing what I think we are. In the long term by moving into Iraq using conventional war the US has probably averted or reduced the chances for a nuclear conflict in the ME. So given the horror we will face if resource wars unfold Iraq will be viewed as a minor and comparatively benign conflict with immense strategic value.
The world is about to get a lot more ruthless and the gloves are coming off.
Although I think Bush is a complete idiot he is the mouthpiece for some very smart well informed and wealthy people. I've seen no indication either from the invasion of Iran or the destruction of Suburbia and the middle class that the powers that be are not gaming for a world that will soon be desperately short energy and unable to support the current consumer economy. We are moving to a war based economy. Same with china although at the moment they are behind the curve. In Europe the missile defense systems and other events are obviously about the EU and Russia heading for some sort of solution that ensures the EU's energy supply. That dance is more delicate since Russia has nuclear weapons but its happening. I hope that Russia and the EU eventually can settle without bloodshed.
So overall I have a problem that if I'm right then for me at least most events of the last decade despite the outward stupidity make perfect sense.
Very interesting analysis indeed, thank you very much for enlightening me, Memmel ! I actually concur very much about the geopolitical "smart moves" behind a curtain of stupidity, it makes indeed perfect sense !
This begs the questions of where are the "safe heavens of the future world" going to be....
Not Africa not China not the Middle East.
I think that believe its pretty much the same places that are stable now. Canada, US, Europe. The governments probably will not be democratic more fascist is my guess but they have the largest level of waste in oil consumption that can be fixed by a jarring but still reasonable change in lifestyle. So these regions go back to riding bicycles taking public transport and renting apts. They wont be happy but the military government won't care and overall they will be a lot better off than the rest of the world.
Also coal nuclear and renewable programs can be accelerated. We can easily throw up cheap apartment block in our cities to house the new working poor. In general ( see below ) once the population is stable these regions are self sufficient in food and water.
They also will probably have programs to get rid of recent immigrants and close their borders. Redirecting hatred to scapegoats is a common theme for these source of situations. Expect all countries to start rounding up and expelling various identifiable groups of people with genocide eventually occuring on a large scale.
Also they will use military might to secure the remaining resources.
Patriotism will be revived to ensure that people like me don't say much :)
China and India will implode like they always have on internal struggles.
The same probably with most of South America with perhaps Brazil becoming a major world power.
Russia and Japan/Korea are the two interesting cases.
I can't figure out how Japan will move.
I think for Russia the game will be quite similar to Afghanistan we get them involved in border wars with breakaway provinces and bleed them dry. Expect convoluted situation with the US supplying terroristic Muslim states fighting Russia and Russia supplying Moslem terrorist fighting the US and China. Notice that Muslim nations will be the Vietnam's of the next decade. So the US will back Chechen rebels and probably start wars in the Stans while Russia sends arms to Iraq and potentially Iran once it can no longer export in a few years. Note that practically all the resource wars of the future will be located in Muslim countries in Asia and Africa and these are easily destabilized because of the religious/ethnic issues. So you have a big mix of freedom fighters and terrorists depending on if your funding the group or your adversary is.
Longer term for Russia about all they can do to get directly at the US is to foment communist rebellions in the Americas. Their problem is they don't have easy ways to start the same border wars with Europe and the US outside of Serbia. Also they will be dealing with the Chinese Koreans and Japanese on the western end and even India in the middle. So overall it look like Russia will be fighting a multi front war.
For the most part this is just a reversion back to the situation in the 1800's- 1930.
Its the "traditional" resource problems that have caused problems since the world was globalized in the 1700's.
Overall Japan and Korea seemed to have drawn the short straws.
Memmel, You always give us little nuggets of thought to think about.
It could turn out this way, as a war of all against all for resources. But it doesn't have to.
If we abandon our extremely wasteful economic model which requires excessive energy consumption just to create jobs working 40 hours a week, we would have no reason to "go after" anyone else to secure an energy supply. You say people won't be happy if they have to do with less. I disagree. Some people will be happy. Some won't. Just like now.
I was just entering adulthood when the first oil crises hit. I saw this coming and never developed an appetite for the kind of lifestyle that people think they need now. It has had no effect on my level of happiness.
The people who say we have to militarily control the world's energy resources are running the same kind of protection racket they've been running since we came down from the trees. It's time we wised up. They try to make us afraid of something that they say only they can protect us from and then they demand tribute.
These people need to be put in their place or the dire situation you envisage will come to pass. There's no "New World" to go to to escape it any more. It could turn the human race into monsters.
Humm...not so sure about the US actually. Many tensions, more building, lots of people are getting very very frustrated about loosing their toys. The good times lasted very long, too long probably ...and to many guns on the loose in a trigger happy nation. Makes me worry a lot for my friends in the US ..
If anything the guns that people do have in the US are a good pretext for putting in martial law at the first sign of trouble. Military arms are far superior to the weapons that civilians have today. If you look in the US automatic and heavy caliber weapons are basically banned. Anything that would give a citizen enough power to defend against a government not working in their best interests. At best people that tried to use their guns would simply cause even tougher controls be put in place.
Next of course these same armed citizens live scattered in indefensible homes.
Its not like that are running around with rifles in craggy mountains living off the land. A few might eventually but its not a reliable fighting force.
Also banning arms at the right time after a military crack down and a few incidents gives the military broad powers of search and seizure to find weapons caches real or planted.
It will force a lot of people that are zealots but also own weapons to become traitors.
Russia and the Nazi's had to routinely purge the populace of zealots that had the chance of fragmenting the government.
Just because I think these countries will remain stable does not mean they are some sort of post peak utopia with people growing organic gardens under the windmills.
If your choice is dying or staying alive then they look good but other than that ...
I'm not saying it won't get bad - just that it doesn't have to. If it does, I'll probably be one of the first to go. I've been scapegoated in the past and probably will be again.
There are two sides. One side knows I'm their enemy. The other side thinks I'm traitor because somebody started a rumor years ago. I'm not and never have been. I'm a true believer and always have been. But that doesn't count for much when the going gets rough. People look for somebody to blame.
Hi Web,
Have you read this paper:
"Petroleum Drilling and Production in the United States: Yield per Effort and Net Energy Analysis"
Charles A. S. Hall; Cutler J. Cleveland
Science, New Series, Vol. 211, No. 4482. (Feb. 6, 1981), pp. 576-579.
I think you would find it quite interesting because I think it describes the mechanism that leads to your dispersive curve.
They discovered that Yield per Effort gets lower and lower the faster you try to drill. And to follow that exponential rise to a point, you need to be able to drill really fast to bring all the tiny fields on line before any can decline.
I had wondered myself why the production curve was bell shaped and not exponential. It only made sense to me if somehow producing less oil allowed a company to make more profit. And then I stumbled upon this mechanism.
-Jon "gTrout" Freise
It looks like it is referenced in this article:
http://dieoff.org/page197.htm
Net Energy Analysis of the U.S. Oil and Gas Exploration Industry
I don't disagree with this as it basically says that a wide range of search rates are employed over the years, and a lot of the high/fast effort gets expended near the margins of potential oil volume. The Dispersive Discovery model essentially takes a probabilistic range in search rates over a large potential volume of finds to come up with the more-or-less "bell-shaped" discovery curve.
Thanks for the paper, I am debating whether to pay $10 to get the original paper from the Science mag archives.
Check your email. It would be cool if we could tie EROI to the logistic.
Laherrere had commented in one paper or another that he saw two discovery cycles in the North Sea data that might have explained the double bump shape. I know the North Sea was developed much faster than most regions (short time from discovery to production) and after reading this paper I wondered if they didn't outrun their discovery data. Meaning that they ramped up production so fast, they had to stop and go do more discovery, just like the Yield per Effort description you posted.
It is called the Everclear effect. Call grain alcohol a liquid and say it was produced and voila, you solve the peak oil problem (or at least hide it for a wee bit longer.
Apparently the rise in all liquid fuels production has not kept pace with increasing demand, for the price to still be rising. Chindia is firing on high, that is unless we get a protracted recession.
Interesting to note though that crude production is still flatlining. Are we at peak/plateau or is there just a lag between high prices and the response from oil companies to extract more?
Again, the casual observer might look at the contrast between oil and all liquids and conclude that there is nothing to be concerned about yet, that peak liquids may be far into the future. But is this cause for comfort or complacency? When looking at all liquids, it is important to consider what the curve would look like if one computed net all liquid rather than just all liquids. For all we know, or at least I know, net all liquids may be in a state of decline.
In short, a barrel is not a barrel any more than a gallon of ethanol is equal to a gallon of gasoline.
Is there any out there that could do this analysis, or would this be under the category of "too hard".
Perhaps I have missed previous posts regarding my question, but why the significant discrepancy between IEA and EIA numbers?
The answer to that question would be of high importance to me.
Nobody's really sure.
For the last five months of data (Jul-Nov), the IEA has averaged 740kb/d higher. Of that, 75% (550kb/d) has been the IEA's higher values for OPEC production.
Oddly, though, the IEA figure for OPEC crude production is substantially lower than the EIA's - 1,080kb/d lower over those five months. The difference is due to the respective NGL values, which average 4,860kb/d for IEA and just 3,100kb/d for EIA.
OPEC's own production figures for the latest data point - November - are 31.45Mb/d for crude (last page), which is substantially closer to the IEA's 31.13Mb/d than to the EIA's 32.17Mb/d, and 4.61Mb/d NGLs (p.32), which again is much closer to the IEA's 4.89Mb/d than the EIA's 3.1Mb/d. OPEC's total for their liquids production - 36.06Mb/d - is almost identical to IEA's 36.02Mb/d, and substantially different from EIA's 35.35Mb/d.
It's not clear what the reason for the difference is, although differing definitions of what counts as crude vs. NGL is likely a factor, conversion ratios between tons and barrels could be another, and different data sources and estimation methods are likely to be a third. It does seem like the IEA's figures are at the moment much closer to OPEC's, though, and, since OPEC accounts for the large majority of the difference right now, it's possible that at the moment the IEA numbers should be preferred. Overall trends ought to be generally the same in each, though.
yes, thank you for asking that, I was about to ask the same thing...
The rise in total liquids may be a scam. I found this comment in the Oilwatch Monthly
"Biofuels are not included in consumption data but are included in production data. Because biofuels are not identified in the production data it is not possible to separate this flow. Given that net energy biofuel production has increased by approximately 50,000 to 100,000" http://www.peakoil.nl/wp-content/uploads/2008/02/2008_february_oilwatch_... page 6
Three is also this definition of liquids
"Liquids, all forms of liquid fuels including
conventional, heavy, and extra heavy oil,
oil shale, oil sands, natural gas liquids, lease
condensates, gas-to-liquids, coal-to-liquids
and biofuels" http://www.peakoil.nl/wp-content/uploads/2008/02/2008_february_oilwatch_... p. 1
What this effectively does is hide the problems which are taking place in the oil industry by mixing in Everclear.
My favorite is BOE. Barrel of Oil Equivalent.
http://en.wikipedia.org/wiki/Barrel_of_oil_equivalent
Cow farts work for this one.
The discovery data for BOE is particularly inscrutable. Conceivably one could put in all kinds of potential sources for discovery. Whether they pan out as useful production volumes opens up a can of worms.
This chart from Shell Oil (born optimists) shows the BOE discoveries made over time. Note the big spikes at 1970 and 1990 which do not show up in Khebab's chart (essentially updated Laherrere data):
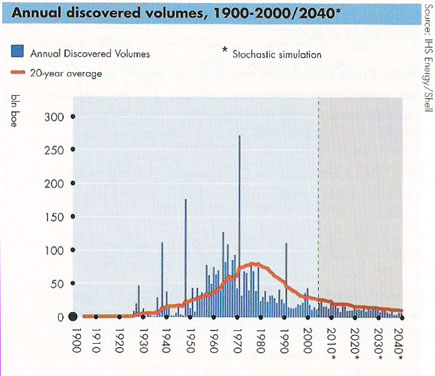
Khebab's chart, note nothing over 60 after 1970.
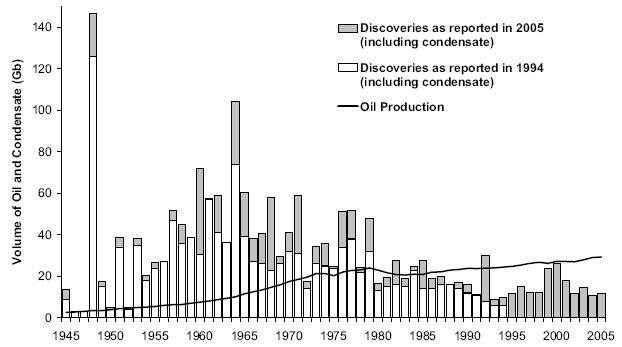
Re-cycled cooking oil is next
Seismobob,
This is where the concept of EROI becomes very important. For example the current 87mbpd output includes abt 1.5mbpd of biofuel (ethanol and biodiesel)and abt 1 mbpd of oilsands production. Be generous and give biofuels an EROI of 2, the net benefit of these is then only 750kbpd. With oilsands the scenario is even worse, some would suggest that the EROI is about 1, if so then all the tarsands production is "used" by the tarsands operation itself. Even if we generously use an EROI of 2 again we loose another 500kbpd of total liquids production.
Net effect just looking at these two items alone is we have lost 1.25mbpd of total liquids production. This doesnt even begin to take into account the declining eroi of all our major energy supplies and the assorted other damages incurred in the the production of the tarsands and biofuels.
My gut feeling would be we are well past peak energy, the next step will be continuous simplification of all human systems.
I made the same point in a slightly different way, above. However, since we are tracking all liquids here, I am not sure if many would agree with cutting unconventional sources in half due to the EROEI. Arguably, it should just be reduced by the liquids input, and should not include any natural gas or coal portions. But yes, if you are just tracking net energy, then all energy sources should be included on the input side.
In any event, we need to start seeing graphs that show us where we have been and where we are with respect to net liquids and net energy. This, however, may be extremely difficult from a data collection and analytical standpoint. We can't even agree on the EROEI for just one element, corn ethanol.
Other caveats needed to be added which say, yes, we continue to increase production of all liquids but at what cost to the environment? The net gains in all liquids are achieved at a much higher environmental costs that conventional crude which makes our current path unsustainable in terms of carbon emissions if not total liquids.
Best hopes for car free cities and not trading food for fuel.
The concept of EROEI (Energy Returned on Energy Invested) will take traction once there are TWO (or more) limiting variables. Right now people are focusing on oil/liquid fuel and are treating the other inputs (mostly nat gas in this case) as practically infinite. Indeed, if we DID have a nearly unlimited energy input into an energy harvesting technology, then low EROEI wouldn't matter at all except for ecological and non-energy input implications. But wait til our stocks of coal and natural gas begin to be viewed as 'scarce' as well - then EROEI implications will loom large, even beyond the quality argument.
YES yes yes thx, Nate.
I have been reasoning for this for a while myself and you helped me out here. We have to wait for the double whammy..
Speaking of EROI and Natural Gas, I did this calculation of Canadian NG Production using data taken from the Natural Resources Board Short Term NG Supply projection. It was a wide boundary analysis where I calculated the Giga joules per $ per year, and then used the $s per giga joule of NG data provided by the NRB. This tends to error on the high side.
The trend is clearly down. And I think it shows that we will soon be falling off the current production plateau. I think you will get your test case of TWO limiting variables quite soon.
Jon - thats very interesting.
Would you care to do a short guest post on that?
Hi Nate. This graph is part of a document I am writing for our local Energy Transition group to give supporting evidence to Laherrere's 2007 North American natural gas forecast. I would be glad to send it along. I hope to be done this week. It includes graphs from Cleveland's Louisiana NG study. And compares drilling rates in the US and Canada.
The API has the industry data that might let us do a proper EROI study, but I can't afford to buy it. Perhaps Gail could ask for the information during the next blogger conference call?
Oh, anyone who wants to learn about EROI calculations should try:
C. Hall, M. Lavine, "Efficiency of Energy Delivery Systems: 1. An Economic and Energy Analysis", Environmental Management, Vol 3, No 6, pp 493-504, 1979. (Get all 3 parts, this is the first part).
Jon
email me
nate at theoildrum dot com
hi JonF.
That chart puzzle and divide me, and as Nate appeals, I’d also like to see more of your assessments and methods.
Obviously I don’t believe that Canada is non gas producer by 2015, but your dots are telling “something” on EROEI. That’s for sure.
Does the table comprise all Canadian production or just some old tired and challenged areas ?…(I don’t know)
Hi Paal,
The data is from all Canada. It was taken from this report:
NRB Short Term NG
Look at the costs chart 3.2. The cost of finding NG in Canada has tripled in less than 10 years. That cost increase means EROI is dropping. What will happen? I don't know. The only historical study of natural gas had a steep downward line just like the one on my graph that ran right down to below 10:1 before the study stopped collecting data. It is possible that the EROI decline in Canada could be slowed down by doing less drilling. But that will also slow down production. I hope to publish more details in the near future.
double post
thanks Jon, hmm…
I agree with you that dev-costs are increasing and that EROEI is down, all “mentally/economically” according to your embedded chart.
But what you need accurate energy related expenditures (kwh, calories,hp, etc) in order to claim to do an EROEI-accounting, don't you? Obviously you will also need the accurate produced quantities of energy (nat gas) to be able to state the precise EROEI for "that year" .
I don't see any of those IN nor OUT related energies via that provided link ..
Do you follow me? (or?)
Hi Paal,
The output energy we have from the linked NEB document. You can see how they calculate the $ per Giga Joule cost in the appendix.
The only input we have is in $, so we need a Giga Joule per $ value. We get than number by dividing Canada's total energy use by GDP. It makes a rough approximation that is about 10% off from the detailed study. But it is fast, and when comparing something to itself (like one years drilling to the next) should work very well.
The details of how to do 3 different EROI techniques are listed in the cited paper. I am working on a post on this topic.
On another forum, a poster made the comment that the increase in SA production last fall was the result of SA draining tank farms. He said this was put out by Petrologistics, but was unable to provide a link. Here's his post:
To give KSA some credit they have had spare capacity in heavy sour crudes for some time. They claim 2mbpd. Recently they have lowered the price of these crudes and its documented that they are shipping more of the stuff. This is crude they could not even sell till now. So it might not be all tanker farms.
In either case it seems the new production is a mix of tanker farms and previously unsaleable crude. Neither bodes well for future KSA production.
http://www.nytimes.com/cfr/world/slot1_20071210.html?pagewanted=2
There was a discussion on TOD about 2 years ago about how much storage SA has. From memory, the estimate was about 100m barrels. This figure included storage in places outside SA such as the Caribbean.
With that kind of buffer SA can vary their production figures for quite a while. Your post refers to 'output'. It depends how you/they define production - at the well head or released to market or exported from SA into storage elsewhere.
i have to remind you that global oil guzzling amount to 85 mb/d
Bloomberg reported OPEC spare capacity was at 3 million barrels a day during the summer of 2007.
http://www.bloomberg.com/apps/news?pid=20601087&sid=av7.YNnejfag&refer=home
Chinese oil import demand might reach 6 million barrels of oil/day in 2010. They were operating their manufacturing off of a cheap coal driven power grid, inexpensive labor, and investments in secular education.
Let's suppose total fuel liquids are increasing to meet demand as crude extraction flatlines. The question is; Will other sources of liquid fuel be able to meet demand as crude production starts at some point to decline, or does that depend on the rate of decline?
Are these numbers subject to revision, or the final # ?
Thanks,
Alan
Numbers can be revised for years afterwards, I understand. However, the revisions seem to be rare after a few months. The EIA revisions are visible for ever. The IEA revisions are only visible (without payment) for 3 months.
why is there no data on total global crude exports rather that total liquids exports?
it say "This method gives a crude approximation of the export market because it assumes that all producers refine their own oil products to satisfy internal market needs. In reality not all oil producers have their own refineries to meet internal product demand. Therefore, more crude will be exported to foreign countries were it is refined into usable products. These usable products are then imported
back to the country were the crude oil came from. To derive precise export statistics one would need to combine four components for
each individual oil producing country: 1) crude oil export flows, 2) crude oil import flows, 3) total product export flows, 4) total product import flows. Statistics that show only crude oil exports or total product imports on an aggregate basis only reveal one component of the equation, and cannot be taken at face value."
But I still don't understand why the data is so hard get?
Cheers,
If you look at crude oil discovery data the situation is exactly the reverse. We have better data on estimated crude oil discovery volumes, which is continually backdated to account for reserve growth. On the other hand, the discovery data for total liquids does not really exist except for a chart by Shell Oil describing "Barrel of Oils Equivalent" discoveries (see upthread).
I agree that categorizing the data would help immensely in understanding what is happening.
Re non crude liquids It has been previously suggested on TOD that some of the increase in NGL is probably from blowing down gas caps of dying fields. If so there is no way that NGL can offset crude declines for more than a few months.