North American Natural Gas Production and EROI Decline
Posted by nate hagens on February 27, 2008 - 9:40pm
This is a guest post by TOD reader Jon Friese. Jon is a software engineer living in Minneapolis and a volunteer with the Twin Cities Energy Transition working group, seeking a path to a low carbon future. Under his own initiative Jon tracked down literature on EROI methodology, contacted the Canadian Government and an energy consulting company for data, and came up with the following analysis on declining energy return on Canadian Gas. This draft analysis is provocative (backing into an EROI estimate using $/GJ suggesting possible energy break even for natural gas within a decade). However, in addition to the new info, I was inspired that a smart, engaged citizen chose to volunteer his time on the pressing issue of fossil fuel decline, and then shared it with others in the TOD forum for feedback. Thanks for your initiative here Jon.) (Editors Note: Jon is working on an update to this analysis incorporating feedback from the TOD community -please treat the information in this post as a work in progress.)
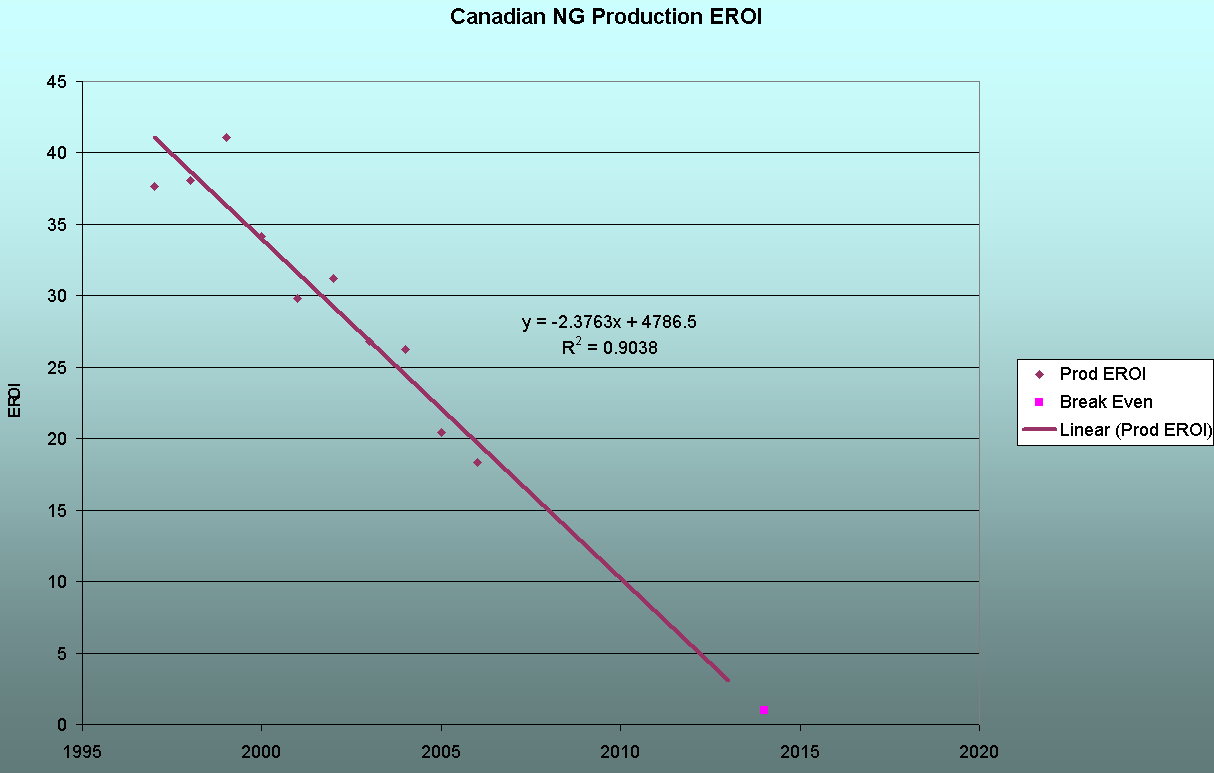
Figure 1 Canadian Natural Gas Energy Return on Investment, actual + trend line (Click to enlarge)
EROI at Theoildrum.com
Biophysical analysis is important in a world of finite resources. We write often about net energy and EROI on this site, as it gives insights that might not be immediately seen by conventional dollar analysis. In the coming weeks, Charles Hall (referenced in Johns report below) will be running a series of EROI articles on TOD, starting with "Why EROI is Important". Here are some selected historical posts on the topic:
At $100 Oil, What Can the Scientist Say to the Investor?
The Energy Return on Time
Peak Oil - Why Smart Folks Disagree - Part II
Ten Fundamental Truths about Net Energy
The North American Red Queen - Our Natural Gas Treadmill
Energy From Wind - A Discussion of the EROI Research
A Net Energy Parable - Why is EROI Important?
Natural Gas and Complacency
And the following is Johns analysis on:
North American Natural Gas Production & EROI
Abstract
Creating an Energy Transition Plan away from natural gas requires at least a rough forecast of future production. Two very different forecasts for North American natural gas exist. The official “consensus” view published by Natural Resources Canada [NRC 2006] argues that 2,200 Tcf (trillion cubic feet) remain and that less than 50% of the total natural gas has been produced. Jean Laherrere has posted a forecast which shows only 600 Tcf (trillion cubic feet) remaining with about 70% already produced of the total supply of 1900 Tcf.
Energy Return on energy Invested (EROI) was explored as a method for choosing between the two forecasts. Examining a historical study of Louisiana natural gas production shows that EROI declined rapidly post peak production and that peak production occurred at about 70% of URR.
The EROI of Canadian natural gas production was found to be falling quickly. If current drilling rates are maintained, Canada could see energy break even occur as soon as 2014.
The EROI analysis was extended to the US by comparing data on Yield-per-foot drilled and Yield-per-well drilled between the two countries. It was found that the US is rapidly approaching the same low EROI as Canada.
Taken together this evidence supports Laherrere’s position that North America is past peak production and that as little as 30% of our natural gas endowment remains to be produced.
Two Forecasts
Coping with global warming or peak oil requires a reliable forecast for natural gas. Natural gas is a clean burning substitute for coal and oil. Natural gas is essential to ethanol and tar sands production. Much like world oil supply, the official forecast is that natural gas supply will be abundant for nearly a century. This view suffered a serious setback in 2001 when the US production peaked and again in 2003 when Canadian production peaked. The ASPO has put forward a more conservative forecast. These two forecasts are examined in more detail below.
The Official View
The official “consensus” forecast (an average of several government agencies) is that there will be an abundant supply of domestic natural gas at relatively low prices for many years to come. Here is a good summery of the official position:
“The total remaining US natural gas resource base, including proved reserves is 1,620Tcf. At 2004 levels of domestic production, the US has about an 86-year supply of natural gas.” [NRC 2006, pg 23]
The reason for this optimistic forecast is clear when looking at the reserves and resources map below. 100+ years of extraction have not even consumed half of the natural gas that is expected to be produced.

Figure 2 Official "Consensus" Resources and Reserves Forecast [NRC 2006, pg 22] (Click to enlarge)
Yet this position does not explain why natural gas production in both Canada and the US has peaked. Nor does it explain why large scale drilling campaigns have tripled prices while not bringing further production on line. If less than half the natural gas has been produced, then why cannot production rise?
The Alternate View
ASPO member Jean Laherrere is an internationally renowned expert in oil and gas exploration. He was in charge of Total Canada’s exploration from 1966 to 1971. He has recently published a forecast for North American Natural Gas production [Laherrere 2007]. Here is his summary graph:
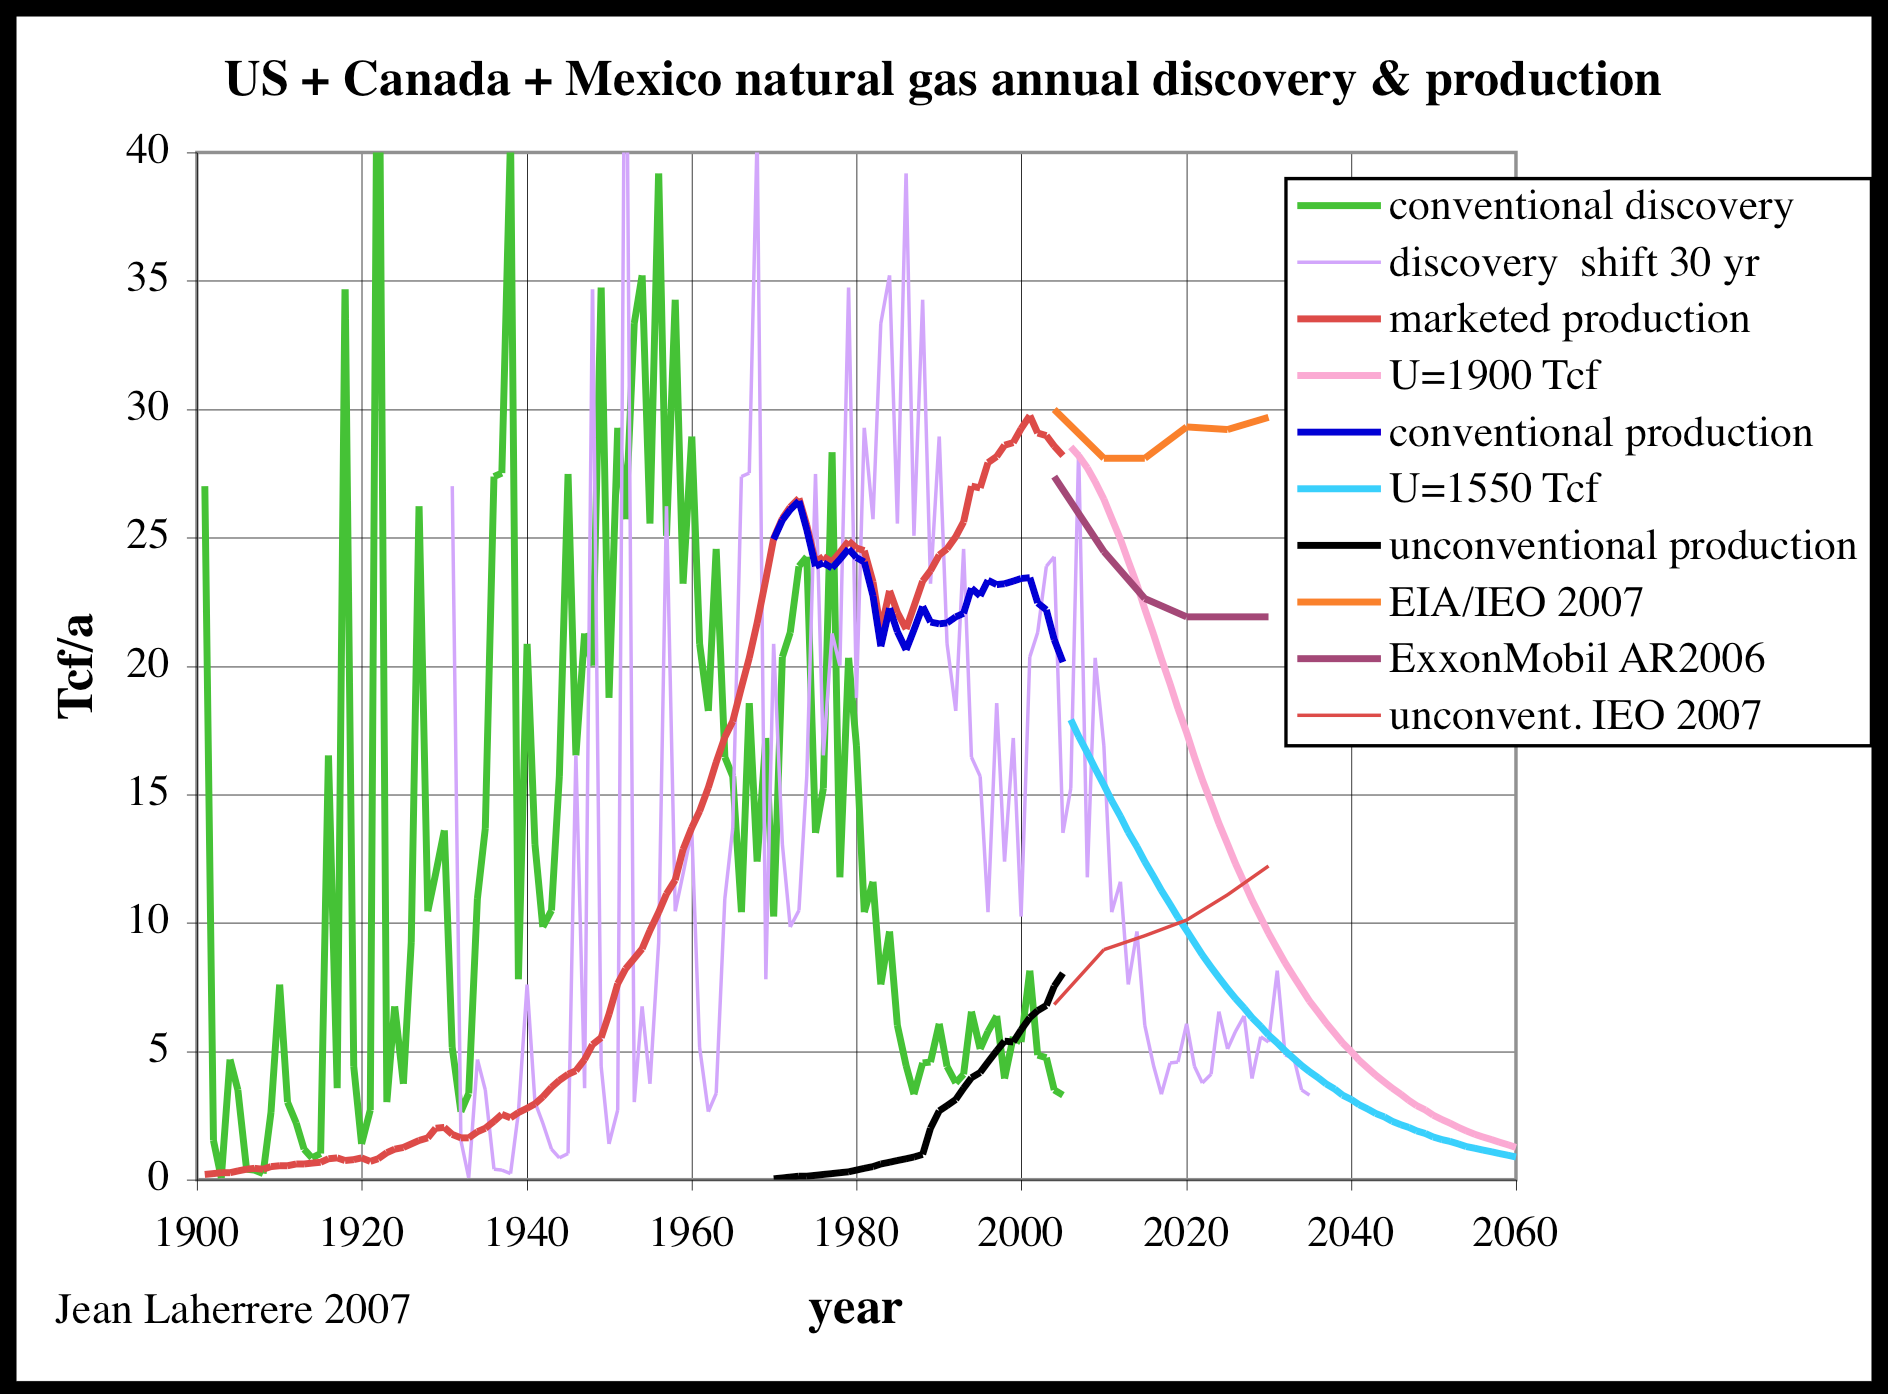
Figure 3 Laherrere's alternate forecast (Click to enlarge)
The first line to look for is the pink line that describes overall natural gas production (U=1900Tcf) and the second line to look for is the pale blue line that describes conventional natural gas production (U=1550). He has no difficulty explaining why production cannot be raised. It cannot be raised because North America has already produced 70% of the total natural gas that will ever be produced. Production has peaked and will now decline during the final 30%. In his forecast there will not be 86 years of production at current rates. Instead, in less than 50 years production will be a tiny fraction of current levels.
One of the many ways he supports his forecast is by plotting backdated discovery data against the number of exploratory wells to form what he calls a “creaming curve”.
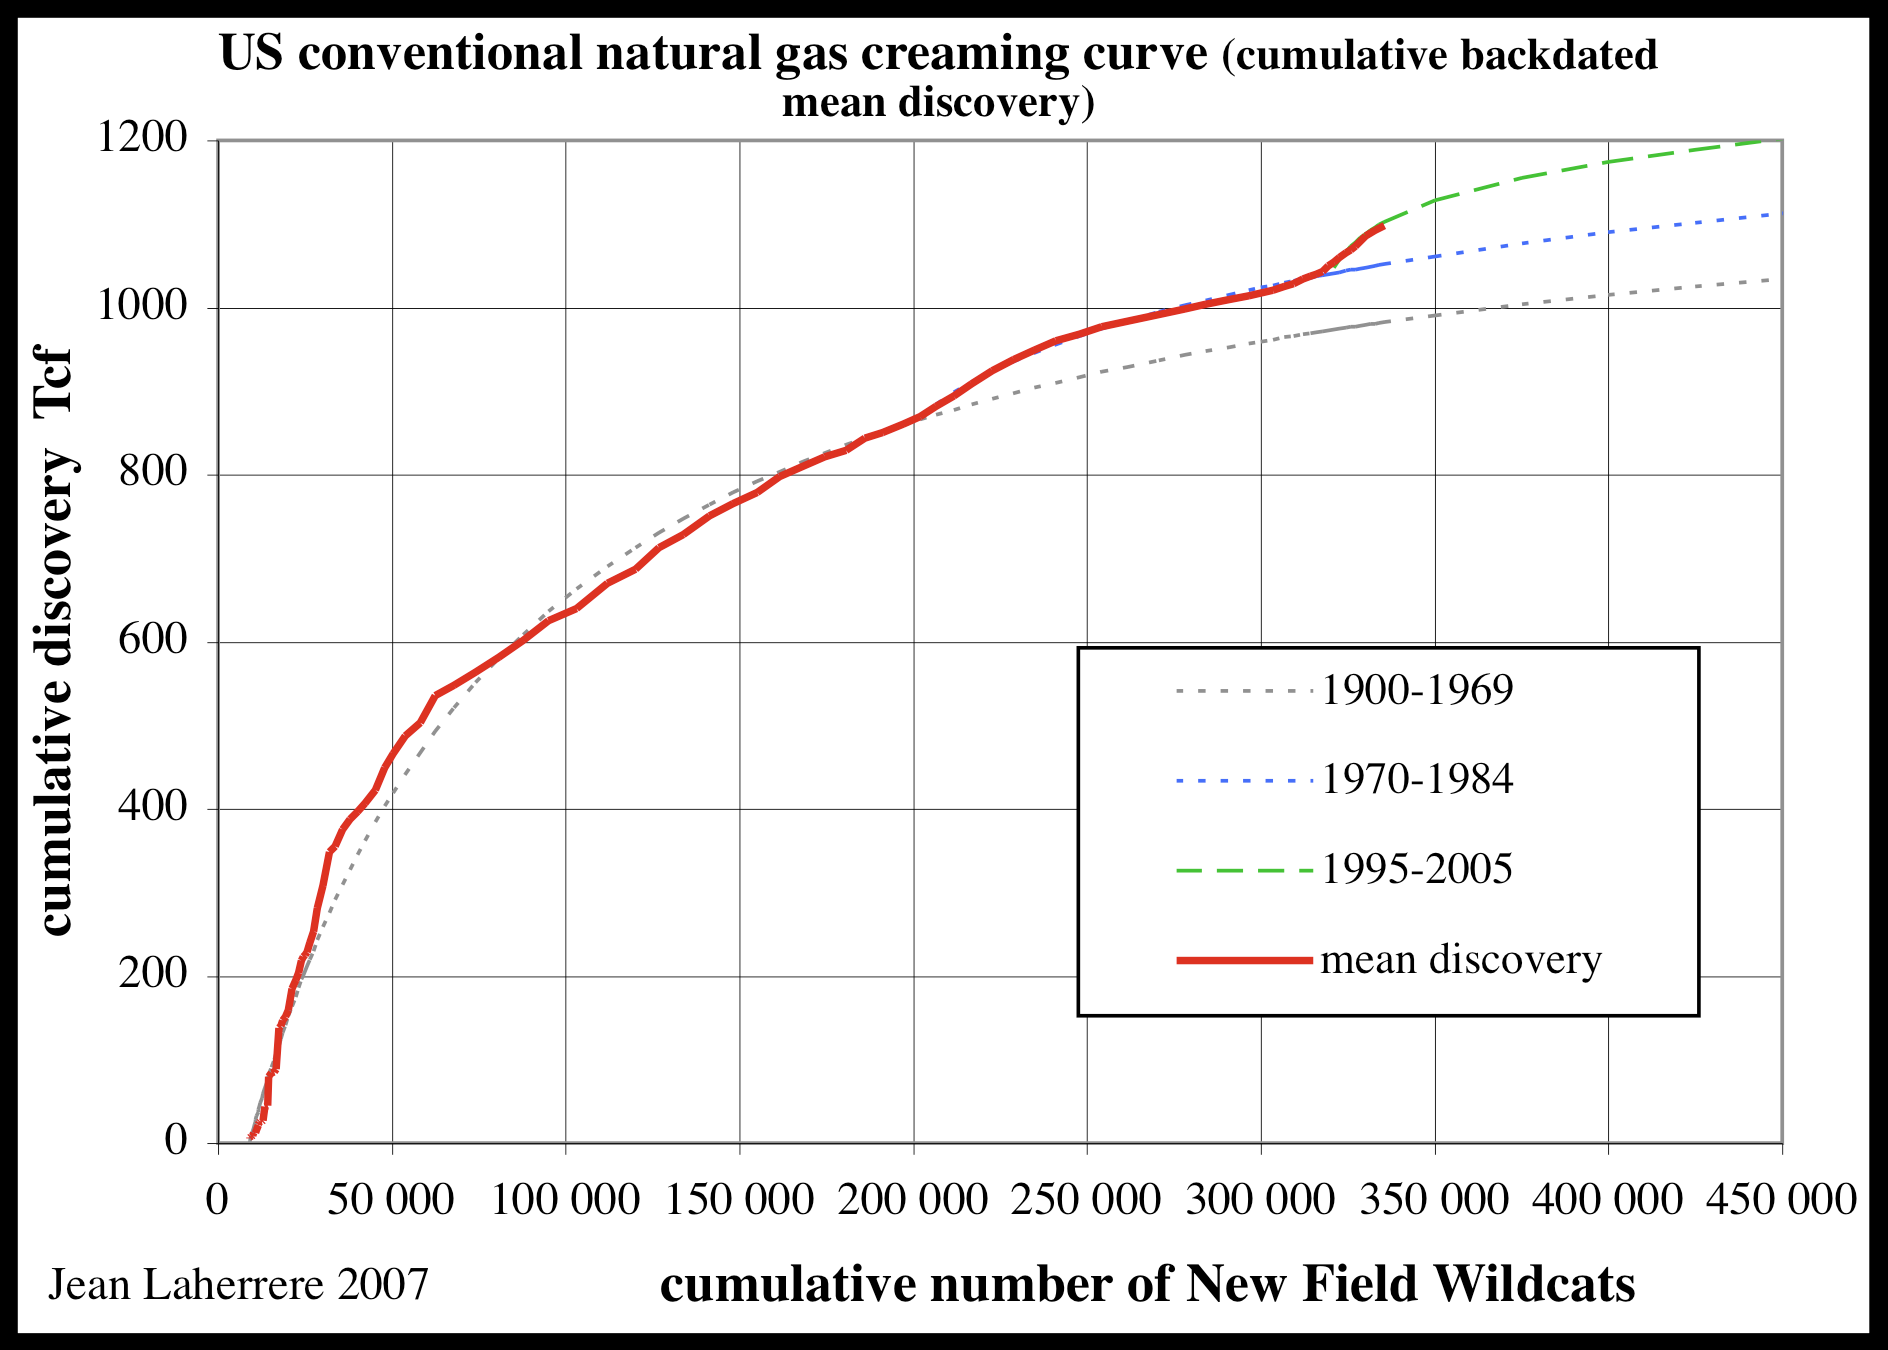
Figure 4 Creaming curve evidence (Source Jean LaHerrere) (Click to enlarge)
In a new region the first few exploration wells discovery a large amount of natural gas resulting in a steep upward curve. As most of the discoveries are made, each new exploration well discovers less gas, bending the curve downward until it points to the Ultimate along the right hand side. Looking at this creaming curve for the US it is hard to imagine that the curve could accommodate another 800 Tcf of new discovery that the official forecast predicts. A huge number of exploratory wells have already been drilled. The curve is already close to flat.
Economic Reserves and Energy Return
How is it possible that two forecasts made with similar data could reach such a different result? One reason hinges on the definition of “Economic Reserve”. There are vast quantities of non-conventional natural gas. But it is expensive to produce. At what drilling and operating cost do you draw the line between reserves that can be produced at a profit and non economic resources that never will be produced? Opinions can and do differ and this leads to very different forecasts. However, fuel sources have a clear boundary between the economic and non economic reserves. A fuel source must be produced with a positive Energy Return on energy Invested (EROI). An economy cannot spend more energy drilling for natural gas than the economy gets from the natural gas itself. At energy break even, fuel production will stop (unless it is subsidized by a lower quality fuel)
Calculating the EROI of current natural gas production would give another line of evidence. If EROI is steady or rising than the official forecast is likely correct and natural gas will be abundant. If the EROI is falling then we can assume that much of the official resources will never be economical and that production will continue to fall.
Louisiana Natural Gas
Cutler Cleveland and Robert Costanza did an EROI study of natural gas production in Louisiana [reported in Hall 1992]. That study calculated the EROI from early production, through peak, and into decline.
It is useful to stop and examine this historical production cycle and try to discern some patterns.

Figure 5 Louisiana Natural Gas production in Quads per year(Click to enlarge)
Cleveland and Costanza calculated the Energy Return on energy Invested (EROI) over the whole production cycle. The year that production fell off “plateau” was 1972 with a cumulative extraction of 150 Quads. 150 Quads corresponds to the first downward EROI point after the sharp rise. The next point over actually has a slight increase in EROI.
[Note: One can imagine an intensive drilling program to try to keep production on the plateau. When drilling finally slowed and yielded to the inevitable, EROI had a small uptick but production dropped. I cannot prove this conjecture because I do not have the well drilling data. But we will see similar bounces later in the current production data.]
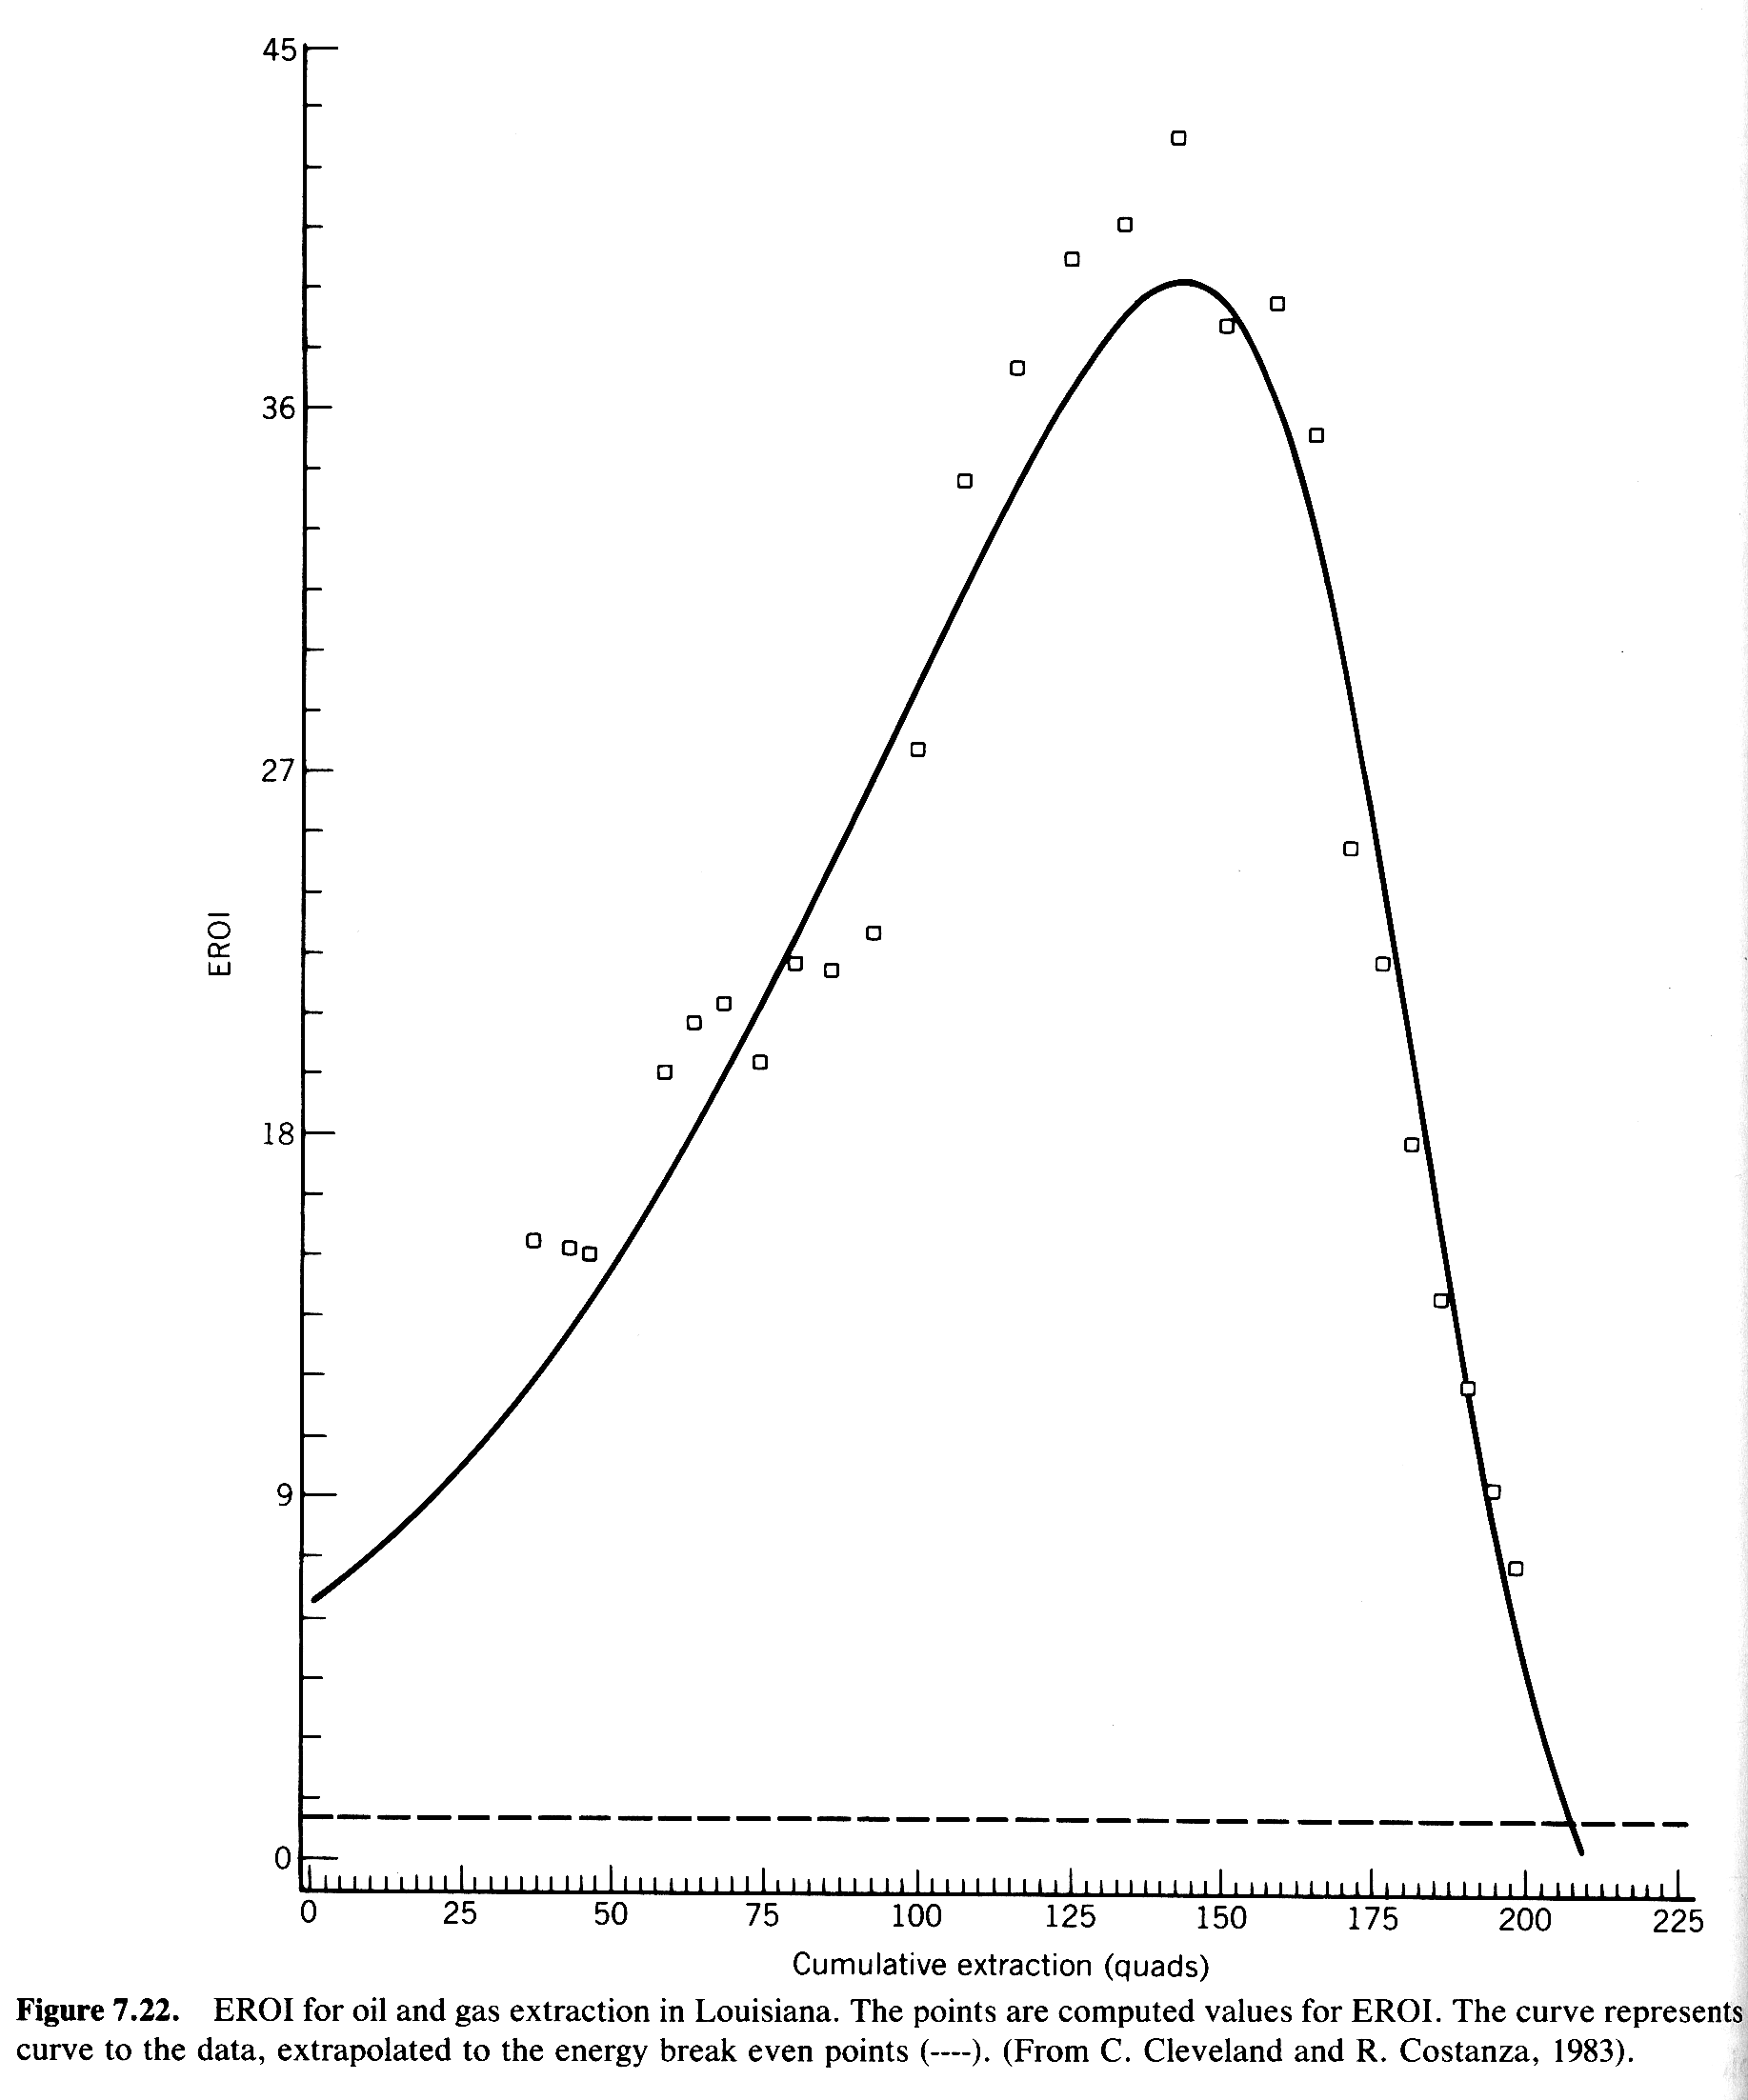
Figure 6 Louisiana Natural Gas EROI(Click to enlarge)
Please note the following: First is that the maximum EROI is in the 40 to 1 range (which will be important later).
Second is that the EROI decline rate is quite steep and it is very linear. The EROI plunges from maximum to minimum in only 25% of the quads extracted.
Third is that energy break even (where EROI = 1:1) happens far before a 300 quad URR. It is normally assumed that peak happens at 50% URR, but in this case, the energy return would end up skewing the graph so that peak appeared at 150/210 = 70%. (Sound familiar?)
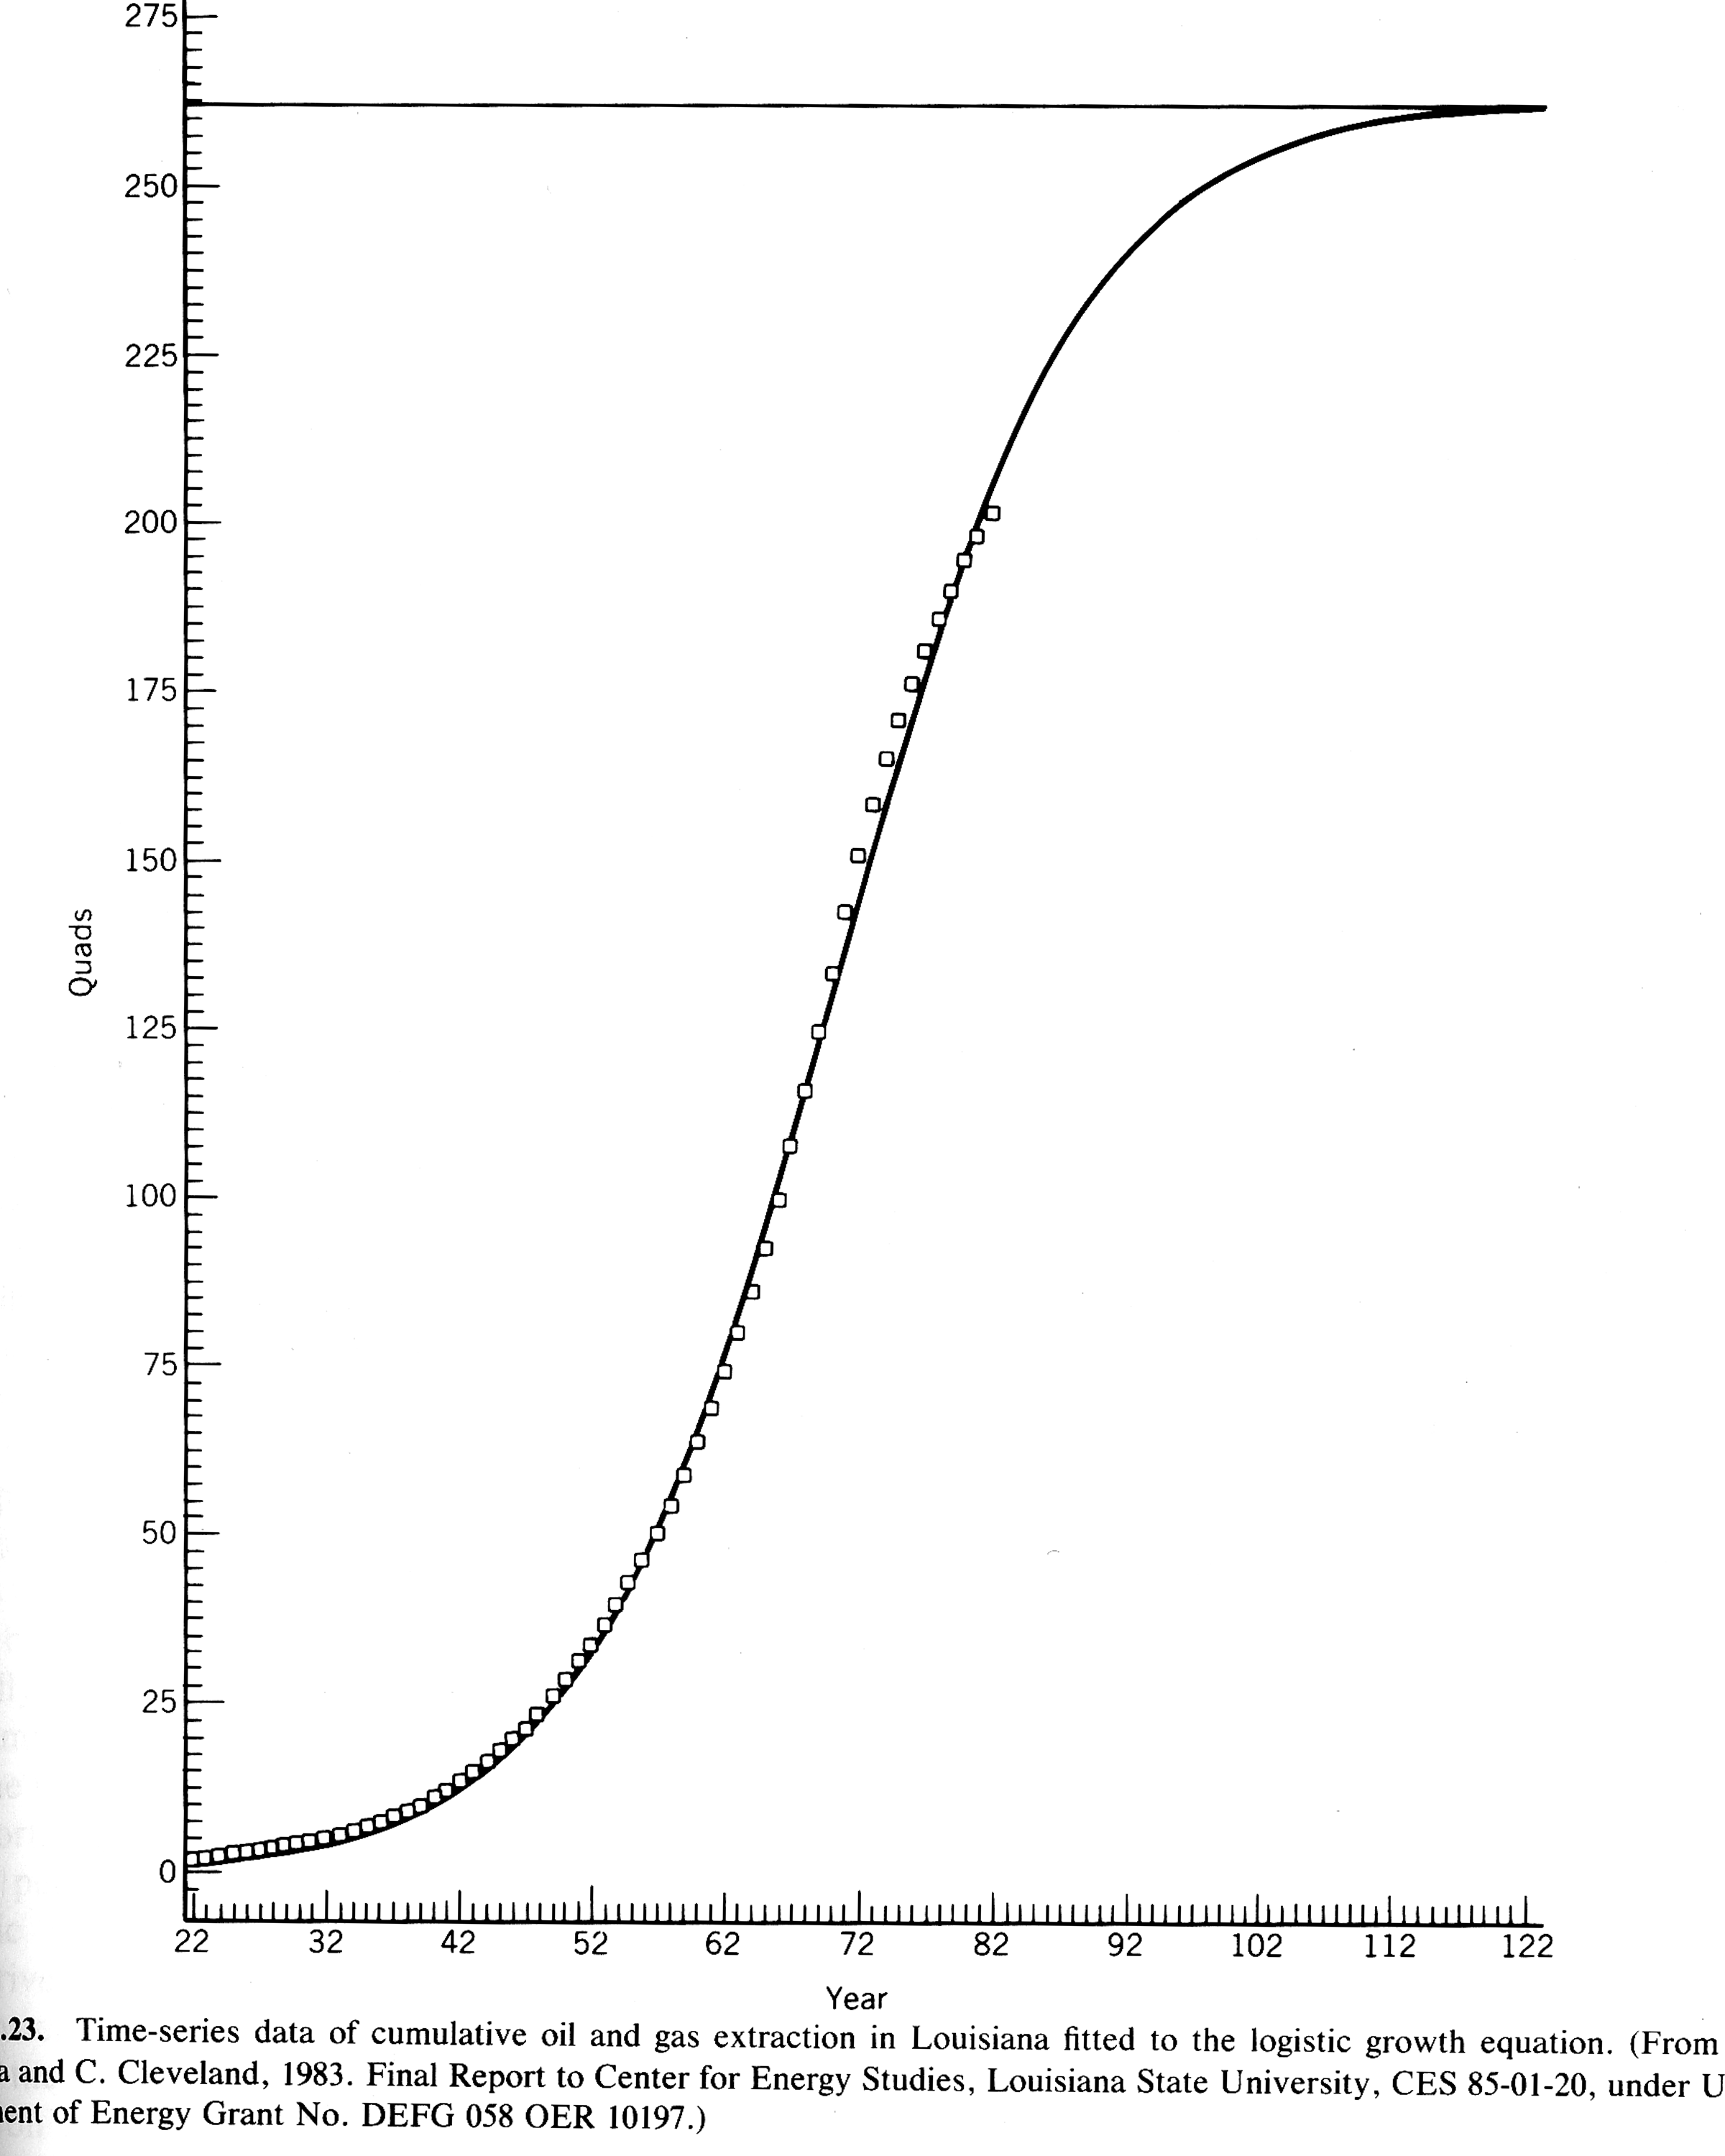
Figure 7 Cumulative quads versus year(Click to enlarge)
This final graph plots cumulative quads against years. It follows the classic Logistic shape. The logistic is pointing to a URR of ~260, but the EROI graph is saying there will not be a positive energy return past ~210. This graph can be used to convert from years to quads for matching up data points on the two prior graphs.
Summarizing this historical example:
1. EROI peaked around 40:1
2. Production peaks at about 70% of total extraction.
3. EROI declines sharply past peak.
4. The steep EROI decline indicates extraction is in the final 25%.
Canadian Natural Gas EROI
There are several techniques for calculating Energy Return on energy Invested when you only have cost data in dollars. Charles Hall describes one technique [Hall 1979] where the energy content of each dollar is calculated in the following manner:
Energy content per $ = National Energy Use / GDP.
The EROI of natural gas production can then be calculated by
EROI = Energy output of total NG / ($ cost of NG production * Energy associated with spending of a $)
The Canadian National Energy Board (NEB) publishes the “Short-term Canadian Natural Gas Deliverability” report. In the 2007-2009 edition they provide data on how many Canadian $ are required to produce 1 Giga Joule of natural gas. [NEB 2007] The Canadian NEB calculated $/Gj in a special way that only includes new gas produced. What they did was use decline models of each type of well in each region. And then they totaled up the number of new wells in a year of each type. They used the decline model to predict exactly how much gas would be produced from those new wells (long term).
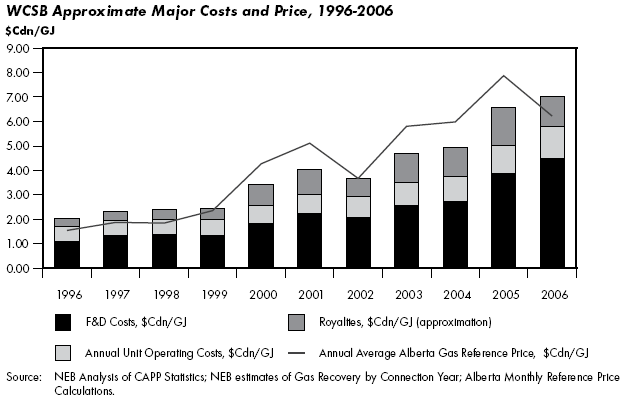
Figure 8 National Energy Board cost per Gigajoule (Click to enlarge)
There are several features of this graph worth noticing. The first is that drilling costs have overshot prices, despite a 3x increase in price. The second is that Finding and Discovery (F&D) costs show the largest increase. It is getting harder and harder to find natural gas. These are both certain signs of falling EROI. Royalties are not counted in the following EROI calculations.
Using the NEB data simplifies our EROI formula:
EROI = 1 Gj / ($ drilling cost * Gj/dollar)
As the NRB data provides the “$ drilling cost” term, the next step is to calculate the energy value of each Canadian $. That value is estimated by taking the Canadian GDP for each year and dividing by the total energy used by Canada in that year. The GDP data was taken from the Canadian Government web site Statistics Canada. The data for GDP Expenditures in Current $ was selected (mostly because I know of no reason to prefer one data series to another for this type of calculation). [Can Stats 2007] The total energy use data was taken from the 2007 BP Statistical Review of World Energy [BP 2007]. The review provides a “Primary Energy per annum” that sums all energy sources. The resulting sum is in Mtoe (Millions of tons of oil equivalent).
Here are the values from 2006 to help understand the calculation:
GDP = $1.44e12
Primary Energy = 322e6 Mtoe
Gj/$ = 9.4e-3
EROI = 1 Gj/(5.79*9.4e-3) = 18
EROI Results
Figure 9 Canadian Natural Gas EROI 1996-2006(Click to enlarge)
The results are quite dramatic. EROI is dropping very quickly. If high drilling rates are maintained, costs will rocket upwards and EROI could hit break even by 2014. If drilling rates fall, then production will fall. Either way Canadian production will come off plateau and go into decline.
The Louisiana historical example offers some guidance. The EROI peaks are roughly the same 40:1. The decline in EROI is rapid and linear. It is safe to conclude that Canadian production is in the final 25%. This lends support to Laherrere’s forecast.
Extending the Analysis to the US
The same analysis cannot be done for the US because the EIA does not provide an estimate of the underlying decline rate or the $ per GJ production cost. It is possible to make a rough approximation but this part of the post is more speculative. (Editors note - I am attempting to get some of this type of data form the API (American Petroleum Institute) - I am told it is quite expensive but am still trying - such data may be able to replicate and advance Johns Canadian analysis)
Production per Well Foot Drilled
Most of the production cost is drilling related and there are drilling statistics for both countries [EIA Foot][Capp 2007]. Figure 10 shows the yearly production divided by the number of feet drilled that year. This is only a rough approximation of Yield per Effort because production is mostly from prior years drilling. A clear trend down is visible in both the US and Canada. More and more drilling is yielding less and less production. This is a sure sign of dropping EROI.
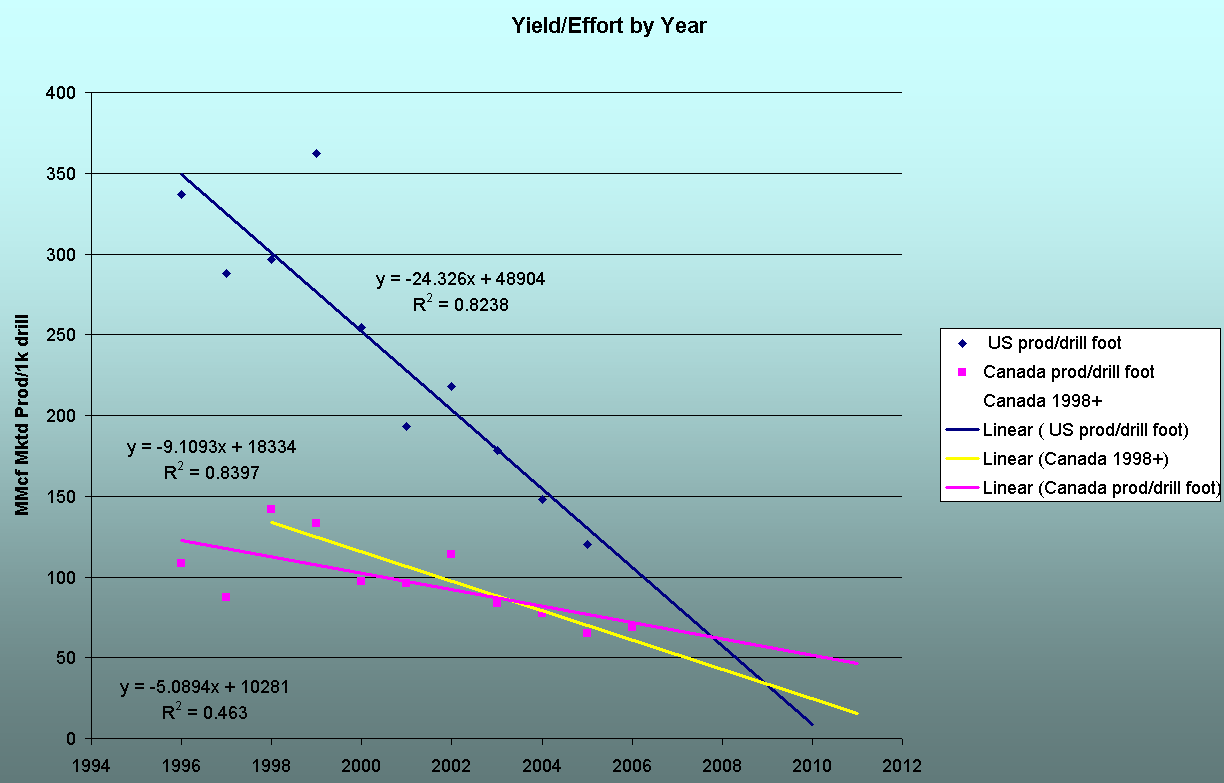
Figure 10 US & Canadian Production per well foot drilled (Click to enlarge)
Canadian Yield-per-foot drilled is lower than the US. However in the last few years the US has fallen into the Canadian area and the slope is very steep. That steep slope will soon cross the Canadian trend lines. It is safe to assume the US EROI values are falling as fast or close behind the Canadian EROI. There are two regressions for the Canadian data. The yellow regression discards the first two years as outliers to get a better fit. The yellow regression shows a steeper slope that would cross the zero point at approximately the same location as the Canadian EROI graph hits break even.
Production per Well Drilled
Another way to look at Yield per Effort is to examine Yield-per-well instead of Yield-per-foot drilled [EIA Well][Capp 2007]. In Figure 11 Canadian production is divided by the number of wells drilled. The trend is downward as expected, but the fit is poor. The trend line begins to approach zero production per well around 2016.
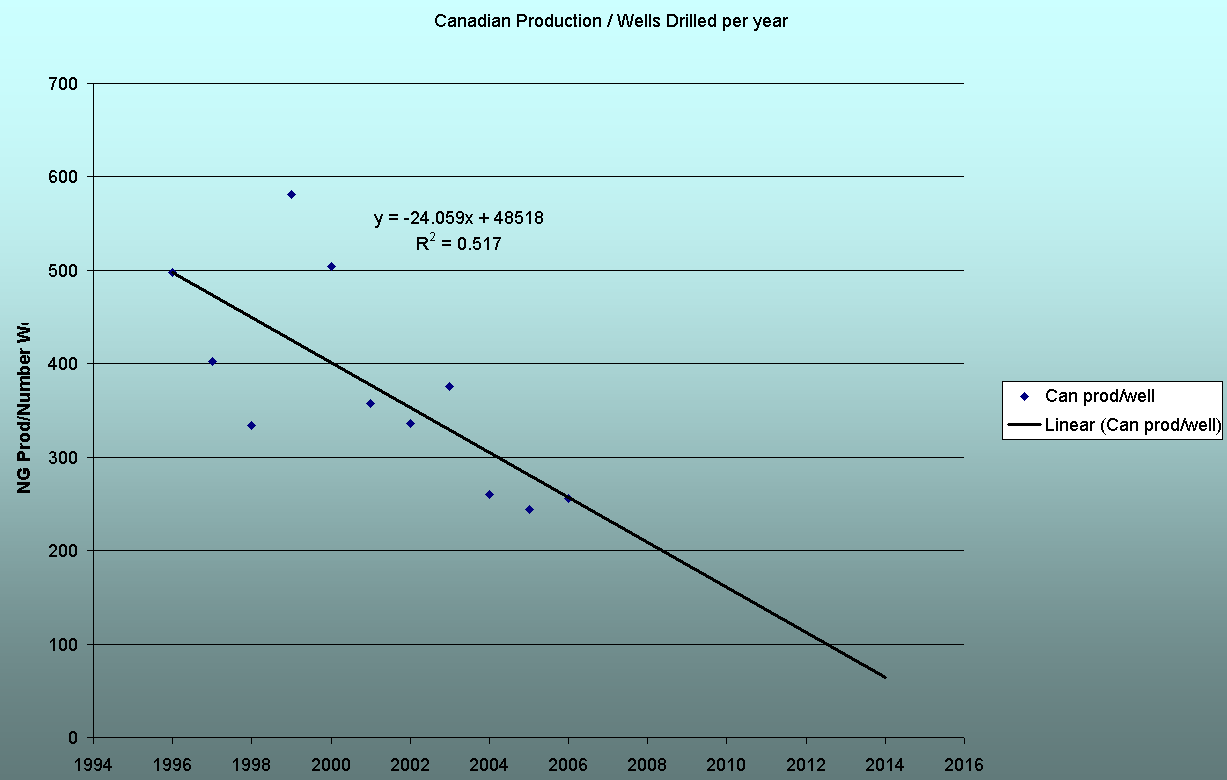
Figure 11 Canadian Production per well (Click to enlarge)
Figure 12 shows that US production per well begins much higher (which is why the data is plotted separately). The trend is downward and at a steeper rate than the Canadian trend. The US data in 2006 is just entering the region where the Canadian production was in the late 1990’s.
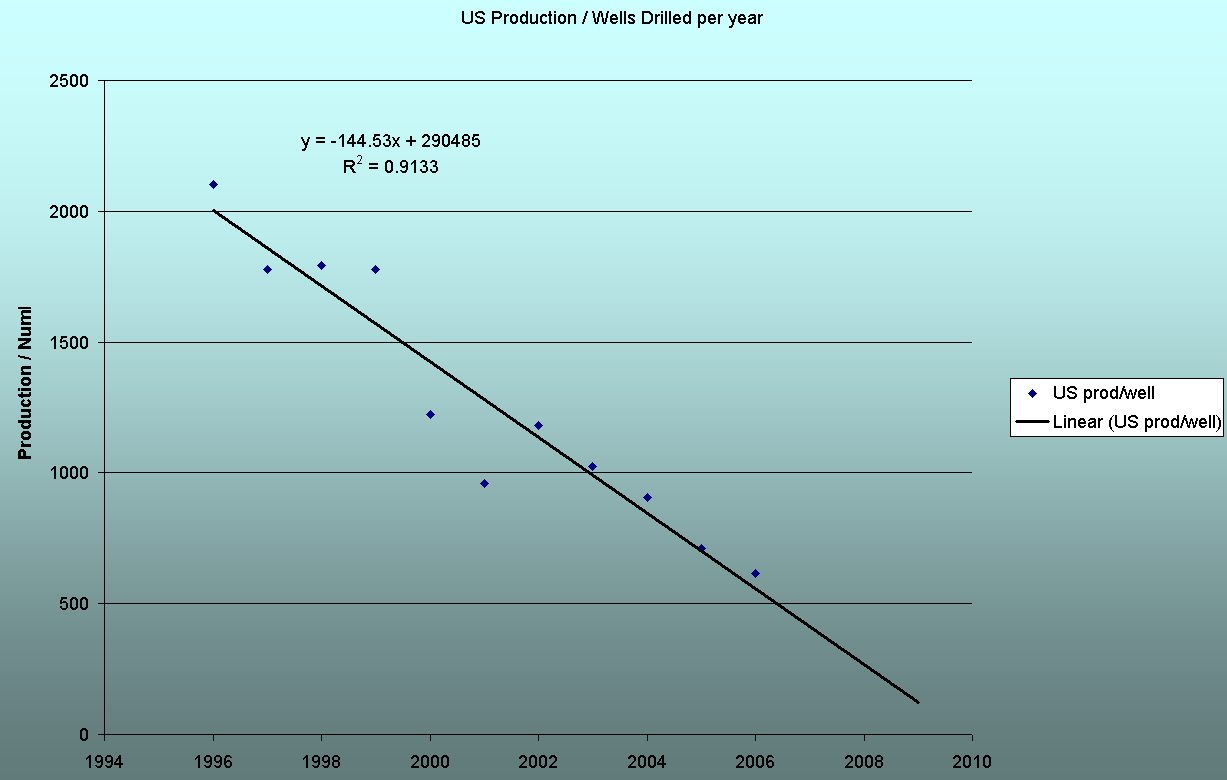
Figure 12 US Production per well(Click to enlarge)
US Notes
Overall the US seems to be entering the same steep EROI decline Canada is facing. The US seems to be slightly behind Canada in EROI decline, however the US has a huge number of producing wells and this may be skewing the productivity results. We do know that the US peaked prior to Canada.
Conclusion
The natural gas industry has clearly been mounting a heroic effort to keep natural gas production on plateau in North America. This effort has raised costs dramatically. The EROI of Canadian production shows a rapid decline. Drilling statistics suggest a similar EROI decline is happening in the US. The falling EROI makes it impossible for natural gas production to maintain both low costs and current levels of production. It is clear that most of the reserves in the official forecast will never be developed. Jean Laherrere’s predictions are more likely to be correct. And if EROI continues to fall at the current rapid rate, he will be remembered as an optimist.
References
[NRC 2006] “Canadian Natural Gas; Review of 2004 & Outlook to 2020”, Natural Resources Canada, January 2006. pg 22.
http://www2.nrcan.gc.ca/es/erb/CMFiles/CANADA_GAS_REVIEW_&_OUTLOOK_ENGLI...
[NEB] Link to Appendix of National Energy Board Calculations and Methodology used in this analysis
http://www.neb.gc.ca/clf-nsi/rnrgynfmtn/nrgyrprt/ntrlgs/ntrlgsdlvrblty20... (pdf)
[Laherrere 2007] “North American natural gas discovery & production”, Jean Laherrere, August 2007, ASPO France, pg 15.
http://aspofrance.viabloga.com/files/JL_NAm-NG07.pdf
[Hall 1979] C. Hall, M. Lavine, "Efficiency of Energy Delivery Systems:1. An Economic and Energy Analysis", Environmental Management, vol 3, no 6, pp 493-504, 1979 (First part of a 3 part article).
[Hall 1992] “Energy & Resource Quality: The ecology of the economic process”, C. Hall, C Cleveland, R. Kaufmann, 1992, University Press of Colorado, pg 184-188.
[NEB 2007] “Short-term Canadian Natural Gas Deliverability 2007-2009”, National Energy Board, 2007, pg 8-9.
http://www.neb.gc.ca/clf-nsi/rnrgynfmtn/nrgyrprt/ntrlgs/ntrlgsdlvrblty20...
[Can Stat 2007] Statistics Canada
http://cansim2.statcan.ca/cgi-win/cnsmcgi.exe?Lang=E&C2Fmt=HTML2D&CIITpl...
[BP 2007] BP Statistical Review of World Energy 2007
http://www.bp.com/liveassets/bp_internet/globalbp/globalbp_uk_english/re...
[EIA Feet] Energy Information Agency. Feet drilled in natural gas wells.
http://tonto.eia.doe.gov/dnav/ng/ng_enr_wellfoot_s1_a.htm
[EIA Wells] Energy Information Agency. Natural gas wells drilled.
http://tonto.eia.doe.gov/dnav/ng/ng_enr_wellend_s1_m.htm
[Capp 2007] Canadian Association of Petroleum Producers. “Wells and Meters Drilled in Canada 1981-2006”
http://www.capp.ca/default.asp?V_DOC_ID=1072&SectionID=1&SortString=TableNo
John Friese can be reached at grandpa.trout@gmail.com
Contact
- Content: editors at theoildrum dot com
- Tech support: support at theoildrum dot com
License

This work is licensed under a Creative Commons Attribution-Share Alike 3.0 United States License.
I figure that the price of natural gas will double in the next 5-6 years. At that time biomass gasification and synthesis of methane will be affordable and profitable. We can then get to a more CO2 neutral form of hydrocarbon that we can put in the pipelines.
Ten fundamentals of net energy. Required reading for newbies and veterans and all in between
http://www.eoearth.org/article/Ten_fundamental_principles_of_net_energy
Thats one of the articles I linked to at the top of this post. But you are right - lots of work done on net energy analysis in 70s and early 80s when the front energy burner seemed hot. (Odum, Berndt, Hall, Cleveland, Costanza, Herendeen, etc.) This work transitioned more broadly into Life Cycle Analysis, which isn't necessarily about energy, and now 25 years later far fewer papers on biophysical principles / net energy analysis are being published, though Cutler and Charlie and some others are still banging the drum. It seems the conventional economists have won the battle, but will lose the war. 70s energy crisis was dress rehearsal for what we are now facing.
Here is a piece on Encyclopedia of Earth that is a bit more academic but very detailed and informative on net energy analysis.
I think EROEI will match the ELM.
*Nate, you got the entire article in the preview box, so it shows on the frontpage.
And... wow. The US halved its production per well in a scant 4 years. This really, really isn't good. Is LNG the only thing between gas-heated furnace homeowners and panic?
What currently constitutes "unconventional" NG?
And from a physical/geological standpoint, what's the point at which the production ROI hits 1 while the reserves still remain at 70% depleted? Does that mean that the existing wells have been plugged by sediment/water? I can understand this much easier in an oil or water aquifer, but a contiguous body of a light, nonviscous fluid/gas?
Firstly I would like to say a very big thank you to Nat, for it is on the shoulders of such giants as nat and Colin and the contributors to sites such as the Oildrum that I stand.
Forget LNG, I was at the Energy Institute's International Petroleum Week in London last week. I asked Dr Fereidun Fesharaki the last question on the last day regarding natural gas production from north and south pars fields.
His answer shocked the audience. He basicly said do not expect much higher production from those field and that LNG tankers expecting to move this extra LNG would be redundant.
If you add in the infrastructure issues with Russian gas you can forget about LNG coming to the rescue.
"However, there's no time to be lost, because the forecasts predict an energy crisis. Capital assets deterioration is now 60% in the oil extraction sector, 80% in the oil refine sector, 55% in the power industry. The coal industry is in permanent crisis. Gas companies have to reduce gas recovery because the most profitable fields are running low. Your readers are well aware of the fact that the pipeline transport, too, has enough problems: One fourth of the total length of trunk pipelines has been operating for over 30 years, yet another one third has been operating for over 20 years. It is widely understood that FPC urgently needs large (up to $30 billion a year) investments." head of the specialized Committee for energy, transport and communications of the State Duma Vladimir S. Katrenko
Read Harold York's Limited Availability for 'Cheap' LNG to the U.S. for more info on why NA is effectively stranded for NG. For one thing the heat content of much foreign NG is wrong for our system. Also check out Dave Cohen's excellent TOD piece Empire On the Edge--Betting On LNG, which references York's paper. I've read all the articles on NG I can find, shortages for NA are a much more tangible threat than oil, which remains largely a question mark due to the lack of data.
Jeez - I had never read that piece and was unaware of the heat content issue:
It seems a good deal of the natural gas from overseas is higher than that range (anything above the yellow band). How hard is that infrastructure to change?
OK, Amazing.
It's rare to hear about too *much* energy here :-)
I always assumed that the warmed LNG had added nitrogen or CO2 or something inert added to it.
OK -- stabilization
Coal availability for the rest of the world may be in crisis but the facts - for US domestic coal - do not bear that out
Arch Coal for example was selling Low Sulfur Steam Coal for $10.71 per tonne in Q4-07 and was able to get $10.82 in 2006. (Source Arch Coal Annual Report 2007
http://news.archcoal.com/ReleaseDetail.cfm?ReleaseID=291232 )
That is 1000 kg, or 2200 lbs and will put 8800 lbs of Carbon Dioxide in the Air.
To put the numbers in perspective US Taxpayer (the few percent that still pay income taxes to the Federal Government) expenditures to Victims of Hurricane Katrina are $200 billion or higher. For those who do not know - Katrina was a storm with a lot of rain and wind that caused several 100 ft of a mud dike to break and caused flooding that resulted in mold in poorly ventilated houses built out of organic matter (wood). Also for comparison, 2 category 5 hurricanes hit the Yucatan peninsula last year but those residents were unable to tap the largess of the US Treasury. Hence their rebuilding expenses were a couple of million - if that - Hurricane Katrina expenses continue (rebuilding, clean-up, housing, food, spending money for Victims).
http://www.sourcewatch.org/index.php?title=U.S._budget_deficit
"What currently constitutes "unconventional" NG?"
From what I understand, unconventional gas, for the most part, now, refers to gas from shale deposits. I don't think we have substantial XTG (agricultural methane, biomass etc...) resources available at the moment for electricity generation. Most of those feedstocks are now going to liquid fuels -- ethanol and biodiesel.
Wow. I mean, WOW.
What do the words "deep shit" mean?
Hmmm. And whatever happened to all this talk of NG as the bridge fuel supply a few years ago? Poof! Gone.
We need to become very serious about real renewables -- solar, wind, OTEC, and non-food biofuels. Yesterday.
Yester-couple-of-decades-ago, you mean.
Mr. Hans Blix's above reaction to the situation, while appropriate, was if anything an understatement.
*Whistles while walking past graveyard.*
The problem is one of technology. Canada has reserves of unconventional natural gas equal to 3 times the World's reserves of conventional NG. The technology to exploit them is in it's infancy. Soon methane hydrates will be exploited. Race against time?
"Race against time?"
I think so. Maybe even running just to stand still. But that's better than running to fall behind.
We are already behind. We failed to respond when we had clear opportunity and we threw Jimmy Carter's call to energy conservation to the wolves of infinite consumption. When we learn to accept that we will have learned an important lesson. And after we've learned that lesson, we may finally begin to think about applying triage to our global civilization in an effort to save some of it. Because quite frankly, we are not going to save all of it.
All the oil and gas guys want to do is find and sell more oil and gas. But that's a path to all sorts of trouble. I think we need a serious shift to renewables. As I said before -- Yesterday.
That's Business As Usual (BAU). BAU is simply bad. The only rational road that I can see out of this cul-de-sac is electrical. Conversion of transportation and everything else to an electrical base coupled with creation of electricity from whatever sources turn out to be best for us. That looks (to me) to be solar, wind, and nuclear, at least for the near term. I don't like nuclear because of safety, security, and proliferation issues but the alternative is literally social collapse somewhere down the road. I'd prefer renewables over nuclear to the greatest extent possible but it's not yet clear if we can ramp up renewables fast enough to matter. In any case though, if we continue down the BAU path, we are making the situation worse, not better.
you forgot coal :)
This portends very bad things for N American electricity generation doesn't it?
Your right, assuming home heating gets priority, the grid will be hit first:
If people want to help out, they could gather up some links on how much grid capacity is generated by nat gas for each region.
And find some maps of long range electrical transmission links. Are they going mostly east west (meaning all cold states are linked together) or going north south (meaning a warmer south can power a colder north)?
Living in CA, where NG generated electricity is very important, this was one of my first thoughts.
We were able to convince our city officials to install a large photovoltaic system at our water treatment center (pumps and cleans water for the city supply), but they have a total grid-tie system and didn't consider it important to engineer it to run on direct PV output! Our appeals that "We can't rely on the stability of the electric grid" were considered hysterical and naive because of course governments and corporations wouldn't let things get that bad.
I am hoping some retrofit can be worked out when the grid gets iffy within the next several years.
Sorry for a blatant plug but I am invested in World Water and Solar Power. WWAT.OB They have patents on large horsepower pumps tied directly to solar systems and have set up systems which directly address the concerns you mentioned. They cut their teeth in developing solar water pumping systems for poor people without easy access to clean water - still do this recently supplying solar water pumping units to Darfur and Iraq. (also donated this technology after Katrina where it was put to good use) Have gradually been winning larger and larger contracts (multimegawatt Airport solar systems) Currently have some letters of intent (nothing signed) for large multi-megawatt solar farms in Spain and Italy. Recently merged with Entech, a supplier of concentrating solar photovoltaics to NASA for many years and are building their first 50 MW plant.
Sorry - but they did do for some water utilities exactly what you recommended. I'll say no more.
Yes it does.
Anyone got any guestimates on where we are on a similar curve for world NG supplies?
Euan Mearns has done several articles on European NatGas. Jean Laherrere's latest predictions for LNG exports are posted over at ASPO France. The paper is in French but the graphs are in english. He does an ELM study as well (Westexas, you get around). The numbers are not very happy. And they totally depend on Qatar. If the North Field is over estimated.... Well it will be very cold in Europe.
Matthew Simmons spoke here in Minnesota before the Legislature. While answering questions at the end he said he was really worried about Gas reserves because most of those reserves were just estimates that had never been proven by drilling.
Matthew Simmons has been talking about nat gas for a long time. It tends to take a back seat to oil talk, but Simmons seems to believe that when the declines hit, they'll hit hard.
Dave - Luis and I will have a post on Olduvai, hopefully Thursday, providing a global view of oil, gas and coal. Best have a fine bottle of Scotch available to see you through that one.
Here's my current view on European gas:
Most of our gas is off shore. So we cannot really drill the shit out of poor quality reserves like you do on shore - the poor cost benefit ratio (proxy for energy return) I believe is more obvious in the offshore environment.
If Norwegian gas production peaks around 2009 as forecast by Rune Likvern then this will be the first stage of a full blown energy crisis for Europe and the world.
In my book, that means full scale bidding war for nat gas (if infrastructure for LNG is in place). Barring that a full scale real war.
We need to scale non fossil fuel power sources (that have good energy returns) as fast as possible. We cannot afford to wait for all the pundits to recognize there is a cliff ahead. See Murrays post below.
Nate - as I pointed out in this post here Daddy why can you not afford to buy me a Christmas present, there is plenty LNG import infrastructure in place - twice as much import infrastructure than export infrastructure in fact. These are pipelines that lead no where - it is so f****ing incredibly stupid it makes you want to cry.
It is well worth noting that West Europe has had a mild winter - not like N America and E Asia where it has been cold. UK nat gas spot prices have been running about double this year compared to last - so I think there are signs that we already have the makings of a global gas market.
Whilst we do not use much LNG yet - we are dependent upon it - and so need to pay whatever it takes to secure supplies.
Prices are set at the margins, I believe, and presumably LNG is the margin. At what point will the price of LNG determine the spot price of pipeline gas?
Given:
Presumably the price of LNG is going to the moon.
Peter.
Olduvai? Do you mean on another forum? or that that's where we're headed?
Peter.
Its going to be a post here on Duncan's Olduvai theory that Luis has been working on for months. It will explain why your TOD handle may or may not be an accurate description in a decade or so....;-)
Oh dear,
Peter.
Cheers Euan - I think!
I had a bit of a wander round the ASPO site as I am fluent in Franglais, but didn't spot the link referred to, so I think I will hang on for the bad news.
The Russian and Middle Eastern figures should be 'interesting'
Alan from the Big Easy has even got me convinced we are going to have to shell out the suicidal price of the off-shore wind proposals for the UK, things are so bad.
Good job our politicians are on top of the issues, or we would really be in a mess!
Hi Dave, Here you go:
World Nat Gas + Exports by Laherrere
Thanks Jon - again, I think!
And BTW, thanks for an excellent and informative article - shame we can't get it into the powers that be to read.
I agree entirely Dave - in Scotland the top priority right now is to secure a new golf course - that will save us. The eroie of a round of golf is about 0.0000000000001. So I guess if you attract 10 million golfers and each play 10 rounds that will save us, eh? Especially if they fly in on Virgin Vandal's nutty airline.
Humor, a stiff upper lip and gallons of booze is the answer my friend.
No, No! Donald Trump said: "I want to build some bunkers right next to your oil-fields" and someone thought he meant a golf-course :-)
http://news.bbc.co.uk/1/hi/scotland/4862982.stm
No worries, our politicians here in the states are focusing on critically important issues:
This is a preview from my UK gas post that I have been working on for months.
yellow = imports (hahahahhahaha)
The Uk has a major advantage over the rest of the world in that unlike everywhere else, our economy is fundamentally strong. Thus, even though we make nothing, apart from weapons, we will win the bidding war for energy.
Apparently, your month off the sauce has ended...
And why not? Given the alternatives.
As a UK resident that chart is the scariest thing I have seen in a long time :(
I agree just as long as we can persuade our friendly heavily armed European neighbours to continue "donating" all that oil and gas in European north sea waters that we are using :)
Look on the Bright Side Euan, the UK has an abundant sheep population, and the world is going to need a lot more sweaters!
That is another really scary chart. At least the remaining supplies are close to Europe. Ah, this has stopped being fun. Can we play a different game?
Rumor has it that the Ozzies have invented a way of using sheep to generate heat without having to turn em into sweaters - I'll see if Gav can dig something up on that.
And yes, Nigeria and Qatar are right on Europe's door step. N America always has Trinidad to fall back on of course.
Exactly ... evidence? ... our finances are so strong we can afford, at an unplanned moment's notice, to spend £100,000,000,000 buying bankrupt banks!
IMO the overall UK energy situation is a serious concern and the politicians/civil servants won't even talk about making contingency plans in case the public get to hear about them and panic - I am totally apalled by the complacency and blank stares in Whitehall.
Sadly, I don't think the people that do understand can see a viable way out of the mid-term situation but will try and grow the economy until it doesn't. They have 'market will fix it' faith! ... if the invisible hand doesn't fix it there will be panic.
I got an e-mail from an actuarial search firm this afternoon telling me how wonderful it would be to move to London. I'm sure if people in London can sell a few more insurance policies, everything will be all right.
Hello Euan and fellow TODers,
Your Quote:
"Dave - Luis and I will have a post on Olduvai, hopefully Thursday, providing a global view of oil, gas and coal. Best have a fine bottle of Scotch available to see you through that one."
I hope all readers will join me in shouting out 'Peakoil' everytime the glass of your favorite yeasty beverage reaches half-empty!
I have long been trying to promote this as a new cultural tradition to help leverage Peak Outreach.
Bob Shaw in Phx,Az Are Humans Smarter than Yeast?
PEAK OIL!!
Does anyone have any information on net natural gas (NG) exports from Canada? I thought it would be interesting to plot Net Oil + NG Exports from Canada on a BOE basis. And of course, this whole analysis--which is very good--has unpleasant implications for the tar sands operations.
BTW, Clinton and Obama were debating withdrawing from NAFTA, if it is not renegotiated. I wonder if Canada might be more than willing to scrap NAFTA.
Hans Blix's "deep shit" comment is right on the mark.
There probably isn't enough LNG to allow a sufficient quantity of imports to substitute for falling supplies and rising demand --and North America's not building much in the way of new LNG ports anyway.
Is there any way we can avoid the cruel choice of no winter time heat or no electricity within the next five or ten years. There are many people more knowledgeable than myself but if I interpret this correctly, we are a few short years away from a huge disaster we will not be able to recover from.
Am I missing something or is that the implication of this study?
Another factor to consider is where you are on the distribution system. On a global basis, two regions that are not in good shape--at the end of distribution systems--are California and the UK. One might expect to see a migration of people and companies into energy producing areas.
This is already happening with the relocation of amonia/fertilizer, and oil/natural gas products plants to the middle east along with the migration of skilled labour from mature areas such as the north sea.
Your analysis is correct. Add in the off shored amonia/fertilizer plants and you are looking at the end of the obesity problem.
We are probably 5-10 years from shortages and a much more massive coal burn, and hang GW.
Underground gassification is just being researched now, and will no way be ready in the right time-frame.
It will take 20 years to ramp nuclear up to a large figure, although actually it is hopeful that we will be able to get around 50% more out of present reactors through the use of annular fuel:
http://mit.edu/canes/publications/abstracts/nfc/nfc-095.html
Abstract: Feasibility & Economics of Existing PWR Transition to a Higher Power Core Using Annular Fuel
However a lot of reactors are approaching the end of their lives.
Wind energy can be built quickly and is a relatively good resource in the States - the costs in Europe are horrific - but the transmission system will no way be able to shunt all that extra power around, and costs are still high.
Transmission is also a problem with coal, but to a lesser extent as you can burn it where you want, unlike wind which is fixed in it's location for the best resources.
Solar power is in it's infancy, and realistically needs to be introduced initially where it is most cost effective, for peak power in the South West where it is abundant.
PV in the north gives you very little power when you most need it in the mid-winter.
Residential solar thermal is a very good technology, and could help a lot, as will air heat pumps, which can now deal with cold climates - but you would still hit grid limits in switching to electric heating from gas.
About the only white knight riding to the rescue I can see is aerogel, which provides massive insulation - it is currently at around $5 square foot, far too expensive for normal insulation, but I have no idea what potential it might have for rapid price reduction - anyone got any idea?
It would take massive amounts of time and money to upgrade the insulation of the housing stock by normal means - something like compressed paper or straw will probably be fadged up, and darn how it looks and maybe darn fire risk.
Bussard fusion and high-altitude wind are Hail Mary plays.
So the situation is certainly extremely serious, and worryingly entirely unaddressed in the current political debate.
More cheery thoughts - it seems likely to me that nuclear plants will be run well past their safe close-by dates, and coal will return to the homes of American people, air pollution and all - one of the few ways of not having to put power through the grid.
Only a touch more positively coal can be turned into syngas, but you would need a lot of infrastructure which would take years to build.
I suppose if you can't warm your house, you can at least warm the world.
It ought to be cheaper to build and run coal gasification plants that feed syngas or methane into the natural gas distribution network then retrofit coal "boilers" into hundreds of thousands of houses and do the logistics.
In an emergency quite a lot of people would probably just stick in some kind of chimney and have a good, old fashioned, polluting and inefficient coal fire, and heat one room.
Amazing what you do when the kids start crying.
Expect wood to be burnt rapidly in the states - in the UK there is not enough to make a difference.
Going from gas from coal to natural gas in the UK took around 10-15 years I think, going back will not be cheap, quick or easy.
With coal supplies limited in lots of places nuclear or wind where available and heat pumps with a strengthened grid are likely to help more, but I fully expect out politicians to run in all directions simultaneously.
Expect anti-nuclear protesters to be hanging from lamp-posts, even if as seems likely the politicians cut every corner in the book, cut safety precautions, use poorly trained staff and so on.
Then if something goes wrong the nuclear industry will take the blame, not incompetent regulation.
The standards are so over built now compared any other generation source that likely the worst that could happen is that that standards enter the reasonable area.
I doubt that anyone would actually die, too, but can see a potential for cocking things up enough so that you get the occasional scare.
Windscale's release of radioactivity didn't kill anyone, and was blamed on the technicians, but in fact happened because they were ordered by the politicians to over-ride safety so as not to interrupt supplies for the weapons industry.
I like to realy see the problems solved and thus I search for business ideas that makes the maximum use of available resources. Centralized large scale investments makes more sense then manny, manny local coal burners that also would be terrible for the air quality and so on.
Sure it would be more efficient, although perhaps not than a really good home boiler.
We are however talking about a grid which would certainly not be able to transmit the extra energy required to take over the heating duties of NG, although that problem may be minimised if we haven't got enough for our electricity either, and we are talking about very hard times when you can't just pop out and buy a boiler, either because you haven't got the cash or they are in short supply.
Sub-optimal but low capital solutions then come to the fore.
I as refering to feeding the coal thru the natural gas pipeline system as mixed in H + CO or syntehtisized methane.
But large CHP plants feeding city sized district heating and district cooling networks and via the electrical grid powering heat pumps would of course be even better. Make that nuclear CHP if you care about global warming.
What you might find is that coal gasification is usually done like the IGCC idea. They just put the CO+H2 synthesis gas into the turbine of a combined cycle power plant. The synthesis gas is lower BTU per cubic foot than natural gas and to bring it up to pipeline methane levels is not cost effective at current natural gas prices. It is more profitable to make electricity out of it.
Current natural gas prices are not especially relevant if this threads scenario happens.
That could be the case. Coal is mostly carbon so getting to CH4 methane might take an extra supply of H2 to get the yield up. This is not all that big a deal to make happen. I prefer biomass to methane, because it is more renewable and CO2 neutral, but coal may turn out to be more popular.
Gasification of coal with steam produces the needed H2 (via C + H2O ==> CO +H2). GreatPoint Energy is developing a catalytic coal methanation process which they claim will produce approximately one mole of CO2 (sequestration ready of course) for each mole of CH4. This process is not done in situ but rather uses mined coal. They claim (You will have to judge for yourself how seriously to take this claim) that they will be able to produce methane from coal for less than U.S. $4/MBTU. From a global warming perspective this is not a great strategy (Who knows if the excess CO2 will really get sequestered when the economic chips are down?), but since in fact no strategy whatsoever exists with respect to fossil fuel depletion a coal to methane process will probably be pursued.
Coal gasification to natural gas via methanation
gives you around 10000 scf of synthetic natural gas(1000 btu per scf) per ton of coal with current technology. The US uses 23 trillion cubic feet of natural gas; to make that much synthetic natural gas would require 2.3 billion tons of coal per year, the US currently mines 1 billion tons of coal per year.
There's no way to replace natural gas.
You could suppliment natural gas by adding electrolyzed hydrogen from windfarms to natural gas. You can run 20% hydrogen by volume along with natural gas in existing gas pipelines. The mixture burns
like natural gas. Something like (700 GWh) could generate that amount of hydrogen.
http://www.hythane.com/
It may be a good idea to add hydrogen made from renewable sources to gasified biomass and coal to methane. You usually end up with more carbon than hydrogen when making CH4 from biomass, so adding hydrogen from wind electric electrolysis may make sense. It is one way of transporting the fuel via existing NG pipes.
There is a fairly extensive study on this idea:
http://www.pnas.org/cgi/content/abstract/104/12/4828
For biomass, they estimate that 100% of transportation can be covered through this method. My thinking is to go a step further and eliminate the biomass, taking carbon from the atmosphere directly which reduces the land area needed to produce fuels even more.
http://mdsolar.blogspot.com/2007/12/jet-fuel.html
Chris
There was an article on Green Car Congress about a national lab taking CO2 from the atmosphere. I would guess that we have enough sources of CO2, like power plants to provide enough to make NG from renewable hydrogen. Using the CO2 twice could be a good way to reduce emissions.
I agree that that is a good way to start. Cement manufacturing can give CO2 with a low N2 content pretty easily. The energy requirements for getting CO2 from the atmosphere don't look too tough though and as we phase out coal we'll likely want to go that route eventually. One thing is that you can get the CO2 where you need heat and don't have to ship it if you take it directly.
Chris
"Then if something goes wrong the nuclear industry will take the blame, not incompetent regulation."
Almost all of the complexity in nuclear regulation comes from the need to be 'safe' in spite of the fact that almost none of the workmen actually understand nuclear physics. I think an unregulated burst of nuclear power construction will be rapidly self limiting as catastrophic accidents happen. Who gets blamed is really a minor issue. They will probably be dead from an accidental release of radioactive material.
And in a race to build power plants, only idiots will choose nuclear over coal.
Huh? Obviously you don't believe in GW. Don't confuse the regulatory regime with the basic technology, which is incredibly safe.
Coal kills thousands every year anyway, so I doubt that you could do worse.
I do hope we get on and start a build of clean. safe nuclear power plants now though, so we can do things at the right pace.
A combination of them, conservation and renewables is surely the best bet, and use coal after NG runs out for plastics and so on
Well its not obvious to me that I don't believe in global warming. I think I believe in it very much. But it will take effect on a much longer time scale than the collapse of NG supply according to this study. As to your 'best bet', IMO it will fail. It requires too much reasoned debate to succeed with real human beings. And yes, the safety of nuclear power is incredible. I prefer credible safety.
So your solution to GW is to carry on burning coal? Wonderful.
Rational assessment of risk is what is needed - and opposition to nuclear power over the last 30 years has already killed people from coal emissions in their thousands and greatly increased greenhouse gasses, which could kill millions.
However, I don't really want to continue the discussion in this thread, I would just note that many of us who are pro nuclear take safety very seriously, even to the point of trying to draw attention to the fact when the political imperative might be to ignore it.
I think you are perhaps naive to think that there will be much left of the anti-nuclear movement when the first shortages bite, but I always been contrarian, supporting nuclear when it was not fashionable and possibly in the future urging greater caution long after the fashionable have moved on.
Davemart : The problem with coal to gas is the need for hydrogen. Hydrogen requires extensive amounts of electricity to extract from water, and the use of Gas would of course be impossible. The idea is unfeasible.
Well, I dunno what they did when I was a kid then - we used to call it town gas, and it was piped to most homes, and was kept in the old gas-works, which stunk like hell, and it was certainly made from coal.
Looks like Coal Gas has CO in it which is something of a showstopper.
At least for now.
In any case it can be made with coal, water and air (it seems the H comes from H2O dissociating). So no technical problem. But one might say it has many unaccounted-for externalized costs.
It's a fascinating story how it was used and discarded. I hope we can do better this time, re: GHG and cleverness. But we'll see.
Best,
NR
I was an awful energy source, mainly used for cooking.
But I have little doubt that in the situation of severe shortages we are hypothesising here it would make a come-back - a poor energy source is so much better than no energy.
Synthesis gas can be made into synthetic methane through thermo chemical processing. Coal or biomass can be made into Substitute Natural Gas to be put into the pipelines. Once you have synthesis gas, you can make liquid synthetic fuels through the FT process as well.
1. Switch back to coal for domestic heating would be very difficult. Consider the transportation costs in a post peak oil world, and the amount of money would be required to retrofit existing homes and business. In addition large office and apartment buildings lack the storage to store vast quantities of coal. I doubt any Natural gas heating systems can be retro fitted to support coal. They'll need to replace them new coal fired boilers. Consider the amount of sulphur and ash that will desposit on the boiler tubes that were originally designed to operate on clean natural gas. The materials used and boiler design for natural gas are completely inappropriate for use with coal.
2. To replace NG would require a massive amount of Coal gasification infrustructure, which will require constant maintaince because of the corrosive nature of most coals, ans well has the harsh operating temperatures and the complexity of the equipment required (ie oxygen seperation from nitrogen, Slag removal, etc). Much of the rail lines have been downsized as Cars and trucks replaced rail as the primary transportation method. Today, Most coal fire plants run coal supply deficits during the summer. They use the winter months to stockpile coal at the power plants because there is insufficient rail. During the summer the rail lines because fully saturated, deliveing coal to existing plants. While we certainly can increase rail, its going to be extremely costly during a severe energy crisis, as the costs for construction materials will be significantly higher. There is also considerable demand for water in coal gasification. The water is required to distribute coal to individual burners, as well as part of the gasification chemical process.
I suspect that when we hit the NG wall, we will turn to in-ground coal gasification as an emergency measure. It will be extremely inefficent (probably under 10% efficiency because it will be done very hastily), but we'll do it anyway just to keep the party going for a wee-bit longer. Much like we did with the creation of the housing bubble to avoid a severe recession after the dot com bust. We will continue to sacrific remaining resources until the system collapses.
Consider the dozen of other problems that are headed because of resource depletion and the credit crunch. We are not only facing a energy crisis, we are also facing a financial crisis. Even more problems are on the way such as boomer retirement and the massive unfunded entitlements promised to them. Unemployment will soar caused but the massive debt load, and soaring cost of basic commodities such as food and energy (already underway). These problems further undermind the availablity of resources to migate energy depletion. The US, Europe and other industrialized nations now much compete for declining resources with Asia and China. Much of the goods sold to energy exports now come from China and India. Its likely that in the future, China and India will be given more favorable access to energy than the West currently enjoys.
I suspect that as the recession gains momentium more capital resources will go toward the unemployed and to address the credit crisis we are currently in (e.g banking bailouts). The focus from enery migitation will remain off the table until it hits like a runaway train. When the energy crisis hits, I expect remaining resources we be used to continue to support the existing infrastructure. such as subsidised heating fuel, electricity and food. Politicians will hand out food and energy subsidies to buy votes. These will suck all available resources to maintain the existing infrastructure instead of freeing up resources to replace it.
Another critical issue is the replacement of approximate 25% of gas fired power plants. Before the NG gas runs out, its going to get a lot more expensive. this will drive up electrical costs. Its unlikely that existing Gas fired turbines can relably run on syngas, unless it is incrediably clean (rapid corrosion of turbine equipment from sulphur and other containments). While new coal or nuclear plants could be build to replace NG fired plants, its going to take considerable time. Coal and Nuclear plants have a much bigger water foot print than natural gas. Coal plants need to be construct by nearby coal seams, or by rail. Both Coal andNuclear have a NIMBY problem.
Its likely that the high cost of NG will drive some electricity producers out of business leading to frequent blackouts. This largly depends on how fast the price of NG rises. A sharp run up will lead to bankrupcies as NG fired operators can not raise prices to energy consumers fast enough (ie customers with locked in rates, and state price regulation). Many of the NG power companies are already loaded up with debt, and are near bankruptcy.
As I've discussed on numerious times, Wind and solar cannot not directly replace base load NG, Coal and Nuclear plants. They need to be backed up with expensive energy storage systems, and the for every watt of baseload demand required about 5 watts of solar or wind power because the sun doesn't shine and the wind doesn't blow 24/7/365. To replace a single 700 Megawatt NG fired plant will required approximately 3,500 Megawatts of solar or wind power plus a substantional energy storage system capable of storing at least a full days worth of power (in the case of solar, extended overcast weather, or extended periods of no wind) The cost of a single 700 Megawatt gas fire power plant is between $300 and $500 million. The cost to replace it with wind or solar would probably be approximate $20 to $25 billion (probably much higher during an energy crisis).
Wow! That makes me an optimist about renewables!
I estimated the cost of a wind-powered build for the UK at 'only' $13bn or so a GW, but did not really cost for back-up or fully for connection.
On one thing though I think problems are likely to be mitigated - I really can't see the NIMBY problem or anti-nuclear movement surviving - everyone will want the power plants as close to them as they can possibly manage, which incidentally gives you new possibilities in underground nuclear plants in city centres piping hot water to the inhabitants.
One cold winter with short natural gas and it will be the most popular power source.
This would be cheap heat an power even in a post-peak world, although for the countries without the piping like Britain and America the infrastructure will take some making.
Continental Europe and China are much better placed, as is Japan.
I would be interested in pointers to your relevant fuller discussions of your calculations for renewables as baseload.
With thanks,
Techguy you have given us the big picture perspective. There are so many excellent contributors to this site and most tend to look at trees and however brilliant their analysis, it's nice to read someone who looks at forests. Thank you.
Dave…
Do you have a link for purchasing aerogel in “insulation quantities” at your quoted price?
Google only comes up with samples at $25 for a 2.5 cm disk. Or $30 or $125 from United Nuclear.
I also recall someone (you???) recently linking to a newspaper story of a person in UK who had insulated his house with aerogel; so it obviously is available.
I’m presently visiting family in UK and would like to see/sample the product, having been aware of its existence for several years now.
Thanks
PS coincidentally, I’m heading to the Eco-home conference/exhibition at Earls Court, London tomorrow
Darned if I know where I spotted the $5 sq ft, so I may be in error, but these are the suppliers I was talking about:
http://www.aerogel.com/products/overview.html
ASPEN AEROGELS | PRODUCTS OVERVIEW
I also know someone who insulated his shed roof with it, and it cost £250 for the roll, so the cost seems in the right ball-park.
If you are going to ideal home, you might be interested in this link to the new design for a reasonably priced carbon neutral home:
http://www.independent.co.uk/environment/green-living/on-the-market-the-...
I have a couple of reservations about the design - the plumbing and porches and so on eat up a lot of the floor space, it is unclear whether it is carbon neutral only in the sense that you are feeding excess power back into the grid when it is not needed in the summer, while drawing it in the winter when it is, and I am none too keen on wood stoves.
Still, it is a start - would that all y=our houses had so many 'problems'!
I've used a new nanotech coating called Nansulate that is a water based paint,use the clear coat home protect it has twice the insulating as the tintable.18 months ago replaced the hvac system and got a 50% savings since that time I've painted approx.60% of the interior and have reduced our bill 30% and that's heating/cooling the upstairs we normally don't heat extra 450 sq ft.But on the main floor the two bedrooms across the hall from each other the one on the north has always been 5-8 degrees cooler than the south now you can't tell the difference.The back of the house is now warmer than the front where the theromstat is I'm getting ready to do the front and it will be interesting to see if next winter it flips back to cooler in the back.Also I need to have the hvac unit reset on fan speeds designed to run more than it does now.
Dave, you might be interested in this:
http://www.rparts.com/Catalog/Box_Building/insulation/insulation.asp
(VIP or Vacuum Insulation Panels). They are intented for freezers and refrigerators. Its still expensive, but cheaper than aerogel.
I think the more cost effective solutions are:
1. New home construction using 2x10 or2x12 framing (you use a pair of 2x4 with a gap in the middle). Then the entire gap is filled with insulation. I recommend blow-in fiber glass or sprayed on poly-euthane foam. I like the fiber glass because won't generate toxic fumes in a fire, and its easier to fix pipes and electrical. the Eurthane foam sticks to everything. The other choices are blow-in cellose (I don't like it because it settles over time, and the fine cellose particles can leak into your living space).
2. Retrofit. Ridge foam panels on the outside (you remove the exterior, put up the rigid foam panels and put back the exterior, such as vinyl siding which doesn't require period painting and provides some thermal resistance). On the Inside you can add a second 2x4 frame with an airgap (or not) for all the exterior walls, that is filled with an extra layer of insulation.
In both cases its important to calk and seal every crack in crevious before you add the insulation and add dry wall Holes for electrical and pipes should also be calked. Pipes should be wrapped. Its also a good idea to add a vapor barrier to the exterior plywood. this helps prevent moisture from collecting in your walls.
Thanks for the link.
I would be pretty worried about condensation if I installed these or Nansular on the inside of a house - any idea how they pan out in this respect?
Here is contact info for you on advice and UK supplies:
http://www.greenbuildingforum.co.uk/newforum/comments.php?DiscussionID=4...
More chat about aerogel:
http://www.greenbuildingforum.co.uk/newforum/comments.php?DiscussionID=9
And their website:
http://www.proctorgroup.com/index.asp
Proctor Group - Home
Cheers!
I'd like to see a Hubbert's curve projection on north american natural gas.
If it drops quickly, the US could gasifiy lignite coal to natural gas as we are doing now at Beulah, ND. Much of the resulting CO2 ends up sequestered in the Weyburn Oil field in Canada for EOR. Something like 0.5% of US natural gas is syngas from Beulah.
But obviously this would only be a band aid given a large rapid decline of NA natural gas.
How rapidly could NA gas decline?
Here's an interesting 2006 article on Hubbert linearization of gas productions with declines rates for the Siberian Urengoy field.
http://www.mees.com/postedarticles/oped/v49n11-5OD01.htm
Is there something recent for north america?
I don't think a Hubbert curve is going to help here. Peak is skewed for natural gas. At least it is skewed in the only example we have. And it seems to be skewed in North America. On the other hand, the historical model follows a logistic perfectly.
Follow the link to Laherrere's paper. He covers how he created his curves in more detail.
The other factor is the double peak in the US. You would need to separate out solution gas (from oil production) from non-associated gas. But because they overlap, you would still end up with a non-logistic (that is me guessing, you would have to look at the data to be certain).
As I have noted several times, the 2004 End of Suburbia (EOS) DVD, which was basically built around an extended interview with Jim Kunstler (JHK), has been uncannily accurate in predicting recent trends: deflationary trends in the auto, housing and finance sectors and inflationary trends in food and energy prices.
I am in early chapters of JHK's new post-peak novel, "World made by hand." Everything is local. The grid is functioning only sporadically at best, and the central government is pretty much irrelevant. Note that a severe flu pandemic caused significant deaths. However, the bottom line is that the people in upstate New York were adjusting (what choice did they have?) and surviving. In an e-mail communication, Jim said that he thought that a lot of Doomers would think that his novel is too optimistic.
Please please withdrawl from NAFTA. Our spinless mob would never dare. However they only want to re-negotiate the parts that are bad for the Empire, not the parts that screw Canada. I will be using this NG analysis a lot in the next week or two. Thank you very much!
http://www.rrc.state.tx.us/divisions/og/statistics/production/ogisgpwc.html
Texas NG production is interesting. We have shown two years of increasing production, because of the Barnett Shale Play, to 5 TCF or more per year NG production. However, note that the number of gas wells needed to produce 5 TCF is twice the number needed the last time we produced 5 TCF per year (in the early Eighties), so it's a pretty reasonable assumption that the net energy from 5 TCF today is not the same net energy as 5 TCF in the early Eighties.
The following website is pretty interesting, with tons of energy statistics by state. I'm not sure how current the data set is. In any case, Texas is a net oil importer and probably a net NG exporter, but on a net energy basis Texas is probably a net importer. Note that Texas is the #1 largest oil consumer and #1 largest NG consumer.
http://www.statemaster.com/graph/ene_nat_gas_con-energy-natural-gas-cons...
So about 23,000 wells to produce 7 Tcf and now 83,000 wells to produce 5 Tcf. If we had a bit of pricing data we could make a rough calculation.
Florida has 18 million people. Texas has 23 million but has an order of magnitude more NG use. It looks like the states with a lot of oil refining are using the natural gas? That does not bode well for future domestic oil refining.
Oil refining is one of the most electricity intensive industries in existence. Figure out the consequences from there. A full scale refinery uses electricity like football fans downing beer.
This is the analysis that needs doing, either here or an academic journal: "What are the Implications of declining natural gas production in North America for N.A Oil Production"? As I noted below, over 70% of the energy input into petroleum extraction is natural gas. I know nat gas is huge user in the refining sector. Just how much of our annual natural gas use IS used in the petroleum finding/harvesting/refining/distribution chain? I don't have time to do it but I think it would be important if someone else could....
My gut tells me that relying on coal, nat gas and oil is kind of like having a portfolio of Microsoft, Intel and General Electric. They are all bluechips but there is some nasty autocorrelation and systematic risk hiding betwixt the three...
Not in per capita terms. NG consumption: Alaska is of course first, and by a long shot, more than triple the NG consumption of Texas. Louisiana and Wyoming also far outstrip Texas. (all per capita.) The picture for oil consumption is comparable.
As far as oil production per capita goes, the largest is, of course, Alaska, and Texas is only in 8th rank (after Wyoming, Louisiana, and others.)
Those who produce, consume. And Alaska is cold.
http://www.statemaster.com/index.php - go to energy stats.
I was of course looking at the energy export/import balance. While per capita is meaningful, the fact remains that Texas uses more than 10 times as much natural gas as Alaska.
Here is per capita graph of oil and gas used for home heating:
US per capita direct fossil fuel use for heating Click to enlarge.
Here is per state total use of oil and gas for home heating:
US direct fossil fuel use for heating Click to enlarge.
Details in this post, Home Heating with Fossil Fuels compared to Wood
This is a table of the sources of electricity generation by state.
OR,ID,WA and VT and a few others look in good shape (relatively). However the Vermont stat is misleading as their nuclear contract runs out soon.
There is also the issue of sharing power across state lines. My chart is of what is generated in the state. I don't know how one would determine the distribution of the source of the electricity actually used in the state. In the Northeast, I would expect there to be quite a bit of sharing across state lines, so that natural gas would have a more widespread impact than just the states that are shown to have high percentages.
From my inspection of that table: DC--District of Columbia?-- is 100% petroleum powered-- do they have their own local grid? Does that mean the rest of the US could be blacked out but they are still warm, toasty, and illuminated if they can get a single VLCC tanker to supply them? WTF?
More like the only generation they do is diesel, probably for backup, and are dependent on juice from the outside. Think about it, you don't see many cooling towers in Georgetown!
Wonder how much those White House solar panels contributed? Seem to remember someone describing that story in great detail here, and it probably only qualified as a single residence, albeit a pretty big one.
yes i understand westexas but i am always beating that drum eg. protesting comparing the accused, accursed, energy-hogging US to the sweet and egalitarian Dutch, with their postcard windmills, trains, bikes, walkers, modest cheese eaters, xmas cookies, in absolute terms, or in terms that somehow sneakily pull totals in, burying all other comparisons.
As I have pointed out many times, EROI analysis is only valid if one is comparing apples and apples. It must be natural gas in and natural gas out. If oil or, heaven forbid ethanol, were used to drill gas wells, EROI is meaningless. And price can not be left out of the equation. A critical factor in any equation can not be left out just because it suits the point of view of the analysis and skews the result in a preferred direction. It is the functions of the equation that left out that invalidate the analysis.
Suppose that because of shortage the natural gas price spikes. Now suppose that drilling equipment operates mostly on diesel. Then suppose diesel prices are held in check by bio diesel. Drilling could go one for some time with a negative EROI. Some would depute that this could occur, but it may because of the infrastructure that is set up to demand natural gas for electricity and home heating which is not easily changed.
In theory, true, in practise in this case, misleading.
You are not talking about small differences, but of the order of three times the drilling.
I don't really like EROI calculations myself - the simple way of looking at it is it is getting more and more expensive to find less and less gas- that is why the big companies are not drilling even more.
My understanding of purpose of this analysis was to decide between the question of do we have a lot of reserves or not using EROI as an indicator. I don't think the implication was that it would mean the end of production or that expensive production would not continue. It seems to support the low URR analysis.
And in true oil drum fashion, the trend is extrapolated far beyond what is warranted.
It's true there is no prima facie reason for the points to continually linearly to the X axis -they could slow down and maintain moderate EROI for decades. But this analysis showed the current trend and suggested what could happen if it continues. In my opinion the onus is on the natural gas optimists to show why this will not be the case. And as an aside to your comment, would you generally rather err on the optimistic side or pessimistic side, if you are making long term plans?
Hmmm, an infinite rate of increase in energy production (extraction), or energy production peaks and then declines. In a finite world, which scenario is more likely? Anyone? Anyone?
My favorite extrapolation is the Economist Magazine's assertion that Saudi Arabia could produce at their 2005 rate (about 11 mbpd, total liquids) for 70 years without ever finding another drop of oil. So, in 2075 they would be producing 11 mbpd. If we extrapolate their consumption at their 2006 rate of increase, they would be consuming 108 mbpd in 2075.
Removing the extrapolation and looking solely at fit, the trend is impressive. Given this data, a sudden upswing would be a much less likely scenario.
There are 10 years of data and the extrapolation is 6 years. Unless drilling slows (and production falls) EROI will keep falling.
Interesting analysis regardless of whether the analysis is apples and apples or not. Many people think that NG production is relatively inexpensive, as its just like collecting gas out of a balloon ... ain't it?
That is largely true of conventional reserves, but of course as the fields get smaller, more wells are required to keep the production up, but nonconventional reserves have some pretty high ongoing operating costs.
For example, coal bed methane (CBM) wells generally need to be de-watered, by pumping water out, for quite a while.
And Barnett Shale wells generally need additional frac jobs with time.
I did a rough calculation for CBM based on Canadian initial flow data and ultimate recovery. CBM looks to be about 1 or 2 orders of magnitude less gas per well than 1996 era conventional gas. That puts CBM at about 5:1 to 2:1. And I think that reliance on these non-conventional sources is why the EROI graph is falling so quickly.
PDF With well flow data
The Canadian data does not break out shale gas or tight gas, so we cannot estimate the EROI.
If you look at EIA data you see a downturn in production for the early 80s recession, for a purely economic indicator. Doubt it was mysteriously warmer then. In a severe downturn expect many operators to just hang up their hat, unless we decide to subsidize them - which wouldn't be surprising.
Barnett Shale also has the onus of being underneath Fort Worth. Kind of the opposite of Stranded Gas!
What in blue blazes are you talking about?
If you use a windmill to produce the gas it is still stupid if it takes more energy to manufacture, erect and maintain, than the amount of energy which it can produce. You would simply sell the energy the windmill produces, why bother extracting gas with it.
Your apples and oranges analogy seems absurd.
Price can be ignored every time. If it takes 51 oranges to produce 50 apples then burning the oranges is better. Why produce the apples when you could sell the oranges for the same or more? In the end, they both represent energy.
If gas was food and if the amount of gas being extracted could not adequately feed the person extracting it, then that person starves, the same is for the economics of production.
I think all investors, would appreciate being made aware about a process which uses more energy of any description to produce energy. Though I seriously doubt investors would need to be "made aware".
Supposing about spikes and costs as you suggest is meaningless, the differential could never last long. The world would be certifiably mad if it did.
Maybe you have an example where your supposition has occurred and for how long.
Sometimes the EROEI arguments can become pretty amazingly absurd. Of course a wind mill produces more energy than it takes to build and maintain. If you listen to the EROEI high priests you'd never build anything but oil, gas, and coal plants. Of course, at a certain point those too will take more energy to build than they'll ever give in return once we get into the hard to find oil, gas, coal.
Ridiculous!
Do a little research and you will find that a in a 1 MW Windmill:
"The energy invested in manufacturing, operating, and recycling a windmill that lasts 20 years is paid back in 3 months, a 1:80 ratio. Nothing else comes close."
With Wind Mills you have amazing EROEI. Better than oil and gas by far. Gas is around 1:10.
Even the Oil Drum has favorable data regarding wind energy:
http://www.theoildrum.com/story/2006/10/17/18478/085
But this study doesn't even look at higher scaled options like 1 MW, 1.5 MW, or even the 3.6 MW recently being produced by GE, which have much more favorable EROEI.
For many, the data on renewable energy has been NEGATIVELY padded. Not positively padded. In no small part is our current economic crisis in the US due to our energy inefficiency and heavy reliance on oil and gas. Is it any wonder the Euro is gaining even as the dollar slides with Europe so much more efficient than we are?
Where did I say anything about the EROEI of a windmill.
I gave an example of a comparison for energy production that a simpleton could understand. obviously it flew way over your head
"If you use a windmill to produce the gas it is still stupid if it takes more energy to manufacture, erect and maintain, than the amount of energy which it can produce. You would simply sell the energy the windmill produces, why bother extracting gas with it."
My response was to the above statement.
I'll break it down a little more:
1. One of the primary issues with wind has been intermittency and storage of generated energy for later use.
2. Throughout Oil Drum Discussion, a number of potential solutions have been raised including storing the electrical wind energy in various alternate forms.
3. One mentioned above was using wind energy/electrolysis to convert to methane at a high efficiency.
4. With wind EROEI being so high, and with electrolysis efficiencies at 85%, the loss in conversion would likely be very low.
Now of course, I'm sure there has been no study on what the EROEI value would be as this is all very new. But at some point, if wind is a primary generator we're going to have to deal with storage. Methane, I'm sure wouldn't be the only option or even the most attractive for that matter. Simmons seems to be very interested in NH3. And the more you look at it, it really does seem a viable option.
Fair enough?
Really.
You are off on a tangent and an argument of your own making.
Have fun with yourself.
Another worry:
As NG supplies begin to decline, users will be looking to propane (LPG) as a substitute. This makes sense, because only minor modifications are required for NG burning appliances to use propane.
At the same time, we are seeing a shift in emphasis from "crude + condensate" (C+C) to "all liquids", with the implicit idea that users of conventional petroleum products will find it easier to substitute these other liquids than to have to switch to a totally different form of energy (like electricity, for example).
Propane sits right in the middle, a potential substitute for both groups of users. There is only a limited amount of it, though, and not enough for all of them.
Thus, does it really make sense to be seeing propane-fueld vehicles, when we might soon be needing every gallon of propane that we can find to keep homes heated?
This is an issue I'm not seeing discussed anywhere, but it is likely to move front and center pretty fast.
I don't know how NAFTA will deal with declining NG supplies in NA, but Northcom and Canada have just entered an agreement this month which allows either country to send troops to aid the others civil authorities in time of emergency.
From todays NY Times:
In the US 5.2 GW of new wind power capacity was added in 2007 representing 30% of new generation capacity. Gas is the main competitor in new generation. The capacity installed in 2007 was about twice that installed in 2006. The EROEI of wind is rising owing to scale and technical innovations and is at least 20 currently. Wind is also less expensive than gas. Wind is thus very well placed to balance declines in gas production. The main economic risk is that investments in efficient gas furnaces, combined cycle turbines and pipelines won't be used for their design lifetimes. This can be circumvented if we begin to replace heating and cooling applications on an as needed basis close to the existing gas delivery infrastructure with technology that manufactures methane from water and carbon dioxide using wind energy. The Sabatier reaction is exothermic while hydrolysis of water is about 80% efficeint. The 20% heat from hydrolysis together with the excess heat from forming methane from hydrogen and carbon dioxide can be used for either building heating or cooling at reasonable cost when wind power is used while the produced methane can be delivered via the existing infrastructure to currently new furnances and turbines which operate at high efficiency. Carbon dioxide is currently available from cement production and may, for a short time, be available from power plants. It is not clear, going forward, that we actually need any hydrocarbon fuels other than for aviation so in the long run we would likely get carbon dioxide directly from the atmosphere, but this is accomplished at low energy cost in any case. On the other hand, many people worry about the intermittancy of wind and this is an obvious, if perhaps not fully optimal solution. Methane produced with wind is an essentially one-to-one energy conversion if the process heat is fully used. Returning the energy to electricity can be done at 60% efficiency with a combined cycle turbine. Batteries, which should be plentiful with the conversion of transportation, have higher charging efficiency around 86%. It may be that using methane to store wind energy will not last longer than the equipment needed to do it, but by then the infrastructure for gas delivery and use will have seen its anticipated return on investment so that the main economic risk in a decline in gas production will have been avoided.
Chris
Do you have a reference for your claim that H2O hydrolysis is 80% efficient? I am only aware of ~70% efficiency for a commercially available electrolyser (Hydrogenics), and 37% combined electrolyser-fuelcell performance.
I think I've been relying on Agrawal et al's quotation of an National Research Council report (a $27 value). http://www.pnas.org/cgi/content/abstract/104/12/4828
70% works as well. The key is to have a use for the heat output. The efficiency of the Sabatier reaction is not going to be all that high either, for one thing you turn quite a bit of the hydrogen right back into water. But, if you are using the heat, then you only pay for the energy that goes into the methane which translates to a 166% markup when you turn it back into electricity later. So, you go from, say, 7 cents/kWh wind to 12 cents/kWh gas. You end up with low grade heat from the electrolysis, good for heating a supermarket, and high grade heat from the reaction, good for running the freezers in the supermarket, for example. You still need inducements from gas companies and electric utilites to cover the cost of equipment, CO2 delivery and such, but they stand to lose quite a bit of investment if they can't use their pipelines and generators because there is no gas. They are devilishly good a protecting investors by shifting stranded costs to rate payers through manipulation of the regulatory process but this problem may be large enough that they will seek cooperation with rate payers instead.
Chris
Speak of the devil, this just came up on slashdot: http://www.eetimes.com/showArticle.jhtml?articleID=206801669
85% efficient electrolysis.
Chris
Thanks for the link, I found the patent at uspto.gov. It is U.S. 7,282,167 to QuantumSphere Inc. The example they describe is for zinc(?) nanoparticles, so there's likely some other proprietary magic going on.
the US 5.2 GW of new wind power capacity was added in 2007 representing 30% of new generation capacity. - Chris
Chris, how do you evaluate generating capacity? Do you use the seldom achieved nameplate capacity? Wouldn't it be better to talk about the capacity factor of the new installations. The 2007 wind instalation increased out generating capacity by 1.4 GW, given a capacity factor of 27%. In contrast the single nuclear plant completed last year, Browns Ferry Unit 1, added 1 GW to the nation's real generating capacity.
Hi Charles,
Browns Ferry unit 1 is old capacity, it just hasn't been very reliable and still isn't. Kind of jinxed I think. I should have linked my source for added capacity: http://www.awea.org/newsroom/releases/AWEA_Market_Release_Q4_011708.html
Chris
PS. I responded to your comment on the Real Energy Blog. Thanks for posting.
Chris when you start a plant that has not been out of service for 32 years it counts as new capacity. All 3 Browns ferry reactors do fine, and they are pumping out power at power at 100% of capacity, unlike your typical windmill that does really well to produce power at 33% of rated capacity. Windmills rated capacity is a big fraud, because they don't produce power at rated capacity.
Wind produces the electricity economically now. So you need an overbuild. That's part of the infrastructure for wind regardless. But wind is part of the solution. You can't depend on an energy source that will be depleted and in decline. You need to build for renewability not for scarcity.
Hi Charles,
Unit 1 has been having some trouble: http://www.nrc.gov/reading-rm/doc-collections/news/2008/08-007ii.html
Six shut downs since May and one of then was for a busted pipe. Kind of funny to be testing equipment that way I
think.
Gas tubines don't run all the time so in terms of capacity you get a pretty good comparison using nameplate. Wind turbines obviously do produce power at their rated capacity but they don't do it all the time, just like gas. On the other hand, when they are producing less power, they don't bring down the grid which can be a problem with larger power stations.
Chris
I expect more vigorous efforts soon to exploit methane gas hydrates:
http://www.bloomberg.com/apps/news?pid=newsarchive&sid=aiUsVKaqDA7g
Note that I don't say that that is a good thing, just that high prices and fears of insecurity will lead many countries to see what they can do in this respect.
Severe consequences for GW, I think.
EROI remains the problem. There is plenty of natural gas underground and we have the technology to tap it today. The problem is that it will eventually cost more energy to extract than we will see in benefit. Methane hydrates just make the resources larger, but do not boost EROI.
This is the biggest issue with CERA. They seem to believe that any oil molecule anywhere can be extracted at an energy profit. But it is not true.
I simply don't know what the state of play is in methane hydrates.
I have heard varying estimates for how thick the seams are and how mingled with overburden, so the cost an EROI would presumably vary with that, depending on the extraction technology used.
AFAIK it is too early to say too much about it, but of course I may be mistaken.
It gets worse. Analysis I did back in 2004 showed USA NG production peak in Q1 2003. I think we got back to the same peak in 2007, through a huge ramp up in wells drilled from late 2004. However, drilling capacity is max'd out, so we can't repeat such a ramp up, and declines in existing production are accelerating. The big boosts in output were from Barnett shales and coal bed methane. Both require frac'ing and Barnett shale wells reach as much as 60% depletion in one year. LNG into the USA was lower in 2007 than 2006, and was back to 2004 levels in Q4 2007, due to demand in other countries, mainly Japan with their biggest nuke off line. LNG can't be ramoed up significantly because of limited tanker capacity. In the USA we have 2 NG seasons, roughly from end March to end Oct is the "injection season", Nov through March is the "withdrawal season". These reflect injection to and withdrawal from storage. We use about 23 to 24 Tcf annually, and storage capacity is about 3.6 Tcf, probably going to near 3.65 Tcf in 2008. In 2007 we finished the injection season with storage just about at capacity, starting from near 1.55 Tcf in storage at end March. It looks like we can't produce enough to get injection much above 2.1 (maybe 2.2) Tcf per season. With a colder winter this year, we are likely to finish the withdrawal season with =< 1.25 Tcf in storage, which means we are very unlikely to fill storage in 2008. Consumption in 2008/9 only slightly more than 2007/8 would then leave us at =< 1000 Tcf in storage by March 2009. If this happens, by March 2010 there won't be enough storage in late winter to keep pressure up in the pipelines and people in the NE &/or midwest will start to get real cold. Two or 3 weeks of real warm summer like 2005, and a cold winter like 2002/3 and the shortage hits in 2009. AGW skeptics (like me) believe we are already back into global cooling, so if you use NG for heating, you'd better start preparing now. NG will be an energy crisis in North America a little before peak oil. Murray
Thanks Murray. I agree with all of your points as well as your AGW skeptical position and that we are likely back to cooling.
Thanks to Nate, and everyone at the oil drum. This is a great place to learn.
If people want to help extend the analysis, here are some things that need doing:
1. We need stories on profitability of drilling in the US. We know NG drilling is slowing in Canada but at high levels in the US. This hints that the US is higher EROI. Stories about wells not being profitable would tell us what regions had already fallen to the Canadian level.
2. We need information on taxes in the US on drilling. If you look at that Canadian drilling cost graphic, you can see that Royalties are a significant expense. If we knew the tax cost difference between the two countries, we could estimate if the drilling in the US is still going because of lower tax costs.
3. I do not work in the Energy sector. While I do not believe I have made any mistakes, I would be glad to help anyone repeat the calculations. There is no "secret" data here.
One of the factors that is slowing drilling in Canada is often cited as "low prices". It's rarely noted that price levels have not actually dropped, but because gas is sold priced in US dollars and drilling expenses are in Canadian dollars, the dropping value of the US dollar has effectively lowered natural gas prices.
I presume you are familiar with Heading Out's natural gas stories. The most recent on is called Natural gas and complacency. In this article, he is talking about an article by Arthur Burman in World Oil Magazine saying that Barnett Shale gas is not economic at today's prices. It seems that people people were assuming that wells would be producing longer in their cost calculations. The article gives quite a bit of data.
I think the issue of what the true EROI for shale gas is critical. We have a lot of the shale gas, but if it is not economic to extract, it will stay in the ground. If operators discover their assumptions were wrong, and the natural gas price does not rise to a point where it will cover their costs plus a profit allowance, these operators will leave.
Thanks Gail. I had never seen that story. Honestly, even as an editor, I only have probably read about 30% of the posts on here. And less than that % of Drumbeat stories. I will add HOs story to the related reading links. Im sure I missed others as well..
Hi Gail,
Thank you! That was exactly the article I had in mind. I just could not remember where I saw it. It turns out 1MMbtu is ~ 1 Gj. And $1 ~ Cdn$1. So that article claims that at current prices only 1/3 of the shale gas wells are profitable. Which means that shale gas is below Canadian EROI levels. Roughly. We have no way to compare taxes etc.
This is an earlier article on Barnett Shale - Plank Road fever and the Barnett Shale.
Arthur Berman has a whole set of articles on shale gas. And none of it looks good:
"Based on data from 187 Fayetteville wells provided by IHS and the Arkansas Oil and Gas Commission, I find little economic justification for the play at present. None of the vertical wells that I analyzed will recover drilling and operational costs. Only 3 of the 136 horizontal wells will be economic in the most-likely case, and only 13 in the optimistic case. Further, I cannot substantiate per-well reserves that approach the levels claimed by operators."
There is a lot of interesting information in papers on the www.adv-res.com web site regarding unconventional gas of all kinds. These are a few graphs and table I found, from papers published in 2007. There are many others as well.
From A Decade of Progress in Unconventional Gas
From Unconventional Gas Economics
This is a graph showing the trend in unconventional gas production in the US from the EIA.
The problem is that unconventional may be more 'profitable', but the decline rates are huge. Shale plays decline 60% plus in first year. I know in Cotton Valley, which is 'tight sands', the 1st year decline rate is around 40% and 60% by 3rd year. So this means a whole lot more drilling just to stay in place. Same old story. A natural gas treadmill.
Thank you Gail for all these links. I think I have my work cut out for me!
It is possible the EROI curve could bend a little bit if there was a huge amount of say, 10:1 EROI non-conventional. It might be that we are seeing a fall from the conventional plateau to a much lower non conventional plateau. That could buy North America a few years, but we should be sprinting for solutions!
Thanks for your support...
http://digg.com/business_finance/North_American_Natural_Gas_Production_a...
http://reddit.com/info/6a63y/comments/ (science)
Its getting colder.
http://www.dailytech.com/Temperature+Monitors+Report+Worldwide+Global+Co...
Not really
http://data.giss.nasa.gov/gistemp/2007/
I think the financial woes linked to the credit unwind are going to plunge us into a depression (not that this term has ever really been defined - I mean as 'bad recession'). Another interesting and important analysis would be to look at the price elasticities of oil vs natural gas. Oil is a global market. Natural gas much less so. Oil can be dramatically conserved (e.g 4 people can ride in a car as opposed to 1, trips can be cancelled, etc.) Natural gas for fertilizer, plastics, and heat, probably has a fixed minimum demand that won't be that responsive to a recession. The other problem that Jons analysis brings to light is the long lead time for LNG -if we don't see the train coming until it rounds the bend and is upon us, how quickly can we scale imports/conservation?
This further solidifies my opinion that everything is going to be reasonably fine, until it's not...Biophysical economics trumps financial analysis in the long run (and probably intermediate run too). But not the short run, and of course that is how we are wired....
Jon - thanks very much for this excellent post. Your first chart scares the shit out of me, and here's why:
With eroei dropping much below 10 the amount of energy used in energy production escalates out of control - game over. Companies will through economic necessity chose not to drill and production will collapse.
All your charts point to zero new production in the next handful of years. This is scary stuff. In the absence of new drilling / new production - any idea what the underlying decline rate is?
Is it time to buy, hold or sell Encana?
How is this going to hit the oil from tar sands industry?
I am not too keen on EROEI calculations usually, as it is easy to miss out indirect energy inputs, whereas they are going to be in the financial cost figures somewhere, but the numbers are so unmistakable here that we are safe.
They use a lot of NG for get out a barrel of oil, so at what EROEI for NG does the EROEI of oil form sands get negative, or close to it?
The only way then to get at the energy would be to use nuclear power for a positive EROEI overall.
I guess we are discussing the eroei of new production here and not old production from, heritage assets where eroei will be much higher. So right now, tar sands will be getting subsidised by energy from these old heritage assets.
But if new drilling seizes up cos of low eroei and escalating costs (as Jon suggests below) and underlying decline is 20% (as Jon suggests below) then it will be game over for the tar sands. Two bat shit crazy forms of "energy production" (tight gas and tar sands) will die together and the remaining available gas will be used for home heating, electricity generation and industry.
Firstly, a nitpick. EROEI is a ratio, so can't go negative - it can go subunity as a technology/source becomes an energy sink. (like wide boundary corn ethanol).
Secondly, lower EROEI for natural gas doesnt change the EROEI for tar sands. they still need the same amount of cubic feet of energy to upgrade the bitumen. The natural gas will just cost more or will be unavailable, in both cases changing the scaling assumptions for tar sands.
I don't follow your argument there, Nate.
If it takes more energy to get at a cu ft of natural gas, and the number of cu ft per barrel of oil remains constant, as does everything else, then surely you have a worse EROEI for the barrel of oil?
The profit will certainly be less. But unless the bitumen, or insitu process requires more natural gas as an input, then the EROEI for tar sands won't change (not that we know what it is anyways). EROEI is an ENERGY statistic that is Eout/Ein. The energy out hasn't changed and the energy in hasn't changed. There are still the same amount of BTUs required to change bitumen into oil. But those BTUS are now more scarce and expensive.
If you had stated - 'the EROEI of using a BTU of energy to drill and pipe natural gas to Alberta to steam bitumen to turn into liquid fuel will decline', I would agree. That is a chaining argument. But lower or higher EROEI for an energy input doesn't change the EROEI for another technology, unless it changes the efficiency of the process itself, etc.
For example, the EROEI for wind might go down dramatically if we have a shortage of specialty rail cars that transport medium sized turbines. Then we would have to use the large trucks that transport the turbines around the country or some such. Then the energy inputs to the 'production of 1 turbine' go way up. But if coal that fires the trains triples in cost but is still available, the ENERGY input into the wind turbine transportation scheme hasn't changed, and ceteris paribus the EROEI will remain the same.
Perhaps you meant that the energy surplus for society declines. On that point I would agree.
Biophysical analysis is not easy, but it gives us glimpses into the future that dollar analysis does not.
That is why I dislike this sort of analysis. It is so dependent on definitions, cost is easier in dollar terms.
However, definitions altered to suit, it is clear that the total energy expended by society to have the benefit of the oil in the sands has increased,as you had to work harder to get the gas to input.
The only way out of this would be to swap to something with a much higher EROI, so for instance at higher prices for gas then using nuclear to heat up the soil is more attractive.
I actually dislike calculus, but its the best way to quantify mathematically first and second derivatives. Whether we like net energy analysis or not does not impact its validity, only its frequency of use.
Incorrect Nate,
A complete eroi analysis will include all inputs required to produce the energy source, it is all a mattern of how many levels the analysis inlcudes. The full eroi for tar sands would include such items as:
- the energy required to mine/process/manufacture the minerals into the machines/equipment used in the exploration, drilling and processing of the gas used in the tar sands process.
- the energy used similarly in the tar sands.
- The energy provided from other sources, including their eroi (electricity...)
- The energy required to manufacture the distribution/transportation/final processing infrastructure for the product (I think from memory about half of the tar sands production is still a bitumen that needs further processing)
- energy required to maintain the whole plot
-etc etc etc even to the level of the energy required to feed/transport/clothe/house/ maintain the workers employed in the industry.
EROI must inlcude the eroi of each step, if the eroi of the gas is decreasing the eroi of the whole must be decreasing. Thinks about it, if our species energy source has an eroi of 1 it means that every human endeavour is involved in the production of that energy source, there is nothing else, there is no other economy!! The energy/$$ system used in this analysis is a reasonable indicator but it is in no way exact.
Needless to say defining the comparative eroi of our main energy sources (which of course being fossil fuels are all declining, technology cannot defeat geology) along with all alternative energy sources should be the primary scientific endeavour of our species as this sort of information would remove the guesswork and enable us to actually make some intelligent decisions about what possible we have.
Will we do it...naaaaahhhh
We use $$$$ to judge things by, welcome to the olduvai
Yeah, it gets complicated, that is why I usually prefer to talk in terms of bucks.
Assuming I am using the terminology correctly though, the difference would seem to hinge on whether you are talking about EROI or EROEI, the first being a financial calculation where you would just take into account the price of the gas used to make a barrel of oil, the second being a physical calculation which would take into account the energy cost of producing the natural gas.
Other minor factors would come into play, but as a first order approximation if the EROEI of natural gas gets poor, then the already poor EROEI of tar sands could rapidly sink below viability, so the only economic way of using them would be by nuclear means.
This is from the NEB 2006-2008 Short Term Report (the year prior to the one I linked).
Your right about the net energy issue. Even before I did the calculation I knew we were in trouble because drilling costs had devoured a 300% price increase in 10 years. Already 1/3 of the local gas distributors customers are behind in payments (for a total of 100 million, now down to 40 million). Double the price again, and there won't be any customers.
.
.
Looking at the two graphics and its that damn "2012" again. The Incas where right (or whichever ancient civilisations calendar ran till then).
Two more Olympics and I'm packing up and going home... :o)
Nick.
ran into this article on kosovo's independence and an oil pipeline running thru it. http://oil-logic.com/?p=95
what are oildrummer's thoughts. did clinton really go into kosovo for that pipeline? was serbia uncooperative about this that we have to incite kosovo succession from serbia?
Billyt:
Thank you for your perceptive comment. I guess for full disclosure I should mention that I am a former military officer with some ties still to friends in uniform. You have hit upon something that the bobbleheads in the media including NPR,PBS and even fringe liberal media types like Amy Goodman, have ignored out of ignorance, indifference or incompetence. Do you think the US occupied Kosovo in the late 90’s to prevent ethnic clensing?Then you probably believe bush went into Iraq to bring democracy to the Sunnis. You might also be aware that Haliburton and KBR built an immense new base on the Macedonian border named Camp Bondsteel which will be virtually astride the soon to be completed Trans Balkan Pipeline which will deliver oil to the big new terminal in Albania on the Adriatic. Thus Caspian oil doesn’t have to flow through countries where we don’t have troops and bases yet, like Russia, for example. We may have as many as 1000 bases worldwide, with most of the new bases astride or near oil and critical resource corridors. Do you not find it curiouser and curiouser that the media reports facts and events but never provides explanation for the events? Why did 300,000 serbs mass in protest and pitch road flares through the US embassy’s windows. Why didn’t they throw them into Luxembourg’s Embassy? Because we are occupying their southern homeland and the Luxies aren’t. If Nova Scotia invaded Maine and had the maniacs declare independence and install John Goddi as PM, I would guess there might be a few of us who would be pretty sore as well. Oh, did I forget? Our occupying forces installed a former mob boss as their new Kosovo national leader and he is indebted to his occupiers who now have another mission: to protect him from those Serbian police who would love to string him up for more reason than one. Our military used to have a mission to protect and defend our country from foes domestic and foreign. Our primary mission these days is to act as oil police, a really terrible job which is killing morale, killing the army and bankrupting the country. We can fight resource wars but we will not win them. For a glimpse of what could happen, pick up James Howard Kunstler’s new book “world made by hand”.
The only problem is that the volume of oil and gas coming out of Central Asia via the Baku-Ceyhan and the future Nabucco will be a joke. Especially if China manages to secure Turkmenistan and Kazakhstan as suppliers. And they will, with the full blessing of Russia. Azerbaijan cannot supply Europe.
I really "enjoyed" Kunstlers new book. And yes, his main background scenario is military intervention going out of control and badly, all spawned by the mad grab for more oil.
Thanks for bring this up. A lot of the technical analyses here don't consider the potential discontinuities resulting from the military-industrial complex run amok.
Interesting analysis and discussion. But it is possible that a major new trend is being overlooked. It has received almost no mention in the discussion here.
While the charts presented show a rapid ramp in unconventional NG production (coal bed methane and NG from shale formations), the extent of this resource does not appear to be included in the overall estimates of recoverable NG.
Our understanding of this area is very recent, and quite incomplete. There are apparently very large areas with substantial shale reserves, such as Appalachia and the Columbia River Basin, whose extent and content is only dimly perceived. Potentially the same is true for coal bed methane. Do we have any idea of the extent of unmineable coals that may be tapped for methane?
As these resources become understood, they may add substantially to total reserves. They are already contributing big time to production, and the rate at which that production is increasing is possibly sufficient to allow peak NG production to go beyond previous projections.
There are of course many issues, including the EROI issues. But looking at the production numbers from companies producing from these unconventional sources, it is clear that production costs have been dropping very rapidly indeed over the last three years, and I believe this trend is not yet included in analyses such as those presented above.
unconventional is the big wild card, and I guess, hope. I just know from spending last few summers in BC there is HUGE environmental opposition in many places to CBM, etc based on fears of water contamination.
Hi Go,
Do you have links to those studies showing production numbers and costs from non-conventional gas? If we can get both of those items together we can calculate EROI.
The issue is not resources. There are plenty of resources. The issue is getting more energy out than you have to invest energy in.
As I understand it, you have to dewater the coal beds to release the methane and the volumes and flow rates are generally lower than conventional gas wells. Disposing of that water can be a problem For example here in wyoming that water can be pretty nasty and saline. Dumping it on the ground makes ranchers sore and putting it in streams makes fly fishermen and fishies sore.I have not seen any good figures on CBM potential but I have noticed my only CBM stock play, Petroquest going through the roof. Hmmmmm.
I am wondering if improved technology has any possibility of playing a role. There are huge reserves of shale gas in the US, which could in theory be extracted if there were a high enough EROI technology available to do so. It would seem like it would be in our best interests to look for any technological advancements we can find, since the payoff would be huge.
This is a link to an article talking about this issue.
I have found that http://www.adv-res.com/ has a number of articles about unconventional natural gas.
Hi Gail,
You are right. The key is getting the EROI up. It might be that small amounts of non-conventional are produced for years and years.
You once posted an article that talked about horizontal drilling costs and how they ended up being higher than standard wells. I failed to link it and could not find it again.
The friendly folks at API just sent this graphic, not showing energy or dollar breakdowns, but updating the status of rigcount vs nat gas production for United States
This is informative especially combined with Laherreres graph of # wells:
There are more rigs in production, but the duration of production is getting shorter. The easy big finds have been made. Now they drill more wells that produce for a shorter time before decline. As the "End of Oil" author said, the decline in natural gas wells is a much sharper drop off than oil wells.
This is a graph I included in my December post called US Electricity Supply Vulnerabilities based on EIA data.
The graph on the increasing number of gas wells vs the return reminds me of the old expression, 'polishing a turd'.
I read this post on Pemex today.
ENERGY-MEXICO: PEMEX in Death Throes Amid Political Squabbling
By Diego Cevallos
http://www.ipsnews.net/news.asp?idnews=41355
What pray tell does anyone think will be the 'Synergy' of Canadian natural gas crapping out about the same time as Mexico giving up the ghost on oil.
Will it be 'dynamic', or 'breathtaking' or as the kids say, 'Awesome'.
Maybe the US will Annex Canada and Mexico, 'voluntarily' into the new North American Union. That way we can just 'redistribute' their resources to the most 'important parts of the new Union.
Congress, the White House and Wall St always know best, n'est-ce pas?
One thing that may be a bit over looked.
One does not need to have a major disruption in NG to cause a major problem. If an entire area gets a small drop in pressure people's pilot lights will go out on mass. With limited number of service personel people could wait for days to get their heat on.
Lighting your own pilot lights is not that hard. I do it on a once-a-year basis so that my home heater doesn't consume any energy during the summer -- thereby saving a few bucks.
I assume that cold people are going to be even more motivated to light their pilot lights than I am, and will quickly figure out how to light them.
We had a mini drop in pressure last year, and clueless people were too afraid to try to light it themselves. Many went for days without heat waiting for service. I'm lucky as ours is an electric igniter, no pilot light. Though this is our last year on gas.
Its easy to relight the pilot. Just wait for the gas to come back on then light a cigarette. :-)
Of course, another angle that should be of great concern is the fact that over 70% of the energy input into petroleum extraction is typically natural gas:
Source - Cutler Cleveland
If we don't have gas, we don't have oil. Though less gas doesn't necessarily mean less oil.
Lots of positive feedback loops in energy. And none of them positive....;-(
I am going to have that whisky Euan recommended now- actually a brandy.
Just tried to find a graphic for the input of natural gas into fertiliser, to really cheer myself up, but couldn't find one as snazzy as yours for NG producing oil.
Might want to start learning how to make some yourself too. Lots of extra apples around here in the summer and easy to ferment those. The cider from Sept. is tasty about now.
Nate,
I think quite a bit of that gas is produced by the well itself so it probably won't be in shortage. I notice that Bakken gas production is starting up now. They've been flaring so far.
http://www.ogj.com/display_article/320593/7/ONART/none/ExplD/1/EOG-to-co...
Chris
True - but its still gas that is being used that could be used elsewhere, unless that gas is not being counted in our 23-25 TCF annual numbers??? In which case I'd be less concerned.
I don't know the answer to that. I've seem flaring before and I don't know it a little of that is taken to run the well and not counted or if it is.
Chris
This graph kept me up last night (that and a coffee stout). Cutler is a hard guy to get ahold of but couldn't find details of these stats in his linked paper. I talked to some industry friends who agree that oil refining uses huge amount of nat gas via electricity but were perplexed by the 72% number. If anyone can shed light on this situtation it would be welcome. Because my intuition now is that a natural gas crisis quickly becomes an oil crisis if 72% is indeed correct. Anyone?
Hi Nate,
That chart is a reformat of the chart he published in
"Net energy from the extraction of oil and gas in the United States", Cutler J. Cleveland, Energy 30 (2005) 769–782.
Let me read a bit and see if I cannot figure out the source he used.
Found it:
"The direct energy cost of extracting petroleum is the fuel and electricity used in oil and gas fields.
These data are from the Census of Mineral Industries which reports the quantities of fuel and electricity
used in the petroleum sector at 5 year intervals from 1954 to 1997. The fuels used are coal, crude oil,
natural gas, and refined liquid fuels such as gasoline, residual, and distillate fuel. The electricity data
reported by the Census include purchased electricity and electricity generated by captive fuel use.
I exclude self-generated electricity because including it would double count the fuels used to generate it.
I have modified the Census data to correct for reporting errors and omissions based on fuel use data from
other sources and from conversations with the Census staff."
Thanks Jon.
Ok
1)that figure is 10 years old, so may have changed - nat gas was incredibly cheap in the 80s and 90s
2)what is the variability and switching capacity of the 72% (e.g. in a pinch could oil companies go from 72% nat gas to 72% coal instead?)
3)Does the Census of Mineral Industries have a more recent update (Charlie implies it does, but doesnt trust the numbers)
Onward - anyone else can help with this I think its important to know how a natural gas shortage, or very high prices, will impact crude production in North America. Thanks again Jon
Jon,
Here is a link to the abstract of the paper published in Science in 1981 where Charlie Hall and Cutty Cleveland did the original "yield per effort" (YPE) analysis. Notice of this paper in a front page Wall Street Journal article caused Charlie's phone to ring continually for almost a week. Calls came in from some of the O&G majors from around the world.
"Petroleum Drilling and Production in the United States: Yield per Effort and Net Energy Analysis" Science 211: 576-579 (1981).
http://www.sciencemag.org/cgi/content/abstract/211/4482/576
Perhaps Charlie or Cutty could provide a link to the full article.
-- Philip B. / Washington, DC
Thanks Philip,
I downloaded a copy of that paper. It does give a glimmer of hope that we can deflect the EROI slope slightly by slowing down drilling effort.
But a new shale well depletes at 60%+ a year! Can't really slow down drilling too much of the treadmill zips you off the back.
There is an assumption here that may not be correct, i.e., that it's basically open season on nat gas drilling. You can't know the best prospects have already been drilled if there are areas with some potential that haven't been opened up.
If the government is being niggardly about awarding new leases, then EROI for current open areas is going to fall for sure. But that doesn't mean it's going to continue to fall in a linear fashion.
Does anybody understand the Canadian government's general policy about awarding new leases? I know for sure it's not open season, but don't know how restrictive it is.
A while back the CEO of Total said that in the oil biz governments were basically giving the majors second rate prospects (making them work their asses off with their best technology to make a buck) while keeping some of the best prospects back. Any sane government would do precisely that: make the producers stretch.
What do we know about the government's perception of the prospects for areas that are currently not leased and not open for development?
What is the EROI for drilling in newly leased areas as opposed to older areas where the best has been extracted?
If newly leased areas still have good EROI, then the picture is a little brighter than we have here, because this EROI calculation mixes new and old. The debate about future production then centres on what's open and what's closed (just like in the middle east and elsewhere).
Another interesting factor i.e sort of a meta EROI issue. Is that as energy supplies get tight more manufacturing will be devoted to the military and energy industries. This will be a net loss to the rest of the economy. I'd not be surprised to see worldwide military spending become the next big bubble along with oil industry infrastructure.
Look at the EROI on Iraq for example overall if you consider all the inputs I'd not be surprised to see Iraqi oil at a negative EROI. Especially if you include the destruction of the Iraqi economy and lost wages, production, education, civilian deaths, destruction.
I can't imagine why it would not be decidedly negative.
When NG hits a crisis point we could easily see some NG sources also become negative from the same effect.
All of this does not bode well for a consumer based economy.
Another way of looking at this is that when the resource is perceived as abundant, governments are going to be pretty loosey goosey and generous with leases.
When the resource is perceived to be more scarce, there is the possibility that they will tighten up the leasing in order to make sure that prospects are thoroughly picked over before opening up new areas. This is bound to effect EROI.
Companies, if they could do as they please, would have incentive to simply skip around from area to area rapidly sucking out the richest concentrations, leaving the hard-to-get stuff behind. [resource stripping like what has happened in parts of Russia] Governments have an incentive not to allow that by being restrictive with leasing.
I'd be keen to see an analysis of this dynamic in Canada.
I think it is more likely that they won't be developed until after competing sources of natural gas drop to a similar EROEI (or possibly EROEI - the energy loss from liquification)
Nice post. Again, the next decade will be interesting.
Something that really might get this group going:
"In 2006 alone, oil producing companies and countries burned close to 170 billion cubic meters of natural gas, equivalent to a whopping 27% of total U.S. natural gas consumption or 5.5% of total global production of natural gas. Flaring also emits around 400 million tons of carbon dioxide emissions every year."
http://www.treehugger.com/files/2007/09/gas_flaring_satellite.php
So, if we could find a way to bring this flared gas to market, we might have 5% more natural gas available world wide. Much of the flare gas is not the 100,000 BTU per 100 cubic feet energy like pipeline natural gas, but you could make methanol, fertilizer or other products out of it.
A little digging at www.eia.doe.gov shows that USA NG active rigs doubled from early 2003 to late 2007, while producing wells went up 10%, and production in 2007 just about got back to 2003. the number of exploratory wells drilled went up 86%. Cost of wells went up 88% from 1999 to 2005, while cost per foot went up 103%. This would suggest that average depth declined, so there should have been more wells per rig, so total wells drilled should be up more than 100% 2003 to 2007. If we double wells drilled per year, and only increase producing wells 10%, and wells are depleting quicker, and we don't have capacity to keep on increasing wells drilled, we are truly screwed. Flat drilling in 2008 vs 2007 will likely lead to a decline in producing wells. Murray
Nate,
I've been working on a wind driven ammonia project since December and this has come to the point where we've got a team of five together working on it. I'm pretty sure we're going to get the seed money for the feasibility study and I'd really like to have this gas EROI information available to help explain the motivation for converting from NG to wind driven production. What are the rules for reproducing this work?
-SCT
SCT - Don't ask Nate, ask Obama. LOL
SCT-
This is now public. Cite the author, Jon Friese and theoildrum.com. If you need more details on the numbers and methodology, contact Jon at the email at bottom of post.
Nate,
OK, that is cool - it'll get whacked around a bit to fit into a presentation, citations for Jon included, and then we'll make that available to anyone else who might need it. Thanks ...
-SCT
According to The Oil Drum's main page, works published here are under the Creative Commons Attribution-Share Alike 3.0 United States License.
Such works, like open source software are not in the public domain but remain under the control of their respective authors. However, licenses like the Creative Commons license allow people to use the work without paying fees. For a clearer understanding, please refer to the actual license with particular regard to section 3 (License Grant) and section 4 (Restrictions).
Public domain would allow anyone to take this work and attempt to profit from it without regard for Jon Friese's efforts. The Creative Commons license instead protects Mr. Friese from not receiving proper credit and denies others the right to capitalize directly on his work without his permission.
Excuse me for nitpicking, Nate, but as a software developer myself and one who has contributed open source code to the world, I prefer that such definitions be made clear. If anyone uses this work, they do not have any choice. They must credit Mr. Friese and TOD or they lose their license to use the work. Further, once the license is lost, you cannot just start to obey the license to get rights back. Instead you must go to the original licensor and basically ask forgiveness and receive permission anew. SCO is discovering this, much to their chagrin, with the 780,000 lines of code from IBM they used in violation of the specific license under which it was produced and distributed.
Well I didn't get into those details but did say he should cite Jon and TOD. I am less 'editorial' about such things because we are running out of time, and I want info to get out there and the truth get cornered, if possible. I agree that some (many?) will use the information on this site for personal gain, societies future be damned. But I'm not going to waste my energy tracking them down. Thats the Tragedy of the TOD Commons...;-)
Thanks for the clarification. Other eds. are traveling, so I perhaps spoke hastily. But I don't think this is a final analysis. Jon was seeking feedback and ideas on how best to present this type of data. Its not a pure EROI measure, but one method of estimating it. I'm guessing it will be pretty accurate.
Are you sure? I believe CC 3.0 does allow commercial derivative works without prior permission. The derivative work must however credit the original work and be under CC 3.0 itself.
http://creativecommons.org/licenses/by-sa/3.0/us/
Right!
It stays a CC licensed work regardless, Jon gets credit regardless, and even if "commercial" the CC license allows redistribution in just about any media form conceived by others without fee. So, even if you created a derivative work and charged money for it, you could not stop me from taking your work and redistributing it for free so long as I credited you, Jon, TOD, and met the other terms of the license. This is why almost no one charges for CC based works and instead relies upon donations (such as musicians publishing under the CC license). If you charge, I can charge less (down to nothing).
And to Nate, as I said, I was nitpicking but I wanted that out there because I personally believe that the free sharing of information is absolutely vital to the continuation of rational thought and the application of the scientific method.
Hi SCT,
Send me and email and I will walk you through the spreadsheets. The data is all public. Anyone can repeat these calculations.
-Jon
We will pass the word along
and hopefully post nm natural gas proposed report for comments.
cheers
Does anybody know how Oklahoma's nat gas production has remained so stable over the last 40 years?
How can we tell whether Alberta's and British Columbia's production will resemble Louisiana's rather than Oklahoma's?
Source: EIA
Well, other than the fact that the charts are already diverging from the plateau suggested in the OK case, we can't, or at least we can't with the data we have, which is Louisiana and Canada. The Canadian data doesn't need a parallel in the US. It speaks for itself and is trending lower, quickly.
Can somebody post a graph of Canadian nat gas production for last few decades? I don't have one on hand.
I meant the EROI chart.

But from the Natural Gas Treadmill post from Nov 06 there is this graph:
(source Dave Hughes, NRCAN)
I meant the EROI chart.
Do we have an EROI chart for OK?
no - could you create one?
Well, to evaluate Jon's method, it would help see it applied over more than one situation. Right, we are stuck with one example unless Cleveland used the same method for Louisiana.
Jon didnt need to include the Louisiana example other than for historical reference. Do you deny (and I know you will try to) that the slope of Energy/$ is declining, year over year and is half what it was 7 years ago? What happened to Louisiana is not relevant other than to suggest that these steep falls may not abruptly halt and reverse - but one can get a reasonable feel for that from looking at the broader context of the situation. You are free George, as always, to locate the areas in analysis here that are not proven beyond a shadow of a doubt, and claim intellectual victory. You are welcome to it.
Generally, no. But the world economy has been on one heck of a roll lighting a fire under the price of everything because of increased demand (in addition to cheap energy being used up). I don't see that economic fairy tale continuing.
So, the challenge to is to sort out the effects of a hot world economy from effects of depletion.
See my comment at the end of the thread.
http://www.theoildrum.com/node/3673#comment-309832
Fair enough. I don't know how to easily do that. But costs are going up much quicker than revenues, both for oil and gas production. 2006 finding and development costs per barrel in GOM were $69.50 a barrel, etc. Even if a recession were to increase EROI as calculated by this method, we need energy surplus to easily get out of recession. A tangled mess.
True, but Canada is one of the worlds largest natural gas producers. This is not a trivial example.
But we could do some really great work if a company that has produced natural gas for the last 60 years was to knock on my door with well production profiles and costs of operation! The data to know what is happening in the US must be in offices all over Houston. They just need to change $'s into MMbtu and then publish on The Oil Drum.
I think if you look at the number of wells drilled in Oklahoma over they years you might find that they just keep drilling them. When some run out they just drill more. Oklahoma might be the CO2 sequestration state of the union in a few years.
Hi George,
It looks like a peak and decline to me. Have you used xcel much? Right click on the Y axis and select "format axis". Then select "scale" from the tabs on top. Then uncheck "minimum" and type 1500000 into the box.
I expect you will find your answer if you can separate solution gas from non-associate gas. I would guess you are looking at two overlapping peaks. Put a graph of oil production next to it.
Regarding Oklahoma Nat Gas, I know a little bit that is not technical, just anecdotal. I believe that up until the 90's, gas wells all were given an "allowable" production because of the excess. Then, as production went down and demand went up, all wells, including new ones, are now permitted to produce at maximum. Deep drilling (below 14,000 feet) started in the early 80's, but had a lot of technical problems. Now, the wells can be completed fairly easily. In the 90's, Chesapeake Oil pioneered the use of directional/horizontal drilling and became the largest driller in OK, and is now, I think, the 2nd largest independent company in the US with respect to natural gas reserves. Finally, OK has some shale reserves, not as good as the Barnett shale in Texas, but nonetheless a new frontier for previously uneconomical reserves with the horizontal technology and new frac methods.
For those interested and that are in the LA area, Nathan Lewis is going to present the von Karman lecture at Caltech this Thu 2/27. Here is the announcement:
"VON KARMAN LECTURE: "WHERE IN THE WORLD WILL OUR ENERGY COME FROM?"
Nathan S. Lewis, Caltech's George L. Argyros Professor and professor
of chemistry, will present a talk called "Where in the World Will
Our Energy Come From?" at 7 p.m. on Thursday, February 28, in von
Karman Auditorium at JPL, and again at 7 p.m. on Friday, February
29, in the Vosloh Forum at Pasadena City College (south of Colorado
on Bonnie)."
Jon's method of measuring EROI seems to be affected by general economic conditions.
For instance, he shows EROI rising in 2002. And the data he provides shows drilling costs falling that year.
That would reflect the slight recession in the US in 2001. There was no recession in Canada. Though growth did slow. Nat gas prices fell.
The increase in drilling costs over the last few years has a lot to do with world-wide demand for rigs ... more than any sudden increase in the cost of energy it takes to make and operate a rig. Labour costs are high, too.
Presumably, in a deeper recession, EROI would increase somewhat more than 2001-2002.
Another thing to check out would be the profitability of the people providing the services for and equipment for exploration and drilling. If those guys were raking it in (and I do believe they were), then part of Jon's EROI calculation includes the bonanza profits of drilling services and equipment people.
well that would always be true of high energy gain. A good part of the economic rent thrown off from the energy gain goes to the entrepreneur. The rest filters through society via subsidized low cost items, low electricity and heating bills,etc. With low energy gain systems this would not be the case. Entrepreneurs would still take their cut, but there would be far less surplus, meaning less people could stay less warm with less creature comforts, ceteris paribus. Are you proposing that those service sector employees should work for free so the EROI for the rest of society is higher?
Many smart hedge funds have ridden this theme last 18 months - long crude oil and long oil service stocks - these have far outpaced general E&P names, probably due to the underlying reasons suggested by this post
Only in the beginning, then the competitors move in and profit margins are squeezed. High profits are always an anomaly in a free market system (in theory). Being a drilling contractor should become less profitable over time even if prospects remain good.
In general, rents disappear.
EDIT:
If these rents are large, it indicates that there is much future room for improvement. EROI (by Jon's formula) has room to rise.
But not only does EROI have to rise, but production does too. Energy gain is EROI times scale. We can have high EROI but at lower production supply will not keep up with demand. We can have high production, but at low EROI, much of it is cannabalized and doesn't make it to the non-energy sector. In either of these two cases, the consumer pays higher and higher prices for NG, and in some cases may not be able to get it (e.g if pressure drops in pipleline as Murray suggested above)
But not only does EROI have to rise, but production does too.
I don't think so, in this situation. If EROI remains OK and production gradually slants down over decades, we are in much better shape than we would be with a steep cliff. If I am reading the government projections for Can nat gas correctly, they are forecasting that gradual slope.
What you are seeing is the well documented fall of Yield Per Effort as drilling rates ramp up. And a Yield Per Effort increase as drilling rates slow down. Go upthread to pbogdonoff's comment for the reference to one paper. But there have been other papers on that topic going back to the 1950's.
What will rise EROI slightly is slowing down drilling rates so that there are fewer low producing wells drilled. That lowers overall cost. But it also drops the production rate.
So, was there a decline in rigcount growth or wells drilled in 2002? Did drilling rates slow?
EDIT:
Why that year in particular?
If you look at the $/Gj chart in the middle of my post, you will see that the price of nat gas fell to match production cost. Canada drilled 2k less wells that year (follow the CAPP link to the production stats).
It sounds like you are asking all the right questions. Take your time, read the sources. If you still have questions, shoot me an email and we can talk it over.
I should add that drilling costs/GJ are also obviously increased/decrease by the quality of the drilling prospects as Jon notes.
George - I've been thinking about this and you are correct. I also think this is what happened in the decline phase of Clevelands graph on Louisiana, which used a similar method of estimating GJ/$ and backed into EROI. What happened then (and again now) is massive inflation or unavailability of rigs....e.g. rig inflation far outpaced general inflation. There used to be good details on this at the Dept of Commerce but I think budget cuts, etc. make their data not what it used to be. In the broader analysis though, it doesn't matter if EROI is declining less than shown due to rig inflation - because in the end we care about how much low cost energy is available for society. So this is splitting semantic hairs. If you want to produce a counter-analysis please do so. Charlie Hall has been working on GJ per $ for US economy and tells me it is in neighborhood of $20, which is double what Jon has here. Stagflation baby...
I also think it is important to remember that "rig inflation" is necessary to bring on the new staff and equipment needed to keep increasing the drilling fleet. That rig inflation creates profits that are reinvested in new rigs & people.
And that is how lower EROI forces an economic contraction. Eventually, a 2:1 energy source must consume half the economic output. This is why the undulating plataue will not happen. No one can suffer these price increases for long without being forced to cut back. And a cut back stops the price from rising. And a drop in prices stop the drilling fleet from growing (see price vs cost graph above). And that causes production to fall.
Before we know it, we are following a sigmoid curve down and Laherrere and Hubbert are proven right.
Your summation here is at the core of all of this.
Also - a 2:1 energy source must consume half the energy output but not necessarily half the economic output. We just don't know.
Yes, but then the economy adjusts a bit to the situation and with efficiency improvements and adaptations begins to grow again, NG prices rise eventually bringing more rigs into service and more production comes online.....and you have another undulation.
The economy is not a machine, Jon. It's more like an organism. It gets stung or wounded, it rests and reorganizes and rids itself of some inefficiencies and then advances again. If energy is scarce, the advance will be short but it will still happen.
But I think it does matter because if EROI remains reasonable there will be a long graceful twilight in the northern foothills or wherever this stuff is drilled. If temporary inflation specific to Oil & NG production is a big cause behind Jon's EROI decline, things don't look that bad. EROI will soon head up a bit. A reasonable EROI means the energy production system is less vulnerable to shocks and accidents, market moves and outrageous fortune. It can easily pay for it's own repairs and upgrades etc even as it fades away.
Actually, how much low cost energy is available to society is a secondary consideration, though important. (Society can learn to conserve after all) But low EROI raises the spectre of sudden systemic collapse of the industry from which there is no recovery. So I think we really have to find out why Jon's measure of EROI is falling.
What would you rather have: a smaller production by a high EROI system or larger production by a low EROI system? In addition to the reason cited (less fragility), the former would consume less of other non-energy resources. They could be deployed elsewhere.
As a side note (apologies if it's obvious): observe how with Jon's formula, general inflation (as opposed to industry inflation), is canceled out. ie. the general inflation part of the rise in drilling costs is canceled by GDP inflation. That's why he has to use nominal GDP in the calculation. (unless he also adjusts drilling costs for inflation, then he could use real)
I've got four thoughts on this piece;
1)December 2013 NG on the Nymex is fantastically cheap relative to dec 2013 crude oil.
2) Katrina/Rita hurricanes delayed the ultimate decline in USA nat gas supplies by two years. (First running up the price to $16, then rushing in new drilling)
3) Kunstler is out-and-out wrong about agriculture. Most farmers I know fear a fall in crude prices. Even though it pays to burn corn in a stove, its still FANTASTICALLY profitable to grow. Industrial ag is LOVING peak oil and more of it is welcome.
4) Spot LNG prices are high enough to keep industrial agriculture very happy.
"Turkey Pays Record LNG Prices as Iran Cuts Supplies, FACTS Says
By Dinakar Sethuraman
Feb. 22 (Bloomberg) -- Turkey is paying record prices for individual or spot liquefied natural gas cargoes after Iran slashed exports through a natural gas pipeline, according to energy consultant FACTS Inc.
The country is paying between $17 and $18 per million British thermal units for LNG, natural gas chilled for transport by tankers, for immediate delivery this month, Siamak Adibi, a FACTS analyst, said in a report dated February, without elaborating. The price is more than double the U.S. benchmark at Henry Hub, Louisiana."
Farmers can love it until they can't get it anymore.
Do farmers you know think about the long term prospects for non-renewable inputs? Are all farmers planning to convert over to locally grown and produced biofuels? Do farmers have any fear of financial and trade system breakdowns interrupting supplies of essential inputs?
Just curious.
Kunstler's scenario is more about socially provoked disruptions due to greed, hoarding, warfare and mismanagement of all kinds resulting from the perceived need to always get more of something that is in terminal decline.
This is the Tragedy of the Energy Investing Commons. High rents locally while the greater society suffers due to misallocation of scarce resources for tiny energy gain while at the same time non-energy inputs like land, water, pesticides, GHGs, contaminants etc. scale higher. Farmers will do well but at a dear cost to society. (there are certainly paths where farmers AND society could be made better off, but corn ethanol is not one of them)
And I agree with your points #1 and #2 regarding how cheap natural gas is currently.
Sorry fellas, you could easily be correct, and perhaps JHK will be right in the end as well. His last column claimed though that farmers would not get fuel to farm as early as this spring. A farm will get fuel as long as any is produced at all, cuz farms can bid higher.
Steep decline in NG means blackouts in winter time, the social consequences may trump all else.
I've been long deferred nat gas for awhile, and while it may be a big winner, what good may that do?
This is highly depressing. We are doing a lot to become self sufficient on our family place, I reckon we will have to let land go that's far from home as rustling will become rampant. And yes we built a still and a biodiesel oilseeed crusher, but don't use them yet. Guns, lots of guns.
I'm open to ideas.
Katrina/Rita delayed the NG calamity, now's as good a time to buy as any, so what does one do with the millions once it hits?
Move to a place where you do not need lots of personal guns if times get rough?
Cooperate with your neighbours?
Be politically active locally and then in or supporting the state or national level?
Support long term investments and fight NIMBY?
Learn usefull skills and start businesses that makes lots of sense and money with rising energy prices?
> I reckon we will have to let land go that's far from home as rustling will become rampant.
Lease/sell the land you might not be able to manage to like-minded people who want to 'homestead', creating an intentional community. Lots of guns won't do much good if you are isolated and people who understand tactics come silently and swiftly at night, having cased you out days prior. Safety in numbers is an axiom, as long as the like-minded people are stable and grounded with a non-Rambo, sustainable mindset. Some examples range from the 'gun-lite' EcoReality to gun-heavy survivalist sites.
Compared to your place, we're pretty small at 360 ac. And in hay and livestock that won't support us without outside work. We've become fairly self sufficient, grow much of our food, meat, fish and orchard, acres of timber, irrigate with pressure gravity on stream first rights, domestic and stock spring water gravity high pressure with room for microhydro, and guns, guns.
Which makes us a target. A fat target. The idea is hopefully have something real to pass on, not lose it in an endless shootout.
It is highly depressing. At least once a week I swear off TOD and the internet. Forget about it, lose yourself in work. I don't see any personal solutions, only by society, and that appears highly dubious. I'm not a doomer, if only for the sake of my kids and ignoring the problems for stretches.
Conservation and cheap solar, cheap enough so that coal is discarded as uneconomic, is the only way I see out of the GW and Peak world. Throw in all the wind you can, nukes if you have to have it. C'mon Nannosolar. But it's a pipedream, I know.
There's always a chance for those who shape their own destiny; some places will fare better than others, depending on the will of the people, their elected officials, and most importantly, the determination of those who bring the subject front and center. The time to engage is now; I've been showing public officials in my area "A Crude Awakening: The Oil Crash", followed up with a copy of "Post Carbon Cities: Planning for Energy and Climate Uncertainty", which focuses their concerns with an action plan. They've set up an Energy Committee looking at ALL aspects of energy vulnerability in the county.
"Chance favors the prepared mind." -- Louis Pasteur
Another source of NG is on Alaska's North Slope, which is estimated to hold 137tcf. Gas sales are supposed to fund increased oil exploration as well: Alaska North Slope may hold 36 bln bbl oil - US DOE A pipeline project is in the works but the governor's playing hardball with the IOCs:
Fresh off the page from Reuters.
Google alaska natural gas pipeline for more info. The line up to the MacKenzie River delta is still being bandied about; many Alaskans want their line to head down to Valdez for LNG, saving them money on trunk lines - the standard course heads East down to Yukon/BC:
My bets are on a crash line build through ANWR to the Delta when lower 48 begins to brownout, and let Anchorage shiver.
Actually, the IOCs favored an underwater (over the top) route to the MacKenzie Delta, not through ANWR.
Of course, that isn't to say a lot of development won't be needed onshore to support the project. But it is actually a lot shorter than the "all Alaska" route.
If they bite off too much, they might wind up spending up to 50 billion without even being able to finish it.
I favor transportation to Fairbanks, where it could be transformed into liquids and sent down the pipeline. Now the North Pole refinery removes a lot of crude from the pipeling to skim off diesel and naphtha for local use. They don't even have a hydrotreater there. The heavier fraction is just dumped back into the pipeline.
With the gas from the NS they could upgrade the heavier fraction with existing technology and put much lighter material back in, which would produce a higher selling price, as well as providing needed economic activity to the area. It would also allow production of abundant, heavier grades known to exist in PB, above and around the existing, depleted reservoirs.
Fuels for local consumption could be sent down the railway to Anchorage, or barged down the Yukon to the Nome area.
Worldwide, from nuclear + fossil fuel sources, we burn through the energy equivalent of 36 Gb of oil about every six months.
Thankyou for the figures. Is there any chance you would have individual figures for gas, oil and coal, and any links for more information ??
I received a few requests for more details on how the Gj/$ dollar values were calculated. The full details are in [NEB 2007] Appendix A & B.
This graph shows the problem with trying to calculate EROI for a given years drilling and producing activity. Take a look at year 2003 (Yellow). You can see that most of the gas production in the year 2003 was actually from prior years drilling (red and green and blue on the bottom). That means that the EROI calculation is going to end up a mixed up tangle from several years.
There are two ways to deal with this problem (that I know of). The first is to just accept the error. And in the US analysis in the main article that is what we have to do. We have no way to separate out new gas from old gas.
The second method is to estimate the future production of a well, and calculate the EROI based on that number. That estimate is done with a decline model. This next graph shows what a decline model looks like.
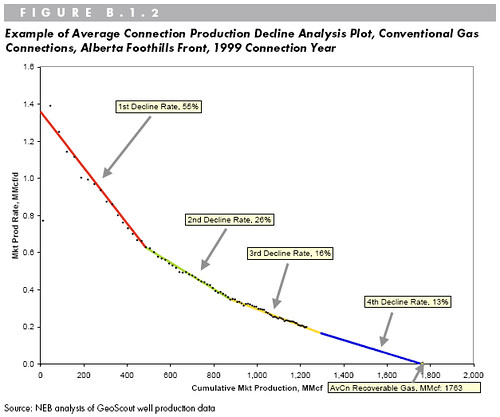
There are several downward slopes and eventually production hits zero cubic feet of gas per day. The amount of gas produced is totaled up and the energy value of that gas is calculated. Then energy output is divided by the cost to drill the well and you get Gj/$. Or would if there was data for every single well. In reality, lots of wells are averaged together (read the report for details).
The NEB uses this decline model strategy to calculate Gj/$. And that is why we can see the EROI decline very quickly. It is not getting "muddied" by prior gas production.
Time has still not permitted me to dig into these sources that you have so generously acquainted us with (thanks btw!). I will this weekend, though.
But it would seem that there is enough data here for considerable analysis. For instance, from Figure 3.1, couldn't decline rates for the various connection years, for each of several years after connection, be calculated? [Assuming the distribution of when the wells became active during each year was roughly the same.]
Is that data available without extracting it from the figure?
Yes, it is in tabular form. And please feel free to email me and I will supply you with my spreadsheets. This is an important topic and I don't mind people checking my math.
Ok, I have found a site that has Texas gas production data. Thank you Mr. Swindell. He has a huge amount of data posted. Head over for a look.
http://gswindell.com/index.html
Compare this graph to the Canadian chart I posted just above. Which do you think is in faster decline?
do tell.
Gonna be tough to determine by eyeballing it, I think.
This is what I came across. The wells that they are drilling now do not last as long and they have to drill more. I think that the rise in natural gas prices in the U.S. over the last 10 years has motivated more drilling, but with shorter production duration the costs are higher, which makes for more rises in natural gas prices....and so on.
Jon has made a great first pass at what could be a critical topic, one that has been periodically analyzed on TOD over the past few years. If there are any industry insiders who would like to offer information or create a guest post, anonymously or not, we would welcome more work on this issue:
1)how much of EROI decline is due to rig inflation outpacing general inflation?
2)if rigs become unavailable and EROI increases due to slower drilling, does production fall off precipitously?
3)how much will $20+/mcf nat gas or spot shortages impact north american OIL production, given how much NG is used in petroleum extraction/refining?
4)unconventional plays are increasingly making up towards 50% of our gas production, yet their profiles show equal if not greater initial declines - where does the gas come from once the easy unconventional areas are played out?
etc. etc.?
help welcomed. Again, I think the main point here is that a great deal of smart people continue to think of the world in dollar terms and to anchor decisions somewhat based on biophysical principles will require a paradigm shift.
I took a very long look at this chart posted by Euan and I realized that all my data points were on the nice flat part of this curve. But below 10 the curve stops behaving in a linear manner and becomes, well, a curve. And that means you cannot use a linear regression to forecast EROI.
So I created a new forecast using a more complex, but what I feel is a more accurate method. First I did a regression of the $ per Gj data. I extended this forecast way into the future (way too far) in order to see what will happen on the EROI graph. (Don't sell your home and buy an island in a warm tropical area based on this graph is what I am trying to say here). But you might want to spend some time considering what 4x natural gas prices will do to your budget.
The cost data was transformed into EROI and plotted. As you can see, the curve does bend. That is because it takes a 10% increase in energy input to go from 100:1 down to 10:1. But it takes another whole 10% increase in energy input to go from 10:1 to 5:1. (100/10 = 10:1 100/20 = 5:1).
Future work will try to refine the cost per Gj forecast further. And make certain I have taken any inflationary adjustments into account.