| UK Natural Gas Prices, Already at Historically High levels, Set To Rise | The Oil Drum | Banana Methane Powered Cars, Pig Poo Power And Other Uses For Biogas |
| UK Natural Gas Prices, Already at Historically High levels, Set To Rise | The Oil Drum: Europe | Countdown to €100 Oil: €70 Oil |
Oilwatch Monthly - March 2008
Posted by Rembrandt on March 19, 2008 - 10:23am in The Oil Drum: Europe
The March 2008 edition of Oilwatch Monthly can be downloaded at this weblink (PDF, 1.6 MB, 21 pp).
A summary, latest graphics and an explanatory note regarding a few errors I made last time and the data used below the fold.
Latest Developments:
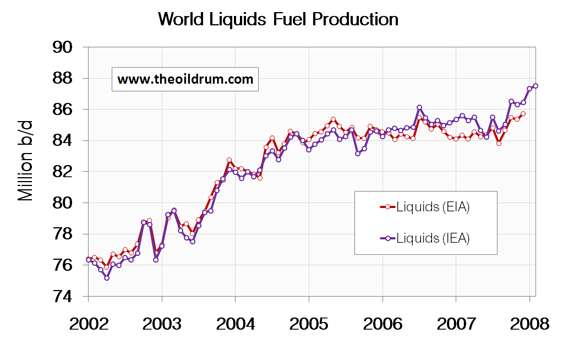
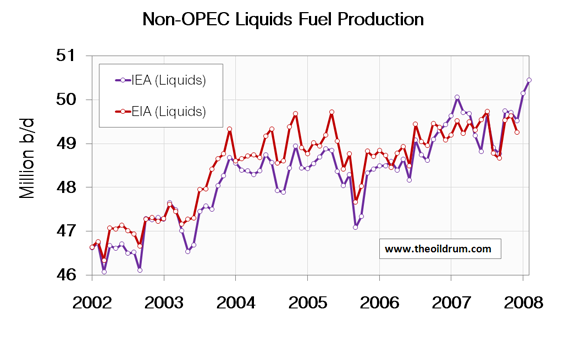
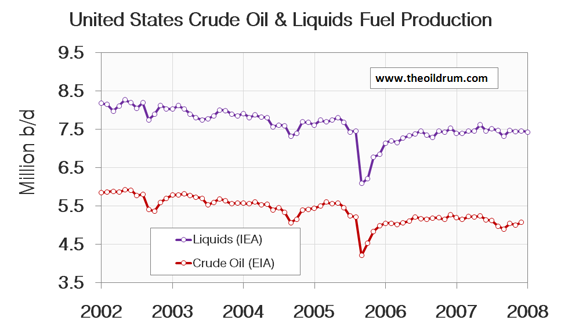
1) Total liquids - In February world production of total liquids increased by 175,000 barrels per day from January according to the latest figures of the International Energy Agency (IEA). Resulting in total world liquids production of 87.5 million b/d, which is the all time maximum liquids production. Average global production in 2007 was 85.41 million b/d according to the IEA. In the first two months of 2008 an average of 87.41 million b/d was produced. The EIA in their International Petroleum Monthly puts the average global 2007 production at 84.63 million b/d, slightly higher than the average 2006 production of 84.60 million b/d.
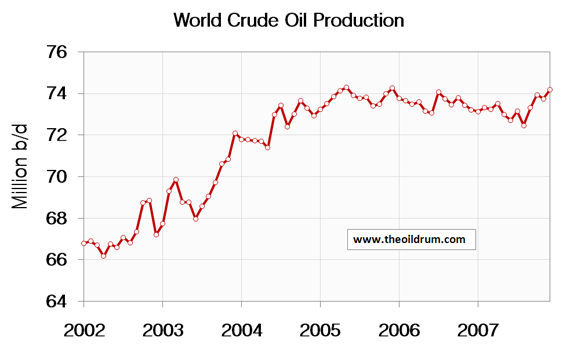
2) Conventional crude - Latest available figures from the Energy Information Administration (EIA) show that crude oil production including lease condensates increased by 450,000 b/d from November to December. Total production in December was estimated at 74.2 million b/d, which is 96,000 b/d lower than the all time high crude oil production of 74.3 million b/d reached in May 2005 (difference due to rounding errors).
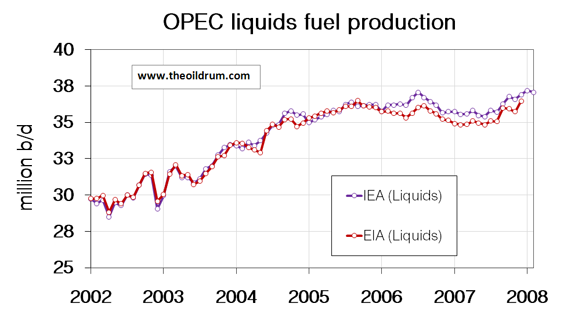
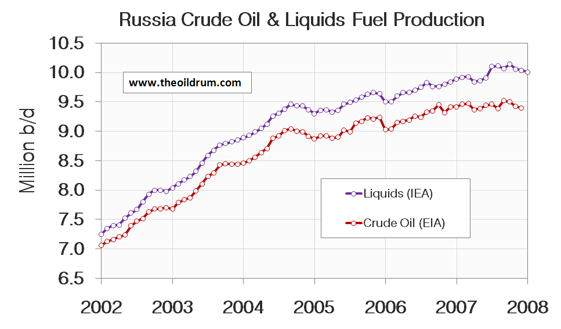
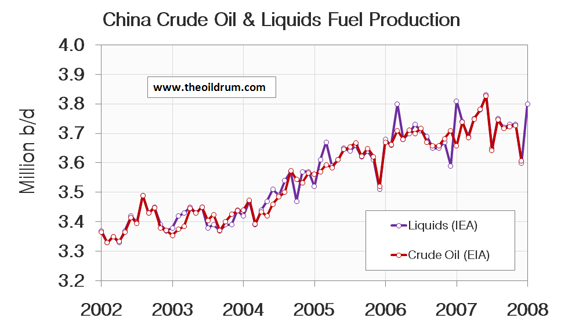
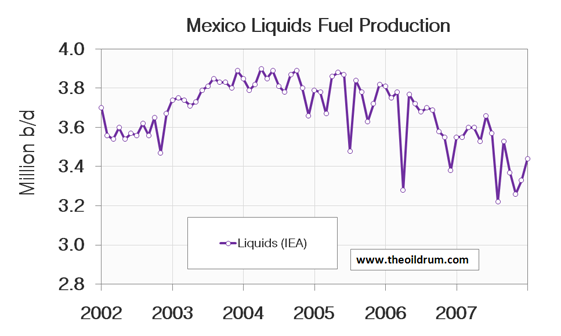
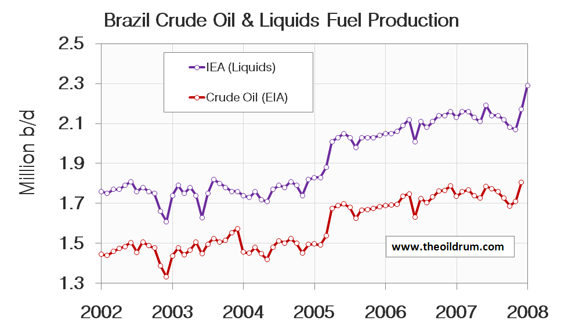
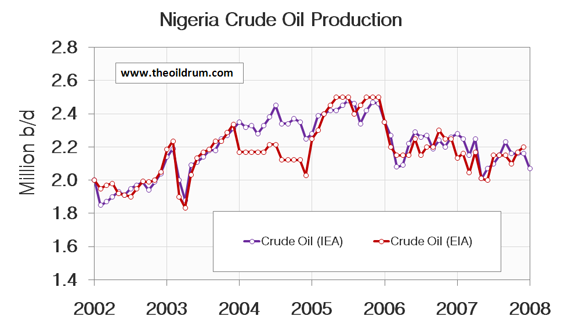
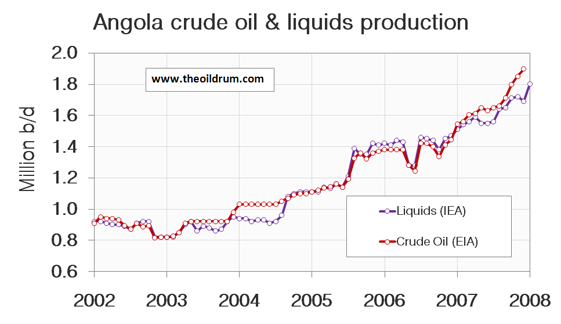
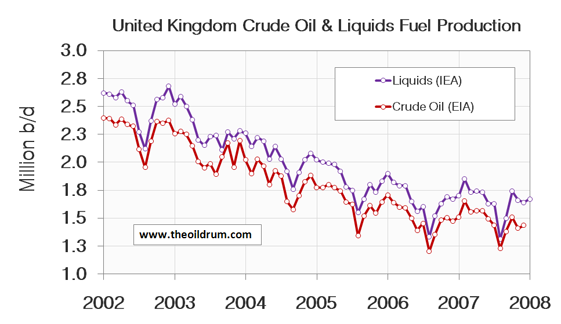
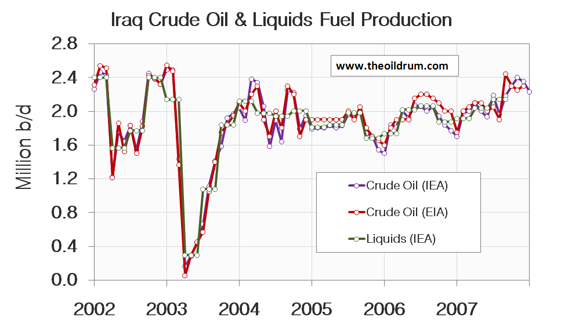
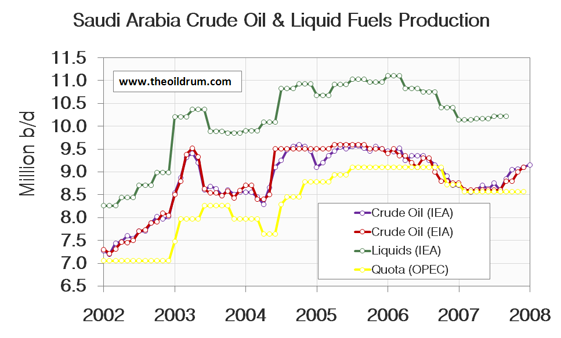
A selection of charts from this edition:
An explanatory note about the data used in the Oilwatch.
In the discussion at last month's oilwatch valid points were raised by sofistek and others regarding some errors I made in the February edition of the oilwatch monthly. I have corrected these slight errors in this edition.
Regarding the data used in the oilwatch, this comes mainly from free public sources. In specific I use the Oil market report by the international energy agency, the international petroleum monthly, oil price data and stock data from the Energy Information Administration and the Joint Oil Data Initiative database, which is a collective effort from a variety of energy institutes and database companies. I no longer use the short term energy outlook of the Energy Information Administration since the international petroleum monthly is a much better source of data.
In addition to these public sources I also use the paid publication, oil, gas ,coal & electricity quarterly statistics of the OECD, for addition data on liquids production. I do not use the latest purchasable oil market report from the IEA since I do not (yet) have a subscription to that publication and hence have to rely on the free issue.
Personnel
Editors
Contributors
Peak Oil Primers
Archives
- November 2010 (3)
- October 2010 (6)
- September 2010 (4)
- August 2010 (7)
- July 2010 (6)
- June 2010 (7)
- May 2010 (2)
- April 2010 (8)
- March 2010 (4)
- February 2010 (6)
- January 2010 (3)
- December 2009 (5)
- November 2009 (8)
- October 2009 (12)
- September 2009 (6)
- August 2009 (5)
- July 2009 (11)
- June 2009 (8)
- May 2009 (16)
- April 2009 (10)
- March 2009 (7)
- February 2009 (10)
- January 2009 (15)
- December 2008 (9)
- November 2008 (9)
- October 2008 (9)
- September 2008 (13)
- August 2008 (10)
- July 2008 (14)
- June 2008 (23)
- May 2008 (16)
- April 2008 (12)
- March 2008 (16)
- February 2008 (9)
- January 2008 (13)
- December 2007 (13)
- November 2007 (16)
- October 2007 (22)
- September 2007 (8)
- August 2007 (9)
- July 2007 (16)
- June 2007 (8)
- May 2007 (7)
- April 2007 (7)
- March 2007 (10)
- February 2007 (10)
- January 2007 (12)
- December 2006 (9)
- November 2006 (15)
- October 2006 (4)
- September 2006 (5)
- August 2006 (5)
- July 2006 (9)
- June 2006 (5)
- May 2006 (10)
- April 2006 (9)
- March 2006 (13)
Vital Trivia
License

This work is licensed under a Creative Commons Attribution-Share Alike 3.0 United States License.
Thanks very much for the information. Why does Mexico have so many precipitous drops and rises?
Not an expert, but I'm guessing it's due to the weather - most of Mexico's production is offshore, and therefore susceptible to the adverse weather conditions of the Caribbean, particularly the hurricane season.
How are exports looking? I mean, that's what's important to the West. It Saudi Arabia producing another 2Mbbl/day and exporting it all is better for the West (ignoring climate change and trade deficits) than KSA producing another 10Mbbl/day, using 9Mbbl/day and exporting only 1Mbbl/day of it. So in a sense, total production doesn't matter to the world; only total exports.
@Kiashu
You can find this in the PDF under page 6/7. Exports to the West are doing relatively okay at the moment given present stock levels. Exports to Asia and then especially the Pacific region are under pressure I think from what I can derive from stock levels.
In my opinion export land is not the only factor effecting the current oil prices. Given the error in our global production number I feel that we are approaching the bottom range of reported numbers vs real oil shipments. Tanker contract rates and prices are indicating that currently reported numbers are high. My best guess is its down by about 1mbpd from reported which means we should see reported numbers decrease over the next 4-5 months.
http://oiltankers.blogspot.com/2008/01/bloomberg-roundup.html
The key is that tanker rates where falling even as crude shipments where supposedly increasing.
If you read through the articles what you see is a movement of oil from Asia to Europe and the US which is showing up in the PDF. So its a bit of a game of robbing peter to pay paul.
SuezMax which means US or EU rates where up for example. I see nothing in the tanker data that indicates any sort of strong gain in shipments.
Export Land could also be playing a large role then indicated since I'm sure that internal consumption numbers are even harder to verify.
Next unless people forget one of the big problems was that refining capacity was supposed to be a bottle neck yet todays numbers show close to maximum oil shipments but refining capacity utilization quite low in the US.
Time will tell of course but it seems to me that if the Mega Projects list is reasonable and if KSA has more oil etc etc we will move upwards this year or I'm right and decline off the plateau has started and it will become obvious by 4th quarter this year.
In any case I really think our bumpy platuae is going to make a definite movement by the end of the year. Also of course export land should become clear in about the same time frame.
Gasoline prices in November will be very interesting.
On the economic side since we have a natural increase in house sells in spring/summer and of course various increases in internal tourist jobs in the US and EU I think we will muddle through for a bit longer. Also I think the Fed will get more creative with stupid actions that will avert any problems short term at the expense of more down the road. I think we will see a drop in air travel as people vacation locally but this will keep gasoline demand strong.
And finally I suspect I'm the only person on the planet willing to call a end of the plateau on a supposed increase but this has gone on for about three months now :)
Naw, I'm with you. Last year I postulated that peak oil would be on the 4th July, 2008.
I'm still going with that date.
As oil price 'goes through the roof' most of the supply graphs are either showing slowing declines or an upturn...
-have the Economists been vindicated?
Nick.
As a handful of months where each month is lower is a poor indicator that "peak has definitely occurred", so to is a handful of months where the production is higher a poor indicator that peak oil is a myth and economists are vindicated. Drawing trends from small data sets is prone to large error.
(This is similar to the maxim "weather is not climate".)
My personal thought is that if the "economists" were right, we'd see a lot larger increase than we are. A bumpy plateau is a bumpy plateau, and it seems to me that we've been on it for a couple of years already. We may bump higher and lower for a while, but this is about all we're going to get.
And of course, as someone else has already mentioned, available exports is more telling than "all liquids" production.
If my potential clients were offering twice as much for my work as they were last year, I'd definitely be offering more service than I do now :)
You may well be willing to try. But if you have your family screaming for more of your time and attention [internal consumption], do not have enough help on hand [staff/rigs/support], or your own suppliers [millions of years gone] cannot support you, you might be unable to comply.
I, on the other hand, might offer only 1/2 the service since I don't need the extra money and I would value more spare time.
If I don't need the money today and expect the oil to be worth more tomorrow, why pump it today. Oil in the ground which is increasing in value may be more attractive than dollars in hand which are depreciating. I may also lower my extraction costs if I don't rush. What higher prices will do is inspire my neighbors to see if they have any.
I think some control charts would help see if the day to day or month to month fluctuations are really statistical or if they have an assignable cause. On the face of it, we are on a plateau as far as production goes.
Economics 101 says that in a perfect market, suppliers would be willing to supply more when prices are high. But this is not a perfect market (finite suppliers, information asymmetry). I'm sure papers are being written in the economics circles on how to model current oil prices.
What TOD needs to do is add on Game Theory to the ELM to get a better model on how exporters and importers will behave once production starts to fall in the exporting countries.
Consumption is increasing in the producing countries to some (how large I don't know) extent because of increased inflows due to exports of oil. They subsidise internal consumption (not just fuel) hugely through artficial petrol prices and zero income tax (in most Gulf countries). If revenues from exports go down, how do they keep this system going?
Srivathsa
P.S. One Israeli to another - "When Moses brought us out of Egypt, why did he bring us to the only place in the Middle East without oil?"
Moses brought the Israelis to the Sinai, not to Palestine. The Sinai has oil.
And then they went and gave it back to Egypt, so... :)
"Economics 101 says that in a perfect market, suppliers would be willing to supply more when prices are high."
Coming from the patch myself, it's obvious that this statement is not true. The problem is called "time". If a well is pumping oil, I sell it regardless of the price. It's almost impossible to change production.
If a well is not pumping, on the other hand, or if I've planned drilling a well, then I wait until the price suits me to fix up or drill. And then I can't do all at once. One after the other, once the rig is free again and my wallet allows it.
Yergin, Lynch et al. were not wrong with their price predictions because they assumed that production can be increased. That may or may not be true (I'm in the "basically not true" camp myself.) They were wrong because of the assumption that the spiggot can be turned on or off at will to effect price. It takes (lots of) time to ramp up production.. In the 70s it took over 10 years!!
I don't think that any Eco101 class would claim that there are no time lags..
Cheers, Dom
...and that's really the heart of our problem, isn't it. Economics predicts equilibrium behaviour and peak oil is fundamentally a problem of kinetics.
Dom,
The oil market with its cartel is hardly a perfect market to start with. I was talking about suppliers being willing to increase supply.
Eco 101 says nothing about suppliers' ability to increase output in the short run. As long as the marginal revenue is greater than the marginal cost, it makes sense to take out one extra barrel and sell it. In theory therefore, supply should follow such high prices (unless of course the cost of the next incremental barrel is not making it worthwhile to do so). If it is not, something else is at play. I don't know what it is. I am trying to figure out what it is that has driven oil prices up 3 or 4 times in 5 years, when demand is growing 2-3% per year (don't ask how me what difference that knowledge will make to my life):). Peak oil seems a likely candidate.
Someone (Lester Thurow?) said that economics can predict most things well, but is horribly wrong on timing. If you've sat in an Eco 101 class, you will rarely hear anything on time lags or their magnitude. Only two terms are uttered - short run and long run . The supply and demand curves shift on the blackboard as if by magic :).
It's possible that we've run into the limits of supply in the short run as far as oil goes and the long run marginal costs are much higher than today's price (marginal revenue) and so more supply will come in at higher prices.
It's also possible that we're running into long term physical constraints on how much demand the earth as a whole can support.
With 3 or 4 years of data it is hard to come to a definite conclusion (at least for me).
Srivathsa
In the long run we're all dead.
"As long as the marginal revenue is greater than the marginal cost, it makes sense to take out one extra barrel and sell it."
This is true if your goal is maximizing income today or your have an infinite resource. If you are planning long term, have a finite resource, and expect rising prices, then it is false.
You also have producers, Mexico for example, that have concluded that the best way to maximize income today is to minimize investment in new capacity.
I asked my friend Excel this exact question. I used two elasticity of demand values for oil, a short run value -0.26 and a long run value of -0.47. Elasticity of demand lets you calculate the % price increase caused by a % shortage of supply.
I calculated price versus declining supply which gives us this graph:
None of these prices get outside a reasonable boundary as a barrel of oil generates about $600.00 in GDP.
Then I calculated the net revenue to oil exporters. You notice that eventually the total revenue does fall below the starting level, but not until exports have fallen 3/4 of the way to zero. The lower the elasticity value, the longer the delay.
(the graph should say Total Revenue, not net). Recent calculations have shown the US elasticity of demand is -0.06 (much lower than my values). Which would give an even higher peak to total revenue and longer delay until break even is reached.
The results yield this interesting tip to the world's importers: Mass transit and other alternatives to oil that lower the elasticity of demand will pay for themselves because they keep the oil price low & they keep the oil flowing faster, longer. The more desperately a nation clings to oil, the less there will be.
Thanks. Helpful to see it in terms of numbers. Some questions and comments
a. When you say elasticity of demand of -0.47 it would mean for every 1% increase in price, demand would drop by 0.47% - correct? At a price elasticity of -0.1, to hit an import volume of about 10Mbpd, prices would have to about $750 - correct?
b. Based on a global GDP of about 48 trillion USD and a global oil consumption of about 25 billion barrels of oil annually, GDP/barrel would be closer to USD1900, wouldn't it? Or am I missing something? It is not completely relevant to the arguments you have put forward, but just for the sake of accuracy...
c. At 10Mbpd, some serious GDP destruction ought to have happened in the importing countries. Their GDP would be in the order of $7trillion vs. 27 trillion or so based on today's consumption (40Mbpd) assuming no efficiency increases. Allowing for a 50%(!) increase in efficiency and substitution - about $10 trillion (at constant dollars). Exporting countries (based on a USD/barrel somewhere between 300 and 750 USD - say 500USD) would enjoy revenues of about $1.8trillion each year. They better set aside a substantial amount of that on some serious diplomacy and weaponry (more the latter) :).
d. Given that oil has increased by about 50% over the last 1 year and assuming an elasticty of (0.06), we ought to have seen a demand destruction of about 3%. We have seen a supply growth of 2-3% (am I correct?) Would it be fair to say that demand growth is actually in the range of 5-6%? Given that we can only measure how much is being bought/sold how do we estimate demand in a sticky supply situation? And how accurate are the numbers reported on production and inventories?
Thanks,
Srivathsa
a. Yes, that is my understanding. http://en.wikipedia.org/wiki/Elasticity_of_demand
b. You are missing all the other fossil fuels. My number was from memory of calculating the value for the US in $2006 using all fuels from BP statistical review BOE (barrel of oil) equivalent. It should be taken as a very, very rough estimate of what is possible.
c. Yes, I don't expect that oil will ever reach higher than $300.00 (in 2006 $). Instead, I think it would be more efficient for the exporter to just use the oil locally creating goods and selling them at much higher profits than can be realized by oil exports.
d.I took the value from Gail's post here: http://www.theoildrum.com/node/3531 She explains how it was calculated.
As far as accuracy? I don't know. But the rough curve shape is still true. And that is enough to know the exports will fall for some time.
One wild brainstorm is that the sigmoid curve shape is used to predict the elasticity of demand as the price of oil approaches the energy content of the oil. When the energy being traded for a barrel of oil is low relative to the energy content of the oil, then we can expect that the elasticity of demand will be very small. Because it will always be a good idea to make that trade. But as the price rises and the energy given back for a barrel gets higher, then the elasticity of demand should get larger, which bends the price curve into a sigmoid hitting somewhere between $300 and $600 or so. We need to account for efficiency losses in converting oil into trade goods and I am not sure what that value would be.
It has been a while since I took microeconomics but IIRC a fixed elasticity should produce a curve on a price vs quantity demanded graph.
I agree it will curve, but I have only a guess as to how to predict the shape. Do you remember how the curve was calculated?
This is what I think it will look like. I used a constant price elasticity of -0.6 So for each 10% price drop, quantity demanded will increase by 6%
Q
1000.00
1060.00
1123.60
1191.02
1262.48
1338.23
1418.52
1503.63
1593.85
P
10.00
9.00
8.10
7.29
6.56
5.90
5.31
4.78
4.30
Sorry I posted it one below the other. I don't know how to make a table.
I plotted this but could not paste the chart here. Not sure how to do it.
Srivathsa
Hi Srivathsa,
If you click on one of my graphs it should take you to the free photo site flikr where you can upload images and then link to them from the oil drum. A little awkward, but a picture is worth a thousand words they say.
http://fray.slate.com/discuss/forums/thread/1014950.aspx
That didn't take long!
http://www.charlierose.com/shows/2008/3/25/1/a-conversation-with-john-ho...
Not to be too snippy about it, but can we please avoid the habit of lumping all economists into the same bin with Darth Vader?
I'm a card-carrying economist, and I've run the site The Cost of Energy for over three years. I've written there (and given public presentations) endlessly about peak oil being a genuine phenomenon and only a few years away. I side with Skrebowski's 2011/2012 assessment, for the record.
Yes, I know that many of the most high-profile PO deniers are, in fact, economists. Trust me, I like that ugly reality a lot less than does any non-economist here. But there are those of us out here who understand what "finite" means and know that economic theory has to exist within and play by the rules created by the limits of non-renewable resources.
What's the website address I'd like to read some of that: PO from an economists perspective.
Next time I'll say something like 'the generally undertsood economic principle of XYZ'...
Nick.
You can find "The Cost of Energy : news, statistics, commentary, and activism" at http://www.grinzo.com/energy/
Not to be too snippy about it, but can we please avoid the habit of lumping all economists into the same bin with Darth Vader?
There are two kinds of Economists.
1. Those who believe in Peak Oil
2. Those who don't Believe in Peak Oil.
I read both kinds. But I temper the #1's opinions with the fact that "This Time It IS Different"
There are a few Econ types who know about peak oil
Actually, the two kinds are those who do and those who will. What fascinates me is how so many can look at the graphs of oil production, population and economic growth and still not get the importance of oil. Given the great usefulness of the stuff, replacing it is very difficult - shall we say a bumpy transition? - even in the best of circumstances.
Cheers
Very helpful graphs and summary Rembrandt - I really do look forward to this each month.
It looks like chart 60 (page 13 of the PDF), which shows Gabon's Jan '02 to Jan '08 production, is actually that for Egypt (i.e. chart 60 is the same as chart 58).
It will be interesting to see what will happen to Azerbaijan's production this year... explosive growth (roughly tripling from 2004 to 2007) now showing signs of decline and serious volatility. Anyone have specific knowledge of what's going on there and what we can expect?
@Pedestrian
I am glad that you find the oilwatch a useful source of information. You are correct regarding chart 60 and 58 being the same. For your convenience I have uploaded an updated version (2.0) with a correction to this error. Replacing the previous one at the link at the top of the article.
Azerbaijan is indeed interesting, they appear to be having some troubles with the Azeri-Chirag-Ghunashli project which with a combined reserves potential of 5 billion barrels or so should lead to a production of 1.3 million b/d around 2010/2011 or so, around which production peaks and starts to drop off according to present WoodMackenzie estimates. Another interpretation could be that they are having pipeline issues which could explain the rates of volatility.
I noticed that China production growth is slowing down, I think the ASPO and Skrebowski predicted a peak around 2007 but it's too early to say.
@Khebab
Difficult to tell what is going to happen in China. There isn't a lot of data out there which makes a good analysis possible. However, 11 of their 12 biggest fields are in decline (according to the financial times of today). The Chinese government themselves are expecting peak around 2012/2014 or so.
I don't have sufficient data either to make correct estimates about the situation there. What I do know is that Chinese production was overestimated in the past half year by the International Energy Agency as well as the Energy Information Administration, last month they both revised production figures from China downwards significantly (few hundred thousand barrels a day). Troubling development in any case.
In my opinion this is only one of the mistakes they have made and I think as I posted we are coming off peak. A way to see if this might be true is if we have see systematic downward revisions start showing up.
You can get the Chinese monthly production data directly by just going to China's Statistical Bureau website. You get access to much more data if you log in the Chinese language side (and it works better in IE than Firefox), but the English language side has monthly output numbers. February's is at http://www.stats.gov.cn/english/statisticaldata/monthlydata/t20080318_40....
China's peak forecast is a mere 80,000 b/d above their current production level, yet 6 years out. That's more of a plateau forecast than a peak.
OK. I know this is a little off topic, but I was wondering if anyone has heard rumblings on Barnett Shale. If so, does anyone know how extensive the production could be? Seems the industry is making a pretty substantial push in that direction.
Cheers.
Rob
Thank you for posting this, it is highly anticipated each month! I am confused by Chart 17, page 5, 2008 data line. Is this correct? It appears highly unusual. Please check this plot at your convenience.
@Bill.Harbert
The data here is correct, there is currently an unusual gasoline build up in the U.S. pre-summer driving season. Seems like the refiner guys are anticipating bigger then usual gasoline consumption in th months ahead.
Or probably more realistic lower than normal oil imports.
My tea leaves are saying we are coming off plateau heading down and at a fairly strong clip.
@ memmel
"clip" ... ??
Clip \Clip\ (kl[i^]p), v. i.
To move swiftly; -- usually with indefinite it.
[1913 Webster]
Straight flies as chek, and clips it down the wind.
--Dryden.
[1913 Webster]
Memmel's tea-leaves were once transported in tea clippers.
LOL, thx, got it...all my tealeaves in a row now ;-)
Thank you!
for oil or gas?
Both would be nice but any would help!
Cheers!
Westexas said this in yesterday's drumbeat
There's a few other related comments in the thread.
All liquids are not created equal, so the small rise in total liquids with crude still flatlining is not a good sign. Not to say crude extraction could still not rise from its current extended plateau since May of 05, but this May will mark the 3rd full year with no appreciable increase at the same time oil has reached record prices. If there are trillions more barrels of oil in the ground, like Exxon and CERA claim, then start bringing it to market! Otherwise, stop peddling double talk and join the Oil Drum message boards.
The ANWR field might hold billions of barrels of petroleum. If a law was passed to approve drilling tomorrow, it would take ten years to develop the field. Oil was discovered in the area offshore of the Mackenzie Delta by Devon but they might not be able to develop it until 2020. China made a substantial discovery in Bohai Bay, yet it will be years before they get full production. Deepwater drilling is one of the last frontiers for multi-billion barrel fields and trends. There are a limited number of rigs, the engineering for working thousands of feet below the surface of the sea in complete darkness and intense pressure is not cheap. Major projects cost billions. After lawsuits and increased taxes; only a limited number of projects may be funded each year. Environmental regulations cost more billions to implement. There are hundreds of billions of tons of coal in the world, yet only a few billion tons were taken each year. If the world is using 85 million barrels of liquids per day, that is 31 billion barrels per year. The world may be using a billion barrels of oil/liquids every 12 days.
@ rainsong
...and we shall conclude what from all this ??
Stock the Pantry, while you can
BZ
Sun_Tzu_Sun asked of rainsong,
"...and we shall conclude what from all this ??"
I found rainsong's analysis rather insightful, as a general overview, without being bombastic and opinionated.
Let me see if I drew any useful conclusions from his remarks:
First, he implied that there is still a considerable amount of oil known to exist that can be extracted, however, the difficulty factor and expense factor of extraction are increasing rapidly. "Duh" you may say, we all know that, but rainsong's post, short though it is, paints a much more valid view than that given by many on TOD, and a much more complex one than the oft described scenario of a sudden nosedive back to the stone age. It also describes a scenario of possible future "megaprojects" several decades into the future, We can assume that as current megaprojects are carried out and realized, that new ones are already on the drawing board.
However, the "peak" issue still looms large, just off the horizon. No one knows exactly when supply will simply not be able to keep up, despite the added production of new large projects all over the world. What we are hearing is the sound of a door sliding shut. We still have time to use the vast amounts of available fossil fuel to assist in making the transition away from fossil fuel, but time is getting short. The door is gliding closed. At some point, we will reach the "tipping point" and the network of easy communication, development, education and technical advance will be at risk of breaking down, and then the opportunity for conversion will be lost, perhaps for decades, perhaps for good. We are fiddling about, arguing, and in delay, we risk placing the most advanced technological culture in history in jeopardy.
Those who take a dark view may believe that we are at if not already past the tipping point. There are those who believe that making the effort to salvage what I have described above as "the most advanced technological culture in history" is not a desirable goal, and instead of fixing the problem, only allows an undesirable way of life and philosophy of life to soldiar on.
Be that as it may, time, not oil, is now the commodity in short supply. The transition away from the waseful burning of fossil fuel is already underway, and the value of petroleum is now being understood in it's unique chemical properties, as a tool to transition to a new form of energy production and use. The question is, did we make the break toward the closing door soon enough, and are we running fast enough? Only time will tell, but we cannot afford to wait for the answer. We must build the answer now. We cannot afford to waste oil, gas, or other fossil fuels, but much less so can we afford to waste time. The work of a thousand years is at stake.
RC
RC
The high cost of oil was allowing people to try to find it in places they would not have looked before.
On the other hand OPEC was rumored to be capable of reaching 5 million barrels a day spare capacity in 2008.
http://www.energyintel.com/documentdetail.asp?document_id=210901
Iraq was rumored to be doubling oil production capacity.
Previously I had read UAE expected to develop peak capacity of 3.5-4.0 million barrels per day, more recently I read someone expects 5 million barrels a day peak capacity from the UAE. A few years ago there was a rumor out of Saudi Arabia that they would develop capacity of 15 million barrels a day and sustain such production for decades. Others pointed out that the average production per well in Saudi Arabia was once 10,000 barrels a day, but more recently was 500 barrels per day. This is a signal of the inevitable decline of production there. The timing of such is a subject of much speculation.
It is true one should not waste anything, in reality many people would like to be able to afford more things. One educated with knowledge of peak oil might change the lifestyle in order to be able survive long term trends towards higher energy prices. These prices sometimes get too high and then they go down again as we saw yesterday.
Well, the insurgents and gangs will be happy to have more stuff to bunker from the pipelines!
When you total the liquids produced, are you taking into account the NG and other energy inputs used to produce some of the more difficult to get liquids? For example, tar sands and ethanol, as well as deep-sea oil, obviously require substantial energy inputs.
For that matter, some portion of the total liquid fuel produced is actually used to produce other liquid fuel, leading to double counting.
Is it feasible to estimate net BOE equivalent as opposed to gross production?
Well we can estimate it. In general this has always been true. Oil is one of the largest industries in the world if not the largest. The problem is not the double counting but that its been growing. And the problem with that is its difficult to measure the cost in the first place much less growth.
I'll give you a simple example now that onshore and near shore oil has been depleted people are working far off shore and more in remote regions. The cost in fuel for transport alone in these situations is probably substantial.
But since it was never calculated to begin with the growth is tough to figure.
But its pretty obvious that both monetary and energy costs have probably increased substantially.
Also of course steel is not free and deep offshore rigs are large installations.
The Cleveland & Costanza study found that offshore NatGas never rose above 13:1 EROI. Deep offshore will be lower. At 10:1 then you would cut the volume numbers by 10%.
As a rough approximation, just cut all non-conventional oil sources by 2/3 as most are lower energy density or take more energy to produce. That lowers the numbers by 30%.
I think it is important to separate crude from other sources because once you remove tar sands from conventional oil then the 2005 peak stands above current spare capacity. Meaning that 2005 is likely the all time crude peak.
Hmm given your numbers and assuming the same 30% probably applies to oil. Almost all our price increases can be attributed to EROI issues and unmet demand. We haven't really felt the bite of Export Land yet. Although it seems to be coming into play this year. So assuming I'm right that we go off our plataue this year and start seeing a measurable decline in oil and see Export Land pickup.
200+ dollar oil by the end of the year is not impossible. I'd be surprised to see oil under 150 by the end of the year. The only caveat is if the current high prices will ensure enough project come on stream this year coupled with slowing economies dropping demand.