| DrumBeat: January 6, 2009 | The Oil Drum | Natural Gas and Credit Situation - Nate Hagens Interview on Global Public Media |
Financial Forecast for 2009, Considering Resource Limitations
Posted by Gail the Actuary on January 6, 2009 - 11:10am
In this post, I consider some major issues contributing to our current financial problems, before making a financial forecast for 2009. These are
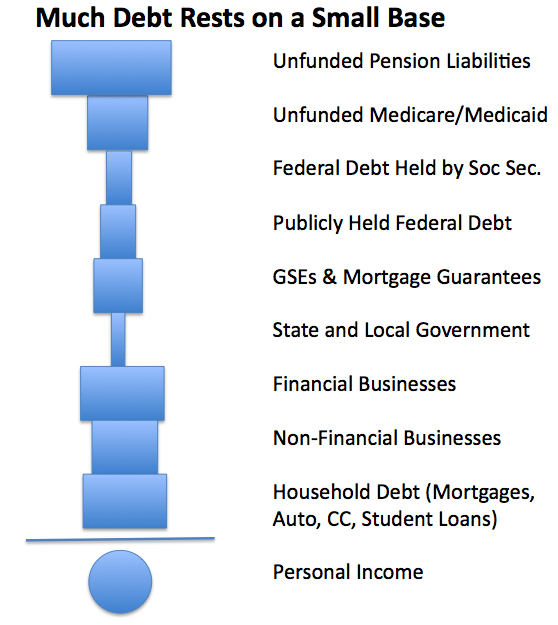
1. Why so many asset classes are so highly correlated in times of distress. This chart gives my interpretation of part of the problem.
2. Why growth is essential for keeping the current debt-based financial system operating.
3. Where we are now, and the role reduced resources (including peak oil) are likely to play as we go forward.
4. My forecast for 2009.
1. Why so many asset classes are highly correlated in times of distress.
We keep hearing about plans to stimulate the "consumer" to buy more. Until I stopped to think about it, it wasn't obvious to me that the consumer (or perhaps I should say, ordinary citizen), and his ability to purchase goods and services are key to keeping the whole system going. These connections include:
1. Adequate income is needed for a citizen to repay the debt he already has.
2. Some of the "higher level" debt in the tower in Figure 1 is simply debt from one of the lower levels, recycled on someone else's balance sheet.
3. Revenues from ordinary citizens support the businesses and governments that have loans higher up on the "tower", and are critical to these organizations' ability to repay their own debt.
It is only when the system is under stress, and shortfalls in income of the ordinary citizen start shaking the system, that these connections becomes clearer. Let's look at the debt shown in Figure 1 by layer, starting from the bottom:
Layer 1. Household Debt (Mortgages, auto loans, credit card debt, student loans). Adequate income is needed for citizens to repay these loans. Also, if ordinary citizens have adequate incomes, this helps to keep demand for houses up, which in turn helps to keep the prices for houses up. These higher prices allow citizens to borrow more against their homes, and use this revenue to purchase even more, helping prop up businesses from which they buy goods and services. If the prices of homes drop because of inadequate demand, huge problems develop, as we are now acutely aware.
Layer 2. Debt of Non-Financial Businesses. This would include loans for companies like GM and Ford and mortgage loans for restaurants. It might include debt for casinos, and debt for church buildings. All of these businesses are directly or indirectly dependent on wage-earners having enough money to buy their products, or contribute their Sunday offerings, in order that they can repay their loans. Even if a business only sells its service to other businesses, it is a part of a chain of businesses that at its base is dependent on customers buying its goods and services.
Layer 3. Debt of Financial Businesses. To a significant extent, this is just recycled debt from the first two layers. What happens is that an individual or business borrows from a financial institution, for example a commercial mortgage or credit card debt. The financial institution repackages the debt (sometimes first slicing and dicing it) and lays it off again. If one of the first two layers defaults, then the third layer is likely to default as well.
Layer 4. Debt of State and Local governments. In a way, these governments are service providers. They collect money from their citizens one way or another (property tax, sales tax, tolls on roads, lottery tickets) to pay for the services they provide. If citizens are laid off, or are working for lower paid jobs, they will pay lower taxes to the state. Also, if the citizens don't bid up the prices of houses, it is difficult to collect as high property taxes on them. Some of a state's services, like unemployment compensation and health services for the poor, may increase in bad times.
Layer 5. Government Guaranteed Mortgages. This is just a recycled version of part of the mortgages in Layer 1, including those held by Fannie and Freddie, and those indirectly guaranteed by Fannie and Freddie. If the Layer 1 mortgages default (or are reduced because of "cram down" provisions), Layer 5 mortgages will almost certainly have problems as well.
Layers 6 and 7. Different Versions of Federal Debt. The Federal Government obtains most of its revenues from taxes of individuals. If citizens are earning less money, it is difficult to continue collecting as much taxes. Some of the taxes come from businesses, but to earn money to pay taxes, businesses have to sell some goods or services to the public. If citizens are short of funds to buy goods and services, the profits of businesses will be lower, and the revenues from taxes on these businesses is likely to be lower as well.
Layer 8. Unfunded Medicare / Medicaid. These are promises made to individuals that will eventually have to be paid for by someone. Ultimately, the funding for these will have to come from taxpayers, which for the most part are ordinary citizens.
Layer 9. Unfunded Pension Plan Amounts. Pensions are funded by a combination of investments in bonds, stocks and other securities. To the extent that these securities have performed poorly, there will be a shortfall in funding. The events of the last year will cause many pension plans to be in poor shape, because they hold debt shown in the tower in Figure 1 and some of it is defaulting. If additional contributions from the organization setting up the pension plan become necessary, these funds will ultimately have to come from a taxpayer (if it is a local government) or a purchaser of goods or services (if it is a business).
The above list relates only to debt and promises to pay, but other financial assets are affected as well. The value of stocks is likely to decrease if people aren't buying a company's goods and services because of inadequate income. Insurance companies will have financial difficulties, because they tend to hold many bonds which decline in value as defaults increase. Hedge funds hold a mixture of asset types, but are also likely to be affected. Derivatives vary in what they cover, but some of these will also be affected by debt defaults related to inadequate consumer income. While this list is not exhaustive, it gives an idea why inadequate income by the ordinary consumer is likely to ripple though the system in many ways.
I would note too that there are a lot of feedback loops in the tower. When things are very good, the feedback loops tend to make things look very, very good (higher wages-> higher spending -> profitable businesses -> more hiring -> rising home prices -> less need for government programs). These same feedback loops work the opposite direction when things are bad (layoffs, for example), making a bad economic scenario truly terrible. The huge tower is also expensive to maintain, and takes resources from productive uses, like building infrastructure and new factories. As more and more layers are added to the tower (like TARP), the tower becomes more and more unstable, and more and more likely to have big reactions to small events.
2. Why growth is essential to keeping the current debt-based financial system operating.
Perhaps the easiest way to see that growth is essential to repayment of debt is to think about the government's borrowing to bail the United States out of our current financial predicament. As with the vast majority of debt, the debt is not really for an investment that will add value in any real sense (more goods and services manufactured). Instead, it represents time-shifting of payments to the future, with an interest charge for this time shifting. In the case of the government spending, it is not even clear that all of the spending will be particularly beneficial. When previous stimulus checks were sent, some of the money was spent on goods imported from China, helping the Chinese economy. Also, some of the additional borrowing ended up in the pockets of high-paid financial executives who likely will not spend it on another car or house, since they already have more money than they are able to spend.
Think about the additional debt from the perspective of a typical wage-earner. Suppose the typical wage-earner's income is 100 units in 2007, 105 in 2008, 110 in 2009, 115 in 2010, 120 in 2011, and so on. If the government spends the equivalent of 10 units on the bailout (the wage-earner's share of the total), and gives the wage earner 3 units of it back as a stimulus check in 2009, the wage-earner's 2009 income will equal 110 + 3 = 113 with the stimulus check. It should not be too onerous a task to pay the 10 units back through higher future taxes, since the wage-earner's income will be higher in future years, and he can use part of that increased income to pay the 10 back. With interest, the total amount to be re-paid may amount to 11 or 12 or 13, but even this may not be too onerous, because of rising income. Additionally, there may be the possibility of "rolling the debt forward", and not really repaying it, saving it for society's grandchildren, since it looks like the future is getting better and better.
Suppose on the other hand that the typical wage-earner's income is 100 in 2007, 98 in 2008, 96 in 2009, 94 in 2010, 92 in 2011, and so on. If the government spends the equivalent of 10 units on a bailout, and gives the wage-earner 3 units of it back as a stimulus check in 2009, the 3 units added to the 96 units will bring the wage-earner almost back up to where he was in 2007, (since 96 +3 = 99). The difficulty comes in paying back the 10 (or 11 or 12 or 13) units, because these will need to be subtracted from the wage-earner's lower future income, putting him in progressively worse financial shape. Also, the possibility of "rolling the debt forward" is likely to go away, since those buying government bonds will figure out that in 2020, when the typical wage-earner's income is down to 74, the chance of the wage-earner using part of that income to repay the debt from 2009 is pretty poor.
Because of these issues, the amount of debt a declining economy can support is much lower than the amount a rising economy can support. It seems to me that if there is no interest to pay, time shifting works well in a flat economy (as in 5,000 year ago). If there is interest to pay, time-shifting works as long as the growth rate is equal to the "real" interest rate. If there is a long-term decline in the economy, (something never really experienced in the past), time shifting generally doesn't work well.
If an investment truly generates a return rather than simply time-shifts (a factory rather than a mortgage), it may be possible to use debt in a period of economic decline, but interest rates will need to be much higher (quite possibly 15%+) because of a much higher risk of default. Such high interest rates are likely to make most potential investments no longer profitable. As a result, I would expect that the total amount of debt in a declining economy would be much less than today--probably less than 10% of the current total debt load.
3. Where we are now, and the role reduced resources (including peak oil) are likely to play as we go forward.
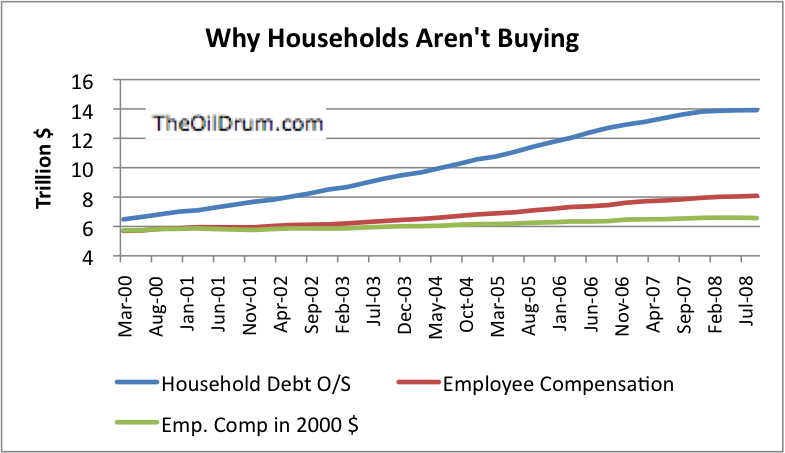
This graph gives an indication as to the problem. Employee compensation has been fairly flat since 2000. The situation for many employees is likely quite a bit worse than what the graph would suggest when one considers that (1) the wages I show in 2000 $ are adjusted using the US GNP deflator, and the actual inflation rate is likely higher, so the trend in wages in 2000 $ is likely lower than that shown; (2) the increase shown includes population growth of about 1% per year rather than being on a per capita basis; and (3) pay changes have not been the same for all employees. In general, higher paid employees have tended to fare better than the rank and file (rising Gini Coefficient). Now that major layoffs are starting, the situation is worse than shown on the graph. Taxation policies have tended to reinforce the trend toward lower spendable income for the middle and lower classes, with most tax cuts since 2000 favoring the wealthy.
The reason the economy appeared to do quite well between 2000 and 2007 was the increase in household debt. With greater debt, families were able to buy more from business, keeping businesses profits high. Prices of houses also rose. The higher home prices allowed people to remove more equity from their houses, and use this equity to spend even more. In addition, the stock market was rising in 2002 to 2007, also contributing to the feeling of wealth.
The amount of additional spendable income available from (1) the increasing debt and (2) the money people could take out from the equity on their homes was truly phenomenal. Figure 2 indicates additional debt amounted to about $1 trillion a year. Also, as the value of homes inflated, people were able to refinance loans and use the additional cash to for buying other goods. The amount of home inflation was of the order of magnitude of $1 trillion a year, and this was available to homeowners to extract, theoretically making a total of up to $2 trillion a year. Funds available in these two ways (higher debt and equity extraction) were generally not subject to income tax, so the impact was even greater than if they had been added to wages. Employee compensation during this period was only $6 to $8 trillion a year, so the impact was very large.
Figure 2 shows that there was a sharp change, starting in late 2007. The total amount of household debt flattened, cutting out the less credit-worthy from buying more goods. Other factors not shown on the graph also had an effect. The prices of food and energy products rose, putting a strain on the finances of families, and causing debt defaults. In addition, homeowners were forced to stop padding their spending by taking more equity out from the value of their homes, because by then the value of their homes was falling, rather than rising. All of these factors provided a sharp contrast to the very favorable dynamic that existed when household debt was rising rapidly.
I expect that Greenspan and other financial leaders engineered much of the debt-driven growth in the 2000 to 2007 period when they realized that underlying growth rate was very low. Now we are hitting the "no free lunch" time. The attempt to pump up growth in the 2000 to 2007 period using additional debt could only produce a temporary fix, and that fix is falling apart. The fact that wages weren't really growing much in "real" terms suggests that there was an underlying problem that more and more debt could only temporarily disguise, but could not really fix.
A big piece of the problem is that energy consumption in the US has not been growing very rapidly since 2000, and we know from the work of Robert Ayres and Benjamin Warr that there is a close tie between energy use, increase in energy efficiency, and economic growth.
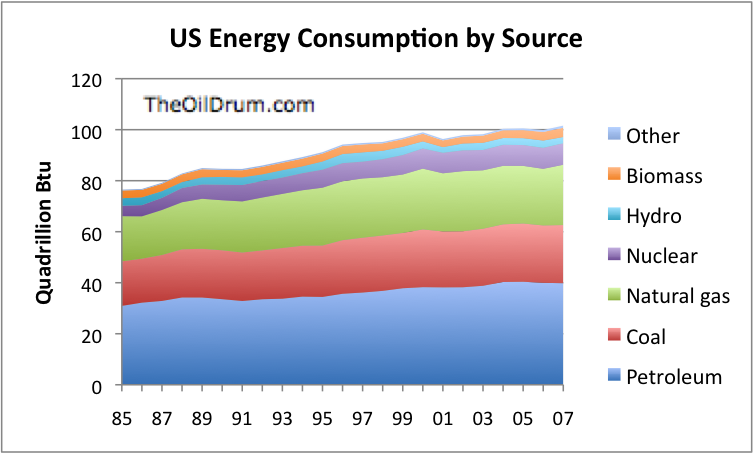
Between 1985 and 2000, US energy consumption (all fuels combined) grew by an average of 1.7% per year; between 2000 and 2007, US energy consumption grew by an average of 0.4% per year. On a per capita basis, energy consumption was actually declining between 2000 and 2007. Energy consumption through September 2008 is down about 2% from 2007 (about 3% on a per capita basis).
Another part of the problem is that a larger and larger share of US energy consumption has been coming from imports (Figure 4), and the US has been becoming less and less able to pay for these imports, as evidenced by its ballooning balance of payment deficit. If the US had been able to import energy, use the energy to produce products that were worth a great deal more, and export those products, the US would not have had this problem.
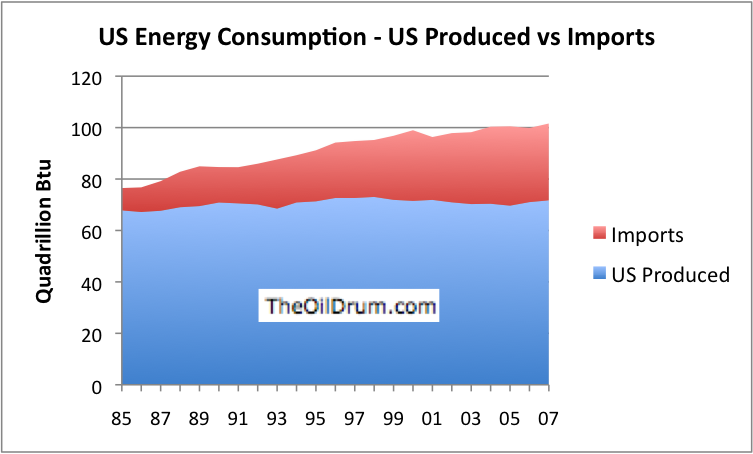
It appears to me that the US is rapidly reaching "peak energy", whether or not the world is reaching peak energy. What drives this peak is the economics of the situation--we are not producing enough goods and services with the fuels that we are importing to justify their continued importation. Also, even US produced natural gas from unconventional sources is becoming too expensive for the economy to afford. We have been in a type of overshoot in terms of buying more energy products than we really had funds for. The spike in prices for oil this summer helped force the issue. With the higher prices of oil and food, some people at the margin could no longer pay their mortgages, and the situation began to unwind.
Now with the lower prices of energy products, world oil production is starting to drop back. Demand is dropping off, because consumers are not able to borrow as much, and thus cannot buy as many goods and services requiring oil to produce. It is likely that US oil use will drop in years ahead, because of these factors. US natural gas production will also decline, because most of the new sources of natural gas are high priced sources (low Energy Return on Energy Invested sources), and consumers cannot afford the high cost of energy from these sources.
When the US faced a situation with declining energy availability in the 1970s, it was able to make changes to improve energy efficiency and to shift production of heavy goods offshore, and thus mitigate the impact of the decline in energy on economic growth. It seems unlikely that we will be able to do as much this time around. For one thing, the easy solutions have already been implemented. For another, US energy efficiency gains have only been about 2% per year in recent years. It will take capital (which is difficult to obtain now) to even maintain this kind of efficiency growth. Also, oil and gas are becoming more and more difficult to produce, meaning that a greater share of the oil and gas that is produced will need to be used in production of these fuels, leaving less for other uses.
The US economy has barely been growing between 2000 and 2008, apart from debt-induced growth; it has not been growing enough to produce much gain in the compensation of employees. If energy consumption declines from the level it is at today, it is likely that real growth will be even lower than it is today. Based of the discussion in (2) regarding how essential growth is for the repayment of debt, this suggests that it will be extremely difficult to pay back all of the debt that is currently outstanding. The existence of the close inter-relationship between all of the types of debt shown in Figure 1 suggests that there may be defaults on many of these types of debt simultaneously, and the same factors that caused debt defaults may affect other classes of assets as well.
4. My forecast for 2009.
It looks to me as though that we are due for a debt unwind, and with it a rapid decline in the US standard of living. Exactly what form it will take, and what the timing will be (for example, sudden one month from now or sudden three years from now, or gradual over a longer period), isn't certain. I would expect that many (or most) other economies in the world will be dragged along in this debt unwind and will experience a decline in their standards of living.
As I note in the Section 1 discussing why so many asset classes are correlated in time of stress, the tower of debt (Figure 1) has many feedback loops, and tends to magnify the economy's reaction to events, both favorable and unfavorable. When consumer debt is rising it tends to make the economy look very, very good. When there are layoffs, the interrelationships tend to magnify the impact, making the economic impact much worse. One wonders whether there are tipping points, beyond which it is not really possible for the system to recover--particularly now that the US seems to be at the point of "peak energy" (Section 3), energy is required for growth (Section 3), and growth is required to allow debt to continue (Section 2).
The tower of debt is in some ways deceptive. It can make the economy look mostly OK to the casual observer, until all too quickly, things start to fall apart.
So far, the "fixes" that the US government has been attempting seem mostly counterproductive. Putting government guarantees behind more and more debt (thus stacking Figure 1 higher and higher, with a new TARP layer) just increases the likelihood that the US government will be drawn into the downward spiral. The financial services layer will be less and less needed in years ahead, as our need for debt-based products declines. Bailing it out does not help get additional income to ordinary workers (although it may temporarily protect them from losing their bank account balances).
I expect that essentially all aspects of finances will be affected by the unwind of debt. A huge amount of debt will be defaulted on (or will be forgiven, so that an actual default does not need to occur). Regardless of whether the non-payment occurs because of default or forgiveness, the effect on financial institutions will be the same. Financial institutions such as banks, insurance companies, pension funds, and many hedge funds will find themselves in poor financial condition, because they were depending on the proceeds of this debt repayment to fund what they have promised--bank account balances; insurance policies; pension payments; or hedge fund returns. Institutions guaranteeing debt, such as monoline bond insurers will be particularly hard hit. The FDIC will likely be called on to rescue many failed banks, and will need to find funds from some source (printed money?) to do this.
As the year goes on, I expect each evaluation of where we are to be worse. Banks will report operating losses each quarter. Fannie and Freddie will need more funds than originally thought. TARP will need more funds than original planned. More and more businesses will enter bankruptcy, and more and more governments (states, cities, counties, and countries around the world) will find themselves unable to meet their obligations. There are a huge number of inter-relationships, and the bankruptcies and losses in one area will tend to cause more bankruptcies and losses in other areas, and act to destabilize the debt tower.
Debt of all forms will be very difficult to obtain, except through government sources. The interest rate the US government is currently paying is very low, mainly because of a "flight to quality". If the US government keeps issuing more and more debt, it seems likely that at some point this will change, because buyers will figure out that even if the US is the best of a bad lot, its risk of failure is significantly greater than 0%.
I do not expect a steep rise in the price of oil and natural gas in the next year, because the decline in demand is likely to outpace the decline in production in the short-term. If we look back at Figure 2, I expect that funds available to ordinary citizens will continue to decline in 2009, even considering any stimulus plan. This will happen because employee compensation will decline due to layoffs. Household debt outstanding will also decline (rather than just stay flat, as it has in the past year), because of the poor financial condition of lending institutions, and because with the poor economy, the risk of borrower default will be quite high, discouraging lending. A $300 billion stimulus program will be tiny in comparison to the boost the economy got in the past from increasing debt and greater refinancing (up to $2 trillion per year), as the prices of homes increased. With lower incomes, lower (actually net negative) cash flow from borrowing, and only a modest boost from a stimulus program, citizens will have less and less to spend on goods and services.
I think there is a distinct possibility that this could all end very badly. One possibility is that there will be more and more defaults, and the US government will not be able to prop up all of the institutions and will eventually default on its debt. While this seems to be the direction things are headed at the current time, the much more usual outcome is hyperinflation, caused by printing more and more money, wiping out the value of people's savings and pensions. Situations such as these are often accompanied by a new government (including a new constitution), and may even include different country boundaries (for example, Soviet Union after its fall).
Many people have started making preparation for the time when food needs to be produced locally and electricity is often not available. I would not discourage such preparations. While we do not know that the economy will collapse completely, I think such preparations are prudent, in the face of rising risk. Preparation for a major change takes many years, so starting earlier rather than later makes sense. Also, with the tower of debt (Figure 1) and the many feedback loops, the downward spiral can happen more quickly than our prior experience suggests is possible.
To solve our current financial problems, I expect that the United States (and other countries) will ultimately need a new financial system that is much less debt based. Such a system might start simply as ration coupons for food and energy products, and gradually be expanded to replace our current monetary system. Debt forgiveness and derivative write downs will also probably need to be part of the solution, but with the caveat that debt forgiveness and derivative write downs can be expected to have just as adverse an effect on the balance sheets of financial institutions as outright defaults. In conclusion, 2009 looks like to be a very challenging year for the new administration and for the world as a whole.
Last year's forecast: Peak Oil and the Financial Markets: A Forecast for 2008
Contact
- Content: editors at theoildrum dot com
- Tech support: support at theoildrum dot com
License

This work is licensed under a Creative Commons Attribution-Share Alike 3.0 United States License.
Thanks, Gail. I'd been waiting impatiently to view your prognostications for the year.
This year's assessment is at least as dire as yours from last year, but perhaps not as detailed.
Do you have a sense of timing or sequencing? Will commercial real estate collapse before bonds go?
Where will unemployment end up? Will we get off with "just" 11 percent? Or will it go to 25%?
To me it feels like we're sandbagging against a growing surge. Each new bailout provides a new supply of bags, but the baggers are getting tired yet the flood is rising. Before too long a levee here or there will be allowed to fail, in order to relieve some pressure and permit focus on another area, but even then the water will keep rising.
Perhaps all that bailouts will due is slow the faults, so that people have a bit more time to adjust. Some items like debt can be addressed to a degree through financial discipline. Unfortunately, job losses are hard to evade, and home value losses will accrue to somebody's balance sheet -- I may sell mine in time, but the poor sucker who buys it will then eat the drop.
Regarding where we are going, I think we tend to be very tied to our past experience. We tend to think that if unemployment only went to 11% in a past recession, that is as high as is it will go. I expect what we are doing is moving on a continuum from 100% (or 94%) of us being employed in today's types of institutions, to 100% working at self-sustaining occupations which may not even be counted in today's estimates of what the economy looks like. We could very well end up with 25% of the people losing their jobs in today's economy, in 2009 or 2010. Some of them may figure out a way to do something that doesn't fit in today's economy. Some may grow more o their own food; some may (illegally) work on dismantling buildings that are no longer being used, and selling the scrap for other uses. In the years ahead, I don't see the traditional unemployment rate as going back down, just more jobs moving to the currently uncounted sector.
Regarding what happens first, the problem is that everything is so interconnected that what happens first is almost irrelevant. Perhaps commercial real estate collapses three to six months before bonds, or perhaps it works the other way around. Everything is so inter-connected that each decline helps bring on another decline. If you are thinking that you can put your money in one area, then quickly move it to another, I doubt that you will really be able to accomplish what you plan.
Thanks for the reply.
I wonder if the unemployment rate will also degrade in meaning as the underemployed will grow -- an unemployed banker working as a grocery stocker is "employed" officially, but perhaps not in his view.
I wonder if the collapse of the two-earner family may occur as well, as the combination of lower wages and harder work may well push second-earners back home to help save money (clipping coupons, cooking from scratch, avoiding childcare bills, etc.). A single-wage-earner may travel to find work as well, and send money home to the "wife and kids". I can't see a lot of companies paying relo in a worker-abundant market, and moving a household may be an expensive risk just to follow work, but commuting for contract work, seasonal farm work, hurricane repair, etc. might make good sense for some.
"Betting the farm" on timing or even deflation/inflation seems like an unacceptable risk to me (see other comments in this thread). I'm going to sock away cash to the extent possible, and consolidate real-estate (fewer properties with few/no loans rather than more properties with several loans). It's a deflationary strategy, really, but "safe". Beyond that I just want to stay employed -- that seems like the most important "protection" you can have whether markets are deflationary or inflationary.
Highly unlikely any ex- bank worker will get a job as a shelf stocker, as the retail sector will be forever shrinking too. Those people I saw in their last days at Woolworths will never have a job again, I reckon (though I could not bring myself to tell them).
And not just the collapse of two-earner families. The sums will cease to add up. All sorts of households will go bust, start to starve and become ill, and resort to suicide if not dead by other means first. "Wealthy" people will not be exempt from this, as their wealth is a mere figment of imaginations of varying enthusiasm.
The big question is what do I do with my limited retirement funds? So far i am paralyzed with indecision.
Can't TOD produce some articles on this subject?
I think the point is that almost any paper investment will not work, and you cannot expect government or insurance to provide very much. I expect most of us will end up working as long as we are able. If we can team up with children or other younger relatives, that could be helpful.
There might be some things that one can buy that will be helpful for barter. Some argue that physical gold and silver will be helpful. Small, useful objects would seem to be even better (bottles of liquor; medicine; canned food).
Buying land, tools and seed theoretically might work, if we can also learn the necessary skills, can deal with all of the needed inputs (water and compost particularly, also ways of repelling insects and animals), and keep others from stealing what we produce and the government from reneging on our ability to keep the land.
We have started the Campfire series of posts (Wed evenings and Saturdays), dealing with some of the practical aspects of what may be ahead.
I am assuming that at some point in the next decade, the US government will realize that it cannot possibly make good on Social Security as presently configured. What I expect to see happen is that everyone will just get a minimum amount each month, regardless of prior earnings and contributions. This minimum will be pretty low, and become ever-lower in terms of real purchasing power. Someday it might go away completely.
I also expect that the federal or state governments will increasingly rely on institutionalized programs to deliver food and shelter to those who are unable to live on whatever money they have. The feeling will be that living on one's own in one's own home is a luxury, not a right, and if one doesn't have enough money to afford it, then it is not an increasingly impoverished society's obligation to provide it.
Thus, for those of us approaching retirement, I suggest the following:
1) You MUST liquidate all debts, and own your home free and clear. Don't even THINK of retiring unless and until you are at this point.
2) Try to set yourself up to raise as much of your own food as possible, make your home as energy efficient as possible, and invest in renewable energy if possible. You want to minimize your dependence upon and vulnerability to food and energy supplies.
3) Be prepared to do SOMETHING to bring in some money (or bartered goods) for as long as possible. This might be something different than you are doing now. Forget about "retirement" from all work; at best you might be able to shift to a different and less physically demanding type of work.
4) Reconfiguring one's home so that one can take in a renter is a good idea. Not only will this bring in enough money to help cover property taxes, there are also advantages in having more hands around the house as one gets older.
5) As far as your finances are concerned, don't put all your eggs in one basket, and live below your means. You need multiple retirement income assets, and need to assume that some will lose value or might go away entirely. You need to live on less than what your retirement assets could provide initially, because you might have less in the future.
Are you referring to all debts, or just the secured ones? Credit cards, not being secured, don't provide a creditor much remedy to get their money back. Not being an expert in Cred Rem, (never took the course in law school, not my interest then, wish I had now) it appears it would be difficult to go after real property to satisfy a credit card debt. I'm guessing a lot of this debt will go up in smoke.
I personally have followed this, but I am not as certain that liquidating all debts is necessarily helpful. If the US government has huge debts, it will work as hard as it can at inflating those away (pay them back, but in dollars that aren't worth much). Also, if we go to a new monetary system (similar to rationing coupons), who owes what in the old monetary system may not make all that much difference.
I come at this from a different direction. I assume that as one enters what we presently know as "retirement age", one's ability to adjust to changing circumstances becomes increasingly constrained. For example, it is fine to say that one simply will not retire and just keep working. Unforunately, your body just might not cooperate with that plan, and employers might not be very keen on it either. Thus, I am suggesting that one forgo the temptation to game the system, and just try to minimize one's vulnerabilities.
That probably is the smart choice, and the one I'm taking. However in a situation in which one has to make the choice between paying off unsecured debt, especially if it was made for an emergency such as unforeseen medical bills, versus paying day to day bills or keeping some cash stashed in a secure place to give one some flexibility, I'd go for the latter, and consider bankruptcy as an option. What good is being debt free if the credit market has collapsed and you have no cash or assets to help you through?
The ideal would be to pay off the credit cards AND have cash, but if the former is isn't possible in a reasonable time frame I'd rather have cash on hand, too. Thus I'm "hoarding" cash right now and will get back to paying down the credit cards once I've reached a certain level of cash.
The cash hoarding would go quicker except that I'm also making other preparations i.e. building my personal library, stocking the disaster kit (which got up there in $$'s once I was done), etc.
WNC, realistically, I think that the longer term future of baby boomers is something like what happened in Russia - they now will need to rely on their children or other family members, or on non-family relationships that trade long-term support for home and land. I don't think that most older people will be physically or economically able to go it alone - Orlov observed that this was particularly tough on the grandparents who had been able to help their children and now depended on them. Elder work is often likely to be child care so that the adult children can bring in income - I expect to see a lot of older folks lose jobs and never be able to find them again. Cottage industries are good too.
I agree strongly about paying off the house - because boomers have a disproportionate portion of wealth, and frankly, there's a good chance their kids and grandkids are going to be living in it with them. The family home and its capacity to produce food and cottage industry will probably matter a lot more than it has.
But if I had to add a number to that list, it would be "begin to get along with your family." Right now with one exception, our parents are all comparatively more affluent than we are - but they rely on invested funds, not on earned income, and I have long term concerns about what they will live on. I'm not a totally atypical case - my husband and I between us, in our mid-thirties have 7 parents - divorce and remarriage on both sides. For my husband's four parents, he is an only child. Our personal nightmare ;-) is the arrival of previously divorced exes, all in crisis.
Sharon
Should we see a collapse of biblical proportions, on the order of something between the Dark Ages (though a bit of a misnomer) and the Stone Age, I wonder if the practice of discarding the infirm and unproductive might begin to arise? Seems euthanasia and suicide might become more accepted options for the formerly-affluent current generations unable to cope well with the reduced standard of living.
Caveat: unlike many, I see the only things preventing everyone being well-fed are ignorance of farming methods, politics and Big Money. It is, in my opinion, absurdly easy to feed all 6.7 persons currently alive. However, people (in the sense of the entirety of humanity, are selfish and stupid, so...) Thatis to say, I am not advocating the above measures in any way, shape, or form.
Cheers
I agree. I consider myself a techno-cornucopian, and a political doomer.
We could solve these problems, but we won't.
That's really the most frustrating part of all of this. It doesn't have to be this way, but it will.
You and I might disagree on the level of mitigation possible but more and more I think it's moot.
Politics are barrier 1
Disaster capitalists are barrier 2
Foreign bad actors are barrier 3
Mix this all in with a healthy dose of denial, BAU and a credit crisis and I think we're toast.
Gail, I'm thinking you are considering this from the individual's point of view. Consider the point of view of the economy as a whole - another way of looking at the same picture:
Every dollar is a claim on future resources. In a world of limits, those dollars have to be generated by grinding up a smaller and smaller resource base even while carrying a larger and larger overhead. 2007 showed some sort of limits beginning to shut down consumption. Imagine the Easter Islanders taking out a loan to increase the production of bigger stone heads. Of course, all the masons and woodcutters need work, right? And consider, that is precisely the solution offered by the economic stimulus packages. We're dumping our children into a world where they will have less of everything and have to grind up more of those resources to make the payments.
An intuitive argument, I'll admit. One I used in a letter to editor today about Maine's budget mess.
It's time to "pay it forward".
cfm in Gray, ME
I am afraid our financial people (and I am one of them) are the ones that the government seems to think it needs to bail out. Most of the "products" that we make are about as useful long-term as bigger stone heads. They only work in a growing economy.
What's ahead doesn't look good.
Very interesting piece.
The people in charge are basically doing what they say they are going to do. That is, the expressed jobs of the Fed and the Treasury are basically to protect the financial system and growth. From their respective Mission Statements (emphasis added)...
Fed Mission (http://www.federalreserve.gov/aboutthefed/mission.htm):
Treasury Mission(http://www.ustreas.gov/education/duties/)
The people controlling the "fixes" are not trying to fix what is really broken, they are trying to preserve it! Neither the Fed or the Treasury is the least bit interested in examining the possibility that the fundamental economic structure is flawed. And, frankly, given their mission, that is not their job. Their job is not to figure out an economy that works, but to protect the one we have. If we are looking for "fixes" we will need to look elsewhere.
Brian
I wouldn't expect to find "find new sources of cheap plentiful energy" in there but that would probably achieve some of their job for them too...
Nick.
New sources of cheap plentiful energy is fast neutron breeder nuclear power plants. Such reactors designed to breed fuel by producing more fissile material than it consumes.
How about building some giant 100 GWt plants on ocean floor (or shelf) for security reasons?
Russia planned start to build commercial prototype 1.8 GWt (BN1800) fast neutron breeder nuclear power plant near Zarechny, Sverdlovsk Oblast in 2012. One prototype 0.8 GWt (BN800) already in building phase and get operation in 2012.
Good points, Brian. These are among the reasons I found this paragraph in the otherwise-awesome (as usual) post by Gail to be rather naive:
"So far, the "fixes" that the US government has been attempting seem mostly counterproductive. Putting government guarantees behind more and more debt (thus stacking Figure 1 higher and higher, with a new TARP layer) just increases the likelihood that the US government will be drawn into the downward spiral. The financial services layer will be less and less needed in years ahead, as our need for debt-based products declines. Bailing it out does not help get additional income to ordinary workers (although it may temporarily protect them from losing their bank account balances)."
The fixes are counterproductive only if you think the real underlying goal was to help anyone other than bankers, hedge fund managers and other types. Paulson is saving his own kind, the rest of us be damned. In spite of some rhetoric to the contrary, the "ordinary worker" is not represented at all well in our system--there is no labor or workers party, and organized labor is notoriously weak.
I have no great faith that the new administration will do much better--Paulson is being replaced by his partner in crime. Perhaps that will depend on the rapidly changing circumstances so eloquently described by Gail, as well as how much pressure is exerted by the likes of those on this board.
I keep seeing complaints that even organized labor appears to act in the interests of the union management rather than the rank and file, so it's possible that the only voice of the people at the bottom is their votes (often wildly at odds with the leadership) and their spending.
"even organized labor appears to act in the interests of the union management rather than the rank and file"
Yes, all too true all too often. Yet another measure of how dis-empowered workers in the US are.
Sadly, no. The people don't seem to have much control over who the choices are to vote for. There are few Mr. Smiths in Washington. I know of only two: Paul and Kucinich.
So, the power of the people is in their protests: their arms, hands, legs, feet and voices.
There is precious little "people power" evident at this time. Koreans have my respect for forcing their gov't to reconsider the trade agreement with the US (though I disagreed with their reasoning as being irrelevant and a bit childish). The Greeks, too, though I know next to nothing of their reasons for protesting. What I admire is that they will act at all.
Cheers
"There are few Mr. Smiths in Washington. I know of only two: Paul and Kucinich."
For a split second when I first saw this I thought you meant Paul Wellstone prompting a wistful smile-- happy to remember him; sad that he is gone.
The libertarianism of Ron Paul is so naive that I don't often think of him as similar to Dennis K., but I guess they are similar in the depth of their analysis of the problems, especially compared to everyone else.
I dont think they are looking ahead that far. Maybe their only plan is to keep those workers in jobs for as long as possible even if its only for another couple of years?
I keep seeing these very pessimistic reports about the future of the car industry, worldwide, in the MSM.
Dammit, that's the same metaphor I was writing into a piece yesterday.
I swear you're reading my mind and stealing my ideas! Now where did I put that tinfoil hat...
I like that bit in the letter about needing to dampen business activity. Isn't everybody trying to keep it going.
Yes, even around here on TOD, many are trying to think of what we need to do to get back "up to speed". This crash is framed as something that needs to be fixed. Seems to me it would be better to direct it. Business activity - the realm of retail and consumption needs to be reduced. We need more stay-at-home moms and dads out of the money economy repairing stuff, gardening, ditching the second car and so forth. Remember that the sources of our problems are our own successes.
It's going to be "fun" tussling over the cuts in the state budget - already about 20% and sure to grow. A bunch of us are going to put Peak Oil, resource depletion and borrowing front-and-center in every committee.
cfm in Gray, ME
I think you are correct. Of course, at The Oil Drum, we have quite a few different writers, each with different perspectives. I hadn't really thought about directing the crash.
Alcoa is laying of 13% of world workers, and Big 3 factories are sitting idle while we sit here with a looming energy crisis and no wind turbines or solar panels.
Seems to me that directing the crash and then softening the landing such that we have a path out would make a lot of sense. Ramping proven, EROEI-positive alt energy production will be a necessity to maintain viability on the world commerce stage after the dollar plummets.
We at TOD have long been in the position of watching and predicting situations over which we have no control, like geology and world markets. We could potentially impact behavior in at least some countries, and add tremendous value. It's a great paradigm shift, and for me, an epiphany.
Aluminum production is, of course, enormously energy intensive.
Perhaps one of the brainiacs (and I mean this in the most respectful, awe-struck sense) could do an analysis of the most energy intense industries. A separate and more political analysis would be to balance energy intensity with necessity/desirability.
As we are seeing with the recent low prices for oil, the market does not give consistent indications of the direction we should be heading, so depending solely on "market forces' (much less the "magic of the market," a term you don't here very much these days) does not seem a very prudent course to say the least.
Energy intensity is one thing, but I doubt that Iceland's hydropower is going to be good for much else. Once such investments are made they're probably going to run unless the price of product heads down toward the cost of ore.
I'd bet that the sudden crash in prices due to the abundance of scrap aluminum has more to do with this. Of course, being able to buy aluminum at 40¢/lb should be a boon for somebody... which is a point I touch on in the piece I'm writing.
"Every dollar is a claim on future resources"
Chris Martenson gives it a personal touch: "Debt is a claim on future human labour".
http://www.chrismartenson.com/crashcourse/chapter-12-debt
Regards, Matt B
Still a concerned dad in Australia
PS. Just out of curiosity (it's probably been done to death), what do TODers think of Chris' "Crash Course"? I ended up downloading the whole thing and handing out a few DVD copies to family and friends.
Waste of time?
To paraphrase Kramer: No, no, no, no. (Irony intended)
The point may fall on deaf ears, but the point must be made. The more people that understand means that fewer people will suffer, or suffer less.
Rather than be the clarion call, make sure that those close to you are prepared, after that you can walk around with a sandwich board.
I find no flaw in Martenson's presentation, although I wish that someone here would point out the errors. :-)
Best wishes to you and your offspring, for a better and simpler life. It will be simpler, it's up to you to make it better.
Thanks pragma; a simpler life would suit just fine - a great sunset beats a TV screen anyday.
But what errors? I thought the exponential math could have been explained a little better; more Al Bartlett(erish) - perhaps use China's recent growth as an example (seven years at ten percent/the doubling factor). And the surplus arguement for *either* growth OR prosperity seemed overly-simple.
And perhaps the "solutions" chapter...
But otherwise, what errors?
Regards, Matt B
He also ignores climate change. Big error. You simply cannot come to a rational conclusion about the future without factoring that in. Absolutely impossible.
Thus, his future projections will always be flawed. I got the impression from the many denialists posting there that he is a denier.
He doesn't say anything anybody else isn't saying. He's just made it into a nice presentation. Until he adds in proper climate info, he's not saying anything of great use.Financial advice and survival advice can be found anywhere. Even at this late date not many are putting it all together in one place.
Cheers
Climate change is a result of the overuse of resource "sinks". I don't consider it a flaw in Crash Course logic, only something he doesn't explicitly discuss much as its own entity. Environmental toxicity - a huge sleeper - would be in the same category. I do find the Crash Course a good, accessible economic primer and recommend it to many.
cfm, sunk in Gray, ME
The Martenson course is great except the last chapter where he fights very shy of drawing the full clear implications of the preceding 19 chapters. He just leaves it as a choice depending on the "beliefs" of the reader.
He bypasses nuke energy, because as he said to me he just didn't have room.
Resource depletion and environmental degradation do not equal climate change.
He explicitly avoided climate change. Why? Again, my suspicion is he is a denialist. Again, some of the things he recommends make no sense in a climate changed world. A nice presentation, but let me ask you, did you actually learn anything?
So, another tool in the belt, but not the Swiss Army Knife for the Perfect Storm that we really need.
And, yes, I have an inherent disrespect for denialist (as opposed to true sceptics.) I consider them suigenocidal. (<-- My new term.)
Cheers
As 2008 slinks off to the history books, my impression from MS media, government and even my immediate circle remains...
Perhaps 1pc understand resource depletion (or limits to growth);
Perhaps 10pc believe man's contributing to GCC;
Nearly all believe 2009 will be a substantantial challenge to their financial positions (or folk in their own circles).
If I, very much a fellow Joe Average, can pop something in their lap that encourages them to think about the immediate future (in some way) and perhaps learn a few "big picture" basics, that's a good start right?
Regards, Matt B
Paying the bills from April onwards (when my contracts run out - where I've been the past couple of months, attempting to write up more) is foremost in my mind. Doesn't mean I'm a denier of other things, but in a big city, there's priorities.
Further, it's taken up to now to get my (very much smarter) wife onboard with me - well, at least to begin "window shopping for life jackets".
As I said, another tool in the belt.
Cheers
best on the web.
Agree. The download and transfer to DVD is disappointing (PAL version anyway). "Looks" unprofessional, and I said so on the site's feedback...
Regards, Matt B
Looks like the "Club of Rome" 1972's "Limits to Growth" can be applied to more than just population.
There are lots of systems which operate on this kind of positive feedback and suffer disastrous crashes by over committing during "the good times" without ever worrying about having something in reserve when circumstances change, as they always do.
Are we doomed to just being lemmings trapped in a series of boom/bust cycles?
No, one cycle - bust.
Denninger says yes. He calls it "The Price of Capitalism."
"Capitalism" as we would recognize it has only been around for a few hundred years. Human civilization got along without it for thousands of years before that. Of course, there was hardly any economic growth.
If our future is one devoid of economic growth (as I believe it must be if "sustainability" means anything at all), then it sure would be good if that future continued to be civilized. I am not at all sure that anything we would recognize as "capitalism" is really needed at all in such a future; indeed, trying to continue the capitalist paradigm might very will cause more harm than good, and prevent us from estabilshing and maintaining the steady-state economy that is needed for the survival of human civilization.
What am I suggesting instead? I don't know. I do know that capitalism is just one of many possible economic arrangements. Some perform better than others, depending on the circumstances. When the circumstances change (as ours certainly will), then the list of what performs the best changes too.
I don't have an answer, but maybe in light of the post(s) above about directing the crash perhaps Gail or others more in the know than certainly me could comment on what other economic "systems" would be best for an economy in need of sustainablility.
And then how we might transition from this form of capitalism to the more optimal system.
Pete
I am definitely not a student of forms of economic systems.
I know that in the insurance world, the old form of business ownership was the mutual company. A mutual insurance company is owned by its policyholders. In recent years, there has been a trend toward demutualization. I believe State Farm is still a mutual insurance company. Another old form of insurance ownership was Lloyds of London, in which a number of wealthy individuals pooled their wealth to form the insuring organization. There are a number of variations on these forms of ownership.
Among insurance consulting firms, the traditional form of ownership has been ownership by the principals, or by all employees.
If the economy is moving toward more local companies, and difficulty raising capital, it seems like the most probable outcome is more companies owned by individuals, or groups of individuals, in an area. If the goal of the these companies is to produce products used mostly in the area, and to provide jobs to people in the area, this could work out well. When there is a close tie to a particular area, a company is likely to have more concern for not over-using the resources of the area, not polluting the area, and taking care of the people in the area.
The larger issue is what constitutes a social system that benefits the members of society in meaningful ways, not just material goods, but life satisfaction. This would include economics, social norms and mores, and all governance mechanisms.
For several years now I have been researching the mental and neurological basis of wisdom. It is not just more intelligence, but rather a higher form of moral/ethical judgment backed up by strategic and systemic thinking covering much longer time frames and many more 'members' of the we-group. Wisdom is what is sorely lacking in our current systems and there is an evolutionary explanation for this. Sapience, the mind/brain basis for wisdom is not fully developed in the average human being. We still, at best, possess tribal-level sapience but are trying to make judgments about a globalized world of nearly 7 billion people. A successful form of social structure and function should, I think, be based on a more sapient approach. It turns out that nature provides many elegant models of governance and organization that, if we were wise enough to pay attention, would provide us with something I call sapient governance.
Starting last July 20 I began posting a series of blogs (actually pointers to essays maintained at my university server) about what form sapient governance might take. Governance, in this context, includes things like markets with levels of coordination control (regulation in today's jargon) up through strategic management of Earth's resources for the benefit of the whole planet, not just mankind.
You can find the blogs at: Question Everything (July). Scroll down to July 20 to start.
I have been thinking for some time that the systems we have created would have to come to an end eventually. Now it looks to be sooner rather than later. What do we do to pick up the pieces? How do we reorganize for a new reality after the energy bank is empty? What path should humanity pursue to capitalize on its accumulated knowledge base and secure a place for the genus Homo in the future of evolution?
I have no thought that our current systems will be saved. Indeed they need to be radically altered, many scrapped, if there is to be a viable future for human kind. But how we go about 'directing' this process will determine success or failure. Success means Homo is still in the evolution game. Failure means extinction of the only abstract symbol manipulating genus to have evolved on the planet.
Question Everything
George
PS. my current blog is along the same lines as Gail's post.
THANK YOU George - and Gail.
Pete
Great Post.
I do disagree with some of your points though. You mention that by stimulating manufacturing and services today that we're pushing the payments into the future.
Keep in mind that the financial economy and the real economy are two different beasts. There's a limited amount of production, so there's a limited amount that can ever be "paid back." Unless you're talking about more "dollars" being paid back. In that case, the government can just print more money and inflate. That's how they are going to get out of this. Inflation solves all of the problems. Social Security will stay solvent. It's just that your $1500/month social security check might be enough for a car payment, or for some food. Inflation is going to hurt those on fixed incomes because they aren't "contributing" to society anymore. It's not going to be the end of the world. Four or five seniors will be able to pool their retirement savings and social security. Doing that, they should be able to live a fairly comfortable communal lifestyle.
Personal income has to at least come close to keeping pace with inflation, otherwise, people won't come to work. They might show up, but they won't be very productive or happy. How will companies be able to increase the wages of employees? Expect some sort of massive tax break on payroll taxes, or some other type of incentive to encourage massive increases in the pay of the average worker. The net result is a type of "reset" of the system. Production and consumption is re-established. The liabilities are a lot easier to handle for the government and for individuals. The "only" people who end up getting screwed over are those who aren't working, who are looking to retire.
Along the way, we're going to end up with bubbles. My hope is that the bubbles this time go into productive things. With the housing bubble, we're left with a bunch of poorly built and overly large homes a great distance from population centers. If the next bubble ends up being alternative energy, rail, or conservation, we're actually left with something Useful after the bubble breaks.
I don't quite understand what you are saying, and I don't think you quite understand what I am saying.
If future resources aren't there, they just aren't there. Printing more money won't change the situation--the new money that is printed just becomes worth less. If there aren't enough resources to raise personal income, it can't rise in a real sense, no matter how much money the government may try to print, or how unhappy or unproductive workers might become. If you have a "pie" of resources, you can cut the slices thinner, but you can't make more resources. The printed money that the government makes will become worth less and worth less, until it finally becomes worthless.
This is a link to my post The Expected Economic Impact of an Energy Downturn. It explains some of the same issues differently.
Actually, I think we're in agreement regarding the ultimate outcome, but differ on the way it's going to play out. I did seem to be a bit cornucopian in my reply, but that's not the case at all.
Printing money does change the situation regarding the debt pyramid. If the economy does inflate, you're not going to see the collapse of the pyramid for a little bit longer. There is a possibility through inflation of keeping the financial system intact while also bringing our standard of living way down. Imagine that the price of goods quadruples. Now, imagine that person income doubles. I know this is a simple example, but you have a situation where our standard of living is going to be lower, but our debt burden is also going to be a lot lower.
In these situations, the people who are going to be hurt the most are the elderly, and people who have their money in "safe" investments like Annuities, etc. If you can somehow stabilize the money supply, you have a chance of at least holding things together after you inflate. If you don't (Which I suspect we won't be able to) you're going to end up at a hyperinflationary collapse at some point due to diminishing resources.
"That's how they are going to get out of this. Inflation solves all of the problems......"
Now consider this: US imports 70% of oil and petroleum products. As the value of the dollar decends the oil exporting countries will curtail production to keep the price of oil (in dollars) rising. How do we get by on oil that is say $1000 per barrel and gas is $40 per gallon when average wages are $1000 per week?
If the US dollar falls to 10% of value from start of year to end of year, expect oil to rise by at least 10 or 20 times (Canadian nat gas will rise similarily) keeping the average working person in the "poor house". Inflation solves nothing for things we must import like energy.
This is the reason that I've LONG said that energy conservation and alternative generation is a strategic imperative for our country. If we could break-even on energy (no massive imports) we can ship grain to get goods, and inflation of the dollar will help us export some goods as well and thereby rebuild a manufacturing base.
I think you are correct that with today's oil in the picture, the picture is dire with inflation or deflation either one. It's also dire for the holders of our debt either way.
This is why I am not expecting inflation for quite some time. It's not just the money supply, it's the velocity of money. People have to spend it. I don't see how they do that without wages rising, and I don't see wages rising any time soon.
Two possibilities. First, a massive tax cut or other stimulus to corporations in order to encourage them to raise incomes. The second is a possible "Debit Card" idea that's being floated by the FED. Basically, everyone gets a debit card. The Fed can put "money" on this card instantly. The "money" must be spent on goods or services. The balance declines as time passes.
It's the wet dream of a central banker. In their mind, recessions would be a thing of the past!
I don't wear a tinfoil hat, but that's just scary!
I would be tempted to cash that card out, like the food stamp people do.
There will be a huge black-market business there, at $.50 on the dollar.
This isn't just a temporary Debit card. This is a permanent card that may have more value added to it in the future. I don't know if people would want to part with that. Even if you people "trade" the use of the card for $.50 on the dollar, the card still can only be used for goods and services. Thus, at some point, the card has to be used to "stimulate" the economy.
That still wouldn't stop you from replacing your cash expenditures with the card. It wouldn't even stop you from buying services (e.g. welding) to make capital investments in your own productivity that you can use outside the formal economy. That would make you better off while cutting out both the fat cats at the top and the government.
The more I see this, the more I see pressures growing to satisfy the urges of the Hippie-era anarchists: smashing the state!
It seems like it would be very easy to use the Debit Card to buy your usual groceries and gasoline, and leave your other funds wherever there are. How in the world could they make a person actually increase their total spending because of it?
Very few people think that way. Sure, with any stimulus, some people "save" the money. Most people view it as a Bonus. Heck, even if people do use the money they "save" to pay down their debt, that reduction in debt is going to have a psychological impact on how they spend in the future.
With it being a debit card, they can set it up so Gas or Grocery purchases would be rejected. The possibilities are limitless.
The biggest benefit isn't being able to control where the money's spent, it's the fact that the Fed can Instantly give money to the people. It's the closest thing to Ben's Helicopter you can get. The checks work well, but they take months to print and distribute. This would be instant.
Money stuffed under a matress has a particularly low velocity rate.
Because everybody is having a hard time figuring out if/when the deflation switches to inflation, I would imagine it won't happen over night. You could probably get away with keeping the money in the mattress until the TODers start to say go, then spend it on the proverbial "shovel".
Great insight!
Question: With all this talk of dept forgiveness, am I doing the correct thing by paying off my mortgage?
I assume that I am not inline to be "forgiven".
I would continue to make your normal payment, but I wouldn't be putting any extra money towards it. If we end up inflating (Which is looking more and more likely to be the result of the trillions of dollars being pumped into the system) it's going to be a lot easier to pay off your mortgage.
The Fed is working on getting rates down to 4.5% if you can refinance at something like that, inflation doesn't have to go very high before you end up with a Negative Real interest rate.
If I had extra income for a mortgage, I would be putting into a CD or other "safe" account paying interest. This gives you some time to see what happens. If your mortgage is 6% and you're putting your money in a 5% cd, you aren't losing much by holding off on the payment. If you can get a 4.5% mortgage, and a CD at 5%, you're making money by not paying extra!
If we end up deflating, the money might be needed for other things, if we inflate, you can use that money to buy toys!
My situation is as follows:
I work for an oil services company in Houston. Because they had a good year in 2008, I will get a bonus. This year, I will run the risk of being laid-off.
My mortgage is set at 5.25% and my CDs are running at 2.9%. Between the CDs coming to maturity and the before mentioned BONUS, I could blow it all and wipe out my mortgage.
I might commit suicide, though, if Obama comes out in September to say that all mortgages are being "Forgiven".
I'm pretty sure the new administration is not going to suddenly 'forgive all debts.'
They might try to coerce some more favorable rates from the lenders for the people who become unemployed during this recession (nobody profits during a depression.)
Still wouldn't do me any good.
I've been laid off since 2007 but I'd already paid off my mortgage, so between unemployment and some cash on hand, I'm hanging on.
I'm back in college (bye bye IT, you were fun while you lasted. Hello communications degree and blogging & podcasting)
Lots of very wrong advice hereabouts, IMHO, in regards to inflation and home ownership.
If you own a house outright, and the inflation genie comes to call in a big way, which it will, what needs to be done is this.
1. Unless you are on a farm, or have a few acres in a good safe area and have a small super insulated place, borrow as much as you can against your house or condo. The rate is not important anymore. 30 year fixed...it will never be worth more than it is today....open your eyes and ears to what is going on. If you live in an area that drops out, a subdivision that is unsustainable and unprotectable, or you live in a condo in the city, you will be able to walk away and have something to keep you going for quite a while. You will not be getting a Bailout..sorry to disappoint. Most people will not be able to get out of the cities with more than the shirt on their back. Be different. Think you can eat your drywall???
2. Take all the cash except for 2 years worth of payments,and turn it into solid tangible goods. Minimum 1 year food and water. Preferably more. Silver coin, some gold coin and a few other hard metals of value. Buy as much tradeable supply as possible, be it ammo, guns, farm tools, livestock that can be boarded at remote farm, seed ,booze, meds, etc. Find a safe place out of any large city to keep most of it. Friend or family, even locked storage will work. Buy the most fuel effecient ICE small car you can find. Honda FIT or VW Rabbit TDI. Pay cash for it. Do not buy a Hybrid. Buy a small quality trailer to pull with it and learn how to use it. Buy a few years worth of spare parts, tires, oil and filters. Gas WILL be available on and off for a few years, but buy a few good bikes with spare parts. . Easy to trade as well. Quality counts much more than quantity in all your tangibles.
3. Get clear of all of your financial assets, except for 2 years worth of living cash, to be kept in a very short term, easy to get at, interest bearing checking account. Everything else, out of the U.S. financial system. Completely out. Completely. Make sure your Passport is valid.
Two years out is about all most of the better Crystal Ball Rubbers can project to be safe, aside from a Nuke event. You will never, I repeat, never beat hyperinflation on the wage/income side. Never. If you think you can force your boss to give you a 25/30% raise every year, for the next 5 years, without a gun to his head, you are truly wacked and should put a gun to yours.
What you need, to be prepared for uncertain times, is just that. TIME. Time to roll with the punches and be able to make decisions based on changes as they happen. Not decisions based on fear. Not some pie in the sky, wish upon a star, techno fix. It ain't coming...And believe me, your government is not going to come to save you either. I am a certified Disaster Management Planner with FEMA...You must, plan for your own, and your families survival.
Um......thanks?
"I am a certified Disaster Management Planner with FEMA"
Given your background, I am curious about your take on my Scenario 2020 piece, which was on this forum yesterday?
Some here feel I am a bit blunt with a comment or two, but IMHO, the time for polite discourse has come to an end. My opinion is not for everyone. It works for me. Some still think they will be able to buy their way out of what is coming. I find it hard to believe anyone will be prosecuted for defaulting on a home loan in the near or distant future.
Your "Scenario 2020" is a VERY good exercise for thought. The reality as usual, sometimes comes out different. Try a rebuild to stability, without ANY Grid Electricity and see where you go.
Your 3 days to breakdown is right on the money. Way too clean though. I was in LA during the R.King riots, and that was just a small disturbance. Multiply it by a factor of 10,000, spread to every medium and large city and think about the dirt that rises to the surface of what we call civilization. The looting will be far, far worse than you can imagine.
In any community, Security will be the numero uno...that needs to be the priority before any food and water. Dead people don't eat much. The Fed will circle the wagons. The first thing they sent to NOLA was the Military....
Racking up credit card debt will work if:
1) you don't plan to need credit going forward
2) you are OK with walking away debts you agreed to pay, knowing full well you would not
3) the rules never change to where they come get you or your stuff because of the debts
Even if you bet on inflation and you keep your job you won't be able to pay off the debt, as the interest rates will rocket.
Other than that, I can't fault your preps. I've done most of them, and since I still have a mortgage I've even got part of your first point (though I wish I didn't). I'm still putting back more each month. Still gotta get a trailer (but I have some I can borrow now).
I'm a guy who is happiest owing no man anything but goodwill. I'll be happier when the mortgage is gone. Please, God, just one more bubble or 2 more years.......
You know, there is no consensus about ... 'inflation' or 'deflation'. Back and forth. Left and right. I've commented on this subject before, I suppose I will comment on it again, later.
The inflationists remark upon the ability of the government to create money from nothing and, of course, this is blatantly inflationary. Throw the bums out!
NOT SO FAST! The Keynesians are misinterpreted as to favor inflation in difficult circumstances such as ours. As a matter of fact, he became noteworthy as an advisor to President Roosevelt during the Great Depression. We are all Keynesians, now! We've been Keynesians for the past twenty- five years! Of course, most mainstream economists believe that sufficient 'inflation' (stimulus) will cause consumers to start buying, since if prices go up, waiting will only cause prices to rise out of reach. If a consumer cannot pay because of the loss of a job or an arm or leg someone will provide credit. According to the 'inflation plan', there will be a short recession and then we will all live happily ever after, with the Fed mopping up excess liquidity and the various 'toxic' assets bought by the taxpayers sold into an eager market at a fat profit.
It was Keynes who also said, "Deficits don't matter." When some dude with a reputation comes along and sez there really is a Santa Claus, who is going to argue?
The deflationists point out that the nature of inflation (as well as deflation) requires large public participation. In order for there to be inflation, not just rising prices for some items, both prices and wages must increase. Inflation only 'works' when there is an 'inflationary spiral' where wages endlessly pursue endlessly rising prices. This obviously isn't happening. When prices rise and the means to pay them disappears, this is deflation, since nobody buys the items or sevices and the companies with the high prices eventually go out of business. Today, people are losing their jobs left and right. Those who have jobs are earning less, since the hammer of doom hangs low over them; they might be fired next week or tomorrow ... or who knows when? Those who are more secure are paying off debts and retrenching. Not for them is the new car or home furnishings. The urge - and the means - to spend is kaput. Hardly inflationary.
Plus, persons overseas aren't buying American goods, either. Look at the Baltic Dry Goods price index:
http://www.investmenttools.com/futures/bdi_baltic_dry_index.htm
The bottom has dropped out of overseas shipping. Nobody is hiring ships or crews because nobody is shipping goods! Even at depressed prices, American commodities, airplanes and defense items are still too expensive for foreign customers, one reason is because investors are selling assets in these countries - particularly developing countries - and buying dollars or Treasury securities. This makes the dollar stronger and ... the strong dollar makes American goods even more expensive, but ... without rising wages or earnings overseas, nobody can afford to buy goods there, either.
Right now, we are in deflation. There is a consensus about that. Deflation scares the crap out of people, there is no hedge against deflation. All assets lose value and in a debt- driven deflation like ours, the means to support prices evaporates. We are truly doomed, indeed.
So ... what about all that cash the Fed is merrily printing away? There are trillions of dollars ... somewhere. Where are they?
Here's a remark by Martin Weiss:
Mike Shedlock has said the same thing ... and both point out that the notational trillions are worthless against the loss of asset value if the money isn't "lent or spent", that is, gotten into the pockets of wage earners, first. This leads right back to a lack of public participation. The stimulus and liquidity presupposes that dollars will fall into the hands of the public, like manna from heaven. If this were so; if the public had funds and these funds were earned - not borrowed - there would be no crisis! Of course, with less - or no - public participation, there is less credit created - less 'checkbook credit' - and the spiral of deflation accelerates.
What is the best way to cope? If there are no hedges, what about holding Treasuries? What is one to do?
First of all, there are more dangers than Gail mentioned and what is really hanging over us needs to be mentioned. There are over $600 Trillion in various interest rate, currency and default swaps overhanging the entire credit and asset markets, which includes all of us since our government has taken large positions - in our favor - in all these different markets. These derivatives pay the holder the noted amount if the seller of the instrument takes certain actions or actions are taken to him. A 'Credit Default Swap' pays the holder an amount if the underlying debt is defaulted on by another party. If there are many corporate bankruptcies, for instance, the holders of a particular corporation's debts will seek payment on the swaps written against that defaulted upon debt. Since the amounts involved are staggeringly huge and the US government is in effect underwriting some (large???) percentage of the overall risk, either by owing stocks in parties or counterparties or by having some other interest, the possibility for taxpayer 'exposure' is large and growing. If Gail had put the derivatives liabilities on her chart, they would be wider than the cumulative width of all the other sectors represented. If the derivatives markets follow the course of the other markets, then the US government could instantly 'acquire' tens of trillions worth on new instant liabilities. Interest would have to be paid on this, of course.
I suspect 2009 will be the 'Year The Derivatives Come Home To Roost'.
So ... what does all this mean? Do we hold dollars and wait? Do we diversify into gold or land or machine guns or paisley Rolls- Royces? I don't know. I can't tell from here whether a deflated - and valuable - dollar would be the tool for a feckless government's default or be a tool to escape it. If the dollar gets scarce enough and the liquidity vanishes into the 'Bad Loan Universe', there could be a dollar scarcity; which would parallel the dollar scarcity that already exists in the 'real world'. It would be hard to pay hundred of billions in interest ... or ... the government could print and repay foreign holders of US securities (yeah, while it's selling them more in another room ...) Or, the liquidity could leak out of its trap, somehow and we could have instant hyper- inflation. I suspect whatever is most destructive is what will probably happen. Deflation, followed by hyper- inflation. In this scenario, the best strategy is to sail around the world in a wooden boat.
http://joshuaslocumsocietyintl.org/
By the time you get back home, the worst should be over.
steve
one of u'r very best comments steve.
looking like deflation to hyperinflation i agree; but won't some kind of war be a more likely happening, maybe a brief trade war to a 'hot' war?
took the guy 3 yrs.+ to sail around the world. dang.
"There are over $600 Trillion in various interest rate, currency and default swaps overhanging the entire credit and asset markets, which includes all of us since our government has taken large positions - in our favor - in all these different markets."
Yeah, the debt in derivatives is a huge whole in Gail's generally good analysis.
We are, of course, already involved in wars, whether you see them as resource wars or not. I'm not sure how many more we will be able to involve ourselves in. Although militarizing the whole country is onw path toward full employment.
I'm beginning to think that total militarization or total powerdown are the only viable options, and the former (and perhaps the later) is "viable" in only a limited and very short-term sense.
The US is already about the closest thing to a major totally fascist state in existence today--extreme patriotism (by most international standards) and a military budget that swamps most of the rest of the world's military budgets combined. I would love to see us turn totally away from this direction, but is that likely at this point?
Should we even try to think of what is happening as "inflation" or "deflation" in the traditional sense? Fiat currencies are becoming unglued from the economic fabric where they sprang from. People are reevaluating their lives in light of the new reality of peak oil (even if they know nothing about peak oil they feel its presence) and the things they "need" (food, water, basic shelter, and such) are receiving priority while everything else isn't. Because of the way govts are responding to this the currencies can't reflect true values the way the used to (if they ever did!). If you have money now you should think about trading it for things that have some intrinsic value.
A wooden boat (actually a fiberglass boat might last longer but it doesn't have the cachet) might be a good thing if you're into sailing and fishing for survival. You can choose a nice warm remote place with great beaches and enjoy the whole post peak oil experience way more than you thought possible.
I tend to agree with Steve, which has been leading me to mull over the question of whether it would be possible for consumers who have debt to successfully "break the banks" leaving them mostly with teh assets. I wonder if the most successful strategy for a managed decline might involve people refusing to pay their mortgage perhaps based on the legal precedent two years ago that found that repackaged mortgage holders don't own the mortgages - they own the package, so to speak. A rationale would have to be found for credit card debt. One might even continue paying in escrow to protect oneself legally.
This would accellerate the end of credit, of course, but it might also succeed in leaving assets in the hands of people - with the violence that I think will likely be used to put some of them there eventually. Obviously any such strategy would be much more complex than I'm describing, and have to be elaborately organized (its major weakness), but I wonder if it might be possible.
Sharon
What's happening right now is a borrowers'/customers' strike. People bought new cars every three years because 'The Power of Christ' compelled them to. Now ...?
If people can't win by playing along with 'the Man' then they stop playing. Part of what is fueling deflation is failure of lenders to participate, there is also much borrowers' revulsion. Nobody can make someone borrow and a person with no assets cannot borrow, anyway.
The 'debt- shedding' proscess can get ugly. During the 1930's there was was conflict over this issue; the seizure of property from delinquent tenants/owners, either for taxes due or unpaid mortgages. In some parts of the country there were posses formed to forstall evictions and dispossess by force. At the time the banks were commonly viewed as parasites and gangsters. Many banks had speculated on stocks in the 1920's and had no money to operate by the middle 1930's. Loans would be called - or the 'deflation effect' of increasing a loan's effective principal was operating; the occupants of the land couldn't make payments with the ever scarcer dollars and the banks would seize the land. Banks had land and no cash, they couldn't sell or lease the land for enough to keep in business so the banks failed too. 'Trickle Up Wealth' was working in reverse; Roosevelt re-liquified the banks upon taking office in 1933 which ended the immediate crisis. Today all banks have access to credit so non- payments would not 'break the banks' but social/political strife has a cost, too. Of course, losing a McMansion to foreclosure isn't the same as losing a farm, since a farm in the 1930's usually meant a roof and meals for the family occupying the farm. Eviction from a farm usually meant terrible hardship for the evictees. Eventually, the loss of enough farms meant that agricultural output began to suffer in general; the economic health of towns dependent on the farms also suffered when a critical mass of farms were forclosed upon and 'taken out of service'.
Bank managers are terrible farmers.
The loss of a certain number of 'agricultural enterprises' would probably not be noticed the same way as farm forclosures were in the Depression. Many big, factory operations farm leased land and any foreclosed land would be re- leased back into service. Consolidation would be the result; fewer and fewer, larger and larger farms. A few big failures might have an effect on food prices, or cause a chain reaction through futures or in the feedlot business. I would expect many feedlot operations to fail as well as many/most ethanol operations. All are credit dependent. A payment crisis in the government would suspend subsidies. That would be the end of ethanol biofuel.
This is all way ... off ... topic, but I don't know if it's possible to go 'back to the future' and redivide factory farms back to small holdings. Financing the process is one problem, the shortage of infrastructure is another; where are the farmhouses and barns? It would be tragic to have millions upon millions of acres of productive land sitting idle ... the factory farmer 'operators' insolvent ... while millions of potential farmers look on dismayed ... and America goes hungry.
If you're interested in a (very long!) look at the same result arising from a very different set of driving forces, read The Great South African Land Scandal (the entire book is on-line at that link).
Not true. "The Man" sets up company stores and locks in his "customers" with debts they cannot pay. All those millions upon millions of acres of land - needing only finance from the company store and new operators. ;^>
At some point, it seems like there has to be a redistribution of land, but I don't know how it could be done. One possibility is a new government comes in, revokes land ownership rights, and starts redistributing land rights. This could be a problem for the "sustainability" person who had worked and saved to buy a little land, and later loses it under a general redistribution.
Another possibility is that some of these big land-owners become bankrupt (falling land prices, constant mortgage), and local governments redistribute the land to appropriate individuals.
Another possibility is more of a feudal organization. If oil is no longer available to work the land, and more manual labor is needed, a landowner might grant rights to work the land, in return for a share of the crops. It probably would be worthwhile to look back at what land-ownership forms have worked in he past.
I think the new infrastructure is going to be a real problem. We are not going to have the capital to build millions of new homes with three/four bedrooms, 2.5 baths, two car garage, and the other amenities. I suspect that the new homes will be built by volunteers, with local materials (perhaps from disassembling no longer needed homes / stores), in a month or two. They may lack amenities such as electricity and running water.
C-A
An interesting list that I have yet to completely absorb.
That said, I would add something to the list and recommend to everyone here to consider.
Prior to TSHTF, tools will be essential to "making do". If you have the financial resources, take advantage of tool junkies selling off rarely used items or dumping everything wholesale.
Tools are a multiplier, making short work of an otherwise impossible task. Even a simple bolt is not going anywhere if you don't have a wrench. Consider any tool as valuable. You may not ever have had a need for bolt cutters but, but I can see them being very useful in the future.
A few caveats though;
- Obviously, tools won't help you much if you don't have the associated skills so don't buy anything you don't know how to use, or learn and practice as soon as you buy it.
- In the short term, power tools are preferable but should be paired up with a manual version.
- Quality is key. A flimsy tool is sometimes worse than no tool at all.
- Consider buying more than one of everything for backup and barter. When buying duplicates, try for the identical tool so parts can be cannibalized.
- Buy repair books for households, small engines, appliances etc. Check out used book stores and flea markets.
Any skills to fix, patch up or modify will be very welcome in the coming years.
You can also coordinate with friends and family to have identical tools for sparing purposes and repair expertise. Having tools/guns/tractors/cars that can be readily repaired and supported locally is relatively important too. Even if the local dealer runs out of parts, the proprietor may well know who has some junkers and old Joe in the back can maybe make it run again for awhile until you can get the "right" parts.
I think I would lean toward not paying down your mortgage. If you get laid off and need to move, you may want to move. If you can't sell your house, you are stuck will a huge proportion of your money in your house, and no way to get it out (unless new some government program will give you a new mortgage).
Doesn't this all depend on what return, financial and otherwise, that you could get by investing your bonus in something else? Maybe you could invest in things like insulation, better windows, gardening, more efficient auto, bicycles, wheel barrows. You might even consider downsizing and having some money left over because you bought a smaller cheaper house.
There are other investments, of course, like stocks and bonds but it doesn't sound you are into that kind of risk since you only mentioned CDs.
And then there is oil. Is oil likely to increase more than 5.25% in the next year? Or perhaps you pay off just part of your mortgage and do a little diversification.
Also, it depends on your financial situation. If you are in real danger of not being able to make your payments, maybe you could get some sort of bailout.
Far be it from me to provide some financial advice. Given that we do not have your full financial picture, it is really dangerous to be dispensing advice over the internet, or at least taking advice.
You might even consider spending some money on a financial advisor, assuming you could get one you could trust.
And then we go back to the debate about inflation vs deflation. If this thing gets really inflated, I would rather have a loan that is depreciating in real terms.
In my experience, financial advisors are not peak oil aware and thus make poor recommendations (they think the economy will come back, dollar-cost averaging and all that). I think you will get better advice here.
Thanks, that is why I am here!
It doesn't really matter how "off-the-wall" the comments get, in a way, they all help me to form my base understanding of the situation.
I will most definitely NOT seek out a financial adviser. My general understanding of the future has nothing to do with business as usual.
It is obvious that nobody has a handle on the inflation/deflation thing. In my opinion, this is because the total amount that the fed is going to print is unknown. In the short term, we also don't know how high the unemployment will go. If I was a bank, I would avoid loaning too.
I will most likely take the following action:
1. Pay off the mortgage.
2. Save money, until it gets unsafe ($100,000 plus), then buy whatever long lasting assets I can get (tools, backup car parts, etc.).
3. keep my flee options open. Multiple states (the live free or die kind) and multiple countries (relatives in eastern Europe).
Note: I didn't mention medical care, but everyone should consider what you would do in each scenario (including TSHTF). Make sure you have a close friend of relative who is a general physician. (I keep antibiotics in stock)
I am still listening if anybody has more thoughts. A closed mind is very dangerous.
Shane
Your list is very good however consider these other things:
Several prominent posters here have reviewed the Post Peak Preparation Checklist and helped refine it, which you may find useful.
Thanks aangel,
The checklist looks great, it is food for thought. On that note, I think people should start to take cooking more seriously. I now that most people eat out, take home, or follow the instructions on the side of a premixed box. In the future, it may be a useful thing to know what to do with a bag of flower, fresh eggs, a quarter cut of a pig, etc.
If you really learn to cook now, it might help you know what tools you need to stock up on while it's easy.
I have:
3 hand crank grinders. one for meat, one for walnuts (homemade deserts), and one extra
1 electric mixer, and one hand crank mixer
2 wood stoves, a big wood shed (loaded), and all the tools
You get the idea. Practice now, and you will learn what you really need. It is impossible to fully prepare by reading someone's list (they might omit something because they already have one).
You're welcome, eastex. I'm glad it provoked you (it was intended to be very, very straight about our point of view).
You make a very good point about checklists, and one that I'm going to add to mine, which is this:
A checklist is just one resource on the way to fulfuling the commitment.
Much good literature on storing food and survival tools and skills was available after the oil shocks of the 1970's. Mother Earth News covered this in detail. Food storage is practiced by the Mormons, some of whom sold things like whole wheat and flour.
Recommended survival items typically included whole wheat and a grain mill. It's a shame that few people know the taste of bread made from fresh ground whole wheat flour because it is superior to anything else.
Rounding out the food list were powdered milk, sugar or honey and salt. Along with the whole wheat berries, these staples can be stored many years.
The other item I personally would recommend stockpiling is fertilizer, especially if you live in an area of poor soil. Two or three pounds of high count fertilizer will grow 100 pounds of food. By high count fertilizer I mean something like a combination of 18-46-0 (diammonium phosphate), 0-51-34 (monopotassium phosphate), 14-0-34 (potassium nitrate) and ammonium nitrate or urea. These fertilizers contain no useless salts like chloride and sulfate, and have a lower tendency to bur crops. Even if you don't have any farmland you would be able to sell or barter fertilizer for good return.
Buy these fertilizers through farm or nursery supply companies where prices are much lower. Besides, your local retailer will not stock these.
x
Good to hear you are at least aware of what FEMA has to offer. The more people learn about the limits of their government, the better they will understand that they are mostly on their own. The open Treason and violation of the Constitution that is going on in washington as we speak, should be ringing alarm bells with even the most timid of the sheeple.
Everyone needs to go to the FEMA web site and see for themselves. Some will be open to creating a new life in a new area, most will not. So many cannot fathom the death and destruction coming to to them. If the FED issues a quarantine called "shelter in place" due to a biological/nuke issue, which means, basically, seal the windows and stay inside until further notice. How many could survive more than a day? If the power goes out, what will you do? Do you have a plan for one day without electric? What about a plan for two weeks? Two months? Two years? Plan, plan, plan. Make alternatives to the plan. Write it down. Revise it constantly. Have an out. Financially, as well as food and water. If you have to leave your area, where would you go? What will you take with you? Who will you live with? Do you even have a SIMPLE list of phone numbers for hard lines to family/friends in your car? EVER TRY TO USE YOUR CELL PHONE IN AN EVAC ZONE?
One must make it a priority to simplify ones life in order to be flexible. Those are the ones that will survive. If the big O is a miracle worker and makes the monsters under the bed go away, GREAT,,,but I doubt it will happen. Best to be prepared. Best to Power Down.
nice posts citizen. thanks.
Eastex,
You'll find a lot of invaluable advice at the Mr Mortgage website:
http://mrmortgage.ml-implode.com/
Possibly of particular interest to you:
http://mrmortgage.ml-implode.com/2008/12/26/low-mortgage-rates-to-spur-n...
Another well-documented well-thought out piece, Gail. The connection between our peaking energy costs and peaking economics is well shown.
As your colorful energy consumption chart shows (can I borrow that?) and forecasts by EIA and IEA prognosticate to 2030, Washington has been doing NOTHING to change our (failing) reliance on fossil fuels. Geothermal, wind, ground solar, ethanol, bio-fuels, etc., are not forecast to have any significant effect on the massive shortfall we are looking at.
IEA's 2007 World Energy Outlook predicted a rate of decline from the world's existing oil fields at 3.7%, only to admit just 12 months later that the speed of the fall was more likely 6.7%.
A recent UK study, "Oil Crunch", the first funded by eight private companies, is the most recent forecast of soon peaking petroleum production.
Many states, led by California’s aggressive and failing Renewable Portfolio Standard (RPS), have legislated a renewable energy transformation. (RPSs require that a minimum percentage of renewable generation be included in the electricity generation mix.) Since California’s RPS was initiated in 2002, and subsequently accelerated, their goal of 20% RPS by 2010 has receded from plausibility. In 2003, 14% of California’s power was classified as renewable, since then it has declined steadily - to 12.7%, currently. Coal is also expected to peak in production and may have already.
Examining each of those energy alternatives highlights the massive advantage clean Space Solar Power offers to the power grid. One panel at GSO provides 9.6 times as much power during an average day as the same panel on the ground at an average US location. The clincher, however is that ground solar, like wind, is intermittant and there is no way to economically store utility-scale quantities of energy. Space solar, by comparison is naturally baseload - 24/7 - and no storage is needed. To turn ground solar power into space solar power would require about fifty times as much energy collection due to this storage requirement. In my humble opinion, and as we are gradually documenting in detail, only space solar power can fill the massive energy supply shortfall expected.
(http://www.sspi.gatech.edu)
Without SSP, no other currently envisioned strategy approaches the clean baseload sustainable power needs required.
Hi Darel,
Darel is chair of the Space Solar Power Institute, which is somehow affiliated with Georgia Tech. I have heard Darel speak about this to the Atlanta peak oil group. It is unlike anything I had ever heard of previously--attempting to capture solar energy in space 24/7, and beam it down to earth. As with any technological solution, there are cost, timing and feasibility issues. It would be nice if it would work, but there are obstacles to making it happen.
No problems with using my graphs. You might mention the source. The Oil Drum also likes to be mentioned.
Gail
SSPS has been around since Glaser and O'Neill in the 70's. Glaser's idea was to launch Brayton-cycle powerplants with enormous boosters, as they minimized mass per kW; O'Neill's twist was to note that the bulk of an SSPS was relatively dumb structure, and that it was possible to bootstrap a system to build an entire manufacturing apparatus for SSPS's starting with native lunar regolith launched into space using electric catapults. Aluminum can be electrolyzed from lunar minerals, silicon and quartz can be refined for glass and PV cells, and there's even a fraction of metallic nickel-iron from meteorites which can be pulled out with nothing more than a magnet.
It's too late to bootstrap this now. We don't have the time or the political stability.
Massive technological improvements have happened since the old 1979 SPS reference study which you allude to, E-P. Read some of the chapters and recent papers on the SSPW website. For one thing, as you imply, O'Neill's idea to mine the Moon to provide materials & parts is not a timely or economical idea as stated - Sunsat Corp should have NO part in lunar development.
On the other hand, AFTER the many nations, agencies and private companies, such as Google, do develop the moon, as they are working to do, we think it is entirely likely that lunar manufacturers could compete on an equal-price footing to provide parts and services to a Sunsat Corp as competitors to earth-supplied parts.
The key metric today for power collection is how much energy can you collect per pound of PhotoVoltaic (or "machinery", such as your Brayton). The leader currently is Welsom Space Consortium - their current PV delivers 5,880 Watts per kilogram and next generation will deliver 16,800 Watts kilogram (2 micron thickness polymer; 168 Watt/m2 at AMO). Manufacturing for this incredible material is now underway in Gigawatt quantities - and that is just a kickstart. These amorphous silicon cells continuously reanneal at GSO in operation. Astronauts will not assemble these satellites, it will all be done telerobotically from earth.
The first step is chartering Sunsat Corp to build/manage this massive undertaking. Cheaper rockets to orbit are interdependent with the massive launch market necessary to develop those, which only Sunsat can provide. Obama has a
comment section for an SSP paper under his change.gov website.
Much as I am fond of hearing about any 'Tech Solution' even I am a bit sceptical about this in the medium term (say 10-20 years) when we will need it most. Its also electrical.
If we can transition to a lower energy, more electrical-energy usage biased society using some fraction of the FF we have left then why would we need SSP?
I see the main problem with 'alternatives' as follows: during the 'good times' they are deemed too expensive with 'long paybacks' (compared to FF) so nobody buys them. During the 'bad times' (now and increasingly common in frequency after PO) nobody can afford them...
Nick.
Man, this is so sad! SSP has been talked to death a dozen times. if you want Solar, put a thermal plant in a desert, pump those photons into a high voltage dc line HVDC for short. and use pumped hydro both ends of the HVDC to smooth out the day to day swings. way cheaper than all those rockets and all that space junk. Totally known tech. Can Do.
BTW, if y'all will just go do it, it will make me and mine rich, since I have been betting on all this for about 50 yrs--- and look where it's got me--nothin' but old.
Aw, what the hell. can't say my my grandma didn't warn me life was fatal.
wimbi
glad to hear from u , u'r ticker implant must still be working ;& i still got a smile from learning u'r grandpa's saying!
The Troubled Assert Relief Program was orginally supposed to help unsound ARM mortgages but the money hasn't gone there.
The problem remains the banks which are building reserves. I remember 3 months ago there was financial talk that the banks were literally out of cash even before the 'bank runs'. The banks have stolen the money to fix their balance sheets--no great feat considering Paulson's 'no strings' approach.
The banks are a literally Blackholes filled with CDOs and derivatives.
The proper approach would be to nationalize them and write-off the garbage and this is still possible.
Congress's desire to float the economy on 700 billion dollars of cash cannot happen if banks operate like blackholes.
It is not certain that a plan to refloat the US economy on $700 billion dollars would work but it is certainly more likely than to simply hand the money to the thieves of the financial world.
Now things are looking ugly. Without credit in the economy, the implosion will continue and accelerate as more businesses fail or chose to service their debts rather than expand unlikely operations.
The article below came out last month.
http://www.247wallst.com/2008/12/as-downturn-spr.html
I'm not seeing this addressed by the Obama team which now has shifted from job creation/maintenance to stupid tax cuts, seemingly because they have no idea how to run the economy in command mode.
I think 2009 will be the year of bankruptcies. Each bankruptcy will cause problems for other companies and for the laid off workers, causing the situation to escalate. I know I read about the bankruptcy of a supplier of parts for GM's new Chevrolet Camaro that it is trying to roll out. The roll out may be delayed, as a result, adding to GM's problems.
62,000 bankruptcies out of a total of 5.7 million US employer businesses is 1% of all US business. I wonder what the 'negative' multiplier effect will be.
Obama's team better have some really clever tricks up their sleeves, but honestly, they don't look partcularily smart.
The key is to create a firewall between toxic CDOs,etc. and the real economy anf that will require nationalizing the banks
and hanging bankers from streetlights if necessary.
Hopefully, Europe will do better.
Gail,
Great post. As Charlie and I pointed out in this post, the idea that we can spend now and repay later only works if the economy grows, meaning that the economy is a giant ponzi scheme. Contractions spells trouble, big trouble for deficit spenders.
I think there needs to be a new definition of this debt economy that explains things without resorting to calling it a ponzi or pyramid scheme. Those terms imply that there is malice involved somewhere when its really just poor economic understanding that drives these booms and busts.
No, I don't think that Ponzi schemes have "malice" involved in them - I think they have crime in them, but you don't have to be malicious to simply put your interests criminally ahead of theirs. That, I think is a pretty accurate description of our present situation - TPTB have put their interests criminally ahead of the interests of the people or their own posterity.
Sharon
I have thought about this point quite a bit. You can also achieve something akin to a Ponzi scheme when you have a system that is complex enough that nobody really understands how it all works. All of the mortgage backed securities and other such junk would fit into this category - nobody really seemed to understand how it all worked, and anybody that asked too many questions was written off as some sort of Luddite.
I don't know what level of malice is required for something to be called a Ponzi scheme - I suppose the point is academic if the net result is the same..
"You can also achieve something akin to a Ponzi scheme when you have a system that is complex enough that nobody really understands how it all works."
Nicely put. This is basically my analysis of pretty much all of modern industrial economy (now almost completely capitalist). We have been "paying" current generations on the "assets" (natural system or "resources") that will not then be available to future generations. To keep this system going, each generation had to dig deeper and deeper into the natural resource pool.
Future generations (human and non) are now left with essentially nothing. The mega-ponzi scheme is crashing down. It will take a bit longer than the smaller scale ponzi schemes to collapse, but the process has now started and its complete disintegration will not take terribly long.
Wow, does that sound like doom or what? But really, between deletion of sources (PO...) and sinks (GW...), I don't see many new sources and sinks for the ponzi-meisters to turn to (though technofantasists dream of harvesting methane from the moons of Jupiter or cold fusion, while greener versions dream of paving the deserts with solar cells.)
But none of this implies that any particular actor in the scheme is fully aware of its architecture or ultimate consequences. In fact, I would say that a considerable amount of energy is expended avoiding looking candidly at the full horror of the reality of the situation and its imminent consequences.
I wouldn't give the PTB that much slack; government programs like Social Security would almost certainly be ruled to be pyramid schemes if not established by the same people writing the laws. We've been seeing the ROI dropping over time and the need for new "investors" is one of the pressures to bring in more and more immigrants.
The essence of a Ponzi scheme is where the new people coming into the system are directly supporting the layers of people above them with their "entrance fee." This is what we have with our financial system because money only comes into existence when someone takes on additional debt. The problem is that money for the required interest payments on that loan are not created. The system is always short on money unless new people are continually taking on additional debt to infuse the system with new money. It takes care of the funding the interest payments for the present, but increasingly more and more debt is required over time to keep the system afloat. It IS a Ponzi scheme any way you slice it.
TS
Simply because something has the same result as a pyramid scheme, does not mean that it is one. The essence of the difference is in the word "scheme". If the intent is not fraudulent, then it really isn't a pyramid scheme, even though the end results and practices may be similar or identical. Perhaps it's semantics, but I think intent matters in human interactions. Mistakes, bad arguments, faulty assumptions and stupidity are not malicious. They may have the same results as fraud and other criminal activity, but not the same intent.
The fractional-reserve exponential growth economy that our system uses made a lot of sense when it was established, given several assumptions.
First, you have to assume that resources are essentially infinite. You do this by essentially ignoring them as inputs or simply declaring that all inputs are substitutable at the proper price point. Part B of this assumption is that you assume that energy is always available (if necessary, at a price) to support growth.
Second, it is important that, at the starting point, resources are plentiful relative to population. This makes assumption one seem entirely reasonable.
Finally, you need to have short time horizon. A couple of generations, or a human lifetime will probably work. That allows you to be dead before the previous assumptions fail. Exponential growth curves do not look particularly scary near the beginning (assuming a small enough growth rate). This is what makes them so scary in reality. By the time you realize that the climb is getting a little steep, you are in serious, serious trouble.
These are the fundamental processes and assumptions cooked into our financial and economic theory. If you lend me x dollars so that I can increase my business, then I can pay you back your interest. I can sell more stuff, hire more people, pay them. They can buy more stuff, etc, etc, etc. Nothing illegal, fraudulent or unethical about that (we'll ignore moral questions as there are several religions/belief systems that believe that lending is fundamentally wrong; I don't propose to be bright (or foolish :) enough to make a call on that topic).
The problem, obviously, comes in the fact that the above assumptions do not work over the long term. Energy is a critical input. Resources are finite. Infinite growth (exponential or not) is not possible on a finite sphere. In the long term, this system is unsustainable.
However, over the short term, say, the last 200 years or so, the system actually appeared to work pretty well. Yes, that appearance was increasingly based on discovering (and subsequently gorging on) various fossil fuels.
While it's reasonable (and I think entirely correct) to argue that this growth-based system probably did very little to advance societal happiness, I think that assuming that the entire system was some kind of fraudulent con game is probably unfair.
Again, in the end, the results may be the same. Whether we buy into a con game or a flawed economic model based on good intentions but faulty assumptions, the long term result is probably going to be unpleasant.
We are reaching the limits of growth in many of the areas of this model (debt, energy, resources, population, food, etc.). What once seemed sustainable now obviously isn't (and, in truth, never was). The longer we try to perpetuate the existing model, the nastier the decline is likely to be. As I noted in an earlier comment, the people trying to "fix" the system, are trying to "preserve" the system. Sometimes things are broken and cannot be repaired. They must be replaced.
Brian
P.S. - Note that this does not mean that I think that all of the people currently involved are somehow blameless. There are many who are probably criminally negligent, and many more who are clearly idiots. My point isn't that these fools have not screwed up in the past, or that they are not continuing to screw up now. My point is simply that labeling the entire system a ponzi scheme while looking back from the aftermath is an oversimplification that implies some kind of fraudulent intent in the system's creation. I see no evidence of such intent. A subtle difference, which, I admit, will help absolutely nobody. ;-)
Hey Brian,
Thank you for your well worded reply. While I suscribe to many of your observations, our positions are still separated by a difference of opinion. You're right that it doesn't matter either way. It appears we both have a solid working knowlege of how the financial system runs. That's the important part. Whether or not we can agree on what to label it is really pointless.
I've written several posts at TOD praising the work of Ellen Brown. Her book "Web of Debt" is a very well researched examination of the US monetary system. After learning of many events that have happened in our past relative to our financial structure, I've come to the conclusion that TPTB truely have mal intent and purposely structured the financial system in this manner purely for personal greed. The effect of the central banking/fractional reserve banking model is to systematically siphon off the wealth of the masses into the pockets of the few and extremely wealthy. Furthermore the very rich will blame the very poor for their position in life as a result of "poor decision making."
I'd encourage you to read "Web of Debt" or "The creature from Jeckyl Island." If those don't give you enough information/examples to see that our financial system was designed with mal intent then nothing will.
Not that any of this matters anyways.
I'd also like to commend you on a great example of how to voice a disagreement. It was very tasteful and respectful. That is something many of the members at TOD should aspire to, myself included.
TS
Agreed. They were smart enough to know what they were doing, and they used the media to make us believe.
Sharp gamblers gulling millions of suckers, and billions could die because of them.
I am deeply disgusted and afraid. The spell these rumplestitchkins have woven over us is unraveling; culprits will be sought and found, blame will be attached, tempers will rise, and striving for justice can degenerate into bloodbaths. It is not a given, that in these bloodbaths the culprits are punished.
Re: TPTB, in reality there is probably a bit of both -- knowing collusion to skew the system in their favor and an honest belief the system would raise the living standard of everyone.
Add to that the fact that few people actually knew how the monetary system worked (myself included until the last 18 months or so) because we were just living our lives, pursuing whatever dream we had, which for the most part was very possible in many places in the world.
Then, when we finally learned how it all worked, we were faced with the fundamental problem: how do we transition to another system? So much of our society is built on the existing system and growth (pensions, the capital system, social safety systems, etc.) that the momentum is irresistible.
It seems the only ending, which was baked into the system the moment fractional banking was put into use, was collapse.
The only saving grace to collapse is that it is a sure way to end one system and create the space for another to be born. That will be small consolation for those of us who go through the collapse, however.
I know one thing and that is, no matter what the government does in the next 6 months to a year, it will be the wrong thing. Maybe not the worst thing, but it will be the wrong thing and that's because people can't be trusted with each other's money.
Overall good article. Perhaps just a few quibbles.
a) The discussion is IMHO far too US-centric. The US economy if far more dependent on world events than you indicate.
b) Given US rates of import (energy, primary metals, autos from Japan, goods from China) the relative US$ exchange rate is far more important than your discussion indicates. eg. a huge proportion of the recent runup in oil prices was due to a dramatic and fast 20% to 25% decline in value of the US$ relative its trading partners. That has now been largely reversed (by magic as near as I can tell) but future such fluctuations are far more threatening to average US citizen than many other issues they worry about.
c) A large part of your audience esp for this type of article, is non-US citizens. Other countries have many of the same problems in greater or lesser degree. Perhaps some sense could be gained by comparative analysis. eg. UK housing bubble much worse, ditto Spain. Canadian banks far less exposed to toxic derivatives, positive balance of trade. etc. etc. Might help identify what matters, what's common, what's important.
You are correct in that the value of the dollar relative to other currencies is very important in determining how hard the US crashes and other economies crash with the US. My best guess is that those countries with good resources like Canada having many minerals and natural products to export will gain value, as will China having both minerals (except oil) and a good human resource base.
Those countries that have large parts of the population that are non productive, such as too many lawyers/accountants/financial manipulators and people on welfare, will do very poorly. The US is definitely at the top of this later catagory - not enough natural resources and too few usable human resources. Expect huge sifts in value between US dollar and Canadian dollar, Mid East currencies, Euro, Chinese Yuan, and maybe even some South American currencies. I don't expect the dollar to rise much against any curreny, even those of Africa.
Sorry about how US centric the article is. The article is awfully long as it is, and US data is easiest for me to come by.
I agree that many other countries are going to have similar problems. I haven't studied the situation enough to comment on specific countries.
I also think that there will be feedback loops between the various countries. I mentioned the possibility of bankruptcies around the world. These is also the possibility of international business failures that have an effect on world commerce. I wonder how stable the world oil exporters will be, now with prices so low. If there is a bankruptcy or revolution in one of them, it could have a major effect on world commerce.
I am not good at forecasting where the dollar is headed. In some ways, the US is the best of a bad lot. Someone has said that all of the currencies are headed downward, it is just a question of which one gets there first.
Neither is anyone else.
The 'classic' economic approach holds that any currency's worth is relative to the others it is traded for. The value is not determined by the interest rates of denominated securities of the strength of the country's economy, it is the market value the currency has relative to others it is traded for. If one currency goes up, the 'counterparty' goes down. This is the standard approach to currency value.
I think things are different, now. Really. Part of the reason is declining liquidity and part has to do with the 'illusory' nature of the markets. I do think all might go down the tube together - even the mighty Swiss Franc - because, at bottom all currencies are proxies for each other. All are fiat, all are based on debt and 'Rosie Scenarios' and all have absolutely no international value/purpose except to facilitate commerce. And yes, under the 'melt down scenario' the currency exchanges would facilitate the overall collapse; investors would swap the 'damaged' currency for others in a panic, but the swapped currency or currencies would be revealed immediately as stand- ins for the damaged currency.
If one of the major currencies fails, the disease to which it succumbs will be identical to that carried by all the other currencies. They will all be suspect ... and heaven help us all.
Since the currency relationships are support for commerce, the declining commerce volume, causes currency exchange liquidity to dry up. As with stocks, this will probably affect volatility, particularly as trade slows even more during the spring. The sixty- four gazillion dollar question is ... how will currency volatility and illiquidity affect the oil markets?
In any case it all will be interesting. Wild currency- value driven price swings of international goods could be in store. This sort of whip- sawing would pretty much kill any investment in new energy supplies or alternatives.
Anyway ... thanks. Gail for the time and thinking!
"A large part of your audience esp for this type of article, is non-US citizens. ... Canadian banks far less exposed to toxic derivatives, positive balance of trade. etc. etc. Might help identify what matters, what's common, what's important."
Canada's banking system is quite different from the USA, with only a dozen or so national banks, plus provincial credit unions and one government-owned retail bank (Alberta Treasury Branch). Our bankers got caught with toxic American paper but have written it off and are not in any further danger. Canada never had sub-prime mortgages because, under law, the original lender is ultimately responsible for any failures no matter who buys the loan subsequently, thus more conservative lending.
The Canadian housing market is slowly deflating but this is due to overbuilding, not because of excessive foreclosures. Calgary house prices are down about 5% over the last year. I got my property tax notice today. Last year my house (inner city residential neighbourhood, single-detached bungalow) was assessed $510,000; this year it is assessed $493,500, which I think is fair. Actual dollar value of taxes will be about $2,300, same as last year.
Calgary is not yet affected because of all the skyscrapers and major road projects still under construction. That will ease off by late 2009, and if the world economy hasn't turned about by then (which I don't believe it will) then Cowtown will start to feel pain. The Newfies who were here for $70/hour jobs in Fort McMurray will scuttle back to the Rock. The actual unemployment rate won't change much because the expatriate workers that have flooded into Alberta will go home.
New oilsands projects are being cancelled, but existing projects will keep running. Conventional oil is okay because it can operate down to $20/barrel. The petro-companies in trouble are the ones that have high debt or live on a line of credit, and are publicly traded. My investments are in private equity junior petes who drill only on their cash flow. They are doing fine. Nervous, but fine.
I lived through the 1980s in Calgary when Pierre Trudeau destroyed Alberta's economy with his National Energy Policy and looted $50 billion in oil taxes to buy off Ontario voters. This time around I don't expect Alberta will suffer as much. We will not be immune to the Panic of 2008, but we are far better off than basket cases like Ontario (the centre of Canada's auto industry) or California.
If the banks are just going to sit on the money and not lend it back out, the Federal Reserve, (which is neither Federal nor any kind of reserve,) should claw it back.
But the Federal Reserve is NOT Federal nor is it any kind of reserve, so I figure they've been investing it in foreign parts. (What? You don't think the banks have been getting ALL the money do you? How naive...)
The houses of Rothschild, Morgan, Rockefeller and a very few others are kissing the US good bye, sticking its citizens with the tab for the orgy and for the infection.
Hi Gail,
In your article you say, "The Federal Government obtains most of its revenues from taxes of individuals." I believe this is not true. My understanding is tht individual taxes are used solely to pay the interest on the national debt (basically, bond re-payments to the FED). The vast amount of revenue the Federal Government obtains is through selling newly issued bonds or treasuries on the private market (most of which are eventually bought up by the FED, btw).
If I am wrong please clarify. And of course, this is not to say that loss of tax revenue will not further exacerbate government debt problems. Of course it will. But loss of confidence in the government's ability to pay back bonds is the real problem as I see it. What that confidence is lost, people will no longer by bonds, and then the Federal Government *really* won't be able to raise money.
Thanks and my two cents,
Emanuel
If citizens are earning less money, it is difficult to continue collecting as much taxes. Some of the taxes come from businesses, but to earn money to pay taxes, businesses have to sell some goods or services to the public. If citizens are short of funds to buy goods and services, the profits of businesses will be lower, and the revenues from taxes on these businesses is likely to be lower as well.
Emanuel,
You are correct in that well over 90% of all the income tax revenue collected by the US Govt. is paid to the Federal Reserve in the form of interest. If the Govt. wants/needs more money, the Federal reserve creates it, and the Govt takes on more debt and pays interest on it. With a shrinking tax base, the Govt. will soon be insolvent because it won't be able to pay the interest, especially with the added debts for the stimulus and bailouts.
Gail,
One quirk of our financial system bears mentioning. I know you are well aware of it, but others here might not be. Every dollar that is created in the US is ONLY created when someone goes into debt for it. This is true of most of the world too. It's the fractional reserve, central banking model. Further, only the principle is created but not the corresponding interest. This means that the financial system, as a whole, is always short on money. The only way that the debtors will be able to find the money to pay the interest charges is by additional people/businesses/govt's taking on more debt, which infuses the present system with additional dollars, but requires that even more debt is needed in the future.
The US constitution provides that Congress has the power to create our money. The creation of money belongs in the hands of our government, not in the hands of a purely PRIVATE entity which is deceptively named "The Federal Reserve."
Responding to the other comment about inflation/deflation.... The derivatives market has left huge holes in the balance sheets of financial institutions. The only way to experience inflation is for there to be increased money among the same quantity of goods/services. This of course assumes that the ordinary people are actually given access to spend this newly created money. Right now it's going to repair the balance sheets and won't ever see it's way to the pockets of the ordinary people. Therefore, there's no inflation. In fact, you won't see any inflationary effects of this money creation until the balance sheets are fixed. What's not been disclosed is the extent of the damage to the balance sheets. Globally, the derivatives market is estimated to be over $1,000 Trillion. (Is that a Quadrillion??) The nasty aspect of derivates is that they are merely bets. Further you don't have to have an actualy stake in the event which is bet on. It's akin to purchasing fire insurance on your neighbor's house. We all know that bets have a winner and a loser. But both sides of the bet are booking the derivative as an asset on their balance sheet! This is causes overvaluing of the balance sheets. So as all this debt unwinds (deflation), its a race between fixing balance sheets and the deflation of money in the system that the ordinary citizens have access to. we'll either hit bottom because it'll be impossible for the ordinary citizen to find money to pay his obligations, or the balance sheets will be "fixed" but the underlying debt that was created to finance the repair is not servicible by the taxpayers, thus the govt is bankrupt. The writing is on the wall. Ellen Brown's best estimate of the "tipping point" where the tax base cannot service the Federal Debt is ~$13-14 Trillion of Federal debt. Last I checked we were at ~$9Trillion. The total costs and guarantees associated with the bailouts and stimulus etc. are already over $8 Trillion. The state governor's are already in line for another $1 trillion and Obama's stimulus is estimated at an additional $1 Trillion. It's just a matter of time.
TS
"You are correct in that well over 90% of all the income tax revenue collected by the US Govt. is paid to the Federal Reserve in the form of interest......"
Where did this come from?
Not true!
According to the US treasury, the amount of public debt is $6.4 Trillion (excludes $4T borrowing from social security). Much of this is in long term securities that pay around 5%, with recently issued short term securities paying higher (unrelated to the Fed's interest rate). At an interest rate of 6% on $6.4 Tillion is $384 Billion dollars. Governments tax receipts for fiscal 2009 will be $2.55 Trillion according to this document www.whitehouse.gov/omb/budget/fy2009/pdf/09msr.pdf. Most of this is from individual (70% or more of total receipts) income taxes and the rest is from corporate, excise, fuel, communication & other taxes. So, around $1.7 to $1.9 T is from individuals which is about four times the interest on the federal debt, which can be found here www.treasurydirect.gov/govt/reports/pd/mspd/2008/opds112008.pdf
Bottom line is that taxes in all forms won't cover as much as 1/4 of the US government's expenditures, including interest, in 2009.
Woah! My apologies everyone. I was working from memory and really got my facts jumbled. I'm trying to track down where I got that figure in my head. I thought I read it in the latter chapters of "web of debt."
In her first chapter, which you can read here, she states:
I know somewhere, either in her book or an article, she gave a threshold of National Debt levels that would be unserviceable. I'll continue to look for that.
In response to all the comments on both sides booking derivatives as assets, I got that from this article.
Again, sorry for the bad information and thanks for calling me on it. I'll let you guys know if I get the source tracked down.
BTW here's a great site for explaining derivatives. If those of you knowledgable with derivatives sees any problem with the info, let me know because this is what I'm running with.
TS
My understanding is that is not strictly true and that both Lincoln and Kennedy issued dollars directly. Someone correct me who knows for sure?
Well, of course paper-money, paper dollars, or fiat money (money issued by government proclamation: fiat = "let it be so" in latin) can be issued directly - there is a question of whether anything is offered to "back up" this money, whether it could be exchanged for anything 'inherently valuable' perhaps gold. But these days nothing much 'backs up' the dollar apart from the idea that the US and its economic and monetary system is invincible.
The trouble as far as I see it is that we don't necessarily want to use 'paper money' - we far prefer electronic transactions. But the government has no ability to 'print' this sort of money, since it cannot be 'printed' and exists only as part of the banking system itself (it is sometimes called "inside money" by economists becasue it is created "inside" the banking system. If I put put $10 cash into a bank, the bank creates 10 'bank dollars', but is still able to lend out the original $10, and so on.)
So it seems to me that we need to invent a new type of money - 'electronic fiat', money that can be created without a debt attached, but tradable electronically. Maybe one way to do this is to have some elements of a cashless society, with a payment card which the government can top up with money it creates.
Make or break will be the distribtion of any new money and whether or not it helps promote a more sustainable society, or one that can cope more equitably with a declining resource base.
Of course, this sort of a monetary 'fix' will eventually be implemented on an international scale.
A book "Creating New Money" by Robertson and Huber may be useful:
http://www.neweconomics.org/gen/z_sys_PublicationDetail.aspx?PID=81
Stephen, Cambridge, England.
... and look where that got them. By the way, you are correct: Lincoln printed greenbacks, Kennedy silver certificates.
ToucanSanctuary
...Globally, the derivatives market is estimated to be over $1,000 Trillion. (Is that a Quadrillion??) The nasty aspect of derivates is that they are merely bets. Further you don't have to have an actualy stake in the event which is bet on. It's akin to purchasing fire insurance on your neighbor's house. We all know that bets have a winner and a loser. But both sides of the bet are booking the derivative as an asset on their balance sheet! This is causes overvaluing of the balance sheets.
Depending on the side of the derivative position taken, and subsequent changes in the price of the asset (commodity/currency/financial) on which the derivative contract is based, the change in value of the derivative shows up on each party's balance sheet as either a positive value (ie, an increase in assets or a decrease in liabilities), or a negative value (a decrease in assets or an increase in liabilities).
It is not true that both counterparties show the value of the derivative as an asset on their balance sheet. Each Asset for one counter-party is offset by a Liability for the opposite counter-party, as long as both counter-parties are using the same accounting method, at the same point in time. As this is a zero-sum game, as long as there is a consistent valuation methodology for derivatives (ie, mid-point between bid and ask prices) there should be no artificially inflated balance sheets. IMO, the only appropriate method is Mark-to-Market, regardless of whether the bid/ask spreads have widened, or whether there are any bids (ie zero value for the derivative contract).
Perhaps the idea to have a clearing house for derivative trading could lead to better price disclosure. Maybe also help to identify which trades are speculative, and which are non-speculative (ie, covered positions and/or offsetting trades made to cancel or to modify an earlier position).
BTW, all derivatives contracts have a settlement date (expiry date), at which time the true value becomes known. (After settlement it is zero).
...greg
Agree. The total of all derivatives is zero. For every long position there is a short position. This is similar to futures markets. The BIG difference between the futures markets and, say Credit Default Swaps (CDS) is there that is no central settlement mechanism. When you trade futures both the buyer and the seller have to pay an initial deposit to the clearing organization, and the two parties either pay or receive every day the daily change in value. Therefore the futures market is always over collateralized and if a party actually default the clearing organization can make the other party whole.
No such thing in CDS, or many other derivatives for that matter.
Two people can agree on a contract but use different models to price them, thus both show a profit. At maturity they have to settle up versus some kind of benchmark and the contract is extinguished. So even though the "real" value of all longs and all shorts is zero prior to maturity the two participants can show a positive value for their positions.
The Fed set up "work groups" consisting of market participants to put into place a central clearing (and pricing) mechanism but, surprise surprise, this never got done.....
WeekendPeak
It seems to me that the "real" total value of all longs and shorts is $0 only if all of the derivative participants have the financial capacity to make good on their contracts. The empty promises aren't worth much, even if someone paid for them. I suspect that there are a lot of empty promises in the mix--and will be more, as there are more and more bankruptcies. The promises of AIG would have been empty promises, if the Federal Government hadn't decided to step in and honor them.
This is the key point!
Also, if many big players like Lehman went bankrupt (or even a few), the market would be frozen indefinitely as everyone tries to get paid in bankruptcy court and the proceedings drag on and on and on, contested on all sides by financial houses represented by extensive dedicated legal teams...look up a story on how the Lehman Bros bankruptcy is playing out...
Too bad they didn't get that derivative clearing facility set up a few years before!
Clearing, schmearing. Half the swaps are held by the same five of six big Wall Street players that started this mess. Citi, Morgan - Stanley, Chase, Goldman, plus AIG and the GSE's who bought and sold them to hedge their own excessive leverage.
If you or I were to sell a Credit Default Swap and the buyer was to default, you or I would owe a lot of long green.
"Hey! Bite me, you can't get blood out of a stone!"
But ... if you or I start a bank that sell these things and then we get 'bailed out' by the Fed or the TARP buys some of our stock, a default leaves Uncle Sammy as the dude holding the bag. Unlike you or I, Uncle cannot just walk away snickering, this is the US Government, after all. It has to make things good ... and so the accumulated waste represented by these swaps falls upon the balance sheet of the taxpayers. As Gail points out, even if the interests of half the parties cancels the other half out, failure of a party to absorb financial responsibility leaves the underwriter with that responsibility. With trillions at stake, even a small percentage that are non- performing will hugely expand the US government balance sheet.
As for servicing the debt; the TARP enabling legislation increased the US government debt ceiling to almost $12 Trillion. Right now, interest rates are close to zero, non problema. If the interest rises, however ... to a 'normal' level of 4 percent .... this equals $480 billion per year. Since more government lending is being committed ... add $8 trillion to the $12 trillion you have $20 trillion ... times 4 percent and you get the total annual defense budget paid out as interest. Add the defense budget and a few other bagatelles and there is nothing left!
Now, it gets tricky, if the Fed buys all the debt itself, then the money for interest will simply be printed ... and added to the overall debt. Fine! After awhile the interest- on- interest begins to add up. In no time you are @ $200 trilion in debt. After awhile, welcome to the Weimar Republic!
Merry Christmas, America!
That is true, which is why a central settlement mechanism with daily settlement is so important. If a party cannot honor its obligations it becomes obvious after one day, and because the clearing system is overcollateralized, even if the party on the other side cannot absorb the one day loss the damage to the system is limited.
Obviously it is too late at this point though there are lessons to be learned. "derivatives" are not inherently bad or good. They are risk transfer tools. The trouble starts when one security can be priced at two different levels at the same time -which is supposedly impossible in an efficient market. Yet that is excactly what happens without a central clearing/pricing mechanism.
Rgds
WeekendPeak
The 2008 Financial Report of the United States Government gives some information about where its revenues are from. According to page 36, the vast majority of its funds come from individual income taxes--about $2.0 trillion in 2007, out of total consolidated revenue of $2.6 trillion. Spending was about $2.9 trillion, so borrowing needed to be increased by the difference between $2.9 and $2.6.
I would agree that it is difficult for the government to continue to collecting as much taxes if citizens are earning less money. This is one of the feedback loops that makes the current situation so difficult.
In the Management DIscussion-Long Term Trends section of the above report, I found this graph:
This indicates that the government realizes that it cannot meet likely future obligations, without even considering peak oil, or a decline in future resources.
This is Gail's second installment of political financial analysis for TOD and I hope it becomes a perpetual annual feature of TOD. I find little to critique on her comprehensive overview. Her attempt to relate debt and income and energy consumption on a per capita basis was particularly good as was her comment of unreliable and unrealistic inflation numbers. I would ask Gail if the various boxes were meant to be proportional to the real numbers and at the obvious risk of clutter I would have liked to have seen real data numbers included. For example I have read that Medicare and Medicaid have numbers estimated at $50 to $60 Trillion for the near future. If so, I would think that the box of unfunded pensions is too large. I would also have liked to have seen these debt figures related in some fashion to GNP. I know, more clutter, but it would be helpful to see the percentages in a model where the various components could be teased out. Also the round blue circle at the bottom is labeled “personal income.” Should that not also include corporate or business income or the personal contribution of GNP.?
Gail states that once debt is accumulated it can be repaid, defaulted upon or forgiven. Is “forgiven” not just a form of default? . I applaud her opinion that in an economy not growing, there is little incentive to assume debt because it is growth that allows the repayment of the principal plus the interest. I would also add that it appears that the Federal Reserve and the Treasury have made the decision to flood the universe with dollars as they become the lender, the banker, the decider and the printer of last resort. They have embarked on a massive program to purchase T Bills, agency debt, corporate debt and even corporations themselves as they attempt to pick winners and save their cronies. This benefits the first recipients of the money(banks, insurance, corporations) but not the later recipients(you and me). In their misguided attempt to stop deflation we are likely to see hyperinflation down the line, all of which supports Gail's hypothesis. The incoming Obama administration looks to be in full agreement with this strategy which just shifts debt to the grandkids who will be able to pay it off by a resumption of growth. Right. I hope I am wrong and Gail is wrong but if we are not, we are looking at a collapse scenario and default on a regional, national and an international scale. It is of course not a coincidence that this is occurring as the prime driver of economic activity for the past 150 years, cheap petroleum, is on the way out.Thank you Gail. I am looking forward to the comments.
It's worth revisiting Gail's predictions for 2008. Good job Gail!
The boxes are to some extent proportional, but by the time one gets to unfunded Medicare/Medicaid numbers and unfunded pensions, I really didn't have good numbers, which is part of the reason I left the numbers off.
Most numbers people have seen from unfunded pensions are from before the current meltdown. Companies have funded their pensions, assuming some selected annual growth rate (9% or more in the recent past) for a mixed portfolio of stocks and bonds. Needless to say, this growth rate hasn't always worked out, and this last year, it didn't work out spectacularly. There are some rules so that one doesn't have to immediately recognize the shortfall--I am not involved in this area, so don't know exactly how these work. If one could look through to see what the pension plans look like now, I think one would see a huge funding deficit.
For the biggest, furthest debts, like social security and medicaid, I'm not sure the absolute value even matters much. So much of the pay-as-you-go debts are more a function of how many are working/investing versus how many are retired/divesting that the real rates will likely shift, and the rules will shift with them.
You can only store wealth by having stuff that other people will pay for when you want to sell. I'm not sure that stocks, bonds, or some virtual account in an entitlement program will get people what they think it should. It'll be like swimming against the tide -- by swimming hard you may stay ahead of others, but still find yourself further from shore.
Wow. Thanks, Gail. Now a question: Do you have any sense about whether a person (or family) that has been responsible over the past decade and has little to no personal debt, besides a home mortgage, will be any better able to weather this transition to a non-debt based economy than the folks with the second and third mortgages and multiple credit cards and auto loans?
Round Tripper:
I see the person with no debt as a victim. His savings will be confiscated by a combination of taxes and inflation.
The even darker scenario would be something out of ancient history where no one is safe. Look at what happened in Rome, like the Civil Wars as just one example. The loosing party lost everything, their land, homes and most influential people lost their lives. Neither wives nor children were spared. Even Julius Caesar as a teenager had a bounty on his head, but was spared by a bribe.
I'm not predicting this outcome, but remember that the hyperinflation in Germany during the 1920's enabled Hitler's party to gain power.
I am trying to get a handle on this also.
My biggest fear is that society breaks down after unemployment hits some level. If that happens, all bets are off. Those who still hold a good job and a home will inevitably get "gypsy smacked" by the growing number of disgruntled masses.
While I'm a card-carrying doomster myself, in 'hours of darkness' I like to recall Adam Smith's famous observation that "There is a great deal of ruin in a nation." That is to say, it takes an awful lot of bungling to destroy a country.
Just to cheer you up.
A friend of mine (was born in 1920) told me that during the depression when unemployment reached 25%, many influencial people in industry and government were fearfull of another "revolution" and a possible takeover of government by the communist party or other faction. The rise in popularity of the communists, anarchists and others due to people's desperation caused a lot of sweating by TPTB in United States during the late 1930's. Same may hold true now.
I am probably in the responsible group myself, but I don't think I will necessarily be any better off. Of course if we have deflation, things might work out well, but I wouldn't count on that for very long.
I am afraid in the long term, our ability to transition to a new society may depend on different skills than the ones we have learned so far. We will need to be able to take care of ourselves, and somehow belong to a group that is able, in total, to take care of itself. We would be a lot better off now if we hadn't forgotten what our great-grandparents knew.
How true this is! Both sets of my maternal great-grandparents farmed prime Illinois prairie soil, on farms they owned, with horses. Most of what they needed they grew themselves. When in need of sugar, coffee, cloth, etc., they would drive their wagon to the nearest small town, stable their horses in the livery, then ride the steam train into the larger town where they procured supplies. The knowledge these unschooled people had to have possessed in order to have supported such self-sufficient lives is very impressive. My maternal grandfather's dad was a buggy maker and I have inherited some of his tools. Trouble is, I don't know how to use them. I can barely whittle an ax handle, let alone make spokes for a wooden buggy wheel. I'm far more educated than my great-grandparents ever dreamed of being, yet consider myself an ignorant fool compared to them. I'm glad to have had the opportunity to have learned just a little bit of my grandparents' gardening & animal husbandry skills from them, before they passed away.
Don't beat up on yourself - most people never did know how. There were specialists called wheelwrights or cartwrights that knew how to do those types of things.
If you can make a gasogene to power a truck or tractor from wood or charcoal, you'll be way ahead because of the resources that will be available. If people get hungry there's no guarantee that many horses will survive, but nobody's going to eat a John Deere.
When I was in college in the 1970s, as an exercise for an environmental science class, I designed a methane digester to run a junk car to split wood using a "stickler" type wood splitter. The "stickler" was basically a big screw that bolted onto the hub of a jacked up car, in place of a rear wheel. The digester was designed to convert hog & goat shit into methane, and required a scrubber & modifications to the carburetor of the car. I actually acquired the components to build this system, including a large steel tank for the digester, along with an old Pontiac and the stickler. Unfortunately, before the system was operational, the semester was over and I'd lost interest. I only had shit available from a single hog & small herd of dairy goats, anyway. But I got a good grade for the project and it actually should have worked...
Today I cut firewood (mostly Russian olive, Tamarix and Siberian elm) down along the river, necessitating hauling the wood upslope in a wheelbarrow. This is hard work for an old guy like me. My intention is to get a pony or donkey, build a small wagon out of scrap wood and junk bicycle tires, and have the equine do the work of hauling the firewood up the hill. I will need to buy a collar & hames but intend to make the harness out of nylon strapping available from the Army Surplus store. If the pony is tame enuf my granddaughter can ride it, but I intend it to be a working animal. And if anyone tries to kill and eat my pony, I will shoot them.
You may want to try running a garden tractor off biogas instead. Quicker, probably cheaper, and doesn't eat anything when not working.
My neighbor down the street has an idle tractor that he's offered to me. I'm collecting barrels for possible use making biogas, and I already have experience heat-welding 4 mil poly film. That may be my project come spring.
thanks gail! I too have been Impatiently waiting for u'r 09 forecast- as u may know if u check u'r email today. i'
ll get involved later as energy/time permit.
an article i have considered it's possible forecasts are below & some definite overlap w/ u'rs gail[it's in the email];
http://www.dailypaul.com/node/77699
So where to now? I believe 2009 will be the year that "spin no longer works". I truly believe that this coming year will be one of comeuppance for the U.S. Treasury and the Federal Reserve. 2009 is shaping up as the year that the credit spigot will shut tight on further U.S. borrowings from the rest of the world. This shutdown may or may not be called a bankruptcy, though it matters not, Uncle Sam will be shut out and shut down. This will be THE year of divergence of those things real vs. those things paper. Some will even discover that what they thought was real, really was not, ie. ETF's, pooled accounts, etc.. UGLY is too pretty for what I am afraid 2009 holds in store.
If I am even half correct in what I expect 2009 to bring, civil unrest worldwide and in particular within the U.S. will be commonplace especially in the urban areas. This unrest will be a result of market and bank closures, those with "cash" will be disappointed that it will not spend for more than a couple weeks after the initial "banking holiday". Those with metal will be disappointed that "goods do not grow on shelves". while those with "goods" will be disappointed that they don't have more, or even enough. Putting it mildly, 2009 will be the year of disappointments. I come to the conclusion that 2009 will be the year of the fiscal and monetary train wreck that must come at the end of all fiat Ponzi schemes.
thanks gail!
Great & interesting piece!
I was wondering if you could briefly define Growth, maybe an overview and a few examples in relation to your article.
Thanks!
Schuyler
Growth is more in some real physical sense, so that when it comes time to pay back a loan with interest, the person making the loan feels that he is getting more than what he started with. Printing more dollars with a printing press won't work, if it won't buy any more goods and services. If there isn't inflation, it could correspond to getting a raise each year, because of increased efficiency, or because the manufacturer you work for has developed a better process or has found more raw materials.
Thanks for your reply!
Your answer will help me to better appreciate your article, I think. :-)
I'm still learning the basics, though not from the conventional standpoint; Ecological Economics makes more sense to me since it takes into account very large factors and also long-term factors that the mainstream ignores; plus Ecological Economics has a solid foundation in the Laws of Thermodynamics.
From what I gather, the definition of Growth is crucial from an analytical standpoint.
e.g. Relative degrees of growth being an increase in consumption of resources, increased labor activity, increased trade, or increased efficiency by way of technological innovation...
In the Ecological model too, increasing throughput with all other factors remaining the same is very problematic if the limits to one or more natural resources is reached (or rate limits for recoverable resource systems like ground water, trees, fertile soil, etc. ).
Some of the ways I've seen our economy and living standards grow in my lifetime, at least where I live, include great technological advances, adding women to the workforce, and increased labor intensity with regard to certain economic sectors and geographical regions. So when the economy is in decline, I wonder what factors will come into play toward recovery.
So far, I like Steven Chu's idea of placing very great emphasis on improving energy efficiency and a shift in the energy resource base, though I would place a great emphasis on halting exponential population growth too.
Seems like economists of disparate philosophies are in agreement on the proposed "stimulus" plan being risky in itself though, perhaps only delaying an inevitable cycle of economic decline.
It does appear that our Economic Tower or system has built-in instabilities, but maybe the current languor is as much a result of inappropriate social factors such as failure of oversight, or deception & cheating the system, rather than resource limits?
If we could prevent sociopathy and negligence from skewing things, then the economy might regain some measure of vitality. I agree with the opinion though, that over the long term (within a generation perhaps? I don't think anyone can predict the time frame with certainty) factors other than labor and technology will be forced into play, and the economy will have to reduce it's overall throughput due to Resource Limits.
Schuyler
[Links to two great interviews]
Okay... After further reading I began to see what caused the blinking red LED in my mind when I read Gail's article. In mainstream economic -speak, Growth is apparently defined by GDP, GNP or even just in terms of dollars... Ecological Economics commentaries and articles I've read have what appears to me as a more useful definition: Growth defined as something tangible like increased access to natural or human capital, improvements in the physical quality of something through application of natural and human capital, e.g. Turning trees into houses! Converting natural gas and other feed stocks into fertilizer, using that, seeds and labor to grow food! So I was trying to get a sense of how Gail was defining Growth, which I think was the more tangible approach as opposed to the mainstream, which to me, does not appear as a metric that's been effective at re-enforcing sustainable economic behaviors.
Since reading Gail's article, I've also come across a couple of excellent interviews conducted by Jason Bradford, of Nate Hagens and of Chris Martenson, with both guests offering analysis and commentaries of fundamental factors & concepts relating to our current economic events, with an eye on how future events may unfold according to their comprehensive generalist or "wide boundary" approach to the subject:
http://globalpublicmedia.com/reality_report_nate_hagens_on_the_financial...
http://globalpublicmedia.com/reality_report_chris_martenson_on_the_curre...
"Peace on Earth and Peanut Butter & Jelly Sandwiches for All!"
Schuyler
Austin ,Texas
It would sure help if prices would actually come down. They blamed energy costs for higher fuel costs. Now that energy has dropped has food and restaurant prices dropped? They blamed higher fuel costs for higher shipping and production on things like furniture and the cost of manufacturing of autos. Have they dropped their prices?
In my area, I am still shopping for a house. Hopeless. I looked at some on Rough River Lake in Central KY the other day and the prices are idiotic and seem to be climbing.
I have been shopping stocks, and except for the big losers like GM and Ford and other auto related stocks and the financial houses everything is still way too high.
There is something about this whole "crash" that just don't add up...
RC
Gail,
Excellent post! As usual!
Small point: I thought that gas would soon become $10 a gallon? I distictly remember you informing the world of this important fact.
Is that now not relevant or off-topic or something? Please enlighten me. Maybe my memory is faulting a bit (I'm an old man), so I apologize if in reality you meant to say gas would be $1.50 a gallon.
I think that people have been pulled into looking at supply and demand curves, put together by our economist friends.
It is only when one starts thinking about feedback loops and the finite nature of resources that one realizes that the simple version of the story that economists have been telling us doesn't work. Of course, the economist's substitution theory, caused by high prices, no longer works either.
Gail,
Very valid points!
That's shocking!
I thought I go on my bike to work every day here in the Netherlands because gas is $8/gallon. This morning it was -10deg C! I have done so for years and years. But now you tell me that this does not make sense?
We wear big sweaters in the house, because NG used for heating is 0.65 euro / m3, with all the taxes etc included. That would set you back easily 10 euro (~$14) when you want to heat the house in the evening. Is this not a smart thing to do? I presume since the substitution theory doesn't work anymore, we should go back just switching on the heating, right?
Can I send you the bill for the NG and the petrol, until you have convinced me that the price doesn't matter anymore? It should only take you a minute!
I'm no economist, but I suppose there is always the option to substitute nothing, but if it doesn't fill the original need, it's simply demand destruction. Learning to do without will in no way prop up the "eternal growth" regime, it simply enables deflation. Your experience will be the quintessential example for most, I think.
Of course, if you can take part of the 10 euros and use the money to buy insulation or a solar thermal system, you'd have substitution at an affordable price.
Paleocon,
I think you misunderstand the concept of substitution.
Of coarse you are right that it is smart to insulate the house. However, that will cost me. And so will a solar tech-gadget. It will cost big-time.
It is smart to insulate my house because it lowers my heating bill and I will earn my investments back in something like 5-10 years. But it is even smarter to put on a sweater, because I will immediately start saving money, while investing next to nothing. I am just a little bit less comfortable.
Economic theory is about trade offs. Which option gives the most 'happiness'. There are no solutions, only trade-offs.
Everybody talks about solutions. But that is wrong. There are no solutions and people who talk about them should be ignored. There are only trade-offs that you make to get the best bang for your buck.
If gas is $1.50 a gallon, I will take the car to work and not bother to cycle. If gas is $8 a gallon as it is here nowadays, I think I am better off if I trade in my car and go to work on a bike. The gas money and the fixed costs for the car do not give me enough 'happiness' for the hours I have to work for them. So I will choose the option that maximizes my 'happiness'.
It doesn't matter if we are at, over or not even close to PO. If gas is $1.50, I will use the car, if it is $8 I will cycle. If we are before, after or right on top of PO: I will always make the same choice.
The only thing that matters is the price of gas (and the fixed costs of the car). Nothing else (within reason, of coarse). If there is less gas to go around, the price of gas will go up. That means that a lot op people will start using bikes. And this (simple) mechanism is why po is an issue on many fronts (national security, wealth, etc), but not wrt availability. There will always be gas, even in 200 years from now.
And that is exactly why food will never be unavailable. I am prepared to skip driving my hummer, but not eating dinner. That is the tradeoff. Which one make me more happy? Driving or eating. I will choose eating and thus drive less.
Nice work, Gail. The proposed stimulus package may give some respite; in the long run, it will not, serving only to make matters worse.
As I said over at AngryBear, unless some of the root causes are addressed at the same time, then there is little hope.
Then, of course, there is the lobby train that every politician boards as soon as his term expires--including the likes of Bill Clinton. Shameless.
We move from one crisis to the next, addressing only the symptoms, never the disease. Frankly, I have thought leaders were brighter than this.
And when resource depletion really hits--too much to think about.
Gail,
You are the clearest and most convincing economic analyst I have come across.
Probably means she'll be good at something else other than economics when the time comes. :)
Thanks. Maybe it is because I didn't come through the economics route--haven't had the standard MBA courses. Actuarial work (insurance forecasting) has a lot in common with some other financial work, but I missed out on quite a lot of the standard indoctrination.
I did go through the standard indoctrination (MBS, San Diego State, 1982). But because I had previously gone through substantial science (esp. physics and biology) I recognized it at the time as BS. Still played the game for the grade, but knew deep in my heart...
George
Nate has an MBA from the Univ. of Chicago, so we have an MBA representative on the staff also.
All of us went through standard indoctrination.
It happened when our mum's took us to the toys & candy store and showed us how "money" can be used to acquire the good life.
My mother tells the story that when I started kindergarten, I could tell time on my analog watch and I knew the multiplication tables, but I couldn't tell a nickel from a quarter. My dad had been teaching me all kinds of math and reading, but I don't think I had had many trips to the store. (One car family--My dad took the car to work.)
... But the question is, when did you first start being indoctrinated with the idea that "money" makes things appear in your hands (be it toys, candy, your first analog watch, your first math book, ... whatever)?
What I submit here is that indoctrination begins at a very young age, well before we begin to formally study "economics" in an educational institution.
Unless you were raised by the Rockefellers (the real ones), you almost invariably heard your parents talking about why Daddy "must" go to work to get "money", why we only have one car because we don't have enough "money" to get a second one, why we don't have Fillet Mignon steak for dinner every night, etc., etc.
In other words your perceptions about economics and money began to form well before you got to school.
My perceptions probably were a little odd. My parents were ones who probably didn't spend more than 75% of what they made, saved a huge amount, and gave a lot to charity. I don't think I ever heard the standard money chatter. We didn't have a TV either, although eventually we got one.
I tried to make certain my children never heard the standard money discussion either. Whatever money we had was always plenty for whatever we needed. My kids understood we didn't consider a fancy house or cars important. Now, as young adults, they seem to have that view also.
Gail,
In that case you were more than just "a little odd".
In most households, I'd venture to say, the number one song is/was: "Money Makes the World Go Round".
Give to charity? Whoa. A silent second song is/was: Gary Geko's "Greed is Good".
I am a little older than you. TVs weren't as common in the good old days. Some of my cousins never had TV growing up, because their parents objected.
Nate doesn't have a TV now. My husband and I do have TV, but it is virtually never used. It is in our basement, primarily for use when we have tornado alerts and go there to get out of the way.
Gail,
Thank you for a brilliant study.
Debt has in fact been unwinding since the beginning of 2008 at the latest -- the term 'debt unwind' being a synonym for economic contraction / deflation.
P.S. The WWW's guru of deflation is Mike Shedlock (Mish). He was one of the first to spot the trend (and explain it clearly to the educated public):
http://globaleconomicanalysis.blogspot.com/
Perhaps I should have said continuing debt unwind. The figures I show for household debt are flat, rather than actually down.
An impressive piece of work, Gail, as we have come to expect from you.
Several comments:
WRT your part 1, you failed to mention what I consider an increasingly dangerous aspect of the debt structure of the US economy. This is the fact that an increasing percentage of all that outstanding debt is owed to non-US creditors. I am old enough to remember being taught in my economics classes that the US national debt "didn't matter, because we owed it to ourselves". It has been quite a while since one has heard that type of talk, because it is increasingly untrue. The US balance of trade has been mostly in negative territory for decades now, but the trend lines have gone exponential and the gap has widened explosively over the past few years.
Obviously, this trend cannot possibly be sustained, and we are probably seeing the early stages of reversal right now. You do discuss this a little bit wrt energy, but that is only part of the total picture. It is not just that we are no longer exporting sufficient added value products to pay for our energy imports; we are no longer exporting sufficient added value products to pay for any of our imports.
This describes what has been happening, but does not really answer why it has been happening. The "official" answer has been to blame the beleagured American consumer - we have been buying too much stuff made overseas, so we are told. I doubt it. What has actually happened is a systematic dismantling of US export industries over the past couple of decades. This isn't just something that happened in response to forces beyond anyone's control. I suspect that what actually happened was:
1) Wealthy and politically connected people noticed that the US was becoming increasing dependent upon raw materials (not just oil) from overseas, and that the rest of the world was catching up and closing the gap that the US has over them after WWII.
2) They therefore concluded that there was going to be less and less opportunity to earn profits through exporting in the future.
3) On the other hand, they realized that there were good profit opportunities to be realized in developing the industries of other countries, especially emerging economies, and especially industries that exported to countries like the US - IF global trade barriers could be reduced.
4) Therefore, their project over the past few decades has been "globalization" and the reduction of trade barriers, disinvestment in the US, and investment in export-producing industries overseas.
Elaborate theories have been spun to justify this scheme to an inattentive and clueless public, and financial markets and official statistics manipulated to make it appear that the US was benefiting from this scheme. In fact, what was actually happening was the hollowing out and looting of the US economy, to the profit of a favored few and the impoverishment of the many. It didn't "just happen" - it was deliberately made to happen. By the time enough people wake up and realize what really happened and what was done to them, it will be too late. I expect that all of those who have benefited most (and thus can be assumed to bear most of the responsibility) will have already relocated themselves and their assets to some safe, extradition-free offshore haven. Some of the political puppets that they have bought will be left to take the fall, a few bones tossed to the howling pack.
As to your #2, I would just note that it is quite possible to have an economy that hardly grows at all. That, in fact, was pretty much the case for most of human civilization. It has only been in the past few hundred years that we have seen the phenomenon of real GDP growth rates in excess of 1% for any extended periods of time. Of course, it should be quite obvious to most of us here that, given finite and non-renewable resources (including a limited and probably already overshot global carrying capacity), economic growth in fact is not sustainable. We were bound to hit the end of that road sooner or later. It is quite possible, even probable, that this is it.
This, by itself, does not necessarilly mean the end of civilization or of any economy above the hunter-gather or subsistence farming level. As I pointed out, humankind has lived with what has essentially been a zero-growth economy for most of recorded history. We had managed to develop a lot of very decent artifacts of civilization long before the first hunks of coal were dug or the first oil well was drilled. Thus, at some point sooner or later (and probably sooner), willingly or unwillingly (and probably the latter), we will have to start adjusting ourselves once more to the reality of living within a non-growing economy. As you have explained, a non-growing economy cannot support ever-increasing levels of debt. I would argue that steady-state, sustainable economies (which is what we are really talking about here, and what we must eventually transition to), have a very limited capacity to carry any debt at all. It is not impossible that such economies can handle some debt; after all, debt has been known since ancient times, and if it were impossible it would never have been mentioned. I might just mention, however, wrt the problem of unsustainable rates of compound interest, that this is a problem only given an infinite series. If terms of borrowing are strictly limited to only a few years or decades at most, then the compounding of interest never reaches astronomical levels. As I have argued before, I believe that even in a zero-growth economy, surplus money available to be loaned out must have a rental value; interest is the rent charged, and it is charged to make sure it is profitably used and not wasted. In a zero-growth economy, there might be a little money available for lending, and it will be loaned at interest, but most likely only for a relatively short time period. This, at least, was the pattern in ancient times.
WRT your #3,, the news conveyed by your figure 2 would look even worse if stated in per capita terms. The US is one of the few advanced economies where the population continues to grow. Thus, real per capita GDP has probably actually been falling for at least a decade or more, especially if one trusts Shadowstats more than the officially-manipulated figures.
If we must eventually adjust ourselves to living within the carrying capacity defined only by renewable resources, and in a sustainable, steady-state economy, then I have yet to see any evidence to suggest that we can do so with a mean real per capita GDP that is any more than 25% of present US levels. Even that might be optimistic. If there is any validity to this assumption, then this implies that we have already started on the road to decline, but that we have a very long way to go. As I have stated in other posts, the fate of the US and its people is to become considerably poorer.
You mentioned the relation of energy to GDP, and the likelihood that the US GDP would have in reality been essentially flat (given a flattening of energy supplies) had it not been for the financial manipulations that had been played with the economy over the past few years. Subtract out the funny money, and the party is over. The next shoe to drop is the beginning of the long, relentless slide down the depletion curve. It is this that will assure that there is no hope of a recovery, that what we are going through right now is not a temporary episode, but just the first step in a long staircase down to poverty.
As far as your predictions in part 4 are concerned, the real problem is with predicting what people in high places will do, isn't it? The long term trends are fairly certain and there is very little that can make much difference toward them at this point. However, there is a lot of room for short-term variability around those long term trends, and this variability is very much susceptable to decisions made in Washington, Wall Street, London, Brussels, Tokyo, Beijing, Moscow, Tehran, etc.
I will venture just a few 2009-specific predictions:
1) We haven't really even began to see what inevitably must happen in the commercial real estate sector. We will see it this year. Expect to see huge increases in retail and office vacancy rates, and massive increases in commercial real estate bankrupcy filings and loan defaluts. The US had massive overcapacity in retail space even during the recent boom times; given the new economic realities, a majority of retail space is eventually going to have to be vacated, shut down, defaulted upon, and either torn down or repurposed. We are going to see the beginnings of this in a big way this year, but 2009 will by no means be just the end of it.
2) A lot of retailers will go out of business in 2009 - even more than the conventional wisdom is expecting. So will companies manufacturing stuff that retailers sell, unless that is stuff that people absolutely need, like basic foodstuffs. This will constitute another huge wave of debt defaults.
3) Just as the US has massive overcapacity in the retail sector, it also has massive overcapacity in the financial services sector. In fact, it is my theory that one (though maybe not the only) driver behind all of the monkey business, exotic concoctions, and general over-leveraging in the financial sector was due to the really legitimate and productive needs for financing being very limited. The "masters of the universe" were essentially making bogus opportunities for themselves, since legitimate real ones in the productive economy were so few and far between. To put it bluntly, most of these people were leaches on the economy at best, and more accurately agents of "creative destruction" (in a different since than Schumpeter imagined). The hard fact is that the US really doesn't any longer NEED most of the institutions in the financial sector or the people employed in it. We would be better off if many of these institutions were shut down, and their employees released to occupy themselves with less harmful activities, like watching soap operas. Will 2009 be the year that the US public - and more relevantly, TPTB in Washington - wake up to this reality and start to really pull some plugs? I don't know, but I also doubt that this reality can be denied or avoided very much longer.
4) I don't know how much longer the US dollar will be viewed by the rest of the world as a "safe haven" and thus propped up to a higher level than the state of the real economy justifies. I doubt that this will continue forever. This year may or may not be the year when everyone abandons the dollar and it plunges to zero. I do very much doubt that the US dollar is going to continue to do fabulously well, though, relative to other currencies.
5) I do suspect that 2009 is going to be the year when the trend in the US trade deficit starts to reverse. This is not going to be due to the US exporting more, but mainly due to our importing less.
6) As for oil, absent any catastrophic above-ground developments that suddenly disrupt supplies (and this remains a very real possibility and an area of great vulnerability), global and US demand will continue to be muted. Lack of financing is going to really hurt our long-term energy supply outlook, but 2009 is too early to feel this very much. We are still going to be pretty much in peak plateau territory in 2009, but I'm going out on a limb here and predicting that we will at least see the very first unambiguous signs that we are starting on the downslope. In other words, 2009 may very well go down in history as the last year in which supply was not perpetually short of demand. Oil prices? Who knows? My take is that this last summer we overshot the trend line on the high side, and this last fall we overshot on the low side. My guess is that in 2009 we'll return to something closer to where the long-term fundamentals suggest that we should be. This suggests to me that we'll see oil in at least the $60-80 range for most of the year. Or maybe not. ;-)
Thanks for your insights. I too worry about the lack of US manufacturing capability, and the fact that everything has been moved offshore. If we can't import, what do we do?
The small businessmen I talk to are less worried about their ability to manufacture than they are about their ability to get piece-parts and materials. It's hard to "buy American" now even if you want to diversify your supply base.
On the plus side, much of the knowledge to build and operate such plants is still here, but in the heads of retirees (or second-career individuals). As the economy tightens, they'll be looking for work just like the rest of us, and if there is a need they'll help fill it. Of course, it'll still take time and money, as a lot of the tooling and equipment is gone as well.
I wonder if some of the money in Japan and China won't flow back as capital to buy and rebuild US manufacturing? Before letting the yuan float free and the dollar crash, China could buy up a bunch of downtrodden US assets.
There has been a lot of obfuscatory talk by economists, but the prescription is quite simple: The US either needs to produce more goods for export to pay for its imports, or it needs to do more import-substituting domestic production - or do some of both. We are rapidly reaching the time where we can no longer pay for imports by printing money, these will be our only options.
Given that the rest of the world is hard up, too, and that there are plenty of places with lower labor costs than the US, our opportunities to build up export industries are quite limited. Airplanes? Boeing is already selling about all that they are likely to, more likely future orders are going to be cut. Weapons? Given the state of human nature, this is probably a solid long-term industry; however, there are limits as to how much fiscally-stretched governments can afford. Food? We are the breadbasket of the world, and could probably ramp up production for export a bit more; there are limits to that, and it doesn't take much before we shoot ourselves in the foot through rising domestic food prices. What else is there? Not much, I submit.
Thus, what we really need to do is put those millions of newly unemployed people to work at import-substituting industries. Such as?
-Producing a renewable energy infrastructure to substitute for imported oil. (This is an Obama platform plank, and it is a good one.)
-Building electrified urban mass transit and intercity passenger rail. This also will substitute for imported oil through energy efficiency gains.
These are probably the two biggies, but there are probably others that could be added to the list as well.
WNC- you've missed a third biggie, more accurately the elephant in the US McLivingRoom. You say "we are the breadbasket of the world". Yes, but only thanks to an unsustainable high-fossil-energy input agri-system. For how much longer? And that's the most important home industry needing reallocation of workers. You seem to think that international trade is going to continue to be important in coming years. I'd prefer not to bet on that. Forced localisation looks rather more to the point.
How long deflation? Perhaps it has to continue till the economy (of nation and of world) has contracted down to sustainable level, to the level of real wealth rather than pseudo. That's perhaps a third (or a tenth?) of its present, and many people will have to go bust and die in the process. Such a level of contraction is unlikely to take place in an ordered consensual way, so there is liable to be market failures, social disorder, failure of the urban food supply.
And at that point economics ceases to have much to do with the causality.
Great post Gail.
A couple of thoughts as far as the price of oil goes its complex under the covers its supply and demand but in my research the greatest drops in consumption seem to occur when housing construction declines after this further declines are a lot lower and in fact you just as often get scenarios where oil usage increases as the economy declines not decreases. The basic principal is you need to spend more energy to make a buck.
A simple example you sell firewood and normally a customer orders to ricks of wood but now they order 1 rick you deliver the rick in the same truck. Thus although you saved some by cutting less wood you spent far more on energy for transporting smaller loads.
Tons of these sorts of situations start happening. You drive to the store buy buy half the goods you used to or go to the mall and buy a tenth. In short transportation oil usage does not decline as fast as the economy. Housing has a much higher correlation since for housing its a case of building or not building. When a house is not built a large economic pyramid supporting constructing that house does not happen at all. You don't have near the partial solutions. The next effect is that changes in consumption become smaller as energy use per transaction becomes larger the net profit can become quite small but the energy will be used if any profit is possible. Thus without rising prices for energy we can expect energy usage to remain constant.
Now if supply cannot meet demand which I expect to remain close to days levels then prices will increase. At the moment overall world supply seems to be in excess of world consumption the amount of excess is critical since OPEC is cutting to try and shore up prices. If the excess is small enough they will succeed in causing energy prices to increase.
Now back to the economic model what happens is more profit is simply devoted to energy once profit margins are reduced to zero then prices must be increased to offset energy costs this simply causes less buying.
On the economic side attempts at stimulus may not cause the economy to rebound but they certainly will stave off contraction thus putting a floor under the ability of the economy to contract assuming energy prices begin to rise. In effect economy stimulus will result in a vicious cycle keeping demand high energy prices rising and net profit falling promoting more stimulus plans.
Certainly we can have a window of time between this final energy constrained economy oil prices could remain low but the longer they remain low as you point out the less will be invested in energy thus in my opinion we are certain to enter the high energy price downward spiral regardless the only question is when and this depends almost entirely on OPEC ability to control prices and the real supply and demand gap. If they fail to take control of prices then I'd expect us to see several years of low energy prices if they succeed then it should be clear within months. If energy prices start rising then falling profit margins will invoke ever crazier stimulus plans leading to in general lower net profits as energy demand does not contract like it needs to.
On the economic side I think that most people will be surprised at how long this tower of debt remains standing despite the feedback loops people will continue to allow the status quo to function even if its obviously dead. Given that the US government can and will keep the tower from tumbling by various TARP like programs what this really comes down to is when we will see a collapse of the treasury bond market and high interest rates ? I'd argue that as long as the succeed in preventing collapse then the market will be quite willing to give them as much money as they wish at low interest rates since this eventually leads to loans back into the financial sector. Its a game thats obviously a loser but everyone is going to keep playing as long as possible. When the choice is collapse or not then the fact your losing money is less relevant then losing the currency.
To see this by all metrics we should have flatlined back in 2000 this current debt bubble as you point out was a farce. The next bubble won't result in growth with the energy scenario I've outlined being a big part of the reason but we won't collapse thus I've called the next several year the period of the flat bubble. Simply not collapsing is going to be a ever growing debt bubble and as long as we succeed in not collapsing this bubble will be funded.
This says that to look for collapse we probably need to look outside of the US borders since once the US is forced to print large amounts of money to fund its own debt and its currency begins to decline its dead. This means that the big issue is not interest rates but when external Central Banks finally stop buying treasuries. I really think this answer also lies in oil/energy usage. As other countries also experience this energy deadlock where attempts to inflate increase the cost of energy and simply lower the net profit they will be forced to cease supporting the US in attempts to keep their own economies from collapsing. In fact keeping US consumption going is counter productive at this point since US demand is driving higher oil prices.
Only at this point do I think things will finally get vicious and the real world resource issues will trump monetary games.
At this point its no longer in everyones best interest to prevent collapse and in fact collapsing other countries to reduce energy consumption is now in your best interest.
So I don't see the debt pyramid collapsing for purely financial reasons simply because collapse right now benefits no one I see it coming later and being forced because of high energy prices. How much later is tough I'd say 2011 at the earliest with a range of 2011-2012 it all depends on when energy prices start rising strongly again. As long as they are low the game will continue since people can trade increased energy usage for lower but still decent net profits.
As and example of the fact we probably won't collapse because of a pure collapse of the financial pyramid I'd argue that if it was going to happen it would have already happened if investors where going to demand high interest rates from the US because of fear of default we would be doing that now. Given that the financial system has chosen to allow the US government to print money at will we can assume they will continue to do so until it no longer does any good.
So at the end we I think will see a sort of Indian summer for the next few years even if oil prices rise since financial games will be able to offest rising fuel costs for a time. And as long as oil remains cheap I think the end game won't even start regardless of how many bad things happen in the financial world since we have accepted the Government backstopping everything. Thus with low oil prices I really don't see a end to the ability of the Government to keep things slumping along they could pull it off for at least a decade.
You say you don't see things collapsing until 2011-12. I say in the beginning of the last section:
It sounds like you are about out at the "sudden three years from now" scenario. You might be right.
Yes basically a sudden one in 3-5 years is my bet.
The key is if we are intrinsically right on the TOD about energy then the game of fiat currencies must come to a end in a high priced energy regime. I suggest that any other collapse can probably be avoided simply because its clear that no one has a problem with creating immense moral hazards to avoid collapse.
To some extent this makes sense if your choice is a moral hazard that makes the system unstable vs collapse you take the easier choice. The concept is that in time the economy will turn around and be able to grow and if people become accustomed to significant intervention then you can continue to intervene for a long time. So from a purely economic stand point one would see Mish Shedlocks L shaped recession extending out for decades as the excesses of today and the next several years make it impossible to really grow even after the economy eventually gained a sound footing.
This also fits well with some things Don Sailorman has said about the Fed that have proven shockingly true they will do everything to prevent collapse. This seems to have reached the point that we are accepting actions that are actually illegal.
The only thing that I see that prevents the Fed from getting away with this will be high energy prices.
Ignoring energy on the financial side there may be other real constraints but I'd argue that they become important further out i.e greater than the 5 year horizon where energy becomes the limiting factor.
I don't have a link but Derringer who I like puts the credit crises for the US government at 2015 I'd suggest that this is the earliest that financial games alone could cause collapse. But you can see that if we return to a high priced energy regime it pretty much forces us into and economic collapse scenario.
And by collapse I mean a deep persistant recession with at least 10% unemployment looking at your pyramid of debt most of the non-essential services would contract dramatically. This is a lot of financial service employees on the street.
The bigger thesis is once we are firmly into a period of falling resource base then the world economy no longer needs the sectors dedicated towards growth and it can be simplified substantially. The remaining sectors at least for the time being simply don't need that many people to supply all the remaining and reduced demand. Our manufacturing capacity for actual needed goods i.e shovels is actually more than sufficient. Once you exclude waste manufacturing for luxury goods and a new car every three years I'd suggest that world manufacturing capacity for daily living items is sufficient lets call them durable household items.
I'd even suggest that US manufacturing capacity is more than sufficient to provide for the needs of the US not the wants but the needs.
So I think how we crash at the end really depends on energy if we have enough energy then we should see high energy prices only when the system attempts growth and as it grows energy prices would play a role in forcing it to shrink. This route would see us flat growth then contraction with a very slow decline this could well take decades or until the mounting moral hazard finally causes collapse.
So the next six months or so should be very telling about our future if OPEC manages to put us back into a high priced oil regime with the economy effectively flat on its back then its peak oil that will result in our failure as it forces the collapse of our fiat money systems. The financial games won't work because the nature of the currency no longer works on a fundamental level the economy has made a tremendous and permanent transition. Inflation in the sense of eventually being able to print our way out of deflation is impossible. So we will see.
You may be right about the timing. I would agree that an oil/energy price shock could cause everything to fall apart, and it doesn't look like that will come along right away.
With respect to US manufacturing capability, I worry that there are a lot of "holes". We may have trains that are currently operating, but we don't have the capability to replace the doors that stop functioning. The cars that we currently have will stop running quite quickly, if we don't have replacement parts (and probably more importantly, also diesel trucks). I believe that much of the US clothing manufacturing capability has moved to other countries.
Although people don't look at it we actually still build a lot of the factory equipment for factories.
I've been in several factories in China and Taiwan and almost all the equipment was from the US, Europe or Japan.
This is actually the critical type of manufacturing you need to retool factories.
And I don't see any reason for trade with china or the rest of the world to cease i.e the shirts will flow :)
I think there is a fantastic post opportunity for someone with the data. My opinion is that the manufacturing needs
of a steady state or shrinking economy which a good bit of the population poor or living day to day is far less then
the needs of any of the industrialized nations. If you include efficient recyling of the vast amount of junk stored in
peoples garages then we probably have a 100 year supply of stuff :)
If you include infrastructure scavanging then who knows how long we could recycle all the stuff thats in the US.
I agree with you that we would potentially see problems and shortages of items but I don't see that these cannot be
corrected fairly quickly assuming that the system as a whole does not collapse.
I guess I see a big gulf between the US transitioning to a second-third world type economy and outright collapse.
It won't be pleasant for many but its not in my opinion the end of the world.
For me at least what I see as collapse is recognizing that as our economy simplifies we have a massive excess of population
thats simply not needed. For the US to run a survival or stagnant economy under constrained resources we have between 100-200 million people that a literally not needed. In many places this ratio is even worse. I think the way to look at the problem is
to focus on excess population not collapse of infrastructure since it can be argued fairly convincingly that given this excess the remaining population that manages to be needed should be able to procure as much as they need and in some cases want.
Now for the average American such a scenario is for all intents and purposes the end of the world but thats not the issue.
The issue would be could such a society then transition into something that can survive the answer to that is unkown.
In a sense what this means is society will get one last chance for some when about 50% of the society is disenfranchised and reduced to abject poverty. We could still arguably pull out even under those conditions and on the resource side it really pushes resource pressure outside of food well into the future. Thus by turning on our own selves we provide a sort of last ditch stand.
Finally given that reducing a substantial portion of the population to abject poverty is the most effective way to ensure that resources remain abundant for those that are not impoverished I see no reason for our society to take and alternative path that requires those in power to reduce their consumption. Thus the most sensible approach if you look at the current economic system is to simply eliminate large numbers of unneeded and unwanted jobs. Probably the most vicious form of semi-controlled collapse we could execute which hints its probably the approach we are taking and fits well with the current situation. The powerful are supported and the "normal" people are left holding the bag so its really just a continuation of our current situation out in time.
So I think its important to define collapse of American society vs total collapse. I'd suggest that when 100 million Americans are reduced to abject poverty and facing starvation that American society has collapsed but this is not the point at which our civilization as a whole collapse but the point that it is forced to change.
You bring up some ideas I hadn't thought about. I guess it depends how powerful the people in power really are. I was thinking that they wouldn't be all that powerful. Many would be overthrown. Maybe we all need to work on becoming political powers that be--we would have better chance of getting things accomplished than as bloggers.
Way to many people benefit from the first round of impoverishment for it to cause a revolution. If you look in history revolutions happen generally when you have reduced the system to the ruling elite its support staff and the rest of the population impoverished.
Generally this occurs when 80-90% sinks into abject poverty. Before then the rats have no problem climbing on top of their drowning brethren.
A bit of a rant but if you look at it this way then you realize that supposed solutions such as EV's are actually dangerous. Over a year ago I said repeatedly that EV's would only be available to people who are wealthy and few would be able to afford new cars. The EV penetration arguments based on wedges using car sale volumes that used to exist where simply crap.
Given the current plunge in auto sales I'd hope that some people will wake up and see whats really going on. Alternative energy and alternative transport are in themselves neither good or bad but public transport proposals such as what Alan proposes have a huge potential for ensuring that ordinary people are not disenfranchised and reduced to poverty while EV's stand a good chance of becoming the domain of the Elite and can be easily used as part of a campaign to strip most people of their wealth.
Sorry to be so alarmist but people have to understand that socially solutions to peak oil can readily be twisted at the social level to eliminate and impoverish large parts of the population. Only two classes of alternative proposals work towards a social good for all distributed cheap alternative energy sources and electric rail. Wind farms despite their utility are expensive and can be controlled by a elite class at the expense of the general good.
So assuming I'm right and that the real problem is not peak energy but excess population and impoverishment of this population as energy declines one can readily see that we face a enormous social problem. If we do nothing then history indicates most of the population will effectively be enslaved as resource control is concentrated in the elite.
We certainly face a wedge but its not the one that the cornocopians envision this is of course simply because if you look at their arguments they assume implicitly that they will be in the elite class that will benefit and don't consider the fate of those that cannot afford their fancy new EV's and suburban houses.
Again sorry for lashing out at people but if you know history you should be very afraid of the trends developing now.
Thanks! You make some good points. I haven't studied history much. I guess I should.
I'd like to believe Memmel is right about collapse being held off for 2-3 more years. But I see much reason for lack of confidence. In the UK at present there is a rapid ongoing loss of jobs and businesses (Woolworths and Viyella closed down, the historic Wedgwood potteries in administration, Marks&Sparks cutting 2500 jobs). These things feed into a very vicious positive feedback which looks pretty much impossible for any government to tame, especially one as blinkered as the Wasteminster regime which is still hallucinating about the "need" for larger airports and grandiose Olympic white elephants.
Is the situation over your side of the pond much different?
I think it is the same here. A lot of things are working together to make things worse.
There have been a lot of layoff and business closings. These are rippling through the system, as people buy less.
All layers of government are short of funds and are asking for more money from layers higher up.
I see in today's news, "A Senate bill meant to give homeowners more leverage in renegotiating their loans cleared a hurdle as Citigroup dropped its opposition." if this is passed, I expect to see more loans written down in value, if the house is worth less than the remaining mortgage amount. This will work the same as any other debt default in the system.
Gail
How to say this I don't think most people realize how jaded life in the US and Europe is. I'm not saying that housing price won't continue to decline in fact in my opinion a lot of the housing stock will drop to zero value. Also I am saying that a lot of people in both the US and Europe and other advanced nations will eventually be living in abject poverty. But this is not collapse its the end of the good life for many. It will take time for this to happen but the intrinsic problem is globally we have to many people and declining resources in the West we have complex economies with many people employed in dubious or fluff positions and a lot of redundancies and inefficiencies. And these people consume a lot of energy per capita.
As and example lets say you have a population of 100% and want to reduce energy consumption by 20% the easiest solution is for 20 people to be reduced to abject poverty. As energy supplies tighten this is what happens. Next of course we have a real problem on the financial side in that the consumers i.e these exact same people are so in debt they in effect have no money and will have none for the foreseeable future if they paid off their debts in full. Next because of the overall economic decline even as they default they don't get huge amounts of free money certainly they free up cashflow for daily living expenses but they are no longer able to take on large long term debts. Banks have few credit worthy individuals to lend to and those that are credit worthy generally are realizing that prices have become highly distorted by the decades of cheap credit.
But this is not the end and the financial side can be dealt with for several years its obvious that the Fed will do whatever it has to to prevent a financial collapse and will be able to get away with it. So just looking at it from a financial side what I call a flat bubble makes sense. Mish Shedlock coined the term L shaped recession. What this means is they cannot fix our financial situation but for a while they can keep it from collapsing. I see no indications that the world is collapsing its starting to show signs that it has terminal cancer but thats not the end.
Whats come to a end right now ?
The FIRE (Financial, Insurance and Real Estate) industries will be scaled back significantly in the end I'd suggest they lose 90-95% of their current members if not more. No one that needs long term debt can get it and no one that can get long term debt wants it. Sure the Government can take over the role of these private companies but so what the industries are dead the profits are dead the US Government printing money for lending on homes does not save these industries and in fact in my opinion the current level of government intervention is enough to kill them. And its going to get worse. By becoming the lender of last resort to save these industries the US has also signed there death warrant. I'd say in California today if someone wants a house loan a prudent loan would be 30-50% down and 8% interest. Thats the terms a real bank would have to make to lend safely in this environment.
Can't be done.
Look at it this way if the Government is lending the money by printing it and your paying with your earnings and the interest payments are going back to the government cash is leaving the system. If the interest is going back to a real bank then its profits and its getting rolled over.
No of course with the cutback in real estate and fall in home prices a myriad of other industries are impacted and will decline and are esp higher end shopping a lot boosted by HELOC money.
But this is not "THE END" what is happening is you have a sick economy and its being transformed into a socialist and thence communistic command economy. The Soviet Union ran for some time under a ridiculous economy system. I suggest you hang on to your seat as ours enters the twilight zone. Eventually of course at least from reading history these sorts of economies collapse but it takes decades for them to finally fail.
Whats important is that the energy efficiency of the economy is in decline and I've given numerous thought experiments trying to show this on the national scale the indicator is we will see VMT start flattening even as economic decline continues i.e we burn more and more energy to make less and less money. If you look into command economies they also seem to always follow this route using gobs of energy to paper over the underlying economic problems.
So I think things on the economic side will hold together a lot longer then people expect this is not to say that a larger and larger precentage of the population will not start sliding down towards abject poverty strictly for economic reasons. But its a slide downwards for a precentage not collapse for all.
Next even as energy problems return which I fully expect to happen and still within 2009 we should see this simply act to accelerate the rate that people are disenfranchised.
Thus the basic forces that are in action have a reasonably slow time frame 3-5 years and maybe as long as ten. Its difficult to say until energy prices start increasing and we begin to understand the complex interaction they will have with our wounded economy.
The first price spike that ended in the first half of 2008 was during a period of expansion the next one is a completely different issue. As I said in my first post it will tend to increasingly checkmate financial games.
But we have plenty of room to fall. My opinion is we will see homes lose 75-95% of their value in many areas with 50-60% certain regardless of area. We will see incomes return to average one wage earner per household. In general despite the doom and gloom most households have two wage earners and most are losing only one to unemployment. Thats a huge lifestyle hit but not the end.
So lets say we fall to 1-1.2 wage earners per household. Next of course all kinds of goods esp high end stuff like autos will drop to a fraction of their current sales price. Most of this will eventually be driven by relentless increases in energy costs.
Now thats how low we go before we really start seeing collapse i.e true abject poverty as more and more families permanently lose the only wage earner now at this point you start to see real collapse.
I guess given the basic forces that are acting I see no reason that the US economy cannot rollback steadily to at least a 1 wage earner no new car no expensive house living standard. Its only once it hits this level that further contraction results in people really losing their ability to survive.
If you look at the current trends the contraction should continue basically like it is now in the FIRE plus auto industry. Nothing can stop this but on the same hand it does not mean we are actually collapsing. Certainly other industries will shrink around these core industries but we can afford for effectively 50% of our labor force to become unemployed and people can still make a living.
A lot more frugal but its not "THE END".
Of course we can see more contraction to this but using what I've outlined its obvious that with two wage earner families we can easily see 25% unemployment rates today without collapse so its wrong to compare now with the great depression. Next again people really don't fathom how inflated housing prices are and how far they can fall and rents will do the same we can take a enormous hit on housing and rents given our current situation before we even begin to have problems.
I'd suggest that Detroit serves as a perfect model for the future of the US over the next several years until the US overall hits Detroit levels then we are still functioning.
http://www.infowars.net/articles/december2008/231208Detroit.htm
This gives it as 10.6%
http://www.bls.gov/news.release/metro.nr0.htm
This gives 20%
http://www.simplyhired.com/a/local-jobs/city/l-Detroit,+MI
Detroit is still functioning and I suspect it will continue to function even as unemployment approaches 50%.
Its when it gets close to that number that we begin to see households lose all wage earners.
So track Detroit.
On the VMT side. I don't have Detroit data itself but the North East is inline with the rest of the country on VMT.
http://www.fhwa.dot.gov/ohim/tvtw/08octtvt/index.cfm
http://www.fhwa.dot.gov/ohim/tvtw/08octtvt/08octtvt.pdf
The PDF shows Michigan at -5.8 percent for October and -10.4 for Sept. Its in the bottom half but other
states show bigger VMT changes.
And given the current state of Detroit its in really sad shape. Not the end but far from healthy.
Michigan overall is in bad shape also.
So the bottom line is that the basic forces that will destroy us have just got rolling we really don't
have a good fundamental reason for it not to take several years to collapse.
Of course some complex interaction in this stressed system could cause us to collapse. Indeed our current partial collapse is because of a complex interplay of factors. More crisis are certainly in store.
So just to finish when your house has lost 75% of its value and your spouse or yourself your job and if you had a Mortgage and are now renting as a family of 4 in a one bedroom at that point we will begin real collapse. Before then we might get and event that collapses us early but we have to hit this level before real collapse starts. And this has to happen to 25-50% of the population !
I'm still sceptical of your case for things not collapsing in the next year or two, but will try to find time to consider your post above more thoroughly, and perhaps reply back either here or elsewhere.
Thanks or your thoughts. So far, the US government is doing its best to keep up the FIRE industries. As long as they can keep this charade going, there won't be a big cut-back in employment. It seems like there is a discontinuity when the government can no longer keep banks, insurance companies and the like functioning as usual.
Gail-
Another excellent post.
We need a new economic system that is also much less profit based. Or at least one where profit doesn't trump all other considerations. One where it is possible to plan for shrinking (edit: retrenchment - I slap myself), not growth, and make the necessary expenditures. Where it is possible to raise taxes on the weathy and wind down the war machine in order pay for the expenditures in order to preserve the currency. The profits that drive the system now are virtual profits in any case, debt based profits, ever less collateralized. The madness of the frenzy to preserve this whole edifice is becoming more evident by day.
I agree. In a post that will run sometime in the next week or two, (my letter to Obama), I say that I think employees should be given the opportunity to buy the bankrupt companies. Somehow, we need a different model than the profit model.
I did not see this posted before, and I thought it would spark some good debate, and add to the education here
Fundamentals of Crude Oil Pricing: Part I
Posted on: October 27, 2008 - Email Article - Printable Version
http://www.bullishbankers.com/fundamentals-of-crude-oil-pricing-part-i/
it is a five part article that covers
factors that have been affecting crude recently:
* Fundamentals of Supply and Demand
* OPEC
* Russia
* Shortages, Stockpiles, and Decline Rates
* Discoveries
* Currency
* Refiners and the Crack Spread
* Geo-political Tensions
* Weather Threats
* Fear and Uncertainty
* Other Risks
Interesting analysis.
I think that bartering will come more into play in day-to-day economic activity.
I also think that forces to "equalize" pay (not necessarily "wealth" in a retroactive sense) will become more stronger. After all, money will need to be spread around so that more people can spend it. This doesn't require growth to keep the system going.
Just my $0.0198237's worth.
Gail, This is my first venture at commenting on your work which is excellent. I must comment on the issue of correlations between asset classes during a crisis. First over time the negative correlations between asset classes and markets decline. This is caused to some extent by improvement in communications but also by technology, the standardization of accounting rules, and just the search for non correlating assets. Just as the odds in a horse race change as money is bet the correlations in investments change as money flows in and out.
The second reason correlations are dynamic and not static is structural changes in the markets themselves. For example in this latest debacle the yield curve remained flat for years even though growth worldwide was a high levels, energy prices were acting as a negative to growth. The reason for this was the disenfranchisement of the tradional banks from their role as arbiters of risk. Normally when leverage increases and cash flows fall the banks begin to restrict credit as a risk control measure. They are assited in this effort by the central banks. In the most recent case the central banks and the commerical banks beleived that were transfering the risk to others (the hedge funds and other risk takers) and so they had no need to reduce credit since they were not at risk. There was a flaw in their business model however. The banks with central bank acquisence were lending money to those taking on the risk and to accomodate the transfer of risk the banks maintain positions in some of the less attractive parts of the structure finance vehicles until they could repackage it. When the game stopped the banks were trapped by the inability of the risk takers to repay, the declining value of the retained assets, and the fact that the central banks had allowed the commerical banks to conduct operations in the structured markets outside of traditional bank regulations.
You are correct that some of the debt is pyramidal but there is another reason. In 1998 when Long Term Capital collapsed its founder John Merriweather was lameting to a Wall Streeter the fact with the thought that he did not understand what made the correlations between the assets classes change so quickly. The Wall Streeter said to Meriweather " John you were the corelation!"
The assets are positively correlated becuase everyone owned the same stuff because everyone was convinced they had a better black box to transfer or dispose of risk. They did not. The commerical banks again demonstrated they are without a doubt the most feckless of all fiancial institutions and they are being disenfranchised of their role in favor of a governement controlled bypass. When you build a bypass road around a city it is not to long until McDonalds, Starbucks,Home Depot or other such place establishes an outlet on the bypass. The banking system as we knew it is done the new system will growth until it has an opportunity to demonstrate that the difference between genius and stupidity is that genius has limits.
You are right in that there are other reasons for the high correlations of asset classes, especially in times of stress. I sometimes think that people built models assuming the variables were "independent" and "normal", just because the mathematics is easier that way. In no way is the real world full of independent, normal variables, and all of the black boxes built on this assumption led people down the wrong path.
Thanks Gail.
I learn more from you than I do from the internal briefings that I get here at work - you dare say the things that people here can only imply.
Thanks!
It is much easier to get paid saying things that conform to popular thinking. I guess that is why we are volunteers.
"I would expect that many (or most) other economies in the world will be dragged along in this debt unwind and will experience a decline in their standards of living."
i think this will be true-like for now & maybe some worse but i think the other economies are realizing that they need to 'cut loose' from us because we are going down further than they have too[we had/have the greatest debt/bubbles].This is evident by new york & london being the 'financial capitals of the world'- london might be worse off than us due to resource constraints.
" Cutting loose" in part might be stopping buying our treasuries[or worse selling them] & there may be a 'rush for the exits'; which i expect will at least cause this 'unwinding of debt' to be at least in steps, not a slow decline. The lack of control the bailout, etc. has had argues that this is happening in a very 'out of control' manner.
My fear is with all the major countries 'unwinding with us- us pulling them down' a war is very likely; as largi says- trade war or war.
Thanks again. Big decisions to make & wanted to see u'r 09 forecast; & yes as said above excellent clear writing & connecting dots.
I suspect significant unwinding sooner than later as all powers recognize there are not "enough chairs".
--
WRT this years predictions, would it be possible to change figure 3 to $, divide by population and then compare to figure 2 -- ie, what $ of income is going on energy?
also, could you add a "debt adjusted by inflation" line to figure 2, so that we can compare the growth in real income to the growth in "real debt".
Given that the price of many items is falling quickly, and also the production of many raw goods is down (eg cars) i find it unlikely that there will be anything but economic contraction over the next year. Given that for the last (long time ~100 years) the long term growth outlook has been up, there could be quite large changes coming when people begin to realise that the medium-long term outlook (10-40) years is possibly not significant growth.
--
Lets see how last years predictions went:
1. Many monoline bond insurers will be downgraded in 2008, and some may fail.
http://ml-implode.com/ -- 313 mortgage lenders gone -- does this count?
2. More and more people influential in financial markets will begin to recognize peak oil.
I think that peak oil awareness is only slightly increased, due to the severity of the other items, although i think climate change has made more inroads.
3. Long term loans, including those for energy companies, are likely to become less available as awareness of peak oil rises.
Check on the lack of long term loans, but for economic reasons, not peak oil awareness related reasons.
4. There is likely to be a serious recession in 2008, deepening as the year goes on.
Check!
5. At least several large banks will fail.
does AIG count? i think that the goverment loans offered to banks prevented this to some ammount.
6. The amount of debt available to consumers is likely to decline.
check.
7. Fannie Mae and Freddie Mac may need government assistance.
Yes, they recieved goverment "assistance".
8. A new class of homes -- those "never to be sold" -- will emerge.
i'm not sure on this one.
9. Politicians will continue to make attempts to help homeowners, and perhaps other types of borrowers.
home owners - does a decrease of rates to 0% count?
"other" types of borrowers - check.
10. The amount of structured (sliced and diced) debt issued is likely to drop to close to zero.
11. Besides banks, many other players in financial markets are likely to find themselves in financial difficulty in 2008.
check.
12. The value of the dollar will fall relative to some currencies, causing the relative price of oil to rise.
check, sort of -- the US$ index has fallen from 120 to 80 or so, but the price of all fell due to decrease in demand (after increaseing a large amount).
13. The stock market probably will decline during 2008.
check.
14. Prices are likely to rise in 2008 for food and energy products. Prices may decline for homes and non-essential goods and services.
check.
15. There is a chance that some type of discontinuity will make financial conditions suddenly take a turn for the worse.
does the continuation of a 9.4 sigma event, and another 6.2 sigma event count?
http://ftalphaville.ft.com/blog/2008/09/25/16327/what-price-risk/
so it looks like last years predictions are about 13/15 (several items were only 1/2 right).
2c worth,
Andrew
I have been getting an education at "The Automatic Earth" ... now ... I'm getting more here.
The media is only giving the bright colors of the spectrum of the opinions. The blogs are filling the whole spectrum.
jal
I put together two different per capita graphs. One is energy consumption in BTU's, for US produced energy vs imported energy. One can see that energy consumption peaked in 2001 on a per capita basis-probably part of our problem.
I also put together Figure 2 on a per capita basis, showing the growth of debt and employee compensation. It shows very flat employee compensation on a per capita basis. If I had been using a more realistic measure of inflation than the GDP deflator, employee compensation per capita would have been declining.
I am not certain I have the right energy prices to use for the other comparison you are asking for. Hope these help!
In other words, if we had just been really serious about substituting energy conservation for imported oil from the 1980s on, most of our trade deficit would never have existed, the mountain of debt would have been a molehill, and we would not have painted ourselves into such a tight corner as we now have.
In other words, if we had re-elected Carter and followed his clear-headed (if poorly "marketed") ideas about conservation, we would not be under this mountain of debt, and probably would not have felt compelled to invade an oil-rich country?
IM<HO, that is about as true a statement as you can make about such matters.
Eight short years ago, we were talking about paying off the national debt (how quick, etc.). How quaint in retrospect !
Carter was about to start on an "all fronts" effort to deal with oil. Miami and Atlanta got the start of a what could be a decent Urban Rail network. (Miami has approved a 25 (?) year plan to build 103 miles of elevated "subways" that will put over half the population within 2 miles of a station).
A Lost Hope,
Alan
Not just that, there were actually lots of articles in the papers about people worrying about what on earth we will do when there are no more Treasury obligations to invest in!!!!!
Not quaint -- ludicrous is more like it.
Re: Miami - Paradise Lost AGAIN
http://www.miamiherald.com/news/columnists/larry-lebowitz/story/723765.html
Ah yes - a new Baseball Stadium and a tunnel to the Port of Miami (can't inconvenienee all those (fewer and fewer) cruise line passengers).
Best Wishes for your success in DC.
Mr. Drake goes to Washington.
Pete
The "right predictions" were because of the credit crisis and I think the interpretation of what was right is overly generous. the correct aspect of the result conicided with othe excessive risk taking and poorly structured credit swaps and loose due diligence by banks and hedge funds. Financial bubbles have happened in the past that are not related to peak commodity.
I had indicated that there needed to be differentiation between the financial and housing mess that was occuring and obviously in motion at the start of 2008 and any oil effects. The financial mess clearly get more worse throughout the year. Sans-peak oil the financial mess will be worked through in five years or less and most likely late 2009 up to 2011.
The peak oil/high oil price aspect was an extra $1.2-1.5 billion per day out from the US to oil exporters when prices were at the peak.
Also, the severity of the recession was supposed to be depression level in scale.
Thanks Gail. I'v read nearly the entire thread and find it both very informative and very, very scary. Can you elaborate a bit on the effect of US and world population growth as it relates to your 2009 predictions? The US population growth rate (birth rate and immigration) is moving us from 300+ milliton toward 400 million in the not too distant future. Current world population of around 6.7 billion is projected to reach 10 billion in several years. It seems that it is a significant part of your thesis that constrained natural resources will be a heavy contributing factor for an impending decrease in our general quality of life. As it also appears that huge strides in more efficent use of natural resouces is not likely in the near future, is not population growth something that will worsen the situation? And given that the govenment and corporate leadership in the US has zero interest in supporting meaningful family planning, does this also not worsen the situation? Conversely, if strong family planning measures acutally worked, would this not undermine a basic foundation of our national need for the kind of growth that has historically been fueled by ever increasing numbers of people (ie consumers)?
I expect world population growth will come to a halt pretty quickly, and perhaps even US population growth. None of these things are going to happen nicely. I think there may be riots and food shortages, even in this country. There are going to be parts of the world without enough food. All of these things will put an end--quite quickly--to the population estimates you have seen before.
At the same time, the birth rate may actually go up, because contraceptives are likely to be less available, and people will want children to take care of them, if Social Security is not "there" for them. The offset may be more deaths from all causes.
There are many millions of immigrants in the USA, and perhaps as many as 20 million illegal immigrants. Pressuring the illegals to go home (either directly through deportation, or indirectly through monetary pressure like E-Verify) could cut the US population by a substantial fraction relatively quickly. Eliminating welfare benefits, language services and the like to legal immigrants (especially "refugees") would prompt a great many of them to return home also.
The per-capita earnings of these groups are rather small, and they consume a great deal of public services. Such measures could improve the per-capita situation of the USA overnight, as well as giving government balance sheets a big shot in the arm.
As always from Gail, a thought-provoking post with many interesting comments.
Something that seems obvious to me: if unemployment/inflation/deflation gets bad, it will not be political Business As Usual. As Gail says with droll understatement:
Of course this means political turmoil. Different groups with different interests struggle to gain control. At best, the transition is relatively bloodless.
In any case, whatever technical changes to come (e.g. new kinds of currencies) will be subsidiary to the political changes.
We've seen a dramatic political change with the election of Barack Obama, driven in part by the sick US economy. I think this is just the beginning.
Second comment. We have to keep in mind the high uncertainty surrounding events. As Gail keeps emphasizing, the trends are interconnected. A Black Swan in one area will cascade throughout the world.
So I think it's better to think in terms of a variety of scenarios, rather than to argue about which is THE most likely.
I agree.
I can't tell you exactly how things will turn out, but the omitted details are probably not nice ones. There is a limit to what one can write in a post, without scaring everyone to death. There are a variety of scenarios that are possible going forward, and they will be influenced by events that happen here and around the world.
I think you nailed it on personal income. Not coincidentally, it's a hot topic on Daily Kos too:
Conspiracy of Silence: Wage Collapse Caused Crisis
http://www.dailykos.com/storyonly/2009/1/6/85124/90803/713/680687
There are an awfully lot of under-employed and part-time workers in this country. Recent college graduates are particularly hard hit. If someone could link to my article on Daily Kos, that would be good.
I woke up this morning with 2 thoughts: asset price deflation and shortages.
Asset prices will decline because asset prices are currently supported by a tremendous amount of debt which cannot be paid back (I call this imaginary money). Therefore businesses, houses, stocks, buildings, vehicles, all asset classes will decline in value in real terms (the government could decide to keep asset prices constant at the cost of rampant inflation). The asset classes which will retain their value the best, will be those that are cheap to run: well insulated small houses, bicycles, etc.
Yesterday our library was closed because of lack of heat (Russia-Ukraine problem?). With energy prices low, energy producers will not make the effort necessary to have timely deliveries. I expect energy shortages as was experienced in the South East after the hurricane. I expect these shortages to ripple into other areas, as Gail mentioned in an above comment, food shortages could be a possible consequence.
I feel that there will be 2 economies. There will be the official, shrinking economy with taxes and payrolls and so on, and there will be a parallel survival economy. The survival economy will have several forms, but it will essentially be, people taking care of themselves, whether it be by scrounging waste from the official economy, producing one's own food, capturing rain water, etc. My strategy is to invest in both economies so as to be able to use the considerable resources of the official economy for projects, but to be ready in case the official economy breaks down, to fend for ourselves. I think a strong family network is essential.
I think you are right.
Somewhere near the top of the comment thread, someone asked me about the unemployment rate. I said it was really a matter of more and more people moving out of the official economy to an alternate economy. I gave examples of growing ones own food, or dismantling unwanted buildings (probably illegally) as being part of this economy. Eventually (perhaps suddenly) the alternate economy will overtake the other official economy.
Worldwide it has already. The informal economy is 75% of world economic activity, according to Teodor Shanin, the father of "Peasant Economics." It may be a while before it overtakes in the US, but it is important to remember that the collapse of the formal economy essentially feeds the informal economy. I spend a lot of time discussing this in _Depletion and Abundance_ because I think beginning to make the shift and put one foot into the informal economy, diversifying income sources is really important for people planning to do well in the coming years.
I also think this is important information because it reshapes our thinking. Noting that the formal economy only needs about 1/3 of all workers, and that it only produces 1/4 of all economic activity worldwide helps us put in perspective our relationship to the formal economy. It isn't a lot of consolation when we depend (as most Americans do) heavily on the formal economy, but it is a different way of thinking than imagining the formal economy crashing and leaving...nothing. Instead, there exists this limited, but ultimately more robust informal economy that is larger than the formal one.
BTW, I consider Maria Mies and Veronika Bennholdt-Thomsen's book _The Subsistence Perspective_ to be a really useful and important book when trying to answer the increasingly urgent question "what's left when the formal economy unravels." I recommend it highly.
Cheers,
Sharon
I have only recently found this web site. As an "ordinary Joe", I find some of the predictions here scary. Are the paths that the US and global economy have started towards set in stone? Are the likelihoods that have been suggested here, i.e. people needing to grow their own food, a return to the bartering system and such, our future or are they what might happen if the worst case scenario occurs? Is there nothing that can be done to change our course? I have seen some excellent analysis from some obviuosly bright people on this thread, but I have not seen anything that would allow for these possible scenarios to be just that...
Welcome:
When I first started frequenting TOD, I found many scenarios implausible, or as you say, "worst case".
The more you study this site and links that are provided, some gaps are gradually filled in and I suspect you will see that many of these scenarios are more middle of the road than "doom and gloom".
A big part of the process is wrapping you head around just how much trouble we are in.
Good luck!