| EROI Update: Preliminary Results using Toe-to-Heel Air Injection | The Oil Drum: Net Energy | Using Thermodynamics to (Re)Examine Environmental Kuznets Curves |
Further Evidence of the Influence of Energy on the U.S. Economy
Posted by David Murphy on April 16, 2009 - 11:11am in The Oil Drum: Net Energy
In his recent report, James Hamilton states that:
With hindsight, it is hard to deny that the price rose too high in July 2008, and that this miscalculation was influenced in part by the flow of investment dollars into commodity futures contracts. It is worth emphasizing, however, that the two key ingredients needed to make such a story coherent— a low price elasticity of demand, and the failure of physical production to increase— are the same key elements of a fundamentals-based explanation of the same phenomenon. I therefore conclude that these two factors, rather than speculation per se, should be construed as the primary cause of the oil shock of 2007-08.
Hamilton continues:
At a minimum it is clear that something other than housing deteriorated to turn slow growth into a recession. That something, in my mind, includes the collapse in automobile purchases, slowdown in overall consumption spending, and deteriorating consumer sentiment, in which the oil shock was indisputably a contributing factor…Eventually, the declines in income and house prices set mortgage delinquency rates beyond a threshold at which the overall solvency of the financial system itself came to be questioned…had there been no oil shock, we would have described the U.S. economy in 2007:Q4-2008:Q3 as growing slowly, but not in a recession.
Hamilton acknowledges early on in his report that the proportion of income spent on energy is an important determinant of consumer spending patterns. The theory is fairly simple: if energy expenditures rise faster than income, then the share of income for other things besides purchasing energy must decline, such as spending on mortgage payments for a second home in Las Vegas. In other words, rapid, large increases in energy prices may curtail consumption enough to trigger larger financial problems – like the bursting of a housing bubble – that when aggregated across an economy may cause or contribute significantly to a recession.
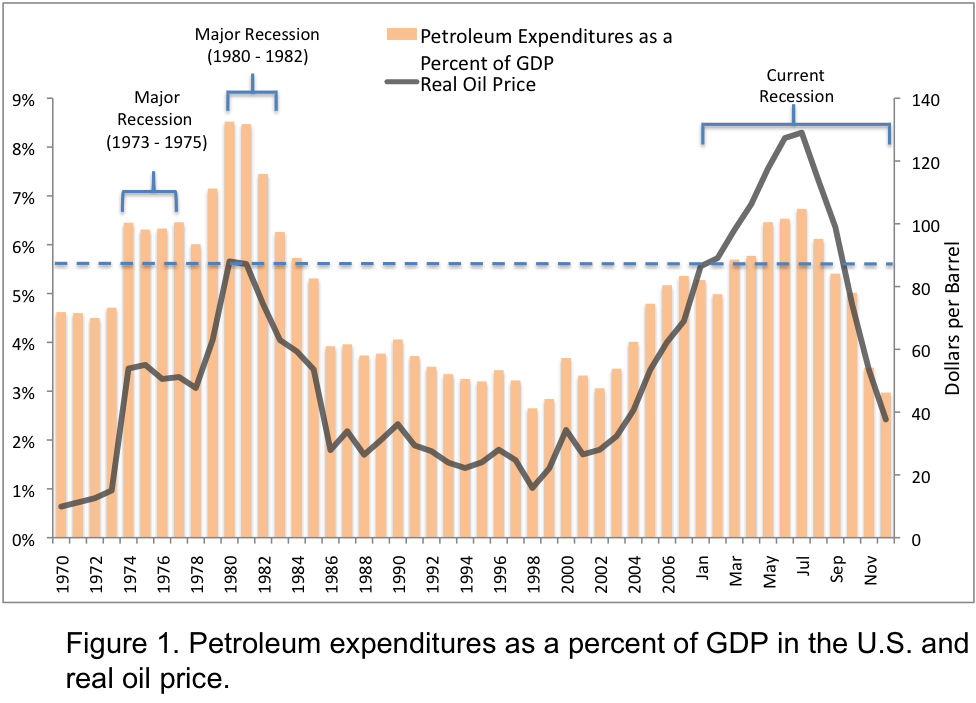
Figure 1 shows petroleum expenditures by consumers as a share of total GDP. Monthly data for 2008 was annualized so that each value represents what the petroleum expenditures as a share of GDP would have been had the expenditures remained the same until the end of 2008 (i.e. the value in March of 2008 represents what the annual expenditures would have been if the level of expenditures in March remained constant for all of 2008). We did this because the increase and subsequent decline in prices and consumer spending occurred within one year, so that using annual averages actually “annualizes-out” the volatility of the data.
Figure 1 shows that slow economic growth and even recessions tend to occur when petroleum expenditures reach about 5 or 6% of GDP.
This relation seems to be consistent for the major recessions but not for the minor recessions that occurred in 1990 – 1991 and 2001. However, a clearer picture is painted by looking at the year on year change in GDP and the year on year change in percent of GDP spent on petroleum expenditures (Figure 2). In this graph it is clear that rapid increases in the price of oil leads to rapid increases in the percent of GDP spent on petroleum which is followed by a slowing of economic growth, i.e. a recession.

Although neither correlation nor causation between expenditures and recessions are tested explicitly in these figures, the implication is certainly present. Every major and minor recession in the past 38 years was proceeded by a rapid increase in prices and expenditures on petroleum. This does not mean that recessions are caused, or caused solely by increasing oil prices or expenditures on petroleum, rather that it is a common pre-condition for recessions.
Often there are exogenous and/or endogenous factors that seem to exacerbate the economic climate during times of high petroleum prices and expenditures, which taken together, can cause a recession. The major recessions of the 70’s and early 80’s were driven clearly by exogenous supply perturbations, while the recession of the early 2000’s (dot-com bubble) and the current recession (housing bubble) were driven by endogenous financial problems. Nonetheless, the common factor to all of these recessions was a rapid and large increase in expenditures on petroleum.
The next phase of this research will test statistically for correlation and causation within this data set. We welcome any comments/critiques/alternative theories.
Contact
- theoildrumeroi at gmail dot com
Personnel
Archives
- October 2010 (1)
- September 2010 (1)
- August 2010 (1)
- July 2010 (1)
- June 2010 (1)
- April 2010 (1)
- March 2010 (2)
- January 2010 (1)
- July 2009 (1)
- June 2009 (1)
- May 2009 (2)
- April 2009 (1)
- March 2009 (1)
- February 2009 (1)
- January 2009 (2)
- December 2008 (1)
- November 2008 (1)
License

This work is licensed under a Creative Commons Attribution-Share Alike 3.0 United States License.
There are some other big pieces as well. Steve from Virginia has been doing some research on Federal Reserve minutes. He finds that back as far as 2003, they were concerned with the ramp up in food and energy prices. When they did start ramping up target short term interest rates in 2004, it was out of concern for the rise in oil/food costs. These higher interest rates fed through the economy, and may have been a major destabilizing force when the economy needed to keep growing rapidly to keep the huge amount of debt repayments going without default. We haven't had a chance to get this together into a post yet.
Another piece is that per capita vehicle miles traveled started dropping in 2006, according to this Brookings Institution study.
This is about the same time that housing prices started to drop.
An analysis by Moody's at the time said that the price drops were greatest in the distant suburbs. This is a link to a story about the report. Does anyone have a direct link to the report?
We seem to be having graphics problems right now. Can everyone see the graphs?
We noticed a decrease in highway traffic in my part of Southern California. I thought that this was largely due due to a decrease in construction jobs. There had been many undocumented workers and others traveling 30 or more miles to work sites.
During my youth I had the opportunity to help build a viaduct for Route 66 to pass under the Rock Island Line at $1 per hour plus overtime. We has quite a long commute. Fortunately the foreman ran a car pool. Today I often see up to 100 cars parked at sites of intensive high value Southern California agriculture - workers picking strawberries etc.
I think it would be interesting to try charting vehicle miles against energy % of GDP. I think I saw something along those lines, but not sure when or where. Fuel price, even inflation adjusted, may not represent a good measure for behavior change. I suspect that the real drivers of reduced miles may a) reduced discretionary income (because more going to energy), and b) reduced demand (which can also be caused by the inflationary effects of higher energy costs relative to income). It would also be interesting to see whether different industrial regions (across countries/economies and within) pull back on travel at similar or different levels of energy costs.
Brian
I think TOD should begin maintaining an archive of raw data, like excel or cdf files of various parameters versus time. A seperate portion of the website dedicated to data would provide a really good resource for future discussions. Some TOD posters are good a data mining particular fields; having one place where all this information is stored would really improve the site.
Anecdotal evidence isn't of much use when you can check the updates on Traffic Volume Trends released monthly (around the 20th) by the FHWA. Here is my chart of US VMT by sector:
Note that the downturn is primarily in the rural sector, urban areas continued growing until last year.
First of all, I think it's interesting that a lot of background disciplines are starting to put an energy factor into the economic calculus in the period leading up to the current crisis. Since so much of the analytic background noise is finance- oriented, the role that oil prices have played over the past few years has been pretty much swept under the rug.
I see that James Hamilton identified the 2008 leap in oil prices as a flow of funds phenomenon - and I think the flow of funds out of oil and oil- derivatives caused the price to tank. This leads to the obvious question:
What is the role of structured finance in all this and how does it intersect with energy prices besides enabling commodity price runups then collapses?
The next question is what is the relationship between energy prices and interest rates? Oil prices and interest rates have a long history together:
This is Fed data (Fed charts) with 1984 constant dollar oil prices superimposed on historical Fed Funds Target rate.
Recessions are shaded. First of all, the relationship between funds rate increases and recessions is clear. Increases in the funds rate preceded recessions in 1958, 1960. 1970, 1991, 2001 (concurrent with rising energy prices), and 2008.
Oil prices triggered 1973 recession (post- Yom Kippur War energy embargo), the 1980- and 81-83 'Double Dip' recession after the removal of the Shah of Iran and the Iran-Iraq war. Energy prices contributed to the 'Dot Com' recession then fell back. Another sharp rise in fuel prices began around 2003 during the Fed's dramatic easing of short- term rates.
This last period also coincided with the remarkable expansion of structured finance, particularly in its support of asset prices (housing, bonds and stocks). Clearly the expansion of that financing scheme has contributed mightily to the severity of our current recession; a kind of sidebar would be the failure in 1998 of the hedge fund Long Term Capital Management whose 'managed liquidation' by the Fed and other New York banks was accompanied by claims similar to those being made today of 'imminent collapse of the entire financial system'. LTCM was a forerunner of current structured finance operators such as PIMCO.
Variations on the theme of energy price- flow of funds- and interest rate dynamics appear to be a trigger for recessions, even if the linkage between causes and effects is not absolutetly predictable. There seems to be sensitivity at the intersection of these dynamics (which would make the modeling fiendishly difficult). But ... one thing seems to be emerging here is that flow- of- funds dynamic may becoming to be just as much a factor in determining the availability of useful fuel as is geology or politics.
More to come ...
Steve, have you read Dr. Andrew Oswald's work showing jobless rates are predicted by oil prices and interest rates?
Unemployment Equilibria and Input Prices: Theory and Evidence from the United States
http://wrap.warwick.ac.uk/336/1/WRAP_Oswald_cho.pdf
CEOs for Cities report: “Driven to the brink” May 2008
http://blog.smartgrowthamerica.org/?p=188
I put forward for discussion these causes for the financial crisis which was triggered by peak oil (2005-2008) as already described here by Gail:
http://www.theoildrum.com/node/5047#more
(1) re-cycled petro dollars accumulated as debt in the US
(2) failure of governments to pass on Colin Campbell's peak oil warnings (1996-1999 ...etc.) to banks, the corporate sector and to the electorate
http://www.hubbertpeak.com/Campbell/commons.htm
(3) embellished oil production projections of the international energy agencies (the IEA's WEO 1998 was the last report in which peak oil was explicitly mentioned)
(4) an assumption of perpetual growth (i.e. the naive belief that the physical economy can grow at compound interest rates as required by financial instruments)
(5) over-confidence that market forces will solve energy supply constraints
(6) expectation of miracle technologies while ignoring the laws of thermodynamics which control the transformation of energy
(7) build-up of over capacities in oil-dependent infrastructure as a result of (2) - (6)
(8) fill in here ......... but don't just blame the greedy bankers
nice list. :)
Figure 1 is misleading
On an inflation adjusted dollar basis the FF price peak in the 1970s and the FF price peak of a year ago are roughly equivalent.
The present day US economy is much less dependent on energy than the economy of 1970. The figures I have seen indicate something over a 25% decline in the amount of energy to produce a $1.00 of GDP
S0 you folks are acting like global warming deniers and both misrepresenting the data and skewing it to support your thesis or you simply do not have a satisfactory understanding of your topic. Either way your posting is unworthy of TOD.
I think you can find a more civil way of stating your question. Dave Murphy put this together. He is teaching a class now, but will be back later this afternoon.
I would like to start seeing us pull some of the pieces together. It is important that we understand exactly is going on. If we don't start looking at them, we will never know.
Admittedly, my inflation adjustment is probably not the most accurate adjustment that can be made, but oil prices did hit an inflation-adjusted record high in the summer of 2008. Please go to this site on EIA and download the spreadsheet. The EIA estimates of oil price in 2008 are higher than the historic estimates. Also - note that the average price for 2008 would be much lower than the peak in figure 1, as figure 1 shows 2008 as monthly data.
So we have become more efficient at using our energy, according to your figures. That says nothing about dependency.
Post hoc ergo propter hoc? You could draw similar graphs with milk, and then we come to the conclusion that milk is what drives the global economy.
That is true, but we know the physical laws support causation of energy->economic activity.
Nothing can be mined, refined, manufactured, or used without the expenditure of energy (even if that energy is in the form of honeyed tea consumed as I type these characters).
If milk occupied a similar place as energy in our laws of thermodynamics, physics, and chemistry, then I would say we could not tell if it was milk or energy that drove the global economy.
This is misleading. Goods and services, not energy, drive the economy... that is what GDP is meant to measure. Energy is a tool employed to manufacture and deliver these goods. But we are in no way employing energy to increase GDP at maximun levels dictated by thermodynamics. When energy was cheap, it made more sense to use more rather than conserve. Until the crash, the pain, there was no reason to adjust and change energy use.
In other words: my boss doesn't care how may BTUs it takes to get me to work, only that I show up (or stay home and get the job done).
This is misleading. It is preposterous that something as complex as a global or national economy be reduced to just one number: GDP. GDP is more a measure of our collective stupidity.
Of course we employ energy during each and every activity we perform, whether one wishes to slap the label "economic" on it or not. Even the electronic excecution of a trade sues energy. So in principle you cannot decouple energy expenditure from econmics. Under certain circumstances you can, as an operating assumption, ignore it.
It is not money, but energy that makes the world go round.
That depends on the horizon of your point of view. Bearing in mind that debt is borrowing from the future on the expectation of increased wealth, it would be interesting to know if inefficient (as opposed to uneconomic) use of energy is, in the long run, cheaper than efficient use.
In principle you and your boss care how much the energy costs. How much you care depends on the energy cost as a fraction of total expenditure and total income.
GDP is a valid concept, even if defining and measuring it is messy. If we let the perfect be the enemy of the good enough, we would also have to throw out ALL of the charts on this site estimating oil production, EROEI etc...
I was not "decoupling" energy from economic output... I was saying that the RELATIVE RELATIONSHIP BETWEEN THE TWO IS NOT FIXED until you reach a thermodynamic maximum on production and end use... this will never happen anyway, but I assure you we are no where close. For example:
No, my boss does not care about how many BTUs I use (I said BTUs... YOU put words into my mouth ands started acting like I said price... I did not). He couldn't give a flip if I took a bike or a Hummer, only that I get there. So let's see, I could decrease my gasoline use by about 99.9% and not effect my economic output. And yeah, I care about cost... when it costs 20% of my income for gasoline, I'll take the bike.
Yes, many car companies will go broke... that's what must happen to unneeded industries. This could be a one-time hit. Oil shocks in the past have never been permanent enough to create longterm change.
I'm not sure I like this analogy. A tool is an instrument which is used to perform an operation. One can usually substitute one tool for another (with varying results: you don't want to see the shelf I put up using scissors and a dictionary instead of a screwdriver and hammer). However, there is no substitute for energy: nothing can occur without it. It is a prerequisite for the manufacture and delivery of goods and services. Goods and services don't drive the economy, they are the economy.
You are both missing my point (and to the first poster, not Violinst, it almost seems intentional).
I know they are the economy, that is my point. I worded it poorly.
There is no substitute for energy, but we will have energy, just less for a while. But less energy can be made to do more work. The ammount of energy we use to complete a task depends on infrastructure and haabits from the past when energy was plentiful.
You want to talk bad analogy? How about comparing scissors to a screwdriver. What I was doing was comparing a chainsaw to a hacksaw... both will get the job done. Or better yet, comparing riding my bike to work to my neighbor who drives a Hummer there. We both get to the office, get the same work done, but I will have spent far fewer resources.
We are not borrowing against future energy, we are borrowing against future prosperity/work/economy. Just because energy use went up with the economy doesn't mean they are interchangeable. I KNOW we can do more with less, if we have to.
Energy and GDP are inextricably related. Without staggering amounts of energy there would be almost no goods and services.
Practically all of our modern standard of living is made possible by energy. The amount of energy embodied in almost everything we take for granted is almost inconceivable to anyone, even those like me who deal with energy first hand. Without massive amounts of energy most of us would starve, or else almost everyone would be engaged in agriculture. However we cannot go back to 1865 when animal and machines did comparable amounts of work because we simply don’t have enough farmland to support the animals much less the people. In 1920 there were 15 million work horses in the US and almost no tractors. By 1970 we had 90 million horsepower in the form of tractors. And here we’re just talking about farming. You would literally have to cover the planet with horses to replace all the work performed today by machines.
As an example of how productivity improved living standards, the hours worked to buy a 3-1/2 pound chicken fell from around 2 hours 45 minutes at the beninning of the 20th Century to 12 minutes at the end of the 20th Century.
(Data on horses and tractors is from Fig. 4 in http://www.iea.org/textbase/work/2004/eewp/Ayres-paper3 which I previously referenced).
Paul,
The question isn't do we need energy for every unit of GDP, it's can we have growth in GDP if energy costs increase.
A good illustration is a 1903 house I once lived in in 1980's. It had almost no insulation and an coal furnace that had been converted to run on NG. We added insulation replaced the windows with double glazing casement, replaced the furnace with a high efficiency gas furnace. The house was more comfortable and probably used only one tenth the BTU's of the old house. This made income that was spent on energy available to buy a CD player, etc, so the GDP increased( or didn't decrease ) with 10% of the energy(11% allowing for the energy used to produce the CD player). This is part of the 80 years of efficiency improvements, that have been averaging 1-1.5% per year.
So you are correct to say our standard of living is only made possible by energy, but wrong if you are implying a one to one relationship GDP:BTU that is fixed.
The productivity of the chicken farmer isn't just cheaper energy, its breeding of chickens to convert more grain to feed, higher yielding maize ( 30bu/acre in 1920; 155Bu/acre today), antibiotics, phytase enzymes to get better feed uptake.
Neil:
Rising cost of energy has an immediate negative effect on GDP ex- energy, mainly because energy is such a large percentage of the cost of production and transportation of goods. Over time, investment in energy saving technlology very slowly reduces energy intensity. This has been happening since the first steam engine.
Energy conversion approaches thermodynamic limits. We approached the limits with the major conversion technologies decades ago. By mid century the best boilers, turbine generators, electric motors, gasoline and diesel engines were nearly as efficient as today, although it took time to phase out the old equipment and bring the average up. Automobile engines are less efficient than in the past because of lower compression ratios necessary for unleeaded gas.
The remaining easy conversion and conservation took place after the high oil prices of the 1970’s, although there are many houses needing insulation and energy efficient windows.
Besides energy and energy conversion, chemical fertilizers are big factors in improving our living standard. Take away modern poultry management and you may double the cost of that chicken, say to the 1970 level of 22 minutes work, but that is still less than 15% of the work hour cost in 1900.
Computers and the internet had almost no effect on the cost of that chicken. The work cost of that chicken had fallen over 80% before mainframe computers.
Against the minor increases in real per capita GDP we have the counter trend of rising extraction costs for energy and basic materials. The cost of new production is much greater than the price of oil today. At some point in the not too distant future, perhaps a decade or less, the rate of extraction costs, in terms of energy and capital, will increase to the point that GDP will go negative.
The other unintended consequence of our productivity miracle is life expectancy. No longer do two-thirds of the population die before age 16, as in London of the early 18th Century. We now live a decade or more past retirement age. This easily explains the so called “health care crisis”. Take the over 55 age group out of the insurance pool and you get dramatically lower insurance rates. (Perhaps Gail the actuary has some hard numbers. If so, this would make an excellent post).
"Rising cost of energy has an immediate negative effect on GDP ex- energy"
Only for oil importers, like the US and the rest of the OECD.
"Over time, investment in energy saving technlology very slowly reduces energy intensity."
It's been slow because energy has been so cheap.
"Energy conversion approaches thermodynamic limits. "
In a trivial way, but a Prius uses half the fuel of the average light vehicle, and a Volt will use 10% of the fuel and 15% of the BTU's.
Take a look at 1)income transfers from oil exporters to importers, 2) oil-importer GDP vs exporter GDP, and 3) world GDP vs oil prices. Hamilton's analysis showed that world growth continued well into the price shock - OECD economies started to slow down, while Russia, ME and other exporter economies expanded and even started to overheat.
All of this seems to indicate that the problems of an oil shock have little to do with not having enough BTU's, and more to do with the unexpected stresses that income transfers place on the world's financial systems: petrodollar recycling, mortgage collateral for petrodollar debt, etc.
There are a lot of intrinsic problems with inflation adjustment of oil prices.
Rising oil prices or even more subtle rising demand for oil can itself trigger inflation leading to and expansion of credit and then monetary and price inflation.
Demand expansion before "demand inflation" leads to other inflations including monetary is in my opinion important and difficult to model. One would have to have a situation where oil demand was falling i.e the economy was getting more efficient and GDP was rising but had not yet entered inflation to see price inflation without tie into oil. So basically you would need and example where the economy become more efficient and efficiency increases resulted in monetary issues.
Once the oil prices start increasing then in my opinion the interplay of money and oil becomes effectively impossible to figure out.
Looking back at the historical data

You can look at a lot of different pieces of data but I prefer days of supply since it tends to average out the interplay of oil price, inflation, economic etc.
What we find is days of supply drops steadily at least as far as the series goes back and it goes back fairly close to when US production itself peaked.
The other half of the trend is of course imports.
This is important because it represents a net drain on the US economy until the late 80's the US was growing oil production and overall had a healthy internal supply. This means that money for oil purchases was mostly recycled back into the local economy instead of moving out into the ME and then globally.
Rising oil prices in the 70-80's happened in a nation that was transitioning from being both a major oil producer and and industrial power house to a new country dependent on oil imports to function. And also one that had in 1973 left the gold standard and effectively introduced a new currency the so called petrodollar.
On top of this without the recycling of dollars caused by local oil supplies we also increased the rate that manufacturing was moved offshore. The position of the US dollar as a fiat reserve country helped immensely in this endeavor. On the oil side it artificially increases the GDP vs oil as more and more energy inputs are coming externally instead of internally. Certainly efficiency increased but probably more important inefficient oil dependent industries where moved overseas.
Intertwined with this is of course the move to controlled runaway pollution making relocating factories in poor countries and killing them even more lucrative.
So I think its wrong to look at US statistics much beyond the ones I showed throughout most of this time period the US increasingly became a producer of dollars that held their value no matter how many we printed. Certainly we had slight recessions but these should be viewed as stumbles in the expansion of and Empire. I'm sure Rome had problems with inflation and large influxes for slaves and goods from newly conquered areas.
We also faced similar problems as we added millions of new slaves every year as America expanded and differentials between expansion of our slave trade and transitioning your average American into a consumer of slave goods instead of a producer. Slave based bread and circus economies don't it seems expand smoothly.
And of course you have to also expand the number of dollars pushed into the military-industrial complex since your effectively constantly at war.
Cold wars, Hot wars, Wars on drugs, Wars on terrorism, economic ware fare assignations, corruption of governments, managing regimes and just plain killing a lot of people to insure hegemony is a nasty and economically bumpy business. Our recessions are just the tip of a monstrous iceberg made of blood. Untold millions killed in Africa alone via our meddling.
http://odile216.blogspot.com/2007/08/africas-world-war-stealth-conflict....
So yes from time to time during the expansion of Imperial America and the petrodollar we did stumble ever so slightly and bruise our lilly white feet but thats not the real story to get the real story you have to look beyond our borders and at the real war of expansion and dominance then you should see that the petrodollar cannot be considered as two different things is one thing in fact its really three things oil, money and blood. How our economy moves depends on the ratio of these three things at any one time.
We are now however entering the era of peak oil where we have plenty of money and are killing people at a furious rate just as we are used to doing but we are no longer getting any more oil to fuel our empire. And thats our real problem we have reached the point that killing and enslavement and printing money can no longer cause more oil to flow into the US simply because there is not more.
We need to either redouble our efforts at killing and enslaving people to make up for dwindling oil supplies or we need to change.
My opinion is this country has recognized this it realizes that it has to change it can no longer depend on killing and enslaving people in other countries instead it has decided that the easiest way to solve the declining oil problem is to kill and enslave its own citizens this kills two birds with one stone it reduces oil demand ensures a continued supply to the elite and war machine and it gets rid of the last vestiges of democracy making it easier to execute even more brutal wars overseas.
If I'm correct then the US has reached another major transition point that happens to all empires. Once growth by external slavery slows the vestiges of power sharing and equality are thrown away and an autocracy is formed.
This transition renders even incomplete analysis of the past useless since most don't recognize the true trend they fail to capture the transition to a leaner meaner form of Empire.
On the financial side we had the transition from the gold standard to fiat petrodollar to global currency independent of the US government.
On the oil side we have transition from oil for citizens to oil for elite.
Looking back at the Roman Empire eventually having the capitol in Rome became inconvenient. Given that Haliburton one of the important companies in our Empire has moved to Dubai I'd not be surprised in the least to see our Empire move to Dubai thats been liberated along with the rest of the ME. If the Roman Empire is any guide it seems natural that eventually both the source of money and oil will become one place geographically. Plus a new world capitol somewhere in the region makes sense like it has for all empires since controlling Asia is the hardest task.
At the very least include the Asian criss and collapse of Japan and fall of the Soviet Union and rise of China in any attempt to look at oil and money. Bring in a few of the big ones :) Inflation adjusted oil prices simply don't do the real game justice.
The commenters ignore this historical overview, which seems to me to draw attention to some major attributes that are critical for the people of the US to recognize. A reference to Hubert in another comment seems to state the dicotomy of the assumption of infinite growth of finance in comparison to the real world of stuff, again is ignored. The role of interest and the growth of money seems to be set in stone in the minds of most people. Environment, Power and Society by Howard T. Odum says most everything that can lead to a way out of our turmoil. This book gives the energetic analysis of what Memmel is saying. If you look at the evolution of life, what I think is seen at every increase in complexity is a greater organization based on cooperation. Enlightened self interest looks beyond. Ants have adopted and raise aphids, etc. These examples were produced presumably by chance. Now we as a species have the ability to recognize these relations and should have the capacity to develop the proper policies. Odum in the last chapter of his text delineates these, as do many other authors who have looked at cooperation. These people however seen not to be readers of TOD. The Energybulletin.net and the Post Carbon Institute are places where there is more recognition of the larger picture.
Thanks what I'm trying to say and its a bit more the Hubbert was the exponential growth in energy allowed the exponential growth in money.
As he notes and I think all of us agree once energy goes into decline the growth in money will slow and then decline.
The key and I think I like the way you say it is its a complex system our analysis to date has looked at the fluctuations at the top of the economic pyramid. It does not mean its wrong it just means there is a huge pyramid thats the rest of the world that was swayed and shaken by changes in oil supply and dollar supply. Many of these can be huge and not show up in the changes at the tip. The Iran-Iraq war for example only shook the tip once it erupted but it was certainly the cumulation of decades of meddling on the part of the US and friends.
Looking only at when the tip of the pyramid finally shakes misses these underlying events which are themselves at tight interplay of oil and money.
The exponential increase in the money supply was itself done to control the exponentially expanding oil supply. Given this viewpoint our government and top leader cannot help but be peak oil aware they are very well tuned into the oil supply side of growth.
Many people that believe in peak oil are waiting for the government to wake up and acknowledge peak oil one day they fail to take into account that its already well known and understood. Like the claims that subprime was contained early on they simply choose to not scare the masses.
Given this viewpoint I've reviewed over and over again the recent price action in oil and economics. I've convinced myself that the economy was crashed to prevent the global oil markets from crashing. We did indeed suffer the sharp decline in supply I figured would happen in 2008 and this forced a crises. The government faced a stark choice either see the worlds oil markets fail as failure to deliver multiplied or take out some key players in both the oil and financial markets. The collapse of Lehman was Amaranth on steroids.
http://dealbook.blogs.nytimes.com/2008/07/08/platts-review-bars-lehman-f...
http://www.thestreet.com/stocks/brokerages/10278941.html
And who is left standing today ?
If I'm right then you should become very concerned these guys plan to play peak oil right to the end and they don't take prisoners.
This is of course the conclusion the logic to get here is to assuming everyone in the oil business is lying. The question is how
much and why ? And they are all capable of shaking the economy to the core. Once you achieve a consistent set of lies and counter lies
you have the truth.
And the truth is in my opinion that we almost crashed our oil markets and the choice was either oil or crash the economy.
I actually agree that they made the right decision to crash the economy if the global oil markets had shut down it would
have been a lot worse.
Obviously the fact the people that caused the problem in the first place are still running the show and profiting handsomely
is cause for concern. Especially since it looks like they are going to play another round of cat and mouse with oil.
One more thing since I brought this up one of the key lies has to do with OECD storage levels a lot of that oil does not actually exist
a good bit of it its paper barrels. GS and MS don't actually hold the physical barrels they claim they simply lie.
As long as they can make their deliveries as needed and make money but last year in my opinion because of BS and Lehman they
where forced into a situation where they could not acquire physical oil fast enough to settle physical claims. Underlying this
was of course a fast collapse in overall production. Thus we came close to having a cascaded of failure to delivers hit the oil market.
Amazingly since they pulled it off last time I think that they are playing exactly the same game right now and at some point in the next
few months they will again be scrambling for oil to make good on physical delivery. But with Lehman esp gone they don't care high high
oil goes this time because they have a monopoly.
So it was a combination of financial games and lack of real oil thats the real underlying problem. The problem is I think the losers lost the battle but won the war.
Obviously this is just one aspect of the game but think about it if GS has no problem driving oil to 200 with its games and driving it to 30 briefly with the same games then it knows the economic fallout that will result from its games. This mean its shorting the hell out of housing
for example in the CDS market and at kinds of US companies. It knows that oil supply is going to continue to fall and that its effectively cornered the market for oil. GS does not care they are going to make huge amounts of money off the near term future. If they do feel like they are getting into trouble or need a cash infusion to keep playing no problem the US government is ready and willing to bend over and serve.
So bottom line is yes very powerful people are very peak oil aware but they simply don't care about us they can and will leverage peak oil and the destruction of the middle class to gain enormous amounts of money but far more important power.
One more edit:
Read this link its like a who's who of companies that got blasted they all have a common thread of entering the energy markets.
http://www.forbes.com/2005/09/21/energy-trading-hedge-funds-cx_lm_0922po...
And yes this is energy centric but you have to look and both oil and money.
GDP and energy use is quite a tricky subject. The US economy has changed from heavy industry to services. Then again a lot of services rely on energy in various direct and indirect ways. My point is you cant just use such simplistic data to claim either or.
I have calculated this chart independently and came up with a very similar chart. The chart looks ok to me.
US oil spending as a % of GDP hit a high of just over 8% in 1980. 1980 was an exceptional year and the average for 1970-1979 was around 3-4% of GDP. The average figure for oil spending as a % of GDP for 2008 (total year average WTI price was approx. $100) was 5.1%.
That is a common myth. Data clearly shows that the US economy is just as dependent now as it was on average during the 1970s (see my second answer above).
The post writers are investigating whether "oil prices played a fundamental role in causing the current recession and many previous recessions". Given that large oil spending increases have directly preceeded every recession since 1970 - I would say that the subject merits fair discussion and investigation by TOD.
Thanks! I think another point that has been made is that as the economy has become less dependent on high energy products (which we are now importing, rather than manufacturing directly), we are in some ways more dependent on the energy we do have, since there are fewer high-energy, low added GDP products to eliminate.
People talk about what percentage oil is of the economy, but it might be better to think about the reciprocal of that amount--how much GDP one barrel of oil is capable of generating. That amount is higher now than when we produced more energy-intensive products. If we now lose one barrel of oil, we now lose more GDP than we would have when we were less efficient.
I have compared oil to food for our machines. Machines may use less oil each because of efficiency improvements, but they still as dependent on oil as they ever were.
Since the manufacturing is taking place a long way from the end users and with old- fashioned, less efficient equipment, the energy consumption embedded in imported products is probably greater than it would be if the energy not the products were imported.
At the same time, imported products use more hand labor which is less demanding of FF energy. Efficiency has its own energy costs.
Also:
The causes for DECLINES in oil prices and emergence from recessions differes. The 1973 and '80 - '85 recessions ended as Prudhoe Bay and UK North Sea oil came into mature production. Additionally, interest rates declined sharply during the early part of the Reagan administration along with tax cuts and large defense outlays to 'stimulate' the economy.
The 1991 and 2001 recessions ended with both sharply lower interest rates and relatively low energy prices.
This is a Fed chart, so it is probably good.
Real oil prices were higher in 1980 but not by much. One reason energy prices during the last go- around caused little public anguish was because there were no gas lines or 'odd- even' rationing.
I think GDP is almost useless since it depends on assumptions; such as identifying zero- sum activities such as gambling as production. The statistical basis is unverifiable year to year (consider all the revisions of different department statistics). I also question efficiency improvements because they don't always allow for the inefficiencies that propagate up and downstream from the efficient link in the newly inefficient chain. Processes have greater and greater complexity and have unforseen effects on system efficiency. An example is updates to Windows that make the program work slower or crash ... or communications gear that works faster but requires a larger cooling system. Lots of newer basic processes are computer/machine centered rather than craftsman centered. Agriculture has become more and more energy intensive since there are less human inputs ... less HI means more 'productivity' (measured in man- hours) but the machinery requires more energy than a man does. Same with a lot of high tech manufacturing. A man couldn't make a microprocessor with hand tools even if he knew how. All that machinery gobbles energy. Even if one machine is extremely efficient, the increase in the total of efficient machines results in greater total use (dependency) on energy.
1) Luckily Peak Oil doesn't mean no oil, it means less oil.
2) Machines, speaking generally, are primarily dependent on energy, not oil.
Not to say that less oil isn't a problem, but your talking point seems to be that because machines need some oil, less oil will not be enough. This doesn't necessarily follow.
And less oil, and less oil, and less oil, and less oil...
This is an interesting point. Overall, peak oil doesn't mean 'no oil' (at least not immediately), but as oil becomes increasingly scarce it does mean 'no oil' for an increasing number of activities, processes and people. As oil becomes more strictly rationed, either by price or other mechanisms, more and more people will find that for them, there is effectively 'no oil'. It's not a one-off adjustment to using less, it's a ceaseless string of adjustments all the way down the downslope of Hubbert's curve.
This begs the question, what is meant by enough? Enough for what? For whom?
Enough oil to facilitate a smooth 'transition' to alternative forms of energy? Enough oil to permit the perpetual growth of a debt-based economic system? Enough oil to sustain green revolution agricultural practices worldwide? Enough oil for everyone in India to run an automobile? Enough oil to avoid ugly conflicts and resource wars? And in the light of continual depletion, enough for how long?
The current economic paradigm demands perpetual growth or it begins to disintegrate. Considered in isolation, having less oil may not seem that big a deal. However, the context in which 'less' occurs is vital. Peak oil is a complex conundrum where what matters is how much less, in what timeframe and under what circumstances.
There are alterative energy sources. No, they won't yet (or for a while) drive SUVs 1000s of miles on inefficient ICE drivetrains, but they exist. If you don't agree with the existence of possible alternatives, we will simply have to agree to disagree. Concentrated solar, nuclear breeding, wind, conservation, plant-based oils for lubrication and stranded use, coal, oil shale as coal/feedstock, toe-to-heel air injection for tar sands, etc.. I am always amazed at how the best discussions on this site about possibilities like the LFTR, Toe to Heel, etc are so thorougly discussed in one thread and then ignoredin all others. I wonder if there is someway to restructure the site so as to be less compartmentalized?
Anyway whe science is there to feed and care for, and even to power (if at a lower level), the world. But it is not yet in place. The transition is what I am scared of. We don't have the best track record so far, but then again, we haven't really felt the constraints till just now.
So let's go with this one as a TARGET: Enough oil to facilitate a smooth 'transition' to alternative forms of energy.
Possibilities, Andrew. I beg to suggest that it isn't just this site that is ignoring these possibilities, but also the people who could be imagined to put forward the money to roll them out on a sufficiently rapid scale to make a useful difference. And even if they did do that, then a thorny question might arise of how long it would take before the energy debt in development is paid off by output. Till then, these technologies would be burdens rather than saviours.
And the problem of compartmentalisation is also far more serious outside this site than inside it! Notice how now the price has gone back down the visits here by newbie loons have also ceased (said he, foolishly!).
http://krugman.blogs.nytimes.com/2009/04/16/reconsidering-a-miracle/
..here's another good point in regards to productivity and GDP. This should make on think again when making assumptions relating energy & GDP.
A good point indeed!
Let's not ignore industry moving abroad. That might effect those energy/$GDP figures a little bit.
US manufacturing uses about 22%(22Quads) of a total 100Quads of energy. High energy users such as steel and cement only used 1.8 Quads in 2002. Transportation uses 27.8 Quads in 2008 and electricity production 21.8 Quads.
We often see statements that we are exporting our energy use, but I can't see how more than a few %( ie one or two years reduction in energy intensity) can be accounted for by now importing manufactured goods.
The US may be importing more refined petroleum products( a big user) and more aluminium but I don't see reductions in manufacturing accounting for the big gains in GDP/energy use.
Do you have some figures of declines in manufacturing industry use??
A good chart of several energy intensive industries is Figure 15 in Exergy, Power and Work in the US Economy by Ayres, Ayres and Warr at the link:
http://www.iea.org/textbase/work/2004/eewp/Ayres-paper3.pdf
V. Smil discusses energy intensity in Energy at the Crossroads.
This series of papers is one of the best on the relationship of energy and the economy I have ever read. If anyone knows of anything equal to ether these or V. Smil’s work, I’d love to know about it.
V Smil greatly underestimates wind resources and power density. He uses average wind speed over the entire land mass, a bit like estimating the average oil content of the earths crust or the energy in hydro electricity on rainfall/m^2.
Solar, wind, hydro, geothermal, tidal energy are all concentrated in specific regions so using average power density is meaningless. I don't see how energy density of renwewables is relevant, electric wires can carry very high energy density thousands of km, to where its needed. The actual resources are enormous by present rates of consumption of all energy.
The link to the Ayres et al paper is interesting, it seems to show that energy intensive industries have greatly reduced energy use by improvements in efficiency, and that the US has had a continued improvement in GDP/energy use for 100 years.
The GDP was distorted by the finance and housing bubbles, which lowered the energy intensity (energy/$ of GDP). Offshoring of manufacturing also lowered energy intensity.
Most of the decline in energy intensity is real and results from better insulated homes with more efficient appliances, more efficient factories and lower weight cars, at least until SUV's became popular.
The present day US economy is much less dependent on energy than the economy of 1970. The figures I have seen indicate something over a 25% decline in the amount of energy to produce a $1.00 of GDP
This is a totally meaningless statement. A house can be sold several times over for more money each time, creating more and more GDP. Yet in this process nothing has been created. Heavy industry always uses oil, hence China is using more each year.
Some industries are far more vulnerable to energy price increases. The airline industry can make a profit at $70 but add another $20 and they start losing money. The fact that this price increase is small when looked at as % of GDP is irrelevant.
The same cost increase will have no impact on say running a bank, any country overly reliant on the finance industry to make up it's GDP will realise what folley they engage in.
"A house can be sold several times over for more money each time, creating more and more GDP. "
Resale of an existing house isn't included in GDP.
"Heavy industry always uses oil"
Industry mostly uses electricity. In China diesel is sometimes used for generation, but that's a temporary patch.
"The airline industry can make a profit at $70 but add another $20 and they start losing money. "
The airlines are always losing money. Seriously, airlines just aren't a good moneymaking proposition. They're like farming - a part of the industry is always in trouble, and most don't do all that well in the best of times.
You quote Hamilton as saying:
“…a low price elasticity of demand, and the failure of physical production [of oil] to increase…, rather than speculation, are the primary cause of the oil shock of 2007-08.”
I think your quote is misleading; he is not dismissing speculation as a factor in the price run-up. The context is:
If you shorten your quote a bit more, to read “…a low price elasticity of demand, and the failure of physical production [of oil] to increase…, [are] the primary cause of the oil shock of 2007-08.”, then yes, that's exactly what he's saying...
Kode - fair enough. Changes made.
Sorry if I sounded crass; that was not the intention. I really appreciate your work...
Steve from Virginia also alerted me to some analysis Mish has done, in which he computes an adjusted CPI index using the Case- Shiller housing index in the CPI, instead of Owners' Equivalent Rent. On this basis, CPI has now been negative for three months. More importantly, in the context of this discussion, the CPI on that basis was quite high in the 2004 to 2006 period--the period the fed was trying to raise interest rates, to hold down petroleum-fed inflation. When they finally got the federal funds rate up high enough (based on their review of CPI including petroleum impacts), housing prices started falling. The story since then is one partly of unintended consequences.
We know that M. King Hubbert expected a divergence between our monetary system and oil when peak oil hit, because of the growth underlying the monetary system, and the fact that finite resources cannot continue to grow. He said:
It is the fact that this growth cannot continue, as oil production stabilizes and then declines, that is at the root of the problems with debt and the monetary system.
You have hit the proverbial nail on the head.
In the world's monetary system, debt is the primary method of monetary expansion, namely we borrow money into existence. The pace of money creation has it's ups and downs. But to the present total debt (in the US at least) has not contracted since the '30s. It would, I think, be very interesting to graph total credit market debt (public and private separately) against the other factors discussed here. Also to add a broad commodity index as well as the price of oil to the charts.
It would seem to me that there is a limit to how much debt can be created before the servicing of that debt becomes impossible at least for the private sector. That point I think has finally (after 60 years) been reached. I also agree that this limitation is imposed by the limitations to growth of the physical world such as the inelastic oil supply or for that matter inelastic copper, nickel etc. supply. Eventually "attempted economic growth" financed by debt causes the prices of scarce resources to rise to uneconomic levels. This in turn reveals this new debt as unserviceable and thus causes an economic activity reduction (a fall in GDP). Thus, the private sector as a whole has been forced and/or is attempting to reduce debt. Which is why the public sector is desperately trying to prevent a total debt contraction by assuming the role of borrower (of last resort).
But this vastly increased public sector borrowing is primarily intended to support and maintain the comfort and consumption level of the voters and only secondarily to invest in new resources such as fuel efficiency. Consequently I believe we can look forward to only very limited gains in resource availability while we experience a large and possibly out of control increase in money availability.
My "hat off" to the Chinese who are trying to purchase resources and access to resources around the world with their dollars.
I was quite surprised by those graphs, but not the same way EROI Guy was. I was expecting a complete and almost instantaneous correlation between fuel spending and the GDP, because increases in GDP are normaly caused by increases on consuption. Now, fuel being a big part of consuption, it is quite unlikely that fuel spending and GDP aren't correlated.
Ok, but Figure 1 shows recessions begining exactly when the spending grows too much. Keeping in mind that there is a delay between the begining of bad times and a recession being declared, that makes fuel spending a delayed indicator, not the instantaneous I was expecting. (Maybe low consumption flexibility explains that.) And Figure 2 shows that fuel spending is hightly correlated with oil price, but not that much correlated with GDP. Well, maybe the actual numbers are better than what my eyes get from the graphs... It would be quite interesting to see the delayed correlation between GDP and fuel expending, and between GDP and oil price, ploted as a function of the delay.
Also, it is expected that oil price peaks just before recessions. That is because the price of almost anything peaks just before recessions. The data seems to confirm that expectation.
First, nice piece of work.
Any posts that tries to investigate/research the relations between energy (oil) and GDP should be welcomed as this could fuel informed debates and improve the understandings of the relations between GDP, energy, interest rates etc..
Petroleum costs have (on average) over several years been approximately 50 % of the total energy bill. Prices from other energy sources tend to follow petroleum (oil) prices.
This suggests that the total energy bill is approximately twice that of the petroleum bill. As the petroleum bill moves above 6 % of GDP, this suggests that the total energy bill moves above 12 % of GDP, which in my opinion is a considerable amount. Add to this energy embedded in food production and distribution it seems to me that high energy prices must lead to changes in consumer behavior.
For the years 1981 through 2007 US specific oil consumption remained between 23,7 bbl/capita/year (1983) 25,8 bbl/capita/year (2004).
I would caution against using GDP per barrel of oil as an indicator of improved economic efficiency as this does not tell the whole story. This is because USA and other advanced economies uses big amounts of energy from other sources, so perhaps using GDP per TOE; Ton Oil Equivalent (all energy input) could improve the description of how efficient the energy is used.
From what I have seen the volume of imported energy also plays a role as the product of unit price and volume adds to the total outflow as a pecentage of GDP.
To illustrate how this could fair;
USA had in 2007 a specific GDP of $1 833/Bbl and Bangladesh $5 536/Bbl which suggests that we should learn from Bangladesh on how to get the most GDP $’s from each barrel.
Using data from IMF these suggests that specific GDP (GDP/capita) in USA has grown with 50 % between 1980 and 2007 after adjustment for CPI. If the CPI in recent years has been understated this suggests that the growth adjusted for CPI (or inflation) has been even less.
Another factor which should be considered is the growth in total debt relative to GDP in recent years as some of this growth is not a result of real fundamental growth, but created through the borrowings of the future.
Just my 2 SDR’s.
Interesting. Agreed. Nice piece of work.
It does seem useful to follow up data and thoughts concerning growth of debt in US economy relative to GDP and to historical increases in GDP.
Elizabeth Warren's Jefferson lecture in March 2007 comparing 'mom, dad and two kids' 1970 to 2004/2005, charted systemic change in income & income allocation in US 'middle-class'. Most of the increase in family income over the generations was from women entering the paid workforce. The family spent the increase (as well as the 11% that used to be saved in 1970). Cost of housing went up 76%, health insurance 74%, and family car travel (now mostly 2-car) by 52%. Taxes on now higher income (mostly combined income) were 25% higher by 2005. Child-care was a new purchase. These increases balanced cheaper / lower expenditure on clothes, food and appliances. There was much higher proportion of 'committed' to 'discretionary' expenditure and Warren judged the modern family to be a much 'riskier' unit.
Looks like 'accidents' were waiting to happen and there was / is less resilience in the face of adversity. I fear something similar here in the UK economy.
phil
I think this is a link to the lecture Phil mentioned. I highly recommend it for anyone who has not seen it.
The link Gail provided above leads to an excellent lecture well worth spending time on watching.
Helps explain how Middle class over time became more financial vulnerable and may perhaps also explain why they more easily will cut back on energy expenditures.
Rune,
Although oil may be only 50% of energy costs, only two prices(costs) are on wide public display, motor fuel prices and bank interest rates. In mid 2008 interest rates were not dropping in fact in US for many sub-prime loans they had just dramatically increased. We all remember how high petrol and diesel went, but few know if their heat bills were going up, certainly not thinking about heat bills in July unless using heating oil and ordering next years supply.
Thus motor fuel has a very large impact on consumer sentiment much more than the 8% of GDP would suggest, but the big decisions like buying or selling a house or walking away from a house are going to be determined by real mortgage interest rates.
On the issue of GDP/ energy, better comparisons for US are Europe and Japan, the economy of Bangladesh is so different in assumptions of what is GDP you cannot make a comparison.
There is very good evidence that GDP/energy unit is improving at about 1.3% per year; improved efficiency of appliances, improved engine and power generating efficiencies and lower heat loss of homes( BTU/sq ft), but US has bigger homes, bigger cars, more appliances.
Neil,
I think you are right about consumers being most focused on prices for motor fuels and interest rates.
I agree that comparisons ought to be done between economies with comparable structures. My point was more to illustrate that some of the developing countries (or less developed countries) seems to get more $$$/Bbl. This may come to play a role as the competition for declining flows starts.
Looking at total energy consumption (data for USA) there has been an improvement in energy usage (more $$ per TOE) from 1980 to 2007 reflecting better insulation improved efficiencies for machines and household appliances etc.. Despite this, and for all practical purposes, the total energy consumption expressed as TOE/capita/year has remained constant from 1980 through 2007 so it seems like efficiency gains are used to increase the number of appliances or bigger plasma screens or others.
When it comes to efficiency gains it looks like much of the low hanging fruit has been picked so far, thus it will become increasingly challenging (thus costlier) to continue this trend.
Damned laws of thermodynamics.;-)
Using UK to compare with USA; UK got $3 453/Bbl in 2007 vs USA $1 833/Bbl. But then we got the differences of geographical nature and better public transport in UK. In UK oil was (as of 2007) “only” 10,2 Bbl/capita/year.
Doing a comparison between BRIC and G7;
BRIC; $2 458/Bbl
G7; $2 156/Bbl
"When it comes to efficiency gains it looks like much of the low hanging fruit has been picked so far"
Certainly not in the US. Hybridization could double vehicle efficiency, and adding a plug and larger battery could triple it again (energy consumption as measured by BTU's). IOW, a plug-in hybrid would use only 10% as much oil as the average US vehicle, and 15% as many BTU's.
Existing-housing efficiency fruit is hanging so low that reducing consumption by at least 25% would pay for itself quite quickly, even at current energy prices. New home efficiency on the order of 2-4x existing housing also pays for itself (though a bit more slowly).
Appliances and HVAC systems (including heat pumps) continue to get more efficient: the average 10 year old refrigerator uses twice as much energy as a new Energy-star fridge.
Nick,
You know US better than me.
I believe that what you point out is right.
What I fear with the ongoing financial crisis is that energy prices will remain relatively "low" in the foreseeable future in combination with less availability of credit (which may be needed to pick the “low hanging fruits”). Hopefully I will revert later through several posta why I believe energy prices will be “low”.
What might change this could be wide government involvement encouraging improved energy efficiencies.
Rune,
I no longer live in the US, so I have as much first hand knowledge as you, but I would agree with Nick that lots of low handing fruit in US. We should not overlook what has happened in some states such as California, due to legislation, better efficiency standards.
The Obama administration has a real opportunity to dramatically improve CAFE to more in line with EU values( ie 45-50 mpg by 2012) rather than the pathetic Bush administrations(35mpg by 2020).
Home insulation needs to be retrofitted onto existing homes because as Nick has pointed out previously, almost no homes are demolished, most will be around for 100 years, and new home additions are only <1% of existing stock.
Other improvements are being made in the economy, for example airline fuel and load efficiency, more video conferencing, more recycled steel as growth in new cars is balanced by crushing of old vehicles, other recycling(paper).
A general move to more use of electricity is going to give very big gains in efficiency( ICE engines 15-25% efficient; electric motors >90%), electric heat pumps use only 20-30% of the energy of oil or NG heat. Each kWh(3.6MJ) generated from wind, solar or hydro reduces consumption of 7-10MJ of coal or NG.
"credit (which may be needed to pick the “low hanging fruits”)."
That's certainly a factor, but a larger factor is the diffuse nature of the savings. HVAC savings (both industrial/commercial and residential) require a lot of time and measurement to identify - a cost which is rarely figured in. Even automotive savings are spread over many years.
"What might change this could be wide government involvement encouraging improved energy efficiencies."
Yes, what is needed is centralized regulatory action which takes advantage of efficiencies of scale and specialization: CAFE standards, carbon taxes or cap and trade, battery research, construction standards, appliance efficiency standards, utility efficiency audits, utility payment plans for new furnaces & HVAC, etc, etc.
Of course, we need price signals as part of a balanced system, but prices alone, high enough to get the behavior we need, is punitive.
I suppose part of it comes down to what you define as "low hanging".
Improving the energy efficiency of current housing stock seems to be a good candidate for 'low-hanging fruit'. Replacing the vehicle fleet with hybrids seems a much bigger undertaking. My highly unscientific WAG would be that it's several branches higher on the tree. Are there any good studies out there comparing the low-hangingness of various 'fruits'. A topic for a keypost perhaps?
"Replacing the vehicle fleet with hybrids seems a much bigger undertaking. "
It will take longer, but it's easy and cheap to do - a Prius costs less than the average US new light vehicle.
The Prius is "easy and cheap" for whom? Are people queuing up to buy them as we write? Do you have a source for loans? As the economy continues its descent will people find them even more "easy and cheap"?
"The Prius is "easy and cheap" for whom? "
Most people. Car sales are 40% below last year: the flip side of that is that 60% of car buyers are still buying. Further, it's perfectly clear that some of those who aren't buying are just being cautious.
"Are people queuing up to buy them as we write?"
Sales have gone down, but not as much as other vehicle types.
Below we have " the key thing is that these economic traumas were/are to be expected as inevitable consequences of hitting an energy ceiling" and now "As the economy continues its descent"...
Do you have a crystal ball on the economy? If so, you should have aggressively gone long on oil as it rose, shorted it when it crashed, and now be aggressively selling stocks short, and becoming a bazillionaire 3 times over. Are you?
Car sales chopped by a factor of 0.6 in one year. That's pretty spectacular. And this already when this economic downturn has hardly got started yet.
Within reason, yes. But I (and others here) don't need magic, as rational reasoning does just as well. How could severe economic traumas not be the inevitable consequence of a growth-dependent system hitting an energy ceiling?
"Car sales chopped by a factor of 0.6 in one year."
No, it's a 40% decline, not 60%.
"That's pretty spectacular. "
Not really. We've seen that kind of thing many times before. This is a bank panic, like 1873, 1893 (IIRC), 1907, 1920, 1929, etc, etc.: capital purchases always drop sharply. We've just gotten out of the habit of dealing with bank panics, because after the 1930's we had better bank regulations and Fed interventions. In the 90's we dismantled bank regulations, and gosh, we got another financial bubble and panic.
"And this already when this economic downturn has hardly got started yet. "
Again, how do you know? It kind've looks like we're bottoming out. If you disagree, are you heavily shorting stocks? If not, why not?
" How could severe economic traumas not be the inevitable consequence of a growth-dependent system hitting an energy ceiling?"
Because there are other, better explanations. If this were a btu shortage, the world economy would have stalled several years ago. It didn't: it kept growing just as fast as ever, until the US financial bubble created problems elsewhere.
As I said below: take a look at 1)income transfers from oil exporters to importers, 2) oil-importer GDP vs exporter GDP, and 3) world GDP vs oil prices. Hamilton's analysis showed that world growth continued well into the price shock - OECD economies started to slow down, while Russia, ME and other exporter economies expanded and even started to overheat.
All of this seems to indicate that the problems of an oil shock have little to do with not having enough BTU's, and more to do with the unexpected stresses that income transfers place on the world's financial systems: petrodollar recycling, mortgage collateral for petrodollar debt, etc.
If everyone replaced their old vehicle with a hybrid it would take 15 years to turn over the fleet. Unfortunately, it would take 5-7 years to build enough factories to convert all production to hybrids.
Realistically it will be a couple of decades’ process to change over to hybrids or plug in electrics. We will have oil shortages long before then.
"If everyone replaced their old vehicle with a hybrid it would take 15 years to turn over the fleet."
Well, in normal times (sales volumes of around 15M, or so) 50% of miles traveled comes from vehicles less than 6 years old. 50% is pretty good.
"Realistically it will be a couple of decades’ process to change over to hybrids or plug in electrics."
Toyota plans to have all models hybridized by 2020. They're now the biggest manufacturer in the world.
"We will have oil shortages long before then."
Well, I should think that would accelerate the transition. In the meantime, we can carpool. Just carpooling with one other person cuts fuel consumption by 50%. Need to cut by another 50%, to get a cumulative reduction of 75%? Carpool with 3 other people. That will keep you going until you get to the top of the waiting list for a Volt.
You might want to buy your Prius now (Toyota is even discounting them a little right now), and pay the extra $7k to turn it into a plug-in. Then, you're all prepared.
Finally, my point was that the transition is cheap and easy - definitely low-hanging fruit. I certainly agree that it would be nice to accelerate it.
Transportation costs are an issue for consumers, also in Germany.
Title:
Percentage of transportation cost of net income, single household
orange line: urban areas
green line: rural areas
€/Monat netto: net income per month (Euro)
Source: Institut für Verkehrsplanung und Logistik TU Hamburg-Harburg
in: Federal Institute for Research on Building, Urban Affairs and Spatial Development: (Chances and Risks of rising transportation costs for urban and regional planning - transition scenario "postfossil mobility") 2009
Interesting.
I assume transportation costs are at the pump.
Is there anyway to illustrate how much of the pump price are taxes (in Germany)?
and what is the crude oil price being used for the diagram?
Rune,
no, I don't know on which crude oil price this is based on. But they took overall consumer statistics data from 2003. The transportation costs also include other modes of transportation, e. g. public transportation.
The graph is just an easily available example from this study, which is a rather complex model to assess the effects of higher fuel prices.
In short it sees serious impacts especially for poor households, due to direct transportation costs as well as to the indirect costs of oil-dependent products.
This goes well in line with an earlier study made for a German federal state.
From the abstract:
The study (which is designed as a starter for further research) also summarizes possible mitigation policy measures.
Although this effort looks encouraging to me, this research group still seems to be a small supply-concerned group that so far has almost zero impact to the actual federal politics.
drillo
Thank you for your response. It was a little late when I wrote my clarification part.
To me it looks like the transportation costs reflected in your diagram reflects all modes of transportation, own car public transport (bus, train, air).
It also looks like the costs for buying a car and maintaining (services, annual road taxes, cost for toll roads etc.) it is included.
What could have been interesting was to have a diagram that showed a split between the capital/annual costs (for car ownership), part for public transport and then the costs for fuels (if possible, as a function of the crude oil price).
Rune
You might find this European Commission document useful.
http://ec.europa.eu/energy/observatory/oil/doc/prices/bulletin_with_taxe...
It gives recent 'at the pump' prices nationally across the EU, and a chart for the last 12 months for weighted average prices of EU automotive gasoline and diesel and other oils. The difference shown on the chart between automotive diesel and heating oil reflects the lower tax component in the price of heating oil. My understanding is that some major EU economies receive as tax approximately 60% of the pump price, but this proportion varies not only by country, but also with the underlying price of the oil. The UK taxes automotive fuel a fixed amount (sum) per litre at the refinery. VAT then is additional at the retail outlet.
This is useful.
A suggestion: take a look at 1)income transfers from oil exporters to importers, 2) oil-importer GDP vs exporter GDP, and 3) world GDP vs oil prices. Hamilton's analysis showed that world growth continued well into the price shock - OECD economies started to slow down, while Russia, ME and other exporter economies expanded and even started to overheat.
All of this seems to indicate that the problems of an oil shock have little to do with not having enough BTU's, and more to do with the unexpected stresses that income transfers place on the world's financial systems: petrodollar recycling, mortgage collateral for petrodollar debt, etc.
Good contribution to this area of study, Dave & Steve!
BTW, TOD contributor emeritus Dave Cohen did an exhaustive explication of and partial rebuttal to the Hamilton paper in his column this week: Real GDP and the Oil Shock of 2007-08
Also: Gail, for what it's worth, I spoke to the Dallas Fed chairman (the Fed's top guy on energy issues) at a cleantech conference two years ago, and he explicitly said that he didn't think peak oil was a serious issue. When I pressed him on the issue, I got the distinct impression that he was deriving his opinion more from that of his friends than from any independent study of the subject.
Chris,
Dave Cohen makes a better case that oil contributed but was not the primary reason(financial excesses), just as you could argue the dot com recession was not caused by oil price changes.
The earlier post by Gail cited at the top here (node/5230) seemed a superb enough presentation on this question.
I beg pardon for being an idiot here but did it actually need improving on? The correlations above look to me to be adding little more to the case.
I think the key thing is that these economic traumas were/are to be expected as inevitable consequences of hitting an energy ceiling, and they have now occurred (or as Martenson puts it, he's become a historian), and therefore what's the big deal (brain-dead deniers apart)?!
Then what do you make of Dave Cohen's arguments?