| Tech Talk - The Appalachian Basin, simple lessons from the beginning | The Oil Drum | Getting Even with ExxonMobil |
Peak Oil - April 2011 Update
Posted by Gail the Actuary on May 2, 2011 - 1:27pm
The US Energy Information Administration’s January oil production figures are out, and they show record oil production. Where are we headed from here?
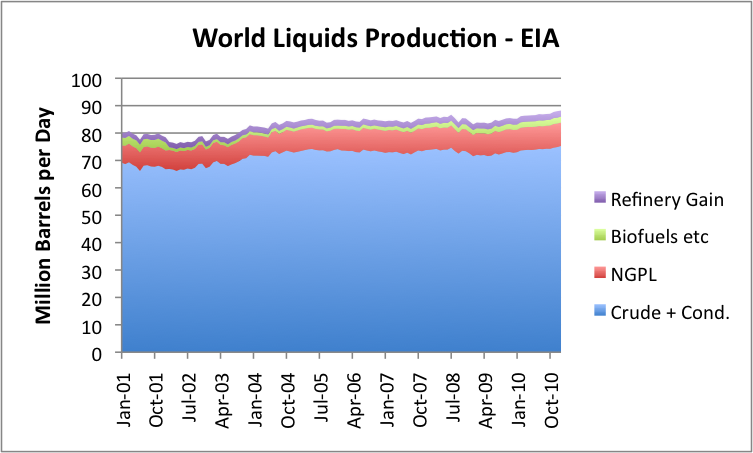
While production for January is up a bit (219,000 barrels compared to December), the monthly numbers bounce around a fair amount because of planned maintenance. They are also subject to revision. Figure 2 seems to indicate that the production amounts are trending upward a bit, probably in response to the recent higher prices.
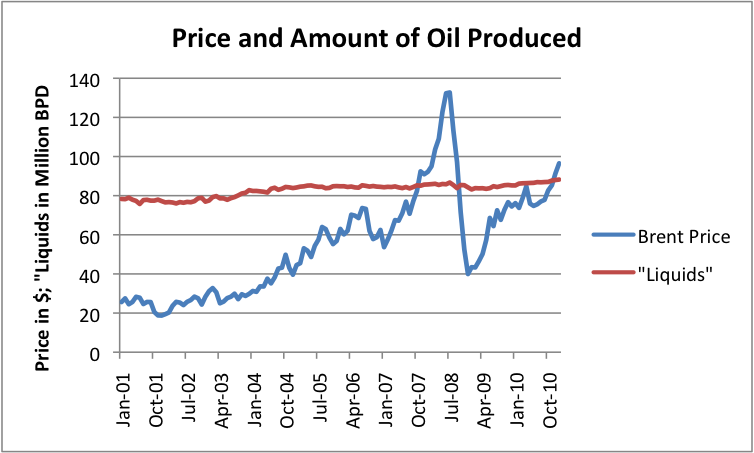
The amounts in Figures 1 and 2 are not entirely up to date, since they are only through January 31, 2011. All of the disruption in the Middle East started at the very end of January, and the disruption in Libya's supplies did not start until February. The earthquake in Japan took place March 11. OPEC estimates that OPEC and world oil supply fell in both February and March, with Libya's production falling by 1.2 million barrels a day between January and March, with only small supply increases elsewhere offsetting this. World oil prices continue to be high. At this writing, West Texas Intermediate is about $111.50 a barrel; Brent is about $122.
So what do we expect going forward?
Eventual Decline, but not Following a Hubbert Curve
It seems to me that the story about what happens in the future with oil supply is much more complex than what depletion and new supply alone would suggest. As I explained in a previous post (Our Finite World version and Oil Drum version), the actual downslope is likely to be steeper than what a Hubbert Curve would suggest, because economies of many importing countries are likely to be adversely affected by rising oil prices, and because demand (and tax collections) are likely to be low in countries that lose jobs to countries that use oil more sparingly.
Hubbert assumed that nuclear or some other cheap alternative form of energy would allow business to go on pretty much as usual without oil. We know now that we are close to the downslope, but no inexpensive alternative has been developed in quantity. Because of this, actual production is likely to be less than the amount that is theoretically possible. This happens because of indirect impacts of inadequate oil supply, such as recession when prices oil prices rise; riots when food is in short supply; and inadequate demand for oil because of jobs move overseas to countries using less oil, leaving many unemployed.
In some sense, if oil prices could rise indefinitely, we would never have a peak oil problem. The high prices would either stimulate production of alternative types of energy or would enable oil production in areas where oil is very costly to extract. The indirect impacts mentioned above prevent oil prices from rising indefinitely. These indirect impacts seem to be related to inadequate net energy for society as a whole. Theoretically, if oil prices could rise indefinitely, we could even end up using more energy to extract a barrel of oil than really is in the barrel of oil in the first place--something that is hardly possible. The fact that rising oil prices lead to impacts that tend to cut back demand seems to be a way of keeping prices in line with the energy the oil actually provides.
Which countries are able to buy the oil that is produced?
If we look at oil consumption by area, we find the following:
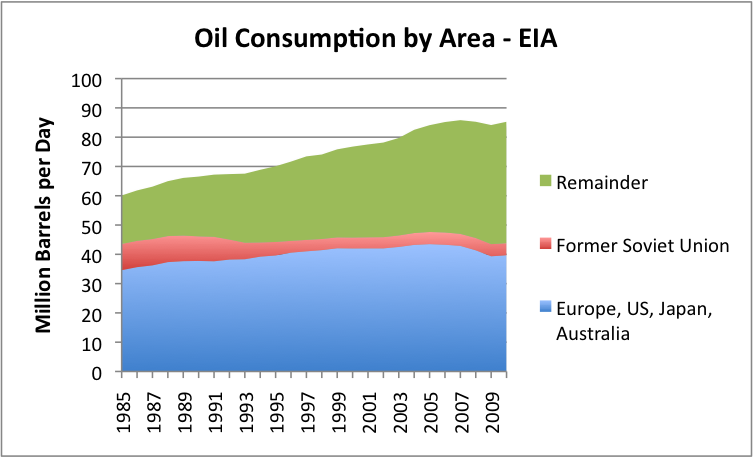
It is clear from Figure 3 that consumption of my grouping called "Europe, US, Japan, and Australia) is much flatter (and recently declining) than that of the "Remainder." The Remainder includes oil exporting nations, plus China and India and other "lesser developed" countries, many of which are growing more rapidly than countries like Europe, US, Japan, and Australia.
I have plotted the same data shown in Figure 3 as a line graph in Figure 4. The latter figure shows even more clearly how different the oil use growth rates have been.
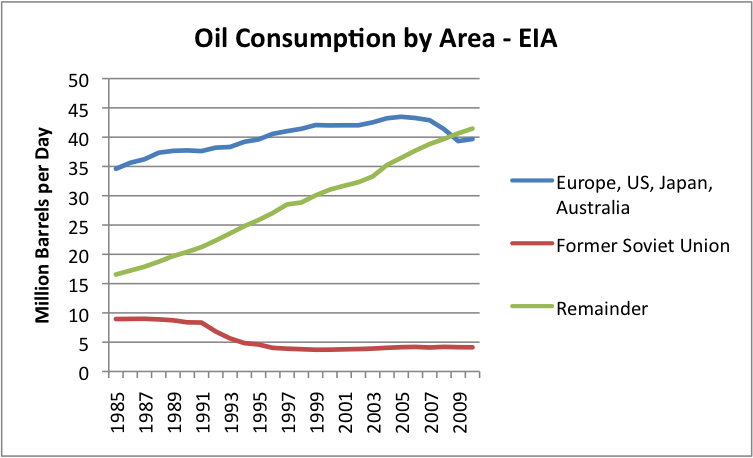
If world oil supply is close to flat (shown in Figures 1, 2, and 3), Figure 4 shows that we have a potential for a real conflict going forward. The "Remainder" countries in Figure 4 will want to continue to increase their oil usage in future years, even if oil supply remains flat. This is likely to lead to considerable competition for available oil and high prices, such as we are seeing now. About the only way the "Remainder" countries can increase their oil usage is if oil usage by the "Europe, US, Japan, and Australia" group declines.
Many people believe that the only alternative to adequate oil supply is for the amount of oil produced by oil companies to fall and because of this, for shortages to result. While this scenario is possible, especially in the presence of price controls, in this post we show another way that oil consumption can be limited.
A very common way that oil usage (consumption) can be expected to decline is if high oil prices induce a recession. The countries that seem to be most susceptible to recession are countries that are (1) oil importers and (2) are heavy users of oil, since an increase in oil price has the most adverse impact on the financial health of these countries. When recession is induced, there are layoffs. These layoffs reduce oil usage in two ways: (1) less oil is used for making and transporting products that these workers would have made, and (2) the laid off workers are less able to afford products using oil, so reduce their purchase of oil products.
Because of this relationship, competition for oil is likely to be very closely related to competition for jobs in the future. The countries that get the jobs can be expected to get a disproportionate share of oil that is available.
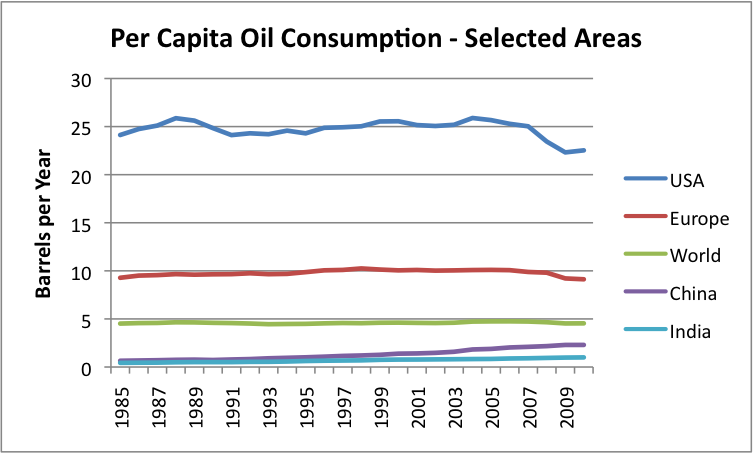
If we look at per capita oil consumption (Figure 5) on a world basis, it has been close to flat since 1985, because oil production until very recently rose enough that oil growth more or less corresponded to population growth. China and India's per capita oil consumption rose, meaning that the oil consumption of someone somewhere, such as the Former Soviet Union, needed to decline.
Future Oil Supply
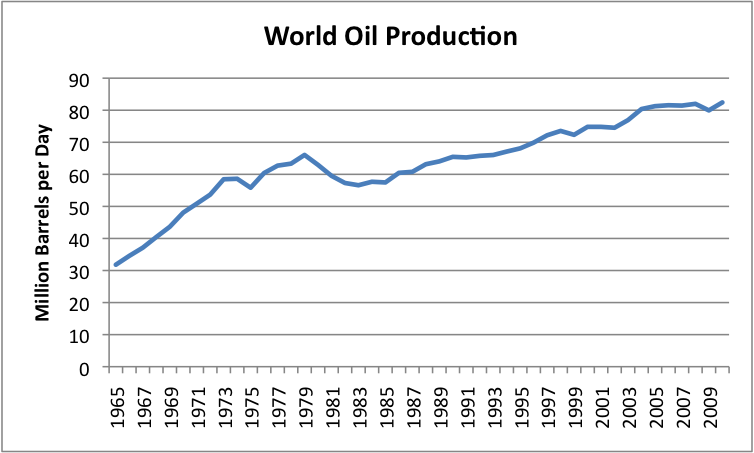
If we look at historical oil production (Figure 6), it has been fairly "bumpy":
By fitting trend lines, we can see where oil production seems to be headed:
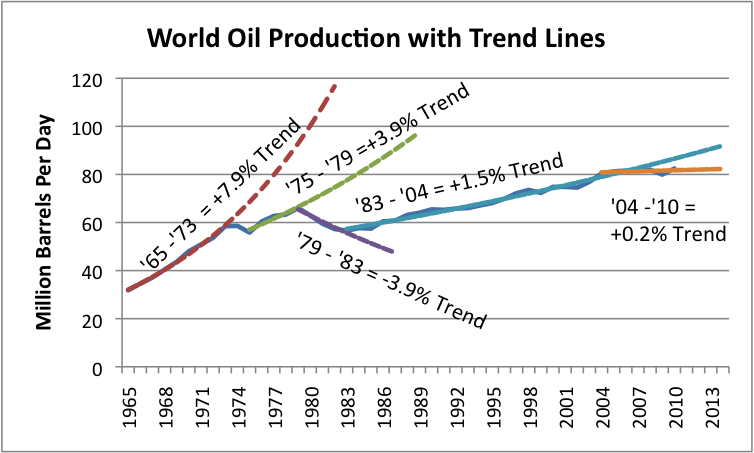
What we can see from Figure 7 is that the growth rate of world oil supply has gradually been slowing. The growth rate was highest in the 1965 to 1973 period, at 7.9% per year. Then we hit the "oops" period of 1973 to 1975, when we ran into conflict with OPEC regarding oil supplies. The trend rate dropped to 3.9% in the 1975 to 1979 period. Between 1979 and 1983, oil consumption dropped to a -3.9% per year, when we picked some of the low hanging fruit regarding oil usage (mostly by eliminating petroleum from electricity generation and downsizing automobiles). The trend between 1983 and 2004 shifted to +1.5% per year, and since 2004, seems to be about +0.2%.
There are so many countries involved, that it is not easy to identify one country or area that is rising, but one country of note is Iraq. Its production in January, 2011, seems to be up by 300,000 barrels per day, relative to mid-2010, based on the latest data. Thus Iraq seems, for now, to be helping to keep world oil production flat, or even growing by a bit, despite increasing depletion elsewhere.
Looking at Figure 7, it looks like the "trend" in trend rates over time is down. In the absence of other information, we would expect production to remain at its recent trend rate of 0.2%, or alternatively, the trend rate could take another step downward, probably to an absolute decline in oil production. A recent announcement from Saudi Arabia suggests that its ability to offset declines elsewhere in the future is likely to be virtually nil, so a continued decline in production from the North Sea and elsewhere will need to be made up with new production elsewhere, or will lead to a worldwide decline in oil production.
World population has been growing. If oil production remains flat or declines, and world population grows, this means that someone has to be a loser, in terms of per capita consumption. I am not certain how this will turn out, but I see at least three forces that may come into play:
1. Countries may figure out that permitting jobs to move to less developed countries is not in their best interests, and start increasing protectionism. This will tend to keep demand more level (higher for importers, and lower for growing economies). The overall impact on oil demand is less clear--less oil will be needed for long-distance transport, but more oil will be needed to maintain current lifestyles of workers.
2. Countries that are in financial difficulty may find themselves increasingly shunned, as they seek to "restructure" their debt, and may find themselves increasingly cut off from buying oil products and the goods that that are made using oil products. This will tend to reduce aggregate world demand for oil, by reducing consumption in specific countries that have financial difficulty.
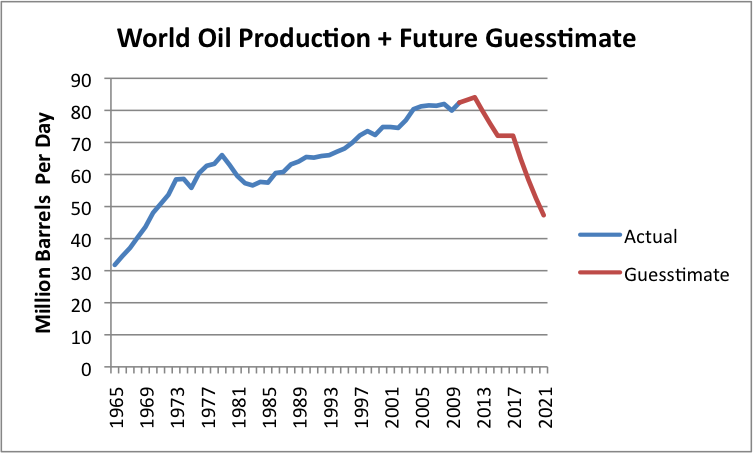
3. There may be recession affecting a number of countries, reducing their demand for oil. We don't know how exactly that this will change the shape of the world oil production curve, but Figure 8 shows my very rough guess as to how supply might be affected. (Your view may differ.)
It seems to me that as we go forward, we are likely to see a jagged pattern in oil production decline, reflecting a combination of less demand for high-priced oil as oil supplies continue to be very tight, except at high prices. In addition, some countries can be expected to increasingly drop out of competition for oil, as their financial situations deteriorate. Thus, the pattern for decline in oil consumption can be expected to vary significantly from country to country, depending on their policies and their financial conditions.
Clues as to Which Countries May Drop Out First
If we look at the per-capita consumption of the PIIGS countries, we see that for the most part, these were countries that increased their consumption of oil, and then were not able to maintain the increase.
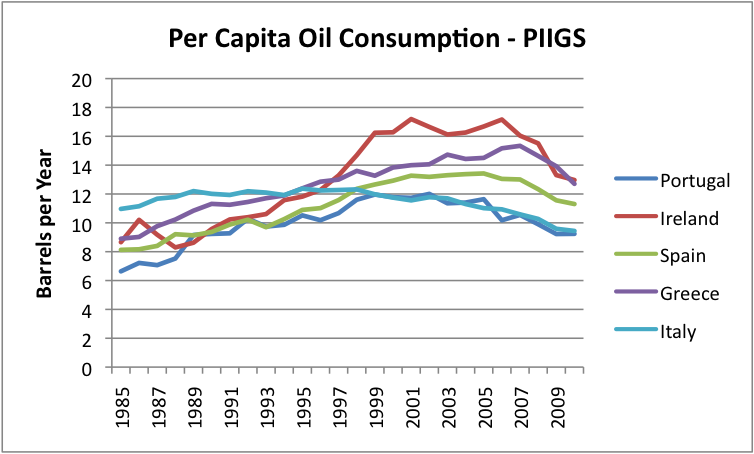
The difference is quite striking when we compare per-capita oil consumption to a few of the non-PIIGS European countries.
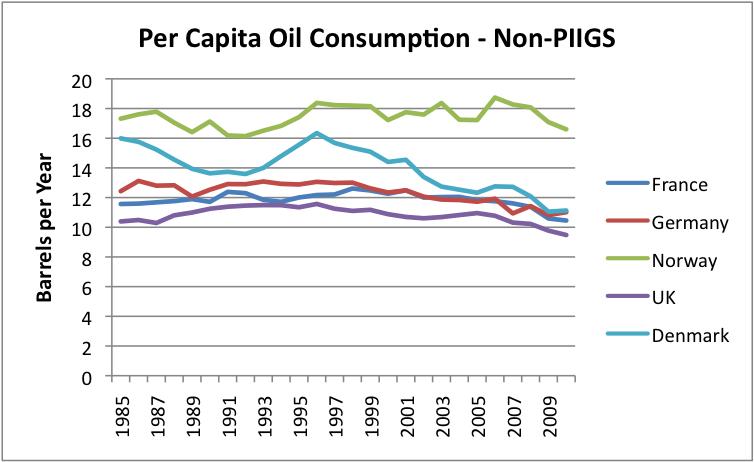
Why is there such a different pattern between the PIIGS and the non-PIIGS? I haven't researched the situation extensively, but it would seem as though the PIIGS countries tended to be agricultural countries that tried to develop more diversified (oil intensive) economies. They expanded and incurred a lot of debt, and now this debt is becoming difficult to pay back. As far as I can see, this economic growth was not based on the growth of stable, fairly cheap supply of electricity, such as hydro-electric or coal. Instead, growth depended fairly heavily on oil use, and the cost of oil rose. It may be that part of this growth in oil use occurred because of an improvement in standard of living--more cars, more vacations, bigger homes.
My working hypothesis is that when oil prices went up, the economies of the PIIGS countries had too much debt for the new industries to provide enough revenue to service both the higher costs of oil and the debt costs. Countries which didn't try to grow in this way didn't have as much difficulty, although high oil prices are still a burden for them. They may eventually run into debt problems, just a little later.
What are China and India and some of the other countries that are growing rapidly doing differently, that their economies haven't collapsed? One thing they have going for them is the fact that their oil usage is at a vastly lower level, even after rapid growth. Another thing that they often have going for them is growing electricity production, using an energy source that is relatively cheap. In the case of China and India, this is mostly coal; in the case of some of the other lesser developed countries, it is hydro-electric.
It seems as though at some price, each country will hit recessionary pressures and drop back in its demand for oil. This price will vary by country, depending on the country's current debt situation, the extent to which the country can continue to "grow" its economy based on a growing source of cheap electricity, and how well international trade holds up with increased protectionism and higher oil prices. Countries depending on growing hydroelectric and coal-fired electricity are likely to hit limits, too, as these supplies reach natural limits.
One situation which may affect how long oil prices can stay high for the United States is the existence of QE2, or "Quantitative Easing 2." This seems to keep the dollar low relative to other currencies, thus allowing commodities prices to remain high. QE2 is scheduled to end June 30, or earlier. If it is allowed to expire, it would seem as though interest rates could rise materially (because QE2 also keeps interest rates low), and could lead to a rapid deterioration in the financial condition of the United States. If this should happen, it would seem as though the United States could be one of the countries that enters recession and significantly decreases its demand for oil. Of course, high oil price by itself may lead to this outcome quite soon, also.
We cannot know how all of these forces will play out. Generally, I would expect that there will continue to be an upward push on the price for oil because of rising extraction costs, and because unrest in the Middle East is causing countries to provide additional benefits for their citizens, further raising their costs (estimated to be $95 barrel by the Wall Street Journal). As long as the world economy is expanding, rising demand will also tend to pull oil prices upward, because many countries are trying to compete for a supply of oil that is barely growing.
The various countries around the world can be expected to be in differing positions with respect to their ability to pay high oil prices. Gradually (or not so gradually), the weakest ones will be pushed away from buying oil, either because of debt defaults and shunning by exporters (unless they have goods to trade in return), or because of recession, or both. World oil production seems likely to decline as the number of countries that can afford to continue to purchase high-priced oil declines. Ultimately, oil consumption can be expected to drop to close to 0, because no country will be able to afford to buy very much oil at a high price, and because oil companies will not be able to maintain necessary infrastructure for a very limited supply of oil.
I don't think that we can expect an analysis of the theoretical capacity of future world oil production to tell very much of the peak oil story. We really don't know how much of the oil which seems to be available will actually be produced. A lot of the story will depend on the ability of individual countries to keep their economies in good enough shape that they can afford to buy high-priced oil. Many residents of countries that are shut out from oil supply are likely to find that oil products are not available at any price.
Originally published on Our Finite World.
Contact
- Content: editors at theoildrum dot com
- Tech support: support at theoildrum dot com
License

This work is licensed under a Creative Commons Attribution-Share Alike 3.0 United States License.
Gail, glad to see someone step in to play something of the role Rembrandt once played here. Can we expect a monthly report along these lines from you, or is this a one-time thing.
I would just start by suggesting the same thing that I suggested to R--that the first graph not be "total liquids" but rather C&C, otherwise we are involved in ever shifting goalposts, imho (though I realize that your post may be serving slightly different purposes than R's).
I do wonder how much longer the world can support oil at over $100 before a new mega-recession hits. Are we weeks away from a new crash? Months?
I'm wondering this too. Anyone have a sense when we're going to see the new recession start, and when oil prices are likely to top out in this cycle?
I have a call but not a forecast as it is pretty much impossible to forecast accurately and consistently when trying to time the markets. Things change quickly and todays forecast/call might need adjustment tomorrow and my "call" might be adjusted this month or tomorrow. That said...
I believe people adjusted psychologically and financially to $4 per gallon during the last hike. People who needed to began migrating to smaller cars, different commuting methods etc. at $4 did so already. Energy is also now much less of GDP than it used to be due to energy efficiency.
My call...oil is not going much under $100 again (the cost of marginal barrel is that already for European producers and the Saudis are likely really pissed at Obama for Mubarek and his messes in the middle east (ie Libya) and doing him Obama no favors and the Saudi budget is dependent on $90 anyway)...and the economy goes into negative growth when people make their next shifts (ie. to the inevitable smaller cars, less travel, etc.) at around $5.50-$6.00 per gallon. We might see $150-200 a barrel and if I had to guess it might be this summer or if not, next spring.
That said, I could change my guess tomorrow, nobody can possibly have an always accurate short term and timing chrystal ball in our complex and fast changing world. That and a dollar will get you a cup of coffee (at least this year).
At least partly in response to the Libya shortfall, refiners in both Europe and the USA have run down their inventories, in spite of reduced spring demand. Now with the summer driving season approaching, they will have to restock. Brent is very likely to go to $140/b in the next 3 months.
"That and a dollar will get you a cup of coffee (at least this year)."
Not in my neighborhood.
I notice a number of folks raising this issue recently - namely why haven't we had a recession since the price of oil is now up to over $120 (Brent)?
I would like to suggest that depends on who you believe regarding GDP growth.
I tend to follow John William's Shadow Government Statistics rather than believe the official government line. We have been in recession for many years.See the blue line in the link below.
http://www.shadowstats.com/alternate_data/gross-domestic-product-charts
The economy turns slowly - I didn't expect it to be in recession already. At soonest my guess was that by this summer we'd be in recession officially, but that's just a random guess as I haven't looked at the leading indicators or any of the other data that usually helps figure that sort of thing out.
I think part of the reason is QE2, which is helping keep the dollar low and the stock market high. It also helps keep oil prices magically high. I think another part of the reason is the 2% forgiveness of Social Security payroll tax that started January 1. This was as intended as stimulus, but it really is ending up being offset to the higher oil prices. Natural gas prices are low this time around, so this may be helping a bit. And as you say, the GDP numbers are probably somewhat distorted, to make things look better.
There is also issue of things taking time. I think quite a few folks are talking about the possibility of a recession, perhaps this summer, after QE2 ends.
Yes, an oil report, any oil report is greatly appreciated.
The problem we have now is that the EIA doesn't have funding to keep up its International Energy Statistics. EIA sent out a Press Release, and Gregor MacDonald wrote a post about the problem.
I feel really sick about the situation, because that is my main source of data. IEA data is sort of available, but it is a pain to work with. Much of the data is behind an expensive pay wall. BP data is good, but it only comes out once a year.
I suppose if oil supply is a problem, the easiest way not to have to worry about it is to stop collecting data on the subject. (Kill the messenger!) I should write a post on the subject, but have been busy lately.
Well one step slightly better than fraud is to hide the facts. Not surprised at all and a very very bad sign of a major problem for oil.
Think of it. No funding for the most profitable business in the entire history of the world.
Anyone have any ideas. LOL
I noticed too that besides the data going away, the 2012 edition of Annual Energy Outlook is going away.
If it becomes too hard to say anything reasonable, just stop putting out the report!
What the EIA is doing is like turning off the fuel indicators in a plane. I put that into an image:
http://www.crudeoilpeak.com/?p=3157
I am not surprised that they eliminated funding.
I have also gone back and forth on complaining about lack of data. But after a certain amount of time, one realizes that the redundancy in the data that already exists is plenty good enough to model everything that needs interpretation. The key thing you will find is that every subset of data forms tightly interlocking elements of the overall model. Its a lot like having a compact disc that is heavily scratched up but that still plays perfectly well. The trick is the redundant data that exists in the media.
I find the news regarding the defunding of EIA incredibly troubling. I was suprised not to see this show up in the Drumbeat yesterday. Regardless of your position on energy policy, shooting in the dark is not going to be the way forward. I find it hard to believe this could be cut without some understanding of the ramifications. Is anyone aware of an opportunity or effort to repeal this defunding? Any ideas as to where pressure could be applied to bring this back? Any EIA employees that will be fired that may be willing to give us some inside information on how this came about?
In the absence of good data, decisions will be made on the basis of rumor, wishful thinking,magical thinking, innuendo, politics,conspiracy theories,denial, and hidden or not so hidden agendas. Oh, wait .....
People had some pretty good data in 2008 and now, when they show up at the pumps. And yet, there has been little meaningful change in behavior.
For all those people who bought brand, spankin' new SUVs since 2008, did they think that high gas prices would be a one time thing, never to be repeated again? Did they think the government would fix the problem? Did they think that technology or some amazing brand new discoveries would fix the problem? Maybe. Or maybe they just didn't give a damn.
I would prefer to err on the side of conservatism when it comes to future availability. But that's just me. If the whole thing implodes, I am past caring. People will change when they have no other choice.
From my work experience, most people hate data. Reality bites. Better to create your own reality. That way there is less accountability.
In sum, I can't see how the data has done much good. We are determined to be stuck on stupid.
I was at the EIA conference last week, and they said that they had added a special session after the conference was supposed to end to discuss what changes were going to be made. Unfortunately, I wasn't able to attend, because the timing conflicted with my flight.
If someone would organize a betting pool, I'm in. My bet is "oil" (as in Brent) hits 160 dollars in the first two weeks of september, and then crashes.
There's something slightly odd when reading a 'Peak Oil Update' supposedly for April when the one of the graphs used is only covering up to Oct '10(over half a year back):
http://www.theoildrum.com/files/Price%20and%20Amount%20of%20Oil%20Produc...
Besides, I'd like to maintain that it's also important to note the rate of investment into new oil wells versus the actual amount of oil gotten out, and if you look at that data, you see that we're investing more money than ever before in history, yet, we are essentially running on the same spot, only that we have to run faster and faster just to stay in the same place.
In short: an unsustainable situation.
I think it was Leanan who said in one Drumbeat back that people are pretty worthless at forecasting and I think that danger to hubris should perhaps be contemplated when you post this überdoomerish graph:
http://www.theoildrum.com/files/World%20Oil%20Production%20Incl%20Future...
Uppsala University's estimates, made by genuine experts who've looked at great detail at all the major Giant Oil Fields, said that oil production will be around 75-76 mb/d in 2030. You are at 46-47 as early as 2021.
I'm not saying I know exactly what will happen, but that's the entire point, none of us do. We should perhaps be a little more careful, then, painting extreme scenarios with such dramatic graphs.
I wouldn't be surprised at all if this post became the new 'ace 2008 post' where he basically did the same thing as you do right now, but he did it in '08. He's now widely ridiculed and discredited.
Here's ace's post from 2008, now widely off the mark(not even close).
And will this ultradoomerish scarefest be the 2011 equivalent?
http://www.theoildrum.com/node/3623
I've been struggling with that as well - that Uppsala's projections show about a 1% decline rate in all liquids production. From asking people whose opinions I value on this, I've pieced together a rough guess which I think is plausible, starting in 1-3 years: 1-2% decline in all-liquids, 2-3% decline in C+C, and 4.5-5.5% decline in available net exports of C+C.
Agreed. I remember seeing graphs with projections of Russia & KSA dropping immediately off a shelf, when in reality they have pretty consistently pumped oil. We won't know when the wheels will come off on world oil production until it occurs. And until then it would probably be more prudent to simply report information as it becomes available.
With super straws extracting its probably a case of 'full on' until the fat lady sings, and when that might be is a crap shoot. For now it's BAU at higher prices and as long as the world economy can still put the pedal to the metal it will. Just make sure not to get disenfranchised until the whole system dumps. Otherwise you'll be in a world of hurt long before everyone else and what a lonely feeling that will be. Much better to have lots of company, as misery loves company.
It's not just super straws!! In 2010 vast amounts of oil have been discovered around the world. Iraq, Brazil and West Africa will greatly increase production in coming years.
Iraq, Iran, the Caspian Basin, and Central Asia could be producing more than they are, were it not for geopolitical factors.
The data shown is the latest available, which is through January. The fact that the last tick mark is at October 2010 doesn't mean anything--the actual data goes through January.
Uppsala University may have "genuine experts", but I would characterize their forecasts as closer to an upper bound for what can happen (although a true breakthrough in extraction techniques could raise it). They have completely omitted the impact of anything like a major recession, or huge financial problems, or Middle East war, or Middle East political instability bringing down governments, or governments voluntarily cutting oil use because of CO2 problems.
As I see it, it is the above ground factors that will be the problem limiting oil supply. How does one forecast them? Just pretend they don't exist?
The forecasts in the 1972 book Limits to Growth suggested that the real model for the downslope is more like "overshoot and collapse" than the downslope implied by a Hubbert Curve. I explain this issue a bit more in this post, The Context of Hubbert's Peak in World Oil Forecast, up now on Our Finite World and the ASPO-USA Newsletter.
That "überdoomerish" graph doesn't match a 2 trillion barrel URR just looking at it. It is maybe 1.6 trillion eye-balling it. Where did that chart come from?
I spent some time looking at the Uppsala thesis when I was working on The Oil Conundrum, since it essentially tried to do a lot of what I was working on. Overall I wasn't completely impressed with it because Hook didn't do the innovative academic analysis that one hopes would come out of that kind of environment.
I think Ace made a mistake in doing that bottom-up analysis, which demonstrates that you can't project based on information that you haven't counted. I don't go that route myself.
The point is that 2 trillion URR is something like an upper bound, not the expected amount.
If we could count on a business as usual world for the down slope, without huge financial problems, everyone fighting over everything, food prices that are too high for the common people, and interference with international trade, then maybe we could count on 2 trillion URR. It seems quite likely to me that much of this oil will be left in the ground. Some may be rendered non-economic by higher taxes, but more of it will be left because of wars, and or because drilling equipment can't be repaired because of revolution or international trade problems, or because of financial problems cut of some would be producers (perhaps the US) from buying needed parts in the international market.
What is needed is more like "Limits to Growth" modeling that includes other limits besides oil. Looking at geology alone gives a misleadingly high impression, in my opinion.
As usual, you are quite right, Gail. We face financial and economic limits, political and governmental limits that are every bit as binding as geological limits. Of course, the geology is "fundamental" in the sense that the geological limits do not change, whereas financial and governmental limits do change.
In ten years I expect that the U.S. will be a command economy, much as it was in World War II. I also expect a much more rapid ramp up of Coal To Liquids than Heinberg says is possible. Our dictator (for I think democracy in the U.S. will be in name only in ten years) will struggle to maintain some form of BAU by mobilizing resources to get the last of the oil and also to make rapid transitions away from conventional oil.
Of course, I've been wrong before. But if I err, I think I'm erring on the side of optimism.
This is an issue I have been trying to get some attention for. Geological limits includes all of the physics involved. A theoretical model based on these fundamentals tells you the boundary of the dynamic. The psycho-social factors will be bounded within this limit. The theoretical model doesn't tell you what will happen within the boundary but it tells you what can't happen. For example, my theory based model tells us that the down side of depletion, assuming the maximum possible extraction rate subject to the constraints imposed by declining EROI, shows that the down rate is much greater than Hubble's curve or other math-based models show. Ergo, if correct, technically, the fall off in oil (all fossil fuels) extraction will be dramatic in the limit. Compound that with factors that Gail brings up and one moves a good deal closer to the doomer view.
George
PS. The linked page has a graphic that shows this model.
"expect a much more rapid ramp up of Coal To Liquids"
It will be interesting to watch what happens in this space
Australia is facing some large changes in its balance of trade, due to the need to import more oil as domestic supply declines ... and so we see projects such as this evolving
http://www.platts.com/RSSFeedDetailedNews/RSSFeed/ElectricPower/6041846
But I do wonder how much will end up being actually consumed in Australia (given the Chinese partners)
CTL is some of the dirtiest tech around, and a huge CO2 emission source. The CTL plants in South Africa (SASOL) pollute the air on a vast scale; the plume is clearly visible from satellites across a large portion of the subcontinent at times. Johannesburg stinks of sulphur compounds regularly from the CTL plants hundreds of km away. Sore throat, sore eyes, sick feeling.
If this is the future, we are stuffed.
It doesn't have to be quite that dirty. If hydro supplies the electric and the CO2 is piped off to pressurize an oil field it could look better than the tar sands. There is a proposal for such drifting around the Alaska. I saw a presentation on it given to the legislature about a year ago but the numbers floated were more than rough. With sustained high oil prices I'm sure the 'plan' will resurface. A couple pretty fair sized--diameter and length--pipes were in the pictures. So it may well just be someone's pipe dream.
pipes were in the pictures. So it may well just be someone's pipe dream.
Baaaaad.
Just a little?- )
remember I live in a state where the most popular bumper sticker for a long time was 'The Alaskan's Prayer'
" Oh Lord please gives us another pipeline, we promise won't piss it all away again this time!"
LOL - I've seen such sentiments expressed; but with Aberdeen as the place that won't piss it all away if they get a 2nd chance!
The graph at the top of the page is misleading. It makes it look like we have recovered the 2008 peak in CC and it is smooth sailing to greater glory from here on out.
Using the original EIA data at http://www.eia.doe.gov/ipm/supply.html (xls file 1.1d) we are less than the 2005 peak and are falling. The increase is just a recovery from the drop in production after the 2008 financial meltdown. Don't expect 75 mbd of CC in 2013.
The original EIA data was stopped months ago, this is where the latest data is.
Production is 3 million barrels per day more than 2005.
http://www.eia.gov/cfapps/ipdbproject/iedindex3.cfm?tid=50&pid=53&aid=1&...
Since propane and butane can be used as transportation fuels they should also be taken into account.
http://en.wikipedia.org/wiki/Propane
New and converted vehicles are using butane and propane.
http://www.lpg-vehicles.co.uk/
http://uk.cars.yahoo.com/car-reviews/car-and-driving/vauxhall-vectra-1.8...
The graph is plotting C&C and the comment pertains to the original EIA C&C data (through October 2010, as is graphed). Whatever plotting program was used to produce that graph is putting the October 2010 peak at 2008 levels.
October, 2010: 74.080
July, 2008: 74.686
May, 2005: 74.190
The claims being made are that C&C will be increasing or not falling for the next 20 years. Total and utter rubbish not supported by any data.
dissident
Gail has said the last data point is Jan 2011, sometimes graphing tools do not write all months which it picks up data from the data sheet.
The amounts in Figures 1 and 2 are not entirely up to date, since they are only through January 31, 2011.
EIA data is down at the moment, but I have
May 2005 74,186,176
July 2008 74,669,571
Nov 2010 74,140,356
Dec 2010 74,895,362
Jan 2011 75,828,635
This is why the graph shows 2005 and 2008 highs exceeded, because it has been.
My last post to you, I was trying to be helpful, but if you want to cross swords with me, make sure you come armed with some facts.
Where exactly can data be found on investments into new oil wells?
Prof. Aleklett's Uppsala estimate, which can be found here:
28/4/2011
IEA oil crunch warning: governments should have worked on it 10 years ago
http://www.crudeoilpeak.com/?p=3130
has curves showing the oil-geological and technologically possible maximum production. What Gail is saying is that there will be many factors, including debt, impacting on the ability of countries to buy oil at high prices. At the same time there will be recessions following oil price spikes, reducing demand.
The EIA crude oil data for 2010 do not seem to be reliable. There are big differences to IEA, OPEC and JODI data as shown here:
http://www.crudeoilpeak.com/?page_id=51
Im interested in the rate of price increase
It seems we are on the same upward slope & rate of increase as 2008, at roughly the same time of year.
I am surprised there is so little coverage of this in the MSM
Last time Brent broke before WTI, and this time Brent is leading WTI
Should we start a betting pool to wager what the price peak will be this time, and when it will hit?
Getting right back on the horse after you fall off.
Past Oildrum forecasts being wrong about the peak, going right back with a new forecast (guestimate) of sharp declines in world oil production in 2013-2015. ten million barrel per day drop over 2 years. then start losing 6 million barrels per day per day per year starting in 2017.
I forecast 0-2% annual growth per year, with an average of 1% growth past 2020.
Oil production growth mainly from Iraq, Brazil, Kazakhstan, Canada. crude, condensate, and NGL production world production of 90+ million barrels per day in 2020.
There will also be substantial growth from oil shale not just in the Bakken and north Dakota but other similar formations in the US, Canada, China, Australia and other countries.
Advanced nuclear fission (factory mass produced reactors like China's pebble bed and Russia's breeder) and forms of nuclear fusions could also have breakthroughs.
Butane and propane and ethane are worthless in terms of moving the world, since the life blood is diesel fuel. Besides including all these faux oils in the new goalpost (moving goalpost) for oil production you are making a mockery of sound science.
Tell me about crude oil. Then talk about falling off of a horse.
Thanks for playing though.
All the fuels you quote have higher energy densities per pound than diesel and are hardly "worthless" in terms of "moving the world", whatever that phrase means in reality as opposed to hyperbole. Your post is nothing but one hyperbolic, not to mention clichéd phrase after another, culminating in a phrase more apt for a Sunday game of soccer than a debate about energy.
The simple test of how worthwhile a gallon of propane is should be embedded in the price and I hardly think you believe it so worthless that you would personally supply a small fleet of 24' trucks with propane anywhere around the price of "worthless". This fleet may not move the world, but it does move a lot of furniture all over Southern California.
Just for completeness then. Please post here the actual percentage of trucks in the current world we live in that use propane relative to the ones using diesel fuel.
Thanks for the theory.
Now lets get down to the practice of dealing with REALITY for the 99.999% of things moving around the world!
Your move, mate. LOL. But the soccer thing was interesting to bring up ;-)
Did you notice that I was using the same fuels as Gail's estimate?
As for ctude. Crude had a new peak in January, 2011
Crude was at a peak in January.
Are you saying there is tons of new oil?
Or are we statistically the same as we have been for say like 6 years now. LOL
Cause I honestly do not read the tea leaves on oil. You need real growth in supply and 5-6 years of zero growth means nada to me.
Having a "new peak" doesn't fix the basic picture, that oil production is not rising fast enough to keep oil prices down and continue business as usual. If you can't see the "new peak" on my graph, perhaps it doesn't mean a whole lot.
As I see it, it is quite possible that we will add a bit more production until we hit financial problems. It is possible that we will just have another recession (with a dip in output/prices/demand), but it could be a permanent recession, at least for some countries with severe financial problems.
Who cares about peaks? The issue is production increments. Either we raise production, or we don't. If we don't, our growth based economical model will not work. End of BAU as we know it. Anyone here who belives we can grow oil production 1% per year (for example) for any period of time in the future? I know Nordic Mist is somewere in that terriotry. I am not.
Not so fast.
The fact is that some propane and butane is used for transport. butane is blended into winter grade gasoline, and is also mixed with propane to make Liquified Petroluem Gas (LPG) which is automotive propane, or "autogas"
There are actually 13 million LPG vehicles in use around the world - this is, admittedly,a drop in the bucket of world cars, but they are there, and they are using this fuel.
http://lpgaustralia.com.au/site/
What is probably appropriate is to include the amount of propane and butane that is being used for automotive use in the graph.
Propane and butane are sourced from both petroleum refining and NG processing.
Sure 13 million but how many cars and trucks are there on the planet.
I get 806 million cars and light trucks (2007).
1.6%
But of course the real stat is miles and gallons of fuel used.
How much crude is used for things for which propane, butane & ethane could substitute, like petrochemical feedstock?
BTW, when you forecast growth when do you start the linear fit from 2001 from 2004 from 2010?
Cause Gail shows it is 0.2% growth since about 2001.
Why do I need to subscribe to your forecast when reality said 0.2% the last say 10 years?
You can't just make an assertion like that without some kind of analysis math to back it up!
What does that have to do with oil?
Gail has no math to back up her guestimate of a collapse. She just has some intuition about higher decline rates. Ace and others had math analysis of charts and were completely wrong.
I think that oil shale from the Bakken and horizontal multistage drilling will add 2-3 million barrels of oil per day by 2020. 1 million from North Dakota (350,000 barrels already). This process will or is being used in Texas, Canada, Australia, China and other places.
I think that Iraq will add 4-6 million barrels of oil per day by 2020.
I think that Canada will add 2 million barrels of oil per day by 2020.
I think Brazil and Kazakhstan will add oil.
I think declines will be offset with more enhanced drilling techniques. CO2, water, natural gas injections and better imaging and computational well analysis to recover oil locked in older fields.
I think that Petrobanks THAI process will prove out by 2015 with 100,000 barrels per day and will be fairly well proven by 2012-2013. This will get them other deals to work with other operators.
I think that Libya will get back into production before 2015 (one way or another).
Your Panglossian view is lacking mention of nanoreporters.
"Excellently observed, but let us cultivate our garden."
Well, you can try my models on for size. I still assert you have no math, and it is not a valid argument to misdirect the lack on your own ability onto your opponents.
... lots of opinions, yet no math or links to a deeper analysis, unless you are trying to be sarcastic.
Question to anyone other than WHT
Has he ever produced a chart for Brazil?
Has he ever produced a chart for Nigeria?
Has he ever produced a chart for Russia?
Has he ever produced a chart for Iraq?
How accurate have they been?
I am a non-stop machine when it comes to innovative analysis, my friend. You do not realize MNFTIU.
To figure this out, all you have to do is look down-thread right about here: http://www.theoildrum.com/node/7831#comment-799587
For the rest of the evidence, check out The Oil ConunDrum
I must really get under your skin for the amount of math irritation I cause you :)
WHT
By now everyone who reads the Oil Drum has realized that you can only predict countries going into decline 10 years after the fact.
Kind've like the old joke that economists have predicted 9 of the last 5 recessions.
A weather forecaster is allowed to make multiple predictions of a forthcoming front. A lot of good that would do to fix it to one official forecast.
This is closer to weather forecasting than to economics.
Actually a few of us who really outgrew that prophecy groping quite a few years back see WHTs plots as excellent ways to organize what can otherwise be very disparate material into a manageable framework which we use to 'dead reckon' our own guesses forward. Had to use that term because it so aggravates WHT--but of course he probably has figured by now that some of use terms with a bit of poetic license now and again. In this case 'dead reckoning' would encompass most every behavior Nate tried to quantify in his post grad work and much, much more.
We always have the simplicity of the export land model, but the workings under the skin are what are really intriguing--for some of us anyway.
that of course is the gospel according to Luke ?- )
You have that right, I do have a bias against the use of heuristics. Nate claims that people have an innate feel for how things will unfold without resorting to any kind of theory. This is analogous to being able to catch a thrown ball based on subliminally adjusting for the arc.
We have plenty of room for different mental models, and room to argue as well.
If you want to put your predictions up for world oil production, I am willing to bet you and/or Gail on what world production will be in 2015, 2016, 2017, 2018, 2019 and 2020.
We can do earlier years too but there may not be much difference in the predictions and actual results and winners would be determined by things like what happens in Libya or if other geopolitics etc...
I am winning my uranium and nuclear generation bets with Michael Dittmar.
http://nextbigfuture.com/2011/05/official-confirmation-that-i-won-three....
You are over relying on math which is not actually accurate for predictions.
I am willing to up numbers and we have to specify the information reporting source that will be used to put out the official numbers. We also have to specify the type of fuels that we are predicting.
I am also willing to have money on the line for the bets.
Refer to the crackpot index: "10 points for offering prize money to anyone who proves and/or finds any flaws in your theory. "
Hmmm ... math is numbers, predictions are quantitative, quantities are expressed as numbers, therefore predictions are based on math.
"20 points for talking about how great your theory is, but never actually explaining it."
If you want to avoid the crackpot handle, I would suggest you lay the whole thing out first.
I have already said there is no theory. I have looked at the countries and projects and made a personal judgement about what I think will happen. I think my assessment is good enough to beat your models and Gails guess.
So do you believe your math and theories enough to risk a bet or not ?
There is no crackpot theory because there is no theory
I just have fairly thorough observation of all of the major countries and projects and new recovery technology.
So do you believe your own koolaid enough to put money or even a monetary bet ?
Despite the appearance of your web site, you have Luddite tendencies. I use the same math to do all sorts of innovative analysis, including characterization of PV semiconductors and of the entropy of renewable energy. It just amazes me that a would-be technologist such as yourself has so little awareness of his environment.
Sorry buddy, look for another shill, as I feel ill just looking at the huckster ads that you link to.
BTW, I don't know the difference between money and monetary bet.
So the president of the US says to WHT, we need to secure oil imports and need to know how much oil Brazil, Nigeria, Kuwait, Mexico will produce over the next ten years. Will they be able to fulfill their contractual obligations?
WHT says "My dispersive crystal ball is a bit cloudy when it comes to country specifics"
In the future it is going to be very important for an importing country to know which countries will be reliable exporters.
Since world production is made up of countries, if you cannot do production graphs of individual countries then your input is of little use.
I would like to thank you for giving me a chance to plug the best book written on oil depletion ever: The Oil ConunDrum. I have sections on depletion on individual countries or regions and also on reservoir sizes and reserve growth on regions and countries. At 750 pages, I tried to be pretty comprehensive in my arguments, but if I were to hit everything to the detail that you want me to, the book would be a lot bigger. I tend to try to explain each mathematical model that I present, but at some point you have to realize it is time to stop. The fact that I have stopped writing for the moment is probably a good impetus for you to start reading a little bit.
WHT
So you have FSU declining from now, falling by half by 2030, that is one to bet against you.
http://www.energyfiles.com/eurfsu/russia.html
Rumania peaked 30 years ago, I think most of us already knew that.
http://www.energyfiles.com/eurfsu/romania.html
No Brazil forecast, nor Sudan, Iraq, Angola, Kazakhstan, Brazil, China , India or any other country that counts.
Clearly you do not have the integrity to put your maths on the line.
Thanks for continuing to promote my rich collection of modeling approaches. If people have an interest in the techniques that I describe, it can open up a world of analysis opportunities.
And thank you for exposing links to data hustlers that have you pay through-the-nose to predictions based on who-knows what kind of heuristics and suckers bets.
I noticed that you have not mentioned anything about what I believe to be your own territory, the UK. (The only English-speakers who call it "maths" are not from the USA) Tough to be on the oil decline curve that I predicted within a gnat's eyelash.
You do not have any modeling approaches, other than for countries which have passed peak several years ago.
The UK, when did you predict that in 2005, it was already done by men far far better and honorable than you.
http://www.btinternet.com/~nlpwessex/Documents/moneyprogrammeoil.htm
Money Programme, BBC Two, 26 March 2003, 7.30pm
"Geologist Dr Colin Campbell predicted a decline in the North Sea several years ago and claims by 2015 Britain may have to import over half its oil needs."
I will go with the "suckers" who have produced pretty accurate forecasts for individual countries, which is better than the sweet fanny Adams you have done.
Scientific integrity is important in all fields, you do a great deal of damage to the task of informing people with your deliberate obfuscation.
Au contraire. It really must annoy you to no end that I have a deep knowledge of every fallacious argument used in these kinds of discussions and won't fall for any of them. My stuff stands on its own and speaks for itself.
You evidently have opened up my book otherwise you wouldn't know that I used examples of Romania and elsewhere. Yet you can't find one detail that is wrong in the mathematical modeling. Or you are afraid to bring up some weak attempt at a criticism, knowing full well that I would come back strong. Instead you keep on using the argument of continuously suggesting a burden of proof lays at my feet. I am comfortable having developed a burden of proof (covering 750 pages). I don't have to knuckle down to your fallacious arguments of trying to move the goalposts and continuously raising the bar which is essentially the path to demanding impossible perfection. I know that the moment that I respond to a request to do this or that country, you will just pick another country. Everyone knows what kind of argument that is, and it is definitely not scientific.
WHT
Real scientists such as Kjell Aklett, Colin Campbell and others had the integrity and guts to produce production graphs of countries which they believed were going to peak in the near future.
They had the courage to put their theories and calculations up for real scrutiny that is why they are known within and without this field of study.
You on the other hand will not do so and are losing credibility by the day.
Please continue any topic-related discussion without personal attacks.
Best to all,
Kate
jaz, please listen to Kate.
I am not responding to you with ad hominens as I continue to hope that some bit of valid criticism comes out of the discussion.
WHT
You have called analysis by Gail and others ridiculous and futile, so I do not need any lessons in etiquette from you.
http://www.theoildrum.com/node/7258
You ridiculed my peak oil prediction of 2012 to 2018 even though I explained, that a more accurate prediction is really impossible. Due to the wide range of uncertainties in many oil producing countries, such as the division of Sudan.
http://www.sudantribune.com/Resolve-Abyei-crisis-peacefully,38827
Political infighting In Mexico, etc, etc.
http://af.reuters.com/article/energyOilNews/idAFN3027513520101130
What do we find, you dismiss valid questions about rates of oil production in the countries which are of absolute importance to this issue.
So when you call people who understand political considerations better than you, ridiculous and futile, the gloves are off.
I will hound you for these vital country graphs until I get them, if not then I will achieve one thing and that is to make you respect other peoples knowledge and analysis.
Especially when you are obviously clueless about matters which impact oil production just as much as barrels found in the ground.
Whatever.
Whatever
Looks like teaching you manners is going to be hard work.
Look what I found.
http://mobjectivist.blogspot.com/2005/11/fsu-oil-shock-model.html
No wonder you do not want to do any more graphs if this is how badly wrong you are shown up to be when you try.
Russia should be in steep decline according to your graph.
That is based completely on discovery data input.
I meant both of you. You both have a lot to contribute, but the arguments become distracting when personal attacks dilute them.
Thanks,
Kate
he started it :-)
*Deep sigh. Walks away from playground :}*
Typo.. meant to say non-monetary bet
I think it got changed from my Android phone as I typed.
It seems that $100+ for a barrel of oil is an awfully strong incentive to keep finding ways to keep production up. Does it make sense to forecast production years into the future, without simultaneously forecasting what the macro economic conditions are?
Eg, from what I understand China is heavily subsidizing internal fuel costs. That's not that hard to do when you have a couple trillion in foreign reserves. But those reserves also won't last forever, especially at high levels of subsidization. So perhaps it's just as important to identify the slush funds of excess cash out there, and see how they relate to maintaining current consumption at current-like prices.
Just a thought...
You are 100% correct; we have to use macroeconomic forecasts to predict the demand for oil. For the supply of oil, macroeconomics makes a big difference too; especially important is the availability of financial capital to drill and develop oil. Even for exploration, macroeconomics makes a huge difference.
Having said all that, the price of oil is a microeconomic question because it refers to only one commodity, though "oil" has a lot of variations as to light vs. heavy, sour vs. low-sulfer, and location (transportation costs).
Weeping Willow
The main subsidies are in the big oil exporting countries, such as Saudi Arabia, Iran, Iraq, Russia and Venezuela. The higher oil prices the more they can afford to subsidize, Saudi Arabia earns 4 times more than it did 10 years ago.
China reduced subsidies in 2008 and total subsidy compared to GDP is very low and goes mainly to farmers and fisherman, since they feed the nation, one may argue it is a good subsidy.
http://climatecommercial.wordpress.com/2010/09/29/understanding-chinas-f...
Nonsense. The gasoline prices in Russia are at near US levels but people's wages are several times less. As soon as the government tried to cap them in the last few weeks, the refiners sent their product abroad causing major shortages. If only Russian consumers could see Saudi or Venezuelan prices, but they can dream of democracy some day.
What is Nonsense? Can you read?
Russia capped retail fuel prices in February,
If that is not a subsidy what is?
http://www.roubini.com/affiliate/google-news/6ff7ed7258d020eefb76a0acbad...
As I said, the main countries you will find subsidies is in the main exporting countries.
Subsidies to heat, electricity and gas in Russia have lead to inefficient usage but have also aided poor households by maintaining affordable energy supplies in cold regions.
The OECD analysis described in Section 3.2.1 suggests that the suppression of subsidies would lead in 2020 to extra government revenues equal to almost 6% of GDP in Russia,
http://www.iea.org/weo/docs/G20_Subsidy_Joint_Report.pdf
Do some reading will help you
You don't have to go to an oil exporting country we subsidize diesel generated electrical generation cost right here in Alaska, an oil exporting state. Village scale power generation--where bulk fuel delivery can only come by barge, which for most of rural Alaska means during the ice free season, and in many cases the extremely short season the rivers are high enough to float barges--is extremely expensive. If you don't get enough on the barge welllll
can carry
depending on the plane and configuration 2000-5000 gallons a trip--now you are talking some high priced diesel
So the state uses a bit of its oil revenue to subsidize offroad villages some
Fledgling efforts to bring more renewable energy online in rural AK are also being funded, better late than never...maybe.
No doubt that is an expensive way to get fuel!
When I was in Alaska last year I was amazed to find that that business existed, but, given that some communities are fly in only it makes sense - in a strange kind of way. When I visited the Cold Climate Housing Research Centre at Fairbanks they told me all about a housing project at Anaktuvik Pass, where everything gets flown in, of course. including fuel for atv's, and the atv 's themselves. Seemed like an ideal place for wind turbines and then battery electric atv's, but they hadn;t done that. They were looking at doing some wind turbines, and this company has done a few up there;
http://www.northernpower.com/
I think this is just the right size for town projects - small enough to easily be built and maintained, and not out of scale with the town. The big ones are just - too big - they are the modern equivalent of the baron's castle dominating the town.
No doubt Alaska is way behind the curve on wind. That is just starting to change.
Of course my wife's home town might have been a bit too far ahead of the curve. The first 100 mph blow took their brand new windmill (Danish I think) out to sea...getting close onto forty years ago now. Lucky it didn't hit the school and kill a bunch of kids--though I think it actually blew out at night. I guess the sails didn't feather and lock down like they said they would. It blows pretty good out on that long penninsula.
The whole village situation is a tough one to parse out, and I don't want start into it here. I just threw that post out there too backup Jaz point plus I thought it would be cool to post a shot of a working Curits-Wright C-46. It was quite the bonus when the three picture slide show all came along ?- )
Guantanomo is a good example: They have a single wind turbine which provides about 1/3 of their power. It saves a lot of diesel fuel and is extremely cost effective.
Another excellent analysis by Gail. Large quantities of credible data backing up entirely plausible projections and presented in a very accessible and readable format. That is a rare skill and I greatly appreciate all of Gail's tireless efforts.
How extremely sad, by contrast, that the conversations on this site seem to have been reduced to the altogether superficial and fatuous sounding proclamation that "predictions are worthless".
I think this excerpt sums it up nicely:
While I can understand the desire to avoid discussions of the fifth type, the tendency on this site to attempt stuffing ALL discussions into the first type, and then dismiss them as "worthless" if they don't meet some entirely arbitrary measure of accuracy is myopic and counterproductive.
Cheers,
Jerry
Seconded.
Gail, thanks. Valuable work.
The fundamental purpose of a model is to answer a question, presumably more readily than via empirical observation (which are often difficult for a host of obvious reasons).
Whether a model is "good enough" or a prediction holds value is a function of the question asked. All models have errors; some are useful anyway.
When dealing with oil, production estimation curves are intrinsically coupled to a price curve, in their eternal dance of supply and demand. Therefore, for any prediction of production, there must be an assumption of demand, and a matching price.
But price tolerance of demand is also a function of currency, inflation, economic outlook, and a lot of other factors. Therefore production must be as well.
Personally, I think that in an uncertain world, demanding precise predictions is foolish, demanding accurate predictions is unrealistic, and electing to remain flexible and keep personal options open seems prudent. Think in terms of probabilities instead of certainties, and available models will provide more value.
I'm puzzled why the Oil Drum which is knowledgeable about the oil industry confuses Crude and Condensate production with all liquids production. As figure 1 shows, crude and condensate production is still relatively flat with 2005. No real news here.
I think they are both pretty clear from the graph. That is why I showed both.
gthompson
If C&C have been flat since 2005 what are the 100 million extra vehicles on the roads using.
http://www.freepatentsonline.com/article/Indian-Journal-Economics-Busine...
Perhaps total liquids are not as useless as some people think.
http://cr4re.com/charts/charts.html?Retail#category=Retail&chart=MilesDr...
Miles driven in the US have not declined that much.
I don't know. You tell me.
Well I am sure that higher mpg vehicles are part of the answer.
Also the increased use of bio diesel and bio ethanol is part of the answer.
The main answer has to be that total liquids is about 3 million barrels per day more than 2005.
http://www.eia.gov/cfapps/ipdbproject/iedindex3.cfm?tid=50&pid=53&aid=1&...
All over the world people are converting petrol cars to LPG and butane powered cars. One can imagine many conversions in developing countries are not registered so I would guess many more than these figures suggest.
http://belize1.com/BzLibrary/trust13.html
http://www.afdc.energy.gov/afdc/vehicles/propane.html
So total liquids is important and is being used by millions for transportation.
More prius, less SUVs?
"If C&C have been flat since 2005 what are the 100 million extra vehicles on the roads using. "
perhaps in poor countries people can't afford oil anymore. perhaps they are consuming less so we can drive more.
jukka
That is the case for a few poor countries but the main countries that have reduced oil consumption since 2005 are United States, Japan, Italy, Germany United Kingdom, France, Indonesia, Spain, Russia.
Many of the poorest countries have increased consumption, if only by a little. Such as Ethiopia, Ghana, Bangladesh, Ethiopia, Mozambique, Namibia.
http://www.eia.gov/cfapps/ipdbproject/IEDIndex3.cfm?tid=5&pid=5&aid=2
They will be sending aid to us soon. :-)
Oil use goes where the jobs go for two reasons:
1. Jobs use oil, directly and indirectly.
2. People without jobs can't afford products made with oil. (or if they are on unemployment insurance, they can afford only less oil.
As our jobs go to lower cost areas (meaning less oil-use areas, and perhaps more coal use), oil consumption goes along.
Yes and many of those poorer countries are rich in natural resources and due to China they will get high prices for these materials.
http://allafrica.com/stories/201010041203.html
In turn they can buy Chinese finished products and at $8,640 for a new car will use even more oil over the coming years.
http://www.reuters.com/article/2011/03/01/us-autoexports-china-idUSTRE72...
Nah. They will pretend to send us aid as a cover for sucking up our resources. A little trick they picked up from us...
Global oil production is one thing, but is really not the factor that is most relevant.
Oil Available for Export (OAE) is really what matters when it comes to pricing and meeting demand.
It matters not how much Saudi produces, but how much they have left for export after they supply domestic demand, for example.
It would be of great interest to see data on global OAE. I expect we may be beyond peak with that, but the data would be revealing.
Following are what we show for global net oil exports for 2002 to 2009 (oil exporters with net oil exports of 100,000 bpd or more in 2005, which account for 99% plus of global net oil exports).
Note that global net oil exports increased at about 5%/year from 2002 to 2005, and then we had flat to declining global net oil exports. I suspect that this inflection point was quite a shock to oil importing countries, especially developed oil importing countries. At a 5%/year rate of increase in global net exports, we would have had about 53 mbpd in net exports in 2008, versus the actual number of 45 mbpd.
Also shown are Chindia's combined net oil imports. The difference between the two is what I define as Available Net Oil Exports (ANE), i.e., global net oil exports not consumed by Chindia.
As you can see, ANE fell from 40.8 mbpd in 2005 to 35.7 mbpd in 2009. A plausible estimate is that ANE could be down to about 27 - 30 mbpd by 2015.
Global Net Oil Exports Less Chindia’s Combined Net Oil Imports = ANE (BP + Minor EIA data, mbpd, Total Petroleum Liquids):
2002: 39 - 3.5* = 35.5 (36)
2003: 42 - 4.0 = 38.0 (38)
2004: 45 - 5.1 = 39.9 (40)
2005: 46 - 5.2 = 40.8 (41)
2006: 46 - 5.5 = 40.5 (41)
2007: 45 - 6.1 = 38.9 (39)
2008: 45 - 6.6 = 38.4 (38)
2009: 43 - 7.3 = 35.7 (36)
*Chindia's combined net oil imports
This table shows the detailed data for 2005 to 2009:
http://i1095.photobucket.com/albums/i475/westexas/Slide3-1.jpg
Two articles:
Peak oil versus peak exports:
http://www.energybulletin.net/stories/2010-10-18/peak-oil-versus-peak-ex...
Egypt, a classic case of rapid net-export decline and a look at global net exports:
http://www.energybulletin.net/stories/2011-02-21/egypt-classic-case-rapi...
Gail,
I was enjoying reading your post and was delighted with your good overview until.... Until... I couldn't believe it!!! Not from you! You have a track record of good posts and then you put in a totally, insanely, ridiculous "Guestimate" for future oil production. Why? 2 years from now you will be looking as silly as ACE and have to stop posting on this site!
Producing enough oil for the needs of a growing population in the world is getting harder. But the reserves discovered in 2010 were at record levels! Exploration is ongoing at record place. Your crazy collapse is just not going to happen!!!
That isn't to say that oil prices won't stay high and there won't be great competition for supplies.
Oil production is far, far, far more likely to keep bobbling along upwards for the coming years rather than collapsing. Your guestimate is just so helpless.....
The point is that we can't expect a Hubbert Curve for the downslope. I purposely didn't give a very closeup of the numbers in the graph, because I am not forecasting any particular set of numbers--just that it is likely to be steeper than a Hubbert Curve. What we are actually likely to see is "above ground" factors, like financial problems and wars making a big difference. Also, some countries may do much better than others, (perhaps those with severe financial problems doing worst), so it is not clear that world oil supply tells us much about the situation in any particular country. For example, China may continue to do well for a while, while some of the debtor nations do badly.
So I don't think my forecast is at all the same as Ace's. In some ways, I think we will go as fast as we can, as long as we can, and then things will tend to fall apart all at once (although this will still not be straight down, because of the inertia in the system). I am not giving an exact date for the change, but it could start as soon as this summer, if financial systems start having major problems.
A related and quite important question Gail - when do you expect the global financial system to break apart?
See, I think that will happen before we are very far into the downslope. Past that point the above ground factors start to look very different. It's no longer can companies afford to invest, its centralised allocation of resources at the end of a gun barrel. It's nation to nation barter.
The game isn't the same post-peak.
In net terms I think its a positive for sustained production.
I don't really have the answer. It seems like some countries may default on their loans and find themselves less welcome in the international trade arena--perhaps being required to ship actual goods in return for purchases. I can see political uprisings that cause countries to break apart, similar to the changes in the USSR. The smaller parts now constituting the whole may find it harder to trade in the world markets, each with their own currencies. It is possible that both the Euro and Dollar will disappear as traded currencies.
LPG could help more than some people think, people are already converting old cars to butane and propane and cars like this new volvo will help.
http://www.volvoclub.org.uk/roadtests/bifuel_01on_roadtest.shtml
http://www.afdc.energy.gov/afdc/vehicles/propane_what_is.html
LPG prices are far below petrol.
http://www.whatprice.co.uk/petrol-prices/recent-lpg-prices.html
Here's ace's oil price prediction from 2009. Maybe you'd like to rephrase?
Well, I don't know. it seems to me the that the world is becoming much less linear with the end of cheap oil. We are close to peak - or in the peak, or however you want to call it.
Assessing the question of the decline rate in the next 20 years(or even 10) is almost impossible to me, all you can do is try to fit a bell curve with an ultimate reserve estimate assuming no above the ground constraints. That is not a forecast, that is a purely theoretical case.
Gail assumed that oil will decline faster than what a hubbert curve would predict. You can also say that the above the ground constraints will make the plateau real and therefore will enable having a stable production until 2020. You can also say that because we are all so addicted to oil prodction growth, a world war will start in 2015. All this makes sense to me.
Beyond plateau or peak there is nothing we can say. We criticize BAU forecasts, but we do the same for post peak prodcution, by forecating a production curve wich is much too regular to be real.
Moreover, we all know there is big uncertainties on the reserves. This may require a statistical analysis, but I have the feeling that TOD article conclusions are always "hard decline rate witin 3 years".
I predict this "guesstimate" will meet the same fate as ace's infamous "guesstimates" from 2-4 years ago.
One would think that with so many . . . embarrassing . . . calls on future oil production in the past, article writers at TOD would have learned by now to be a bit more cautious in making their projections. But it seems not, it appears to be fashionable here to show that we're just about to fall off a cliff. And when we don't fall off the cliff - no problem! Try again next year! And the year after that. And the year after that. And the ...
What's really sad is that many, many people around the world visit TOD regularly, regard this place as an authoritative source, and actually take these projections seriously!
Post your reality here. As far as I can tell oil production is a flat line for the last 10 years plus or minus noise, even though the price of oil went up as much as 4-5 to fold.
Either you get that or you don't.
But Academic complaints and whining about predictions of the exact beginning of crude oil decline is sort of not the big deal.
The big deal is "WHERE IS ALL THE NEW OIL"?
I have not seen anything earth shattering in the last 10 years. Post the reality that I was missing the last decade and I will follow you then.
If I posted where I thought all the new oil was going to come from in the next 10 years or so, nobody here would believe me. Whenever someone posts stuff about massive increases in production from Iraq, it gets scoffed at by most people here. I could show you projections showing at least 700K bpd from North Dakota within 5-10 years, maybe as much as a million bpd, and that too would get scoffed at. Remember when the USGS came out with its Bakken estimate in 2008 and someone here said it might be lucky to churn out 100-150K bpd, or thereabouts? That's what gets believed around here. When production from there turns out to be double that amount 3 years hence, and is still rising rapidly, it gets conveniently forgotten and/or the bar is raised and this time claims of 700K-1 million bpd get disbelieved. But lest we quibble over production estimates of a single oil play, I could tell you, and give you evidence, of dozens, maybe eventually more than a hundred, of similar plays all around the world, each of which will churn out anywhere from maybe 50K to as much as 2 million bpd, and that these will gradually be developed over the next 50-100 years. But if I tried that, I would really be scoffed at. I could then continue on and show you the 50 billion or so barrels of oil that have been discovered off the coast of Brazil, and that most of the coast of Brazil still has not been explored, and that this is good for another hundred or so years of oil with at least 4-5 million bpd, and maybe more, but that too, would get ridiculed. And so on, and so forth.
The reality here is, whenever someone gives evidence of large quantities of oil somewhere, and gives further evidence that it can be produced in large quantities at high rates, it gets shot down on this forum, for the simple reason that most people here don't want to believe it's possible. Few people here are "concerned" about peak oil, they're mostly concerned that we won't get peak oil any time soon.
absolutely right. Doomer opinions are a dime a dozen. What really matters is what the people with money value all that oil at. This is why oil has fallen from $70 to 110 per barrel over the last 12 months. Producers clearly sense the impending glut and are pumping as fast as they can to maximize the cash flow. KSA should sell all their oil now, then buy back the cheap Brazilian stuff that will sell for $35/bbl for the next 100 years!
Seriously...plenty of picky metrics to argue about...but what fraction of our GDP will go to pay or our addiction? If more oil is being produced, great...a few people get wealthy. But the real story is the accessibilty of that oil based on my paycheck.
Abundance.Concept has a point about that chart. I usually battle hard with him, but in this case I have to agree that the profile is really suspect. It looks like it has a URR of like 1.6 to maybe 1.7 trillion barrels. And that is all liquids too! Unless that drop-off is due to some kind of demand destruction, I think it needs a re-evaluation, to put it mildly.
Yes, what I am talking about very much does involve demand destruction--people who cannot afford to pay for oil, or who live in areas whose financial systems are not in good enough condition to allow them to buy oil. It is not demand destruction from new electric cars.
Pretty please, with sugar on top, do not use the term "demand destruction" which was (I think) coined by Matt Simmmons. The term is hopelessly ambiguous, because it conflates two entirely different concepts:
1. The idea that quantity demanded will decrease as price increases, other things staying the same and
2. The idea that higher oil prices will tend to induce recession and hence lower total spending--a macroeconomic idea quite different from #1.
To the best of my knowledge, no economist uses the term "demand destruction."
It also hopelessly confuses the dynamics of the supply/demand curve: conservation versus efficiency and substitution.
There is a common assumption on TOD that increasing oil consumption is good, and that declining oil consumption is bad: I'd argue that the US's financial position has been substantially improved by it's 25% reduction in oil imports over the last 3 years.
that ambiguity is the whole point of using the term ?- )
Don,
Welcome back to TOD, the web site that serves as the official hot water springs for economists and frogs ;-)
I'm sure my fellow Brazilians, especially my friends at Petrobras, will be immensely pleased to hear that.
However perhaps we should revisit Dr. Albert Bartlett's lecture: Arithmetic, Population and Energy
Here he is talking about the vast reserves of coal in the US but we can apply the precautionary principle and draw parallels to oil recovery and production in those supposedly vast as yet to be discovered oil fields off the unexplored coast of Brazil.
abundance.concept,
I would be very interested in hearing more details on any facts/estimate that goes to the contrary on what is generally beleived here - that is a more or less imminent downslope in production/extraction rate of oil.
Well, maybe my intested it is more or less limited to "estimates" concerning next years (five or so). Beyond that, and maybe even before, anything could happen.
It's always nice to have visitors from Fantasy Island, where oil fields don't deplete.
Gail's guesstimate doesn't even posit a reason or scenario indicating why oil production would crash by 2021.
She could say that Russia will stop producing in 10 years even though there is about a 25 year supply or Saudi Arabia will dry up even though there is a 70 year supply or the North Sea will go bone dry even though production is expected to still be 60% of today's production of 3.33 mbpd.
The second 'cause' might be a worldwide Great Depression starting in 2014 caused by what? The utter bankruptcy of the USA? A humongous asset bubble in China? A war over the oil fields of MENA? Gail doesn't say.
More likely Gail is merely trying to provoke a hubbub here at TOD and drum up interest in the coming ASPO conferences.
World to end at 6 o'clock..news at 9!
My point was that in the Fantasy World in which many cornucopians dwell, it appears that oil fields don't deplete. As I have noted several times, post-peak, North Sea operators did a pretty good job. North Sea oil fields whose first full year of production was 1999 or later showed a production peak of about one mbpd in 2005, equivalent to about one-sixth of the 1999 peak production rate. These post-peak oil fields served to slow the 1999 to 2009 decline rate to about 5%/year (C+C).
Gail can discuss her own work, but globally it seems to me that we have offsetting trends: (1) Slowly rising unconventional production, which was not a material factor in the Lower 48 and North Sea peaks and (2) Globally, we are unlikely to see anything like the drilling density that we have seen in the Lower 48 (which showed about a 2%/year decline rate).
But of course, as I have occasionally opined, the real story is global net exports.
it's not that oil wells don't deplete,
but rather that the Planet never depletes because it is so huge
The Cornies believe we will keep finding newer resources that we didn't see were there before, like frackable gas rock
The new resources seem to take more and more energy to extract, so we get to higher and higher cost oil, and lower and lower EROEI.
needless to say, I was speaking with tongue in cheek :-)
Westexas, One question: Do you include Brazilian pre-salt as unconventional? How about Iraq oil? As far as I know they are both sweet and lovely....
Think about the financial system stopping working in the way it does now. That in itself would pay havoc with supplies. So would revolution or wars in several Middle Eastern countries. There are a lot of other bad results that one might expect, if we don't have the nearly unlimited energy from other sources that Hubbert assumed. He even thought we might be able to reverse combustion, and use it to create fuel (and get rid of CO2).
We are living in fantasy-land if we think that we can take a Hubbert Curve that is close to best-case scenario, and depend on it.
abundance.concept has a point this time. Her/his user name suggests the fantasy of abundance, but the plot shown is the type that has consistently discredited TOD, and this needs to be pointed out. I remember seeing plots in 2008 with 2011 production levels 10-20% below the 2008 peak. Bad guestimates discredit the source and make it harder to communicate to the public the fact that oil fields will deplete eventually.
Bad estimates are better than no forecast at all. Economists are wrong most of the time when it comes to calling a recession, but they continue to make estimates of future rates of GDP growth. Despite their lousey track record, economists are the "go to" guys and women when it comes to assessing both the current and the future state of the economy.
Gail is not an economist; she is an actuary. She understands data and the methodology of making numerical forecasts about the future, and finally, she is quite humble when it comes to making forecasts related to Peak Oil. I've never seen her make a mistake when it comes to handling numbers.
Bad estimates are better than no forecast at all. Economists are wrong most of the time when it comes to calling a recession, but they continue to make estimates of future rates of GDP growth. Despite their lousey track record, economists are the "go to" guys and women when it comes to assessing both the current and the future state of the economy.
"The other guys do it, too!"
Look closely at the prophecies in the Bible. Most of them turned out to be flat-out wrong, unless the prophecy was in general terms such as: "You will suffer terrible pain from doing evil."
Weather forecasters are imperfect, to put it mildly.
Market forecasters (whether stock, bond, or commodity) are notoriously wrong about half the time. Indeed for short-term market fluctuations, tossing a coin is as reliable as going by the record of even the most famous (or infamous) forecasters. Sometimes you can make a good forecast, as Gary Shiller did with his remarks about stock and real estate markets being overinflated due to irrational exuberance (I think he coined that term.), but even he was careful not to put a date on when the bubble will burst.
Keynes said: "The market can stay irrational for longer than you can remain solvent," or words to that effect.
These are decent analogies. These 'forecasts' are close to prophesies or to the gambling entertainment which is the main product of market forecasters. But there is a lot of content here at TOD that is much more serious than that. And mixing in forecasts that are nothing but guesses (based on hunches that it is going to get bad fast) decreases the impact of the serious parts. This is particularly true when these hunches that it is going to get bad fast have been the basis for many forecasts of environmental doom in a few years that have consistently been false (choose your favorite doomer/cornucopian bet over that past 30 years: Tierney-Simmons or Simon-Erlich or another). The result is a public that happily ignores the serious predictions that there are no resources to match growing global consumption in 20 to 50 years and that we are far behind in starting to address these problems.
Absolutely wrong.
Isiah 66: Jewish missionaries will travel around the MENA telling people about God.
Isiah 24: Humans will misshandle the earth, causing ecological collaps, followed by ecnomical and demographic collapse.
Revelation 9: An army of 200 000 000 will pillage the earth. Given 10 civilians for every soldier plus they must have an enemy to war against, this means a world population of at least 5 billions.
The Bible also predict the gospel will be preached to all people on earth. We are everywhere. Not all tribes are reached yet. If so, the world would come to an end (it is one of the final signs) but we are heading there.
The non belivers are going to shun the old morals and consider that to be a progress.
I could go on, but this is not the forum for theological discussions. Feel free to mail me if you wanna go into the details. My emailis in my bio.
My point is the Bible is so full of prophesys that are so specific and came true thosands of years later, your statement simply is not true.
And as a final excercise: check 5 Moses 28:64-68 If that is not an extremely specific prophesy that came true to the detail, then I don't know what is.
Sorry, Jedi, but my statement is literally true. Catalogue all the prophecies made in the Bible, not just a few. Note that it was prophesied that Jesus would return, ressurected in the flesh, shortly after he died.
Revelations was written by somebody named John who had probably been eating bread with ergot of rye in it, a substance similar to LSD.
Don
Revelation also predicted that the Jews coming out of all nations would reclaim their homeland, the fact that it happened should give pause for thought. Also it predicted that Iraq would become the richest place on earth, I wonder how rye makes you an oil geologist.
How much rye do I have to eat to know what the price of USD/GDP will be doing tomorrow?
It takes only a little bit of ergot of rye to induce hallucinations. Half a slice of ergoty bread should do the trick.
N.B. Iraq is a fairly poor nation, despite its oil reserves. Did the Bible predict that? And by the way, which Bible should we use: The good old Jewish Bible, the Catholic Bible, one of the Protestant Bibles or the Koran. They all have distinctive differences. Which one do you choose? And why that one?
Don
Has it not occurred to you that Iraq's oil fields are the least exploited in the Middle East, due to 30 years of war Iran/Iraq, then sanctions then civil war.
Thankfully the bombings are decreasing, http://www.iraqbodycount.org/database/
In five years time it will be the only country in the world which will be increasing production of light sweet crude. What will we pay for oil then?
http://www.bloomberg.com/news/2011-03-03/iraq-oil-exports-may-rise-to-13...
Iraq has a population of 30 million and will produce more oil and gas per head than any country in the world. This is no hallucination, it is real and happening as we watch.
Perhaps you are just afraid of the unknown? Just a thought.
Perhaps you are just afraid of the unknown? Just a thought
Fear of the unknown is what keeps the prophecy business alive and well. The more someone grasps at prophecy the more fear they are showing. Try thinking about that if you dare.
Good point, very good point.
This prophecy says two thirds of the world population will die from wars, famine and drought.
Could be a writer on the Oil Drum.
it predicted that Iraq would become the richest place on earth
Are you referring to the passages in Revelations?
Nick
I Will have to check, are you trying to get me to read my Bible? you are not a secret evangelist are you?
Going back quite a few years now I heard about peak oil, two opposing groups were saying very different things. One predicted peak (conventional) oil around 2010 the other not until 2030 at the earliest.
The first group also predicted that the North sea was about to peak, the second said not until 2007.
The first group were right, so at that point I started to take the first group more seriously.
I do nothing out of blind faith, I find out the facts for myself.
I treat everything with suspicion and ask all the difficult questions, most people dismiss peak oil.
The one thing they have in common is limited knowledge of the basic facts.
Firm opinions do not always go hand in hand with firm knowledge, often when people know more they let go of their once firmly held opinions.
"The Bible also predict the gospel will be preached to all people on earth. We are everywhere."
Ummmm, that would be what is called a self-fulfilling prophecy.
Yep, this reader didn't read the story - Jesus suffered both in hell and on the cross even though he did good - but that was probably because he challenged Caesar (which one?). Although if I recall, even the great orator Marcus Cicero (d. 43 B.C) was chopped up (his head?) for a particularly scathing speech.
If I recall hell in the bible is set on fire from anger (Deu 32:22) - a parable extensively used in the Star Wars saga, and a saying that makes sense.
The style of attacking (and mud-slinging or snow jobs or evasive non-answers) one another in speeches remains to this day in the adversarial style of debates in politics, especially American politics - and is very reminiscent of Roman politics. One can find Latin text (the language of the Romans) extensively in American coinage and U.S state and national seals (http://www.netstate.com/state_seals.htm), as well as a picture(s) of the Roman fasces on several of the United States state seals.
I'm a big fan of Latin and a Roman history buff. Those ancient Romans, at least some of them, wrote a lot better than Americans do nowadays.
The total amount of world oil production is all but irrelevant. What matters is how the pie is carved up.
As of 2008 the U.S. is already living in a post peak oil world. When we talk about where new oil is coming from, mostly it will be coming from "us" - Japan, the U.S. and western Europe, where our role in the new world order is to have the fat carved out of our societies to free up energy for Asian consumption. Thus we will continue to see ongoing economic stagnation and the slow death of the middle class (at least in the U.S.), and that process will enable ongoing rapid economic growth in China.
This process could go on for several decades before China finally joins the post peak oil world. Not that they can't have a recession too, but that growth is still possible for them as western civilization goes into relative economic decline.
Abundance,
You definitely provide a counter opinion around here and I appreciate that. I actually think you raise some good points that people should consider. However, you also seem to love picking apart the forecasts of others which I find to be very lame. Therefore, can we hold you to the North Dakota forecast of 700K to 1 million BPD in the next 5 to 10 years? This is a great forecast to track, because unlike worldwide production, North Dakota does an fantastic job of keeping track of their production.
The North Dakota Industrial Commission, Oil and Gas Division has an awesome website. I wish Texas had something even close to this. They show monthly production numbers for North Dakota going back to 1951 in a tabular form. This table also includes the number of wells and it is easy to find on their website.
The production increase from North Dakota has been exponential for the last 3 or 4 years. In January 2007 it was 115,027.5 BPD. (I told you they have awesome data.) In November 2010 it shows a peak of 357,036 BPD. Since November it has actually declined some. Does this mean the sweet spot of the Bakken has just now been drilled up? I do not know, but I plan to keep track so I can pick apart your forecast if it turns out wrong.
I might have to eat my words. I asked someone about the play today and he said this had been a really bad winter and that was probably the reason for the drop. Furthermore, he has heard that by 2015 the target might be as high as 1.5 million BPD. Now this seems like a super high number, but it does make the 700K BPD or 1.0 million BPD seem more reasonable. I do not know as I am not involved in the play, but based on what they have done over the last four years I do not totally discount it.
Iraq, Brazil, West Africa, USA, China.... 2010 saw RECORD discoveries of reserves... All time high!
Nordic - where can I find the data supporting your assertion of record discoveries in 2010?
I was curious too so I did a quick search on the web. Not definitive, but here are my thoughts:
Russia, 5.5 Gb
http://en.rian.ru/russia/20101225/161929803.html
Iraq, 28.1 Gb
http://www.bloomberg.com/news/2010-10-04/iraq-lifts-oil-reserves-estimat...
Brazil, 1.1 Gb
http://en.mercopress.com/2011/02/18/brazil-s-proven-oil-reserves-increas...
West Africa 7.7 Gb (I feel pretty dubious about this, the addition may not be 2010)
http://www.aapg.org/explorer/2010/02feb/regions_africa.cfm
I didn't poke around for the US, but gains in the L48 have been largely offset by a downward revision in Alaska, I believe. Net adds to reserves are going to be less than for Brazil, for example. I see little evidence that China added to its domestic reserve base, instead focusing on it's 'strategic reserve', or positions in reserves around the world.
The big number, plainly, is in Iraq's restatement. This restatement should be viewed in the context both of Middle East nationalism and the quota jockeying OPEC nations engage in. But, perhaps, it's on the mark. Maybe we added 40 Gb of reserves from these areas, but the large contribution of Iraq to that value should give serious analysts pause.
Just my 2 cents...
http://energydeals.wordpress.com/2010/10/31/brazil-deepwater-well-hits-h...
The Brazilian government has found up to 15bn barrels of oil in a deep-water field known as Libra, in a further indication of potentially enormous reserves contained in the so-called pre-salt region first discovered in 2007.
If confirmed, the Libra field alone could more than double the size of Brazil’s current proven reserves of about 14bn barrels of oil and natural gas equivalent.
No figure has yet been put on the entire pre-salt region, so called because its oil is trapped beneath several kilometres of seawater, rock and a hard-to-penetrate layer of salt. But people in the industry say it could contain 100bn barrels or more, enough by some measures to put Brazil on a par with Kuwait or Russia among oil producers.
The ANP, the industry regulator, said the Libra field contained between 3.7bn and 15bn barrels of oil, with 7.9bn being the best estimate according to a study commissioned from Gaffney, Cline and Associates, an advisory firm.
Haven't checked if this has been "booked" in 2010 or whether Libra will be booked in 2011 ++ ....
There are some caveats to consider when reading about new "oil" discoveries. It is common practice to estimate oil-in-place which is considerably higher than the ultimately recoverable resource. What they report as "oil," is usually some unspecified mixture of crude oil and natural gas. These reporting techniques are used to artificially inflate the size of the discovery.
Wow! So, we're finally going to reverse the trend in this graph that has been bandied around here and by people like Roscoe Bartlett and most recently, Jeremy Grantham!
Whew, thats a relief!
Alan from the islands
Thanks for the reminder Alan. What would be even more telling would be a production line showing net rate less that coming from fields older longer than. let's say, 10 years. Consider just backing out the KSA older production and the current rate would almost half of what your chart shows. That would be a better graphic repesentation of how little our new oil discoveries are adding to the total global rate. And then when you consider some of the biggest recent gains have been from Deep Water fields which will have just a small fraction of field life as those onshore biggies. The only "sustainable" new production I can envision is from the tar sands.
You keep saying that, but I recall seeing a curve posted here (maybe by WHT?) which showed those discoveries to be a modest blip in the curve -- record only over scale of a few years, not compared to the huge fields of the early decades. And still, those fields total add only a few years onto world consumption.
When we have a few years of routinely growing reserves based on new finds and new technologies I will worry a bit less -- the end-game will never be in doubt, only which decade takes the worst of the hit.
Edit: The diagram I recall was pasted above, but it doesn't show the 2010 contribution. Deniers say that 2010 yielded 50Bbbl discovered, but without much justification or consideration of the locations, ability to produce at a meaningful rate, and so forth. Still, each such discover helps with the eventual transition, but again, the game remains the same.
Indeed, discoveries are highly influenced by big reservoir finds since reservoir size distributions have extremely fat-tails. Here is a typical Monte Carlo draw for discoveries and the oil production profile:

Not that a couple of large finds of 50 GB in a few of the out years don't put a dent on the overall production profile. Fluctuations in discoveries year-to-year are entirely natural, and no one should get to wedded to the idea that spikes in discoveries have any real meaning, other than they track a statistical counting model.
One thing I'd really like to see superimposed on that graph is the historical & projected growth in world population. Or to put it another way, a graph showing the amount of oil available per human being. It might help add some perspective.
This graph is what most "don't worry, be happy" drones completely fail to grasp. This universe is governed by conservation of mass-energy and the decline of the integrated total volume of oil discovered translates directly into production decline aka peak oil.
Of course the BAU believers also skew facts in that they claim the maximal amount for every discovery. Like the alleged 50 billion barrels in the Brazilian offshore deposits. Upper bound guesstimates are typically not indicative of the actual amount that can be produced. Anybody recall what happened to that 10 billion barrels allegedly discovered in the Gulf of Mexico several years ago?
I don't know what happened but I think it was called Jack 2?
"What's really sad is that many, many people around the world visit TOD regularly, regard this place as an authoritative source, and actually take these projections seriously!"
Then they need to learn what guesstimate means. The definition of an authorative source is that what you state as fact is correct.
Seconded. Keep up the good work Gail.
Adding a few more oil wells isn't going to change the eventual graph slope, nor human behaviour. It's also not going to improve anything in the short term for the countries already driven to poverty, debt and starvation. If anything, it will make things worse as it will reinforce the "we will be saved at the last minute" mentality.
Peak Oil is not a "theory" or a "projection".
It is a mathematical necessity.
Continued depletion of a finite resource invariably leads to peaking and ultimately extinguishing of the resource.
The Cornucopians merely play games of word swap and fear mongering.
It's no longer called "crude plus condensates" but rather total "liquids" because the Cornucopians know that the former has peaked. So they change the game and the name in midstream.
The Cornucopians know that we TODders can be befuddled by failing to pinpoint the very split nanosecond in which the oil peaked and therefore they call us out on that inconsequential hook point. Time and again we fall for that meaningless bait and hook trick.
Eh, I figure that people are desperate to show increasing production.
I do find charts like the one at the top very annoying, however. The lack of visible tics on the late side of the graph makes it very difficult to be sure about where the endpoint is and what the actual slope is at the end. The human eye is very easy to fool and the shape of the curve is subtle.
In the value neutral, broad sense of the term. But the term is irrevocably soiled by doomerism; it is understood to mean a peak in oil production leading to the end of industrial civilization.
Near term peak and inexhorable 1-2%/year oil decline rates is what I hope for; I would ascribe better outcomes, both environmental and economic, to slow decline than continued supply increases.
20%/year oil decline rates would be a disaster; mad max style.
Both kinds of scenario technically fit under the umbrella of peak oil.
It's tainted by doomerism because there is basically no acknowledgment of peak oil by the government and media. If there are peak oil stories in the media they are treated in a boutique and fringe way. So there is zero action on re-gearing industrial civilization to other energy sources. Waiting for the oil price to send the right market signal is idiotic for the simple reason that the market is not aware that there is a problem. It would take 20 years and multi-trillion investments for the USA alone to re-gear. Doing this in a hurry under shortage conditions is clearly certifiable.
Shutting down EIA --that is the acknowledgement
switch over to this nonBeat: Putting on Blinders - the EIA Budget cuts
And we all know that hope soils terminology much less than does "doomerism."
I think so too. My guess: The plateu keeps hogging on for a good while, causing a string of resessions on the way. Then one day we decline below a critical point and we have problems maintaining the supply any more, in cunjuction with horizontal wells beeing water flooded and offshoe wells plugged, the graph goes south in an almost 90 degree bend. No money on when it will happen though.
I had that exact same thought - the "guesstimate" is going to be proved terribly wrong.
My alternative
Someone prodded that critics should provide an alternative to the guesstimate, so fine.
Why is the data from Oil Megaprojects wrong? It doesn't make any sense for people here to be making posts that contradict that. The projections have supply increasing until 2015, which is about the limit of predictability anyway. If I take the current projects in the world at face value, then depending on the price signal it seems that supply will stay the same or have a shallow upward slope for until at least mid 2010s, and then there is no valid argument to say that everything will stop in its tracks after then.
I mean, even if you assumed a 7% depletion rate for the entire world, then that will only put us at half by the time 2021 rolls around. That means that the "guesstimate" is somehow predicated on more pessimistic predictions than that. That is a streeeeeetch.
How do I think it will behave? Take historical production, just flip it horizontally and add it to the other side. We're at about the half-way point - we are the peak oil time. But new production is going to be continued to be delivered to market, and as the Middle East declines, more difficult areas like Africa and the Arctic will start shoring up new reserves to make up for the losses. Oh, there will be a LOT of pain in order to make this happen. Yes, I understand the geology of currently producing wells wants to bend that curve down, but the economy of the developing nations of the world wants more than anything to bend that curve up. It'll stay flat for a good long while.
The story of the 2000s was American involvement in Iraq. In the next decade or two, the story of Chinese involvement in African nations could take center stage. People won't stop chasing the oil. Until there's no more to be had, of course. And even then they'll still be chasing. They just won't get any more at an energy gain. At that point, finally they'll give up and make the direct heavy investment in the alternative energy sources that they're already effectively powered by.
The point is that the down slope cannot be expected to look like a Hubbert Curve. It will probably be steeper. We don't know the exact from. Limits to Growth talked about "overshoot and collapse" as being the general shape of they models they saw.
I am not saying that oil production will follow this particular curve, but that I would expect it to be irregular, and drop fairly steeply.
This is a very important point. The ramp up to peak was under low population and demand conditions. After the peak the demand and population will continue to grow for a long time (barring some doomsday scenario). So there will be intense pressure to produce fields faster. This will skew the curve to have more area under the period immediately after the peak, which will directly translate into a rapid decline at later times since the total area under the curve is fixed.
So the current plateau is not a sign of lots of oil and delayed peak. It is literally future production being moved forward to satisfy current demand at the expense of future demand. The decline in 10 to 20 years will likely be quite steep since there is no prospect of massive discoveries.
Dr. Bakhtiari's WOCAP model in "Oil & Gas Journal', April 26, 2004, pp.18-20 had 55 mb/d in 2020, so Gail's guesstimate is not too much out.
What we need to consider is the impact of export decline
http://www.crudeoilpeak.com/?page_id=1659
and peaking of sub systems. Whole empires can collapse:
4/10/2010
Russia's oil peak and the German reunification
http://www.crudeoilpeak.com/?p=1912
Here is a larger chart of world crude oil and condensates production from 2000 to January 2011 from EIA: International Energy Statistics: Petroleum. The old peak was 74.67 Mb/d, and the new one in January 2011 is 75.28 Mb/d. These numbers are frequently subject to downward revision. The annual average has exceeded 74 Mb/d suggesting crude oil producers have sustained production above the previous peaks.
I recall some forecasts a year or so back suggesting that we would see new highs by 2011, so I'm not surprised to see the 75 million barrel per day mark broken. What is at issue is the effort necessary to reach and sustain 80, 85, 90, and even 100 barrels per day. Nothing in the last ten years tells me that we are going to do that. Given the demands for oil from developing nations, the amounts of oil that exporting nations will hold back, and the uncertainty of financial conditions, I anticipate that the rate per person in developed nations (USA and Canada included) will continue to fall.
The fault lines will show first with the airlines; already fuel surcharges are showing up on international flights. Domestic flight charges are starting to creep up month by month. Look for a major carrier to go under in the next 12 months and for routes to be trimmed.
The fact is, so many commenters on TOD committed themselves to calling a peak for the 2005 and/or 2008 periods. It looks like, even for the narrow "crude & condensate" category, this peak has been well exceeded (i.e. by at least 500,000 barrels). The silence from the 2005/8 peaksters is deafening !
A couple of points. The ongoing contraction in EIA data collection efforts, combined with the very unusual recent revisions to C+C data, probably serve to remind us that the best that we can realistically expect for accurate data is accuracy to about 0.1 mbpd for country specific data and to about one mbpd globally (which would be two significant figures in most cases), which is what I used for net export data up thread. Also, note that the average C+C production for the US in the second half of 2005 was about 600,000 bpd below the average for the first half of 2005, because of the hurricanes. But there are always production problems somewhere, and the numbers are what the numbers are, but the fundamental question is why the very rapid increase in production from 2002 to 2005, versus basically flat to declining production from 2005 to 2010?
In other words, why did the EIA show annual production of 74 mbpd in 2010, and not 86 mbpd (which we would have shown at the 2002 to 2005 rate of increase)?
Regarding the EIA data, the monthly reported numbers are of course affected by changes in inventories and other factors like maintenance, and they are in any case subject to revision, generally (until recently) downward. I think that the average annual production and price numbers give us the best indication of fundamental supply & demand factors. The preliminary EIA data are showing 2010 to be basically flat with 2005, but in any case following is my standard C+C versus price data analysis (annual averages in both cases).
Note that despite slowly increasing unconventional production, total C+C production has still not exceeded the 2005 annual rate (by a material amount).
Global Crude Oil Production Versus US Oil Annual Spot Crude Prices (EIA, crude + condensate)
2002: 67 mbpd & $26
2003: 69 mbpd & $31
2004: 72 mbpd & $42
2005: 74 mbpd & $57
2006: 73 mbpd & $66
2007: 73 mbpd & $72
2008: 74 mbpd & $100
2009: 72 mbpd & $62
2010: 74 mbpd & $79
There was a clear price signal from 2002 to 2005, as oil prices rose from $26 to $57. In response, global crude oil production increased by about 7 mbpd, a 3%/year rate of increase. If global C+C production had continued increasing at this rate, global production in 2010 would have averaged 86 mbpd, but lets look at what actually happened.
Annual oil prices from 2006 to 2010 inclusive have all exceeded the $57 level, and four of the five years have shown year over year increases in annual oil prices. In response, global annual crude oil production has so far not materially exceeded the 2005 level, and in fact we have seen a cumulative shortfall between what we would have produced at the 2005 rate and what was actually produced.
So, we can "celebrate" a (revised) reported increase of about 300,000 bpd from the 2005 annual rate to the 2010 annual rate for global C+C, which realistically is within the margin of error, or we can focus on the far more important question of why we saw a shortfall of about 9 mbpd--between what we would have produced at the 2002 to 2005 rate of increase and what we actually produced.
Agreed. The oil price in early 2005 was $48/bbl. Since then the oil price has more than doubled and yet production still has not increased more than 1% from its previous record high.
Also, there are countless what-ifs regarding production. What if Iran had access to the best technology and management? What if Venezuela were not run by Chavez but by the oil majors? What if Iraq produced at its theoretical capacity? What if .....
Note that there is a 30 fold difference between what the 2005 to 2010 production increase would have been at the 2002 to 2005 rate of increase in C+C production (9 mbpd) and what the EIA is currently estimating as the 2005 to 2010 production increase (0.3 mbpd). Note that even with the revised 2010 data, we are still looking at a sizable cumulative shortfall--between what we would have produced at the 2005 annual rate and what we actually produced.
So, guess which number the Cornucopian Crowd is focusing on?
It's just a flesh wound!
http://www.youtube.com/watch?v=zKhEw7nD9C4
One day, Westexas, during the next five years the mainstream media are going to accept ELM, and you will become a famous "talking head," eagerly interviewed on TV and in print. I say within five years, because I think the price of oil will go above $175 within five years and (except for the depths of a Greater Depression) stay above that level.
Are you prepared for fame and noteriety?
I wouldn't count on it. I have been approached twice by producers for cable programs (on MSNBC & CNBC). In both cases, after I sent them some of our material on net exports, they said that they decided that they didn't need me "at the present time."
They will need you at the time that gasoline goes to $5, $6, or $7 per gallon. I'm willing to bet (a small amount) of money that I see you on national TV in the mainstream media within five years. Just think, I'll have known (on TOD) a bona fide celebrity!
I just hope that they don't film me--and other Peak Oilers--being chased by lynch mobs.
I just happened to skim by the McLaughlin Group the other day. Pat Buchanan was carefully tiptoeing around actually saying 'Peak Oil' while at the same time saying many of the oil companies and fields where at or past their production peaks, and that there was probably no going back to $3/gal gasoline.
I used to watch that show pretty regular all through George IIs years and never heard talk like that. Buchanan's tone and expression suggested he may very well get it.
Hersey!
(There is no other word for Buchanan's actions. And to think he almost became President of Butterfly-Ballot Florida. OMG)
?- )
Corrections (in bold):
*Approximately a billion and a half barrels of oil using the rounded off numbers
This is a bad chart, meant to deceive. You really have to place it on a zero'd baseline and extend the years back to the 20th century. I would suggest you read up on E.Tufte for some good hints on how to do charts.
WHT
I don't agree that you have to have a zero baseline. Given a more or less qualified viewer it might be better without that since such a construction would facilitate discerning recent trends.
Most of the criticisms leveled against oil depletion analysts is that they are merely "trendologists", who don't do anything with the data but linear extrapolation from the most recent trends. I would be curious to see someone describe the trends with an actual model other than some brain dead extrapolation.
Remember that noise consists of:
1. Garden-variety statistical counting fluctuations (always there)
2. Biases caused by counting the wrong kinds of liquids ( biofuel double-counting, etc)
3. Intentionally manipulated data from oil suppliers (check the suspicious up-and-down KSA spikes)
4. Missing data or errors in reporting
5. Real trends underneath the noise
There are ways of discerning the trends underneath the real data, but you do need to have multi-dimensional data to help sort it out. The first four noise parameters also largely disappear when you look at longer term trends.
I also realize that a lot of people are here only to discern trends so that they can make some money off of the futures market. To them, good luck, as it is almost as hopeless as figuring out day-to-day stock market returns.
No need for a zero baseline - this way makes small changes more visible. Ideal I guess would be to have smaller inset zero-baseline plot for reference.
Gail posted a zero baseline chart for world liquid fuels production at the top of this thread which hides the details. Mine is similar to the charts that Rembrandt created for the Oilwatch Monthlies that are so very useful to see what is happening with the global C+C production. I want to know how high world C+C increases during oil price shocks because that represents maximum world production at that instant. If the annual average sets a new record high, then that might be the all time peak production. I want to know how low the production decreases after the economy crashes from or in part from the oil price shock because that provides a clue for the frequency of oil price shocks.
WHT, I intend no deception in posting the chart. The readers of TOD are intelligent enough to read it correctly. The current EIA data show a new peak has been set. Keeping in mind that the data point for the peak in 2008 began at over 75 Mb/d and has been revised downward to currently 74.7, the more recent data must be viewed with caution. Since the February 2011 data point will probably decrease dramatically due to the disruption of Libyan supply, the annual average for 2010 will not rise much higher without upward revisions to the data. For all the time at the plateau, high price of crude oil and the money spent on getting production up, the world maximum production has barely budged upward. While indicating a sharp peak and steep decline are incorrect, the data still screams peak oil. My guess of a plateau roughly symmetric around the peak littered with oil price shocks as demand intersects maximum supply is still consistent with the data. Whether the plateau is 7, 14 or 20 years wide is irrelevant toward disproving peak oil because the peak will still look normal when viewing the entire world C+C production curve.
I continue to keep the rule that I learned here at TOD in mind when studying the data and making projections: one can not positively identify the peak until 5 years after the peak. With the long development times of offshore rigs, I wonder if the period should be increased a few years. With the accuracy of the data being a vague +-.5 Mb/d and with world C+C on an undulating plateau since mid 2004, one can not reasonably proclaim that the world has passed the peak yet. Maybe and maybe not....
I guess part of the problem is that the EIA does not keep data too far back in history; so by necessity you plotted only a few years worth. It looks like it goes back to 1994.
I agree with WHT. Poor chart making is a common problem. Every freshman should be required to complete Charts and Graphs 101.
However, I believe the real (potential for) deception is in the lack of separation of crude and condensate production on the chart. If condensate is not the energetic equivalent of crude, it should not be shown as equivalent when charting to show an increase in production. It's great to see this kind of comment, but should I not suspect that the barrels/day increase above the previous high was accomplished through increasing condensate production?
minnie - There's another good reason to keep the two separate IMHO. A generalization but still fairly accurate: crude and condensate tend to come from two distinct types of reservoirs. More importantly the development, timing and geographic locations vary significantly. Obviously crude come from oil reservoirs but more importantly from very old but long lived large fields with a second layer coming from new DW fields which won't have a lifetime anywhere close to the old Masters like Ghawar. The condensate/NGL typically come from NG reservoirs and, more importantly once again, from a different generation of discoveries. And increasing amount of liquids are coming from long known huge NG fields in the ME but were economic to develop for ages. In past days the NG would have been flared and the liquids recovered. But now the LNG export market is expanding leading to more liquids. But there are big NG fields with significant liquid yields outside the ME with many located in Asia. Thus the projection of future crude production/discovery is a very different animal than for condensate/NGL. Mixing the projection of two very different systems is of limited value at best IMHO. And at worst could be very misleading.
I have never liked the "Crude + Condensate" graphs. I want pure crude on my charts. Crude is what diesel and jet fuel are made of.
Agreed - do they report it separately?
I agree. I would like to see a plot of only crude oil, but where is the data? I would also like to see a stacked chart showing the production of the different grades of crude oil with monthly data points. We live in an imperfect world with imperfect data.
Are they counting processed tar sands production under C+C?
It is definitely not conventional production, but it is also pretty clearly crude oil equivalent once it's been processed.
Yes. It also includes synthetic crude oil produced from oil shale.
The EIA's definition of crude oil:
Rockman,
When I use the term "oil" with no qualifier, I mean crude + condensate. Should I change my usage of the term "oil" only to include crude?
I'm a writer and take words very seriously.
Don - I know...never have trouble undestanding what you're communicating. My was more of a generic statement not focused at you. I just wanted those who didn't understand that crude oil and condensate/NGL production are very different in dsitribution, and more importantly, rather diffeent future potentials IMHO. There may be a much bigger condensate/NGL potential then many of us realize. I'm sure there are known fields never developed for lack of market for the NG as well as many very large potential discoveries never even drilled for the same reason. Thank goodness for the LNG export market. I've heard there's one field in the Persian Gulf they had planned to flare 2 TCF of NG so they could recover 200+ million bbls of condenstate/NGL. Now they're exporting the LNG. What a waste that would have been.
Thank you.
Sailorman, I am certainly in the camp that would promote the use of terminology that is as transparent as possible. The changes that I complain that the EIA too swiftly adopted - the inclusion of more and more forms of petroleum hydrocarbons that were formerly produced in neglible amounts, that are now added to what was the "crude oil" baseline, now the "total liquids" baseline - are difficult for anyone to keep up with. So when I discuss these issues with the few who are willing and able, I take pains to use "bulletproof" terminology.
Thanks, Rockman, for this perspective. In my former life I logged open hole for Halliburton Energy (when Dick Cheney was running it.) I still remember thinking what a waste all those gas flares were, but if the economics aren't there, they aren't there. This condensate topic sounds like a good one for a future post.
minnie - You would under more than most the disgust I felt sitting on a rig off the coast of Equatorial Guinea watching them flare 25 million cf of NG from the processing ship. And at night I could see dozens of such flares along the Nigerian coast. Thank goodness they finally got an LNG plant there but it's only capturing some of the NG.
Too bad this does not help me. I live in an importing country, and exports are declining.
You could once again merge with Norway.
There is a joke that goes we should proclaim war with Norway, then surrender, forcing them to occupy us. Thus swaping our national debt with their oil state funds.
Sad thing is, Norway don't want us.
That does leave the old fashion reason for going to war still an option doesn't it? Fortunately not a very viable option at the moment.
Thanks for that link. Naive question: Where is Canada's tar sands production reported there? The EIA page breaks out categories: Crude oil including lease condensate, Natural gas plant liquids, other liquids, and refinery processing gain - none seem appropriate.
Thanks
Canada tar sands is part of crude oil, in EIA reporting.
Today’s discussion does have that “how many angels can dance on the head of a pin” quality. The trivial rise above past peaks is a problem only if one defends the arrival of peak oil, which has a definitive quantitative meaning. Consequently, this prediction can be wrong (by 0.2%). Defending the end of cheap oil is more defensible and implies essentially the same thing.
Still, the intellectual exercise of attempting quantitative analysis is the basis of critical analysis. This is why the attempt has value, even if predictions prove to be quantitatively wrong (oh, lets say by 3%). The predictions of the Oil Drum contributors certainly appear superior to those suggested by various “Authorities” (IEA, EIA, CERA and OPEC).
Sincere kudos to the staff, it seems quite clear you have changed the world.
One of the reasons for my moniker, "step back" is because too often I see people falling blindly into love with "the" number or "the" theory.
This drives them into a strange form of funnel vision, where they can no longer step back and see outside of the vortex they dove into in the first place.
Imagine a graph that has more than one plot on it; more than just Liquids versus Time.
2) Imagine that one of the other plots is "Risk of Source Cut Off" versus Time.
3) Imagine that another of the other plots is "EROEI" versus Time.
4) Imagine that yet another of the other plots is "Tons of CO2 and toxins accumulated in the atmosphere" versus Time.
When you step back and see these many plots all at once, you start seeing a bigger picture. You are no longer fooled by "the" one number.
Decline of high per capita users is key
I think this posting identifies one of the key points on how Peak Oil will play out and is related to the question of how things will unfold when substantial decline sets in.
If we take the fact that the US is one of the highest per capita users of oil and uses approximately 22 million barrels a day, then that is where a lot of the "growth" in supply will occur. What is likely to happen, indeed is already happening, is that living standards will continue to plumment along with per capita usage.
Given that demand in the rest of the world is so high, surely the system itself won't give in so easily while per capita consumption remains very high in other parts of the world. Therefore the system will throw up considerable force to reduce these anomalies and again this is happening and mentioned in the article, for example, by recession and jobs transfer
So lets suppose that what if over the next 5 years, US consumption dropped to circa 12 million barrels a day. Then straight off there is 10 millions barrels available for others. Now obviously since production is predicted to go down, even if it declines by say 5 million barrels a day over the same time period the above decline still leaves 5 more for servicing the demand growth of the rest of the world.
If we apply the same logic to some of the other high users although none would be as big net users as the USA, then on a global scale, this mechanism would tend to smooth out the disruptions from declines for a while. However I suspect at some point things won't go smoothly.
Terrence the problem with that statement is that *so far* people (US or otherwise) have been reducing the demand only as a response to the pricing pressure. In this kind of system you always operate at the 'optimal' supply/demand point. Meaning that kind of reduction will trigger a fall in prices which in turn lead to increase in demand till you get to optimal price point.
What I want to see is some analysis of the major consumers of oil & the respective distribution of wealth amongst them at capita level. My guess would be the personal consumption in the US will lose out to business consumption in developing world.
Good job Gail! It would be technically interesting to see how much of that production is going around in circles, like the naphtha used to make tar sands flow too.
I guess the take-home message is that increased price means increased divergence between the amount of oil people want to buy vs the amount of oil there is to sell them. At any price.
Oil supplies to an all-importing country are arranged not by state organisations, but by people in the offices of privately-owned oil companies. How much do they care if a country cannot afford to pay the going price, and gets none this round?
It would be interesting to see how that works in the real world. Do the big oil retailers have plans about how to distribute the available oil around their client nations once they have secured it at a given price? Do they 'level' the price between client nations and so provide a uniform share?
I'm interested because we are at the end of the longest tanker run at the bottom left corner of the Pacific, and I can see someone at our one refinery picking up the phone one day and hearing: "Sorry lads, no oil for you today." Click... mmmmmmmm.
Anyone know why the biofuels wedge was so relatively thick in '01, and is only just now recovering to that level. Ethanol has been largely ramped up since '05, right, so what gives?
Just a guess, but I'm thinking this may have to do with the European craze for palm-oil based diesel. This demand ended up destroying vast stretches of forest and bog in SE Asia, releasing enormous quantities of CO2. I think the craze has died down a bit now, but I don't have the data at my finger tips. Others with better data, please supplement or correct.
Thanks for this report. Is the EIA data available someplace?
The first plot is intriguing. It looks like total liquids is at a new max. However, it's hard to tell if Crude+Condensate is or not - it would be interesting to see the data plotted up separately, with y-axes that don't go to zero, to better see the changes.
Thanks again.
You mean like Blue Twilight did, about 14 comments above here?
thanks - didn't see it.
Is there something wrong with my reading skills, or does his diagram specificly say "Crude + Condensate" on the hedline?
My view on the graph of figure 10:
Norway toggle along on a flat level. They have enough oil to even export, and all electricity they need for their industry from hydro plants. The country is hardly representative for anyone. They are in a pretty unique sitution. Also 100% off their oil is offshore, so they will see the day when the last well is finally plugged. Unlike the countries with hughe onshore fields, and with US as the prime example of keeping onshore alive for a long time.
I would like to see a comparison with Sweden and Finland as well on that digram.
Growth in oil production is not what the global economy "wants". Given the growth in Asia, growth in production has been far from ideal. I think the production spurt we saw in 2003-2004 is what would be required to maintain a healthy global economy.
Growth stems from increases in the factors of production and increases in efficiency. Right now the world is benefiting from massive increases in efficiency caused by swinging consumption away from the USA and towards China. This has mollified the pernicious effects of anaemic growth in liquid fuels.
Overall, the trend will be towards a more equal per capita consumption of oil. Given that the future will soon have about 8 billion people, and the current "standard" for oil consumption is the USA (so we think), this amounts to a required production of 8x20=160 billion barrels a year.
Does anybody think this sort of production will happen?
Even if we split that in half, 80 BlnBarrels/Yr (about 220 million barrels a day) does that seem likely to anybody?
At 90 million barrels a day, a global average of 4.1 barrels a year may be achieved, for 8 billion people. Hardly a cornucopia of oil from the spoiled perspective of OECD citizens, ...Americans, in particular. And it is more and more apparent that 90 mbb/day is an upper bound.
Given global growth patterns, OECD nations that have not minimised their liquid fuel consumption profile will find themselves in a difficult situation for the foreseeable future.
As oil gets more expensive then does this not mean that more oil is required to produce oil? What I mean is that a well run on diesel fuel machines needs to use more diesel fuel to produce a bbl of oil. Therefore, the idea that oil production is increasing is false, since in reality less "Free" oil is available in the system. In Thermodynamics, we call this Free Energy. If Free energy = zero then the system cannot produce any work. As we use oil supplies that are more expensive we get less Free Oil / work back.
This is the real problem and no one on the OIL_O_PLENTY side of the issue has addressed it.
So fire away boys. I am in my bunker here.
The oil figures reported are a fiction since "Free Oil" (by my definition) is the only thing that matters to society.
If the oil is more difficult to get to, I would think so. Of course, it also provides incentives for the wells to be more economical: more energy efficient, alternative well fuels, more recycling/refurbishing of parts, monetizing wastes, etc. That doesn't mean there's an infinite supply of oil, of course.
What it does mean is that Gail's prediction of imminent disastrous crash, absent any prediction of social disorder somewhere, is hysterical. It discredits the very good work done on the site, including her own. Moreover, if something like The Singularity really is coming, it means we're buying time until nano creates a world with much, much higher limits to growth.
Yes, efficiency is a good point.
In thermodynamic systems, there are inherent efficiency issues. So one can get more "Free" energy from the system if less is wasted as heat (or other via of chemical waste products).
Nonetheless, the efficiency gains are opposed by entropy ultimately.
For a Carnot heat engine the efficiency is related to the ratio of the temperatures on the hot and cold side. Efficiency is maximal when the reservoirs have a large delta-T. As the two temperatures get closer and closer together the system falls to 0% efficiency.
For a dispersed chemical system, the efficiency will relate to the dispersion of the chemical compounds. The more dispersed, the more energy is required to extract, and hence less useful work can be ultimately obtained per unit of energy extracted.
One might say that Net Energy is the key metric to plot on the y-axis.
I think that a year or two before the Singularity a disaffected hacker youth will use his home genetics toolkit to synthesize a super-bug that will eradicate most of the human race. Or that a year after Singularity the new super-computer-being will do that instead.
Eh...
Lot of bother to go to...
There is a catalog of viral components quite handy:
http://www.hhmi.org/news/cullen.html
http://precedings.nature.com/documents/4765/version/1
http://www.prism.gatech.edu/~gh19/b1510/8lytic.jpg
Just put the assembly instructions in a plasmid.
Oct - I think this has been discussed widely - though the normal term is "net energy" - which I think is a better name, and also a better term than EROEI.
I agree absolutely with your position - if half the wellhead production is used for - production - then the net oil available is halved. Plants work in the same way - the yield of grain is only a faction of the total "production", but the grain is all that is available. And if the grain was produced on a farm powered by grain eating animals (or tractors) then the amount of grain leaving the farm gate is less, and is all that is available to us.
Taking it a step further WT's model is a very big picture version of this - if we regard the oil exporting countries as nothing other than oil exporters, and all their domestic consumption is purely for the purpose of producing exports, then the net exports = net energy. And that, unfortunately, has well and truly peaked.
Leiten had a good graphic last week that showed the increasing capital investment into oil production over the last five years has yield no net increase. In effect this is saying more resources, including energy (oil), are going in to oil production, and the well head production has not increased, so clearly net energy (oil) is declining.
Thanks Paul for agreeing, but I need someone to come and storm my bunker here. Indeed this is likely Net Energy. But it is nice to see that Net Energy and thermodynamic Free Energy are the same quantity, which is stunning proof of the concept.
Hard to deny the issues.
So these data from EIA and others may be misleading to the real "available work" that society can do today
I don't think you will get anyone to storm your bunker - while not all here may understand Free Energy and Carnot efficiency, I think almost all understand Net Energy.
"available work" is a good term too - which I consider the same as "exergy". And that, certainly can improve, on a unit basis, as engines etc get more efficient. Of course, in line with Jeavons paradox, we then tend to waste that exergy improvement with bigger and heavier cars, and driving further.
BUt measuring the "available work" and the "required work" is tricky. For example, since so much stuff is not made here anymore, is the "required work" now less? From Nature's point of view, all those unemployed people are now just wasting oxygen and food - if they are discarded, the required work is definitely decreasing. Sounds like a bit of a race to the bottom, and that is why the politicians and economists always want growth - even when it clearly is not possible.
It is a strong position. No one can penetrate the wisdom ;-)
I just would like the oil production data to be actually plotted in a way that shows the available useful oil for market. it would be interesting to see how much oil is being used today to make oil relative to historical levels. That is where the issue is imho.
Yes, the term "useful" is ambiguous, especially in terms of all the things that people do with their energy surplus. Some drive Mustangs. Some drive Prius. I guess economics are supposed to work out the energy equation by making us to do more with less. We will see how this recent oil iteration works itself through the system.
I think what Gail is saying with her controversial "guesstimate" chart is the following, which is indirectly related to the concept of "available useful oil for market" that you wish to have data for.
Any complex society must remain generally stable to do complex things such as to extract, separate, transport and export oil. Exhibit One backing this up are the recent events in Libya.
The price of stability is that generally an increasing fraction of the oil wealth must be spent to assure the required stability. Exhibit Two backing this up is Saudi Arabia announcing massive new social programs a couple of months ago.
In the complex oil exporting society which strives to remain stable, the oil wealth underpins the stability, rising population and rising standard of living, and these in turn tend raise the domestic consumption of oil, cutting into oil available for exports. Exhibit Three is the production and consumption history of every single oil exporter from 1980-2009 (the data for this is here)
If the complex society loses its stability for any reason, oil production is vulnerable to collapse. If oil production collapses it only returns slowly, after stability is re-attained. Exhibit Four is Iraq over the last several decades.
So: from the perspective of a social scientist situated in an oil-importing economy, the "available useful oil" for the oil-importing "markets" is the oil that producers make available for export, after deducting the domestic consumption which keeps the producers stable so they can produce.
I understand what you are saying about your bunker point of view and net energy. However, you might want to take this wider definition of available useful energy down in the bunker with you!
Having said all this, I have two observations on Gail's chart.
First, it is a risky business to try to put a time on forecasts of collapse events of any kind. Who would have thought in November 2010 that Libya's oil production would have evaporated by March 2011?
Second, if oil production collapses due to above ground social / economic collapse events, this does not mean that the affected oil will never be produced. Most likely it means that its production will be postponed. This postponed production shaves current peaks, fills in future valleys and therefore drags out production plateaus. Rising production from the FSU and Iraq are good examples of this, if you consider that the above-ground events which "deformed" their Hubbert curves took place decades ago.
So unless "Mad Max" is around the corner, a long-drawn-out plateau like profile is more likely... but the timing of fast-collapse events is hard to pin down, as per my Libya example. So the best guesstimate would be a long-drawn-out production plateau of uncertain current average gradient (+ or -), but plateau-ish enough to permit a guesstimate that net oil exports have already peaked for good.
That's what should have been shown with that chart. It was truncated prematurely so that one could not see the behavior of the tail. Unless the plot incorporates EROEI usage implicitly we should see a conservation of URR via the integration underneath the curve.
Nah, Nature doesn't care about that. She'd be perfectly happy if those unemployed folks were wandering the woods and swamps, picking berries, fertilizing the soil, occasionally (or more often) being eaten by predators...
It's a "mother" of a very different kind who glorifies and demands "productivity" and promotes the consumption imperative.
Paul – I get your point:”In effect this is saying more resources, including energy (oil), are going in to oil production, and the well head production has not increased “. But: By oil production I suspect you mean the effort to find and develop oil reserves…not the actual energy used to actually draw oil out of a particular well. That energy demand is quite low: I knew a fellow who was making a nice living producing 20 wells at around 1 bopd for each well. And that was when he was selling his oil for less than $15/bbl. Obviously it didn’t take a lot of energy to produce those wells. And if you look at the actual amount of fuel (diesel + lube) to drill and complete a deep well it’s a rather small amount (4-6 %) of the total cost. Of course that ignores all the embedded energy in the hardware.
“and the well head production has not increased, so clearly net energy (oil) is declining.” Maybe…really hard to quantify. We’re certainly not drilling as many wells as we once did (rigs peaked at 4,600 back around 1980.) But a very low percentage of those rigs actually found oil/NG. Thanks to greatly improved exploration tech we have a much higher success rate these days. OTOH we’re finding much smaller reservoirs on average.
“the increasing capital investment into oil production over the last five years has yield no net increase”: I don’t think this statement is inconsistent with the points I made. If there were just one oil company then such economics would put them out of business quickly. But there were thousands of companies. And many that went out of business after just drilling a handful of failed wells. They were really more joint ventures funded by private investors than how most picture an oil company. In fact I saw one joint venture drill all 18 of their wells with zero oil/NG produced. And the venture manager walked away a millionaire. So it’s possible that the oil industry AS A WHOLE has not made a profit for many years. But that’s looking at $’s in/$’s out…not net energy. I’ve seen a great many producing wells that never recovered the capital invested but did have significant positive energy gain. As I said 90%+ of the cost to drill a well is not energy costs. As the president of Chesapeake recently pointed out their drilling cost have jumped 15%+ very recently. But only a small portion of that is due to increased fuel costs. Because of great competition for a limited amount of drilling equipment much of the equipment rental costs to drill a well have escalated 30-50% in less than 2 years.
Rock - thanks for your comments - as always, the industry insiders point of view is enlightening. Amazing that a guy can make a million out of a failed joint venture - I can guess what the losing partners thought of that!
To clarify what I was saying - yes by production I actually mean exploration and production - everything that goes from surveying and seismic to getting oil out of the wellhead. From there on (refining etc) I don't think the energy picture has changed much, if at all. And, i throw a wide net, because in that energy I would include not just the diesel used for the drill rig, but the fuel the guys use driving their trucks to work, etc. In effect, all the oil used by the E&P industry and it's employees and contractors - the oilfield service industry - as that is, effectively - a whole sector of the economy/population dedicated to producing oil.
What would be interesting to see then is the total (domestic) E&P workforce over the decades, compared to production. Would be great to see the fuel used, but there's no way to accurately get that data.
The old oilfield engines (love those beasts!) that run on crude oil are a good example of "production energy", though not often used these days - most pumpjacks are electric if possible, so the oil used for "production" is very low.
It would be interesting to see the energy spent on the offshore stuff too - lots of ships, choppers etc, plus the rigs themselves, and, as you point out, the holes are abandoned much earlier for economic reasons, thus you have fewer barrels to distribute the E&P costs over.
For an extreme example of energy intensive oil production, we have, of course, the oil sands. Even if we don't count the (vast quantities) of NG used, they still use a lot of diesel fuel to dig up and transport the two tons of sand per barrel. Then add in all the oil used in and around Fort Mc - as the whole city exists purely to support the oil industry, and we start to get a handle on it. Working out the embodied energy in the hardware is harder, but it is certainly there - a lot less big PU's would be made if there was no domestic oil industry!
I don;t know that I would agree that the industry as a whole has not made a profit - I'm sure it has, after all, the price has quadrupled in a decade. A 4x increase in price on flat production volume should be able to cover off increasing capital investment and I'd say it has.
An interesting thought exercise is IF there was enough oil in the ground in the US to provide all 18mbd being used today, and we assume the production to be the same distribution as today (i.e. split between on and offshore, large wells, stripper wells etc), how much of a workforce increase is needed to get to 18mbd, and stay there? That would represent a meaningful chunk of the economy and workforce moving into oil production, and they oil they consume is part of production - a domestic export land model, if you like. and IF the economy was at full employment, then clearly people/resources have to be re-allocated from some other venture, so production of other stuff (like say government documents) would have to go down to keep oil up, and the "net exports" avail;able to the rest of the economy is decreasing. If the nature of the mix then changed such that more of the oil was all in widely distributed, short life stripper wells, then the oil used for E&P, on a per barrel basis is clearly going up, and the ELM effect becomes greater.
It is always, as you say, the economics of any given prospect that determine if it goes ahead - and as the prospects generally get more "expensive" a part of that cost has to be fuel usage, both directly and indirectly, so I think its a reasonable assumption that the oil used per barrel produced, is increasing - though it is still a small proportion overall.
Paul - Yep...can't really document the overall profitability. But I work more with the bottom feeders than the big boys drilling 300 million bbl fields in Deep Water. I've seen more private investors get sucked into drilling many crappy prospects with no chance of success. So I'm a tad prejudiced...LOL. I've mentioned before one of my warmest oil patch memories was helping to bust a phone bank room selling a bogus drilling deal to dumb private investors. I've seen a crooked operator drill a well he knew was going to be a dry hole but wanted to make the front end money promote on the deal.
As far as a workforce increase we're already suffering along the Texas coast from the Eagle Ford drilling boom. It's not just a question of getting more boots on the ground but getting experienced hands. Last weekend I had to deal with a well testing hand that had no business being on my well doing what he was doing. He had 30 years experience...as an accountant for Texaco! I am not kidding you. I have only one company on my "hell will freeze over before I use them again" list. And I had to use them a few weeks ago because no one was available and I didn't want to spend $60,000/day waiting for someone else to shake free. Booms not only mean more lost money due to inexperience but also more lost finger, hands and sometimes lives. Just found out one of my former drilling supers was killed over the Easter holiday. No details how it happened. A couple of months ago a drilling contractor gave me a bid but included a required 30 day delay so he could train a whole new drill crew. I passed...a few green hands in one thing...a whole crew of them is another entirely. I just don't have a death wish. LOL.
I'm sure you get the idea. The boom/bust cycles in the oil patch have been going on from the earliest days. But they used to run 10 to 20 years. But know they seem to cycle very 4 or 5 years. Nearly impossible for the logistics to cope well in such short time frames.
Rock, From the macro economic view point, what matters is the investment in the industry, not necessarily the profits that come back - though I;m sure some investors would disagree! But your story does illustrate that more capital is flowing to the oil industry, which would otherwise be going somewhere else. And the fact that it is not always returning a profit shows that producing oil to pay for the capital is, for a variety of reasons, getting harder.
You have made mention before about the difficulty of operating in boom times - I can imagine you need that like a hole in the head! But that in itself shows that the production (incl exploration) process is less efficient - high prices mean some people can get away with doing stuff they wouldn't do at low prices, like drilling less ideal prospects. Unfortunately it sounds like some human risks are taken that should not be - though hopefully less than in the past.
I don;t envy you being in that business - it is more up and down than any other I can think of, and as you say, no one has any sympathy in the downs - but they still demand their daily ration of your product - and criticise you for trying to make a living from it. A thankless job!
I'll try and address your question, although I'm by no means an expert. Yes, drilling depths and number of wells have increased and the amount of steel used in drilling has increased many fold, especially with the use of offshore drilling rigs. The tar sands and bakken shale oil are more difficult to extract than the crude oil coming out of Saudi Arabia. As depletion sets in it will become increasingly difficult to pump the oil out, but significant production will continue for some time (most of it is automated, not even requiring operator interaction). There is some degree of problems with aging refineries and pipelines. There is no doubt that we will see price increases in anything oil product related, but people can always ration their use.
Where I disagree with a *doomer* viewpoint regarding oil production, is that oil is one of the big three fossil fuels, the other 2 being natural gas and coal. Coal production could be ramped up significantly for CTL (coal to liquids) production. Solar and wind turbine production is already ramping up quite quickly.
The reliance of industrial farming on natural gas and oil is somewhat exaggerated by authors like Kunstler, etc. India is an example of a country where fertilizer and oil use is a small fraction of what it is in N.A and yet they produce just a fine amount of food.
If there is any area of concern from serious life threatening consequences from human activities is warranted, it is in the poisons that we produce and dump into the environment, the effect of global warming and possible water shortages from aquifer depletion. The biggest threat is still thermonuclear war, a situation which humans created and the only one which we collectively can prevent.
Where's the Darwinian?
Are you in here and I missed you?
This thread is worthless without the Darwinian;-)
Gates: ‘Cute’ Tech Won’t Solve Planet’s Energy Woes
Funny, I constantly hear about how alternatives are uneconomical, a waste of time, too much trouble, and now they're "cute".
Look, I don't care how smart or rich you are, solar panels and wind might keep the lights on and maybe even the fridge running. Oil, coal, oil shale, and nuclear are all finite fuels with waste problems. In the developing world, putting up some solar panels and batteries to power the lights in the village works. There is a lot of area in the tropics that is bare rooftop, serving no need, and until you start covering those don't tell me that we need big projects. Who is going to run these big projects in these countries? Who is going to build the infrastructure, who is going to maintain it? Whose farmland are you going to take to put up the power plant? How much of it?
You can argue that the cities need the big projects, but the villages certainly can gain from these "cute" technologies. Even cities in the tropics could gain a lot if they used their rooftops.
Of course, Gates is pushing nuclear power in the end. Why am I not surprised? Waste is always a "relatively small problem" to people pushing nuclear power.
You have to remember this is a guy who became the richest man in the world by inventing a system that let him "control" the way personal computers worked.
if you had independent computers being independently programmed, where is the money in that?
So too with independent power/fuel production - it is, in my opinion one of the bet ways a community can take control of its destiny. Plugging into the grid/pipeline gives someone else control and literally bleeds money, continually, from that community.
Have a look at this guy's website, who makes small machinery and steam engines (!) in India - he gets to see the improvement in a community when they take control of their energy.
http://www.tinytechindia.com/bascon.htm
And that from a guy that used to be a managing director of a large sugar milling company.
Gates, and the nuke industry, and the elec industry in general, are loathe to give up control - that is why they fought net metering and the like for so long.
In the oil industry the little guys get to produce stuff all the time - electricity should not be any different.
Came across this pretty cool webpage at the EIA. It categorizes the oil wells in the US by production. Pretty clear looking at it the Drill, Drill, Drill crowd is delusional.
http://www.eia.doe.gov/pub/oil_gas/petrosystem/us_table.html
To top that off, the brilliance of a good model:
Part of this data was also mentioned on the last TOD Tech Talk (http://www.theoildrum.com/node/7858/798733), where commenter benamery21 only gave a few of the points. Based only on those points and an application of the Dispersive Aggregation Model, I predicted a PDF of p(R)= r/(r+R)^2 where r=median rate=1.6 bpd.
When I noticed that this was essentially the same data as gthompson is now pointing to I plotted the full distribution with that median value of 1.6. The agreement is outstanding and it is again clearly case that the professional oil geologists have no clue how to do realistic modeling. Leave it to us TOD amateurs :)
Thanks for the pointers to the data. If the data is there, we can model it and that model tells us all we need to know about future supply.
Yes, pretty impressive model matching there Equally impressive straight line from 100 to 10,000bpd - but what is the likely cause of the kink around 90-100bpd?
The kinks are caused by integration of different amounts around a varying histogram interval. It changes from an interval 40-50 and then jumps to 50-100. Even though the trend is declining there are more reservoirs between 50 and 100 then between 40 and 50. Thus the data jumps upward momentarily.
The agreement is outstanding may be an understatement. Nice touch with background. It pulls you right down into the reservoir.
Thanks.
Now that EIA is pulling funding for its energy statistics, we may have to do more of this kind of analysis on our own. Good thing I don't need any funding :)
Web - Back in the mid 80's I generated a similar plot of cumulative NG production for the thousands of wells producing from 2,000' or shallower. An even straighter "perfect". I found very few geologists and no reservoir engineers willing to believe even though I showed them the raw data from the Rail Road Commission data base. I'm sure you're not the least bit surprised. The most profitable wells drilled during this time were very shallow ones: not a lot of NG but absurdly cheap to drill. And no...couldn't talk an operator into focusing on such an exploration program.
Now you can see why RM is indeed one of a kind. The industry guy that looks at the entire system and never stops asking questions.
If that is what the amateurs are doing then I wonder what the professionals can see in their data. Really makes one wonder about some of the prediction graphs we see around.
NAOM
I still think the price argument is the strongest evidence of a current peak in production of crude + condensates. Prior to the unrest in MENA there would have been no reason for swingproducers and others not to increase production by millions of barrels a day.
However, I don't think it is important to know the exact year of decline. Lets just say it will be 2012. Fits in with the Maya thing and the whole 2012 craze.
I have to comment on this new peak in extraction rates. I suspect that the EROEI of the extracted oil has been worsening rather rapidly in recent years.
It would be prudent to supplement the extraction graph with an "available" energy graph for the same period. If possible !
I suspect it might show that we may not have hit a new peak in available energy for discretionary purposes.
It would be prudent to supplement the extraction graph with an "available" energy graph for the same period. If possible !
That would be Westexas' "available net exports", the numbers for which he gives upthread, and yes, it has peaked.
Note that what I define as Available Net Exports (ANE) is Global Net Exports less Chindia's combined net oil imports. Given China & India's relentless increase in consumption (especially China's), in the face of generally rising oil prices, my premise is that what Chindia wants, Chindia gets.
what Chindia wants, Chindia gets.
I think that is a good basis for predicting the future of any internationally traded commodity!
What about Brazil, since they are in the same economic club as Chindia, should we now group them with Chindia for determining ANE?
I look forward to when you add the 2010 data to your ANE series - i expect the trend to continue, if not get bigger
I think that's true, but to maybe put a finer point on it, I would think it's to an exporters advantage to prioritise selling their product, in this case oil, to the economy that is growing vs. the one that is treading water. This is because the latter could fall into a recession easier causing a supply reduction, et al the US. Suppliers love a sure thing, which I'm sure was your point.
Gregor Macdonald makes an interesting observation http://bit.ly/l5R3eT on the paradoxical notion that high oil prices hurt non-OECD countries less. Chindia demand inelastic because they use less and use it more efficiently. And of course: that's where all the people are at.
I'm curious how much of China/India's growing oil consumption is for personal transportation, and how much is for diesel generators for manufacturers that can't get enough grid power?
i can't find figures on that but i'd take a guess and say in china - not much. They have industrialised and grid connected all of the coastal areas. Factories are now starting to move inland for cheaper land and labour (!) but only where there is power. I wouldn't be surprised of the gov makes sure diesel is not uneccessarily sued for power generation, since it owns the power companies!
India is a different story. Their grid is not as extensive, or reliable, so there is more diesel being used for electricity, or to directly power other equipment, like grain mills etc. While this may seem inefficient, a diesel engine running a grain mill is likely producing more value than a diesel engine in an F-350 commuting to work in LA.
In this context "efficiency" really means the marginal GDP produced per litre of fuel used, and I'd say both China and India are ahead on that score.
Factories are now starting to move inland for cheaper land and labour (!) but only where there is power
This appears to be causing some transportation issues.
China may not plan everything as well as some would lead us to believe. This NYT article on China's trucking system gives a peak under their hood I'd not seen before.
I've seen several articles that suggest that a lot of factories in China are using diesel to supplement an inadequate grid. The Chinese government has made increasing power generation a very high priority, but that doesn't mean they've succeeded. OTOH, an Early Warning post indicated that average VMT per vehicle in China is very low. So...I'd like to find stats, if possible.
marginal GDP produced per litre of fuel used, and I'd say both China and India are ahead on that score.
China uses about as much energy as the US overall, and it's GDP is much smaller. It's energy consumption is growing far more quickly in proportion to GDP growth, so I'd say marginal GDP produced/litre of fuel in China is much lower than in the OECD/US. I think we can agree that marginal utility of the same market value of GDP may well be much higher in China...
One thing i'd like to point out is that (at least in India) cars are luxury & not necessity as in the US. Almost all of the infrastructure is built around the public transportation and can be reverted back to fairly easily if the pricing pressure warrants. This is not possible in US due to poor/generous suburbia planning.
My guess is that the business consumer (presumably in Chindia) will be able to outbid the US personal consumption when the decline sets in.
I believe high oil prices are to be welcomed though. Low prices blocks innovation and progress as well. Whatever happened to the hydrogen economy since Bama came to power? The hydrogen storage problem has been solved http://cenh2go.com (watch the video, its fun)
And its not like we dont know how to produce it from say windmills and electrolysis. The future is all a matter of price. The price of windenergy will keep dropping as the technology progresses.
The only reason I remain a doomer is because I think U.S. gov serves a small wealthy cosmopolitan elite with oil and metal interest with Machiavellian policies. Same with the Communist Party in China.
We are doomed because Big money rules, not intellect.
Suppose I buy your premise, that Big Money Rules.
Would Big Money want a fast-crash doom scenario where they would have to hire hundreds of mercenary soldiers to protect their B.M. (Big Money)?
Whatever happened to the hydrogen economy since Bama came to power?
The hydrogen economy died, as it should, because it simply is not economic. Even if the storage is solved, which form that video I'd say it isn;t, you still have the issue of manufacturing and transporting the stuff, and then how to use it - fuel cells are not anywhere near being ready for vehicles - at least a decade away, but then they have always been a decade away.
there are many better and cheaper energy carrying systems that we can use like batteries and methanol. If H2 wants to play, it has to earn its place on the energy team, and to date it has not.
Methanol is a good format for storing and transporting energy. Battery are not. Methanol gives you about 20MJ/Kg, Zinc/air battery about 2MJ/Kg.
Actually, batteries are very good at storing energy - just not for transport applications. My cordless drill is fantastic - i wouldn't want to be fussing around with a methanol fuel cell - even though they can be made that small.
On the topic of Chindia oil consumption, how much more will those two countries be importing a year from now? Is there ample supply to meet that demand, or will current supply just elevate to a higher price? And I wonder what that will be.
Unless and until there is another global recession (or Greater Depression) the price of oil will tend to increase because:
1. Supply is flat to declining; net oil exports are certainly declining, and
2. Demand for oil tends to increase along with economic growth.
A worldwide Greater Depression starting next year would not surprise me at all. Shucks, it could begin this year; it is only May now.
Funny, even as TOD projects a new peak yet to come, for the first time (that I know of) IEA's Fatih Birol says the crude production peaked in 2006.
http://www.abc.net.au/news/stories/2011/04/28/3202209.htm?section=justin
Be careful to compare the same things. Crude oil, crude oil plus natural gas condensate and liquid fuels are all different,
One or two folks posted here about ~ 6-8 months ago predicted some kind of dramatic/major downward change in oil supply and associated dramatic economic by Spring of 2011.
If I had more time, I would try to find those posts to see exactly what they predicted.
No doubt, the Earth's oil resources are finite, and we are on a plateau...
My personal guesstimate has been that we might mightily extend (~ the current level of production[all liquids]) and pretend (that the good times will keep rolling indefinitely)until ~ 2020-ish, after which all liquids will definitively decline at some rate.
The exact date of 'definitive decline' doesn't matter...we are already at least 40 years tardy in taking action to cope.
It is not too late to try some modest coping now...but joe sixpack has zero idea of this PO topic and won't until the 'definitive decline' has beset us.
Note that net exports have been unambiguously declining for several years. In terms of net exports, we are clearly well past Peak.
Good Point.
I concur that we have wasted the last four decades, beginning in the early 1970s, making any reasonable preparation -- certainly with the United States. The primary use of crude oil is transportation; countries like Canada and the USA depend on oil for 95 percent or better of all their transportation needs. Once the realization sets into "Joe Six-Pack" that his F-250 with the big grill in front is not going to get him to work and back....well, I'll leave that for your imagination.
Countries like China can construct massive rail projects and whole new (empty) cities with build-out times of only a few years. The environmental and administrative regulations in the USA, plus the litigation over property acquisition, make any new capital transportation project a 20-25 year process. We just can't go build a high speed rail system or change the densities of our urban areas in response to a five or ten year warning of an oil crunch. As President Obama found out, there are no shovel-ready projects these days.
I'm a transportation engineer by profession, and I can only smile when someone talks about Americans switching to rail once peak oil "hits." There are major urban areas like Nashville (TN), Louisville (KY), and Columbus (OH) which each have a million or more people yet are two hours or more from any Amtrak service. Cincinnati, Ohio, with two million people, has a train in the wee hours of the morning three times a week in two directions.
The number of "new urban" communities on the North American continent can be put on a single page, and many of those are isolated from existing public transportation systems. Bikeways, sidewalks, "complete" streets, and all the other terms we use to describe multi-modal or non-oil transportation systems are even smaller in proportion than renewable energy resources are now.
All the debate over oil reserves in Brazil (under miles of ocean and salt), tar sands in Canada, or shale oil in Colorado is just not relevant to the urgency of the problem. There exists no political will even to speak of energy depletion, let alone agree on a course of action. Whether the date of peak oil turns out to be 2006, 2016, or 2026 makes no difference in the outcome.
Countries like China can construct massive rail projects and whole new (empty) cities with build-out times of only a few years
Interesting how the rail really needs to be brought to the inland cities that are not empty cities. China’s Exports Perch on Uncertain Truck System is short NYT piece worth the read.
The article certainly shows that China has plenty of reason to bid diesel up and probably subsidize its use heavily as well.
Good to get a transportation engineer's perspective. The above notation says a lot. It means there isn't even the slightest chance of a smooth transition, which means collapse is inevitable followed by a completely new way of life for those that make it through.
Yes, too much time is going by.
"The exact date of 'definitive decline' doesn't matter"
I think the only thing that the average person would want to know is "when"; When do I have to change?, When am I going to be inconvenienced?, When will I have to start investing towards meeting new everyday realities?, When should I move out of harm's way?.
Moving away from the current optimum, spending on contingencies that do not materialize, and altering convenient routine ahead of time puts a person at a disadvantage.
There is a chicken-and-egg aspect of oil production and economic health. There is a spatial distribution of effects. There is skew in the timing...
When do I have to jump?
Here are three expensive things
1) thorium reactors to make energy
2) CSP to make energy (concentrating solar power)
3) storage of solar power over night
Thorium reactors require only one expensive item. CSP requires two expensive items the generation and the storage. I would guess we will be going with the solution that is half the price of the other solution.
Happily molten salt thorium reactors do not use high pressure high temperature water that flashes to high pressure high temperature steam if there is a breech. They operate at room pressure.
Thorium reactors produce less waste and the waste is much shorter lived. Thorium is 4x more abundant than uranium. 100% of thorium can be used rather than 3% of uranium.
We have a solution. It is not prefect but it can provide 100% of our energy needs with growth for as long as we need.
and how do we drive, fly, ship on nuclear energy?
Given that a thorium reactor doesn't even exist, and CSP does, I presume you must mean that CSP is cheaper (which it is) and will be developed which it is) Night storage for solar is completely useless until we have no other sources of electricity, and that will be some time away.
As for transportation neither CSP nor thorium are usable directly but both can produce synthetic methanol and dimethyl ether for cars and trucks and planes. See "Beyond Oil and Gas: the methanol economy" by Olan, Goeppert and Prakash, 2009.
The graph on world oil production and the future guesstimate looks very scary. If by 2013 the oil production is expected to drop drastically as projected, there will be major conflicts across the world with countries scrambling to secure the dwindling availability for themselves and the sufferers would be poorer countries who do not possess the military muscle.
Psudarsanam, there is a presumption by many that widespread conflict will occur when oil supplies fail to meet demand at any price. But I also wonder if countries like the US will simply have to take their medicine. Somehow I don't see the US invading Canada for their tar sands, or Venezuela for their heavy oil.
It's already clear China will be surpassing the US as the #1 economy, by most estimates in 2016. Just like Detroit much of the US will become obsolete, defunct. We just have to accept inevitable decline and contract as needed. Take our medicine.
What can happen if things blow up is that the crude transport sector can be crippled in fairly short order--For the moment not likely, but who know what sorts could be brought to power by an OECD public suffering real deprivation. It could be touch and go come 2030 give or take a handfull of years, unless some big changes occur. That is still a couple decades off or so, but time flies when you are having fun.
In my opinion, the direct effect of QE2 (and the dollar) on oil prices is overrated, it certainly does not help (maybe a +10% contribution) but the main driver by far is a rising demand (mainly non-OECD) coupled with a sluggish supply growth with a $20 premium because of Libya on top.
Elevated high prices since 2004 have helped bring marginal supply to the market (Canadian tar sands, sub-economical oil fields, etc.) and some regions have stopped their previously steep decline (US, Mexico in particular). I don't think we will see a steep drop in supply simply because high prices will then boost marginal supply and reserve growth therefore lowering overall decline rates in mature regions. A steep drop in demand is also unlikely because we will then see a steep decline in prices, unless there are major conflicts or social unrest spreads to Saudi Arabia for instance. I think we are in a situation of dynamic equilibrium right now between economic growth, supply growth, oil and food prices also. The best would be for advanced countries to move willingly away from oil ASAP before supply actually peaks, I'm skeptical that developing countries will be able to do so because of their low consumption per capita and motor vehicle penetration however their are more sensitive to food prices.
I agree.
to move willingly away from oil ASAP before supply actually peaks, I'm skeptical that developing countries will be able to do so
Yes, it will take a while for EV type vehicles (hybrid, plugin, EREV) to become cheap enough for developing countries to move to them easily, and especially for used vehicles to become available for those who depend on them. Very small EVs, especially electric bikes, may be the mainstay for quite a while.
Very small EVs,
They would be the LSV's (Low Speed Vehicles)
Yes, they would make sense for people who depend on very inexpensive vehicles now.
or who depend on inexpensive oil.
A relatively small percentage of light vehicle owners in the US "depend" on inexpensive oil, right?
Again, the average new vehicle sale price is about $29k, and the cost of fuel is only about 20% of the total cost of ownership. So, even if the cost of fuel doubles, that only increases the total cost of ownership by about 20%. The average vehicle (weighted by annual VMT) is about 7 years old - that's an age at which depreciation is still important, and the percentage of overall cost of ownership that comes from fuel is still pretty low - perhaps 25%.
Someone who's now buying a $25k Camry can easily shift to a $25k Prius, and then to a $28k plug-in Prius or $25k Leaf.
i think a LOT of people in the US depend on inexpensive oil. They would be the ones with the long freeway commutes to from their cheap outer suburban homes to their city medium or worse paying jobs. As oil goes up, down goes their property value, and possibly their income.
Not many of thee people are in a position to buy a new car - many never have.
It was in yesterday's drumbeat that the average family uses 1160 gallons of gasoline per year - that is an incredible amount, and closing in on $4500/year! If the family can only afford one car, it will be a "family" car - and likely a second hand one - not the most fuel efficient. They can;t afford a new car to get out of the hole.
And there's the rub, with the lower end wages going down, the new cars are irrelevant to those people, and because of no/few transit options, they have little choice but to keep driving. I know of numerous people in just this situation. Unless they are given the efficient car for free, efficiency is unaffordable.
I should add i come across this in my work regularly - the hotel etc just can;t afford to spend capital on water/energy efficiency - if they don;t have any capital.
For someone who can only spend $5-10k on a car, and that is more people every day, or has finally paid off their existing one and can't afford to upgrade, the new choices are meaningless, no matter how efficient they are.
i think a LOT of people in the US depend on inexpensive oil.
Let's think in terms of percentages. 50% of personal driving was done in light vehicles less than 6 years old, per reports from the US Federal Highway Administration from several years ago. New light vehicle sales have declined recently, so that might have risen to 7 years. Still, that would mean that 50% of personal driving was done in light vehicles less than 7 years old.
The average light vehicle price several years ago was $28,400 (recent news reports now give an average of $30k), so the median is likely to be fairly close. That means that roughly 50% of all new vehicles are more expensive than about $28k.
So, only about 25% of US driving is done in vehicles older than 7 years of age, that cost less than $28k when new, right?
So, only about 25% of US driving is done in vehicles older than 7 years of age, that cost less than $28k when new, right?
Agreed - half of the used cars cost less than $28k when new. Now what?
We still have 50 of miles done in 7yo or older cars - by lower income people. And i'll bet that much less of that is discretionary driving than the 50% driving newer cars, so they don't have much space to cut back - and they are still unlikely to buy a new car.
With new car sales falling, and hybrids still only a small share, a significant % changeover will take quite some time. If the economy worsens, more people will just hold onto what they have, or when they buy a new car, it might be a cheaper Hyundai - whose sales have been increasing steadily.
Efficiency remains unaffordable for those that need it most - it has always been like this, but before it just wasn;t as important as it is today.
i'll bet that much less of that is discretionary driving than the 50% driving newer cars.
Not necessarily. Many of those older cars are driven by affluent teenagers. The newer, high mileage cars are typically commuters and fleet drivers (sales, taxis, etc), whose driving is less discretionary.
With new car sales falling
New car sales are rising. They're well below their peak, but only slightly below the long-term trend-line.
a cheaper Hyundai - whose sales have been increasing steadily.
Average car size is falling, but not average price.
a significant % changeover will take quite some time....Efficiency remains unaffordable for those that need it most
True, but many people could sell their SUVs and move to small cars. The average MPG is 22, but there are many high mileage small cars that could and should move to those who drive most. Many poor people are driving pickups, SUVs and large cars who could move to small cars. Conversely, the average Prius owner is older and wealthier.
I often read stories about people complaining about gas prices and the expense of filling their SUV, and I keep waiting for the interviewer to ask if their interviewee is going to sell their SUV and buy a Yaris, or try carpooling.
----------------------------------------
The bottom line: there is a significant minority of working poor who will be hurt by fuel prices and who will be unable to easily fix the problem, but they are a small minority. It's a real problem and compassion demands we do something to help them, but it's not realistic to portray it as a really big problem for most people.
But WHO do they sell the SUV to? Unless you take them off the road, you are just shuffling the pack. Now, some families that can afford to, will partially take them off the road by buying another small car, and only using the big one for family trips - but how many can afford that?
As for your bottom line I guess what I am saying is that the proportion of people who will be unable to easily fix the problem is growing, such that for those who can "fix the problem", they may not be large enough to actually "fix" the problem, fast enough.
I know you think the PHEV's can solve the problem, but the first ones have only just hit the road - they have a long way to go to make any real dent in oil use. Even when they do, gasoline is only half the 18mbd - the other half is still more than domestic production has ever been, and they won't touch that.
But WHO do they sell the SUV to? Unless you take them off the road, you are just shuffling the pack.
They sell the SUV to someone who needs a vehicle, any vehicle, but doesn't drive many miles. There are a lot of people like that.
some families that can afford to, will partially take them off the road by buying another small car, and only using the big one for family trips - but how many can afford that?
Most of them. Most families have multiple vehicles (110M households, 230M vehicles, so more than 2 vehicles per household), and they can choose to move their useage to the most efficient vehicle.
the proportion of people who will be unable to easily fix the problem is growing
I'd say that's not true. Median household income is not falling.
gasoline is only half the 18mbd - the other half is still more than domestic production has ever been, and they won't touch that.
Imports are now less than 50% of US liquid fuel consumption. If all personal transportation came from EVs like the Leaf and EREVs like the Volt, the US would need no imports at all.
Actually, the other half of oil consumption is likely to fall faster than that for personal transportation. Industrial/commercial users are moving very aggressively to improve efficiency and find substitutes.
I'd say that's not true. Median household income is not falling.
from the Economics Policy Institute site
median has been fairly stable as it looks like 2009 is around the 1997 level. Real household income stabilized or started rising by the end of the pre 1990 recessions but has continued falling for a time after recessions since that time
a few points and a question
1: if median income is stable and the population is growing more families make less than median and there is that very troublesome big shift of income and assets toward the very wealthiest
2: median income has remained stable in part because households have had to work more hours, so it seems I've recently read, just from memory so I might be mistaken
3:inflation has been tame but looks to be picking up speed--at higher inflation rates income can lag noticibly and will without higher growth accompanying the inflation rate rise.
? Is median medical/pension benefit rising, holding or falling? I'd bet from what I hear its the last--but I've no data to base that on
I agree - working families are having to work harder and longer just for the same income, while the growth in the economy is accruing just to the wealthiest.
It costs money to go to work too--especially if it forces the workers to hire out jobs they would have performed themselves. I wonder, if we removed the cost of going to work would real household income be above the 1985 or so level today?
The chart you provided seems to show that real household income rose by about $10k from 1985. I can't imagine the cost of commuting rose that much.
If people have a little time to adjust, they can reduce their fuel costs quite a bit. Again, a Prius gets 2x the MPG of the average light vehicle, and costs less to buy. If people can't find a used Prius or Insight, they can buy a used Corolla and Civic and get pretty good efficiency.
I wasn't looking at the graph when I grabbed that year out of the air--its just above the bottom out of the lesser great recession (this 2008 beast being the greater great recession) I should have used 1988.
Commuting is not the only increased cost . I've no real numbers on this but in the late 80s women I knew of often took at least a couple months off before having a child and often did not return to full time work until all their children were preschool age. These days most of the women I am of aware work to within a couple weeks of having a baby and are back to working their regular full time jobs about a month after they deliver. A lot more child care dollars spent there--part of that hiring out work that used to be done by the householder I mentioned.
There are a lot of subtle difference between working in the late 80s and now. In my first reply I mentioned longer hours and weaker health care coverage. Mentally I carried that along, though expecting you to read my mind is asking a bit much. People working longer hours do a whole lot less cooking at home-and when they do cook it is often rather expensive frozen or other heavily factory prepped entrees. More of that hiring out of household chores when more time is spent at the work place. And of course if both parents are working more hours the kids are in daycare longer.
Health care service and drug costs are part of the inflation adjusted goods and services basket but are the increasing share of premiums and the greater deductibles paid today figured in?
Adjusted median household income is a pretty good metric for getting a ballpark comparison--but I'd want a lot more info to compare to see if the 2011 US median household is better off than the 1988 one was. With the changes that have come down the pike for middle America-and you don't get more middle than the median-the real durable goods purchasing power of today's median household could well be the same as that of the median 1988 household. Real durable goods purchasing power is the metric we really need to compare when talking about the ability to buy new cars.
I agree - good thoughts.
Still, I think people tend to exaggerate the difficulty of coping with higher fuel prices. There are a lot of people with money to make another choice who insist on continuing to purchase and drive SUVs, pickups and low-mileage sedans - they could cut their fuel costs by 60% in a heartbeat.
Most people could switch their vehicle if they chose. Even the minority of people who really need an SUV or pickup could very often choose something much more efficient, or drive it a lot less.
I keep coming back to the fact that a Prius costs less than the average light vehicle, and uses 40% as much fuel as the average. At the moment used Priuses and Honda Insights are indeed available, and used Corollas and Civics are cheap. - when there is a 6 month backlog for new ones, and their price used rises to the price of a new one, then it will be clear that at least a few people are really in a bind. But until then...
All good points Nick. I feel the pump costs we are seeing now, though not painless, are well within coping range myself. I'll take your word on the state of the used car market--the local one is not at all representative of the rest of country's.
Of course lack of public transit into crumbling 1970s or so built 20+mile out suburbs whose stagnant or dropping property values have drawn a more vulnerable class of homeowners is an issue. It is not being addressed but has huge disruptive potential if the wrong dominoes fall.
Three reasons why the prevailing TODster mentality is "never gonna get it."
1. It is stuck in a capitalist trance, unable to see that capitalism is entirely incompatible with the steps that would need to be taken to have any chance of a soft landing.
2. It only understands and relates to car culture, which would be a dead-end ("carmageddon"), in terms of sustainability and quality of life in a resource-constrained world, even if the auto-fuel problem were solvable.
3. It is almost wholly ignorant of the centrality of urbanism to the development and maintenance of civilization, and of the absolute necessity of maintaining livable cities in a post-PO world, if we are to have the tiniest hope of avoiding Mad Max.
Interestingly, in terms of these characteristics, TODsterism is hard to distinguish from the mindset of Joe OECD Blow.
Three reasons why the prevailing TODster mentality is "never gonna get it."
The prevailing mood shifts. Endless threads here have banged at what you are talking about. This site looked to be about to drift out of existence when Macando blew, then whosh an explosion of interest because the site could corral people who actually knew something about the oil business--many different aspects of the business.
The discussion has changed some since then as has the editorial policy--still a great place to learn stuff especially fact based stuff about oil right now. Something pops like Fukushima Daiichi and bang there are more than a good handful of people who actually know something first hand about nuke power plants chiming in--along with many who thought they knew much more than they did after reading a Wikipedia article or two. That's bloggin'
I personally don't think I will be looking for another blog site if this one gets too close to fading to black, but right now it still keeps me coming back.