| The OPEC meeting - How much will production really increase? | The Oil Drum | Tech Talk - The Oil under Los Angeles |
TOTAL’s view on future oil production
Posted by Rembrandt on June 10, 2011 - 1:43pm
Since 2006, the international oil company TOTAL has consistently voiced warnings about the future inability of the oil industry to meet continued oil demand growth. In 2006, then CEO Thierry Desmarest stated that maximum oil production lies between 100 to 110 million b/d, reached potentially by 2020. Only a year later the new CEO Christophe de Margerie announced that it would be difficult for the industry to produce beyond 100 million b/d, a message that became and remained 95 million b/d in subsequent years (1), (2), (3), (4). To better understand how TOTAL arrives at this view, the organizers of the 9th international ASPO conference asked the company to give a presentation on why they expect a plateau in production around 95 million b/d. In this post I give a summary of that presentation, given by Pierre Mauriaud, TOTAL Exploration Training and Technical Image Manager (PDF of presentation) (watch presentation VIDEO).
In the first part of his presentation, Pierre Mauriaud described a number of graphs and trends well known to those who study Peak Oil. These included the discovery trends outlining peak discovery in the 1960s, changes in OPEC oil reserves in the 1980s, and the Hubbert curve that shifted due to the 1973 and 1979 oil shock. He made the important statement that TOTAL does not trust any published numbers, but works on the basis of their own geological data to estimate resources, reserves, and production potentials depending on the geology of the basin.
The modelling of tens of thousands of oil fields
Pierre Mauriaud told the audience about their internal team that for a number of years has carried out an analysis on all oil fields in the world, to assess what is geologically possible to produce. Their geological model is probably fairly complex, and was not shared in detail, but an illustration was given via a simplified version. Mauriaud gave the distinction between North Sea Clastic and Middle East Carbonate reservoirs. The main difference is the behavior of water and oil in the sedimentary rock at a pore level. In a clastic reservoir only oil will be produced in the early lifetime of the well. The produced water content will begin to increase when around 20% to 30% of the ultimate oil reserves are produced, shown in figure 1 for an unnamed clastic oil field in the North Sea.
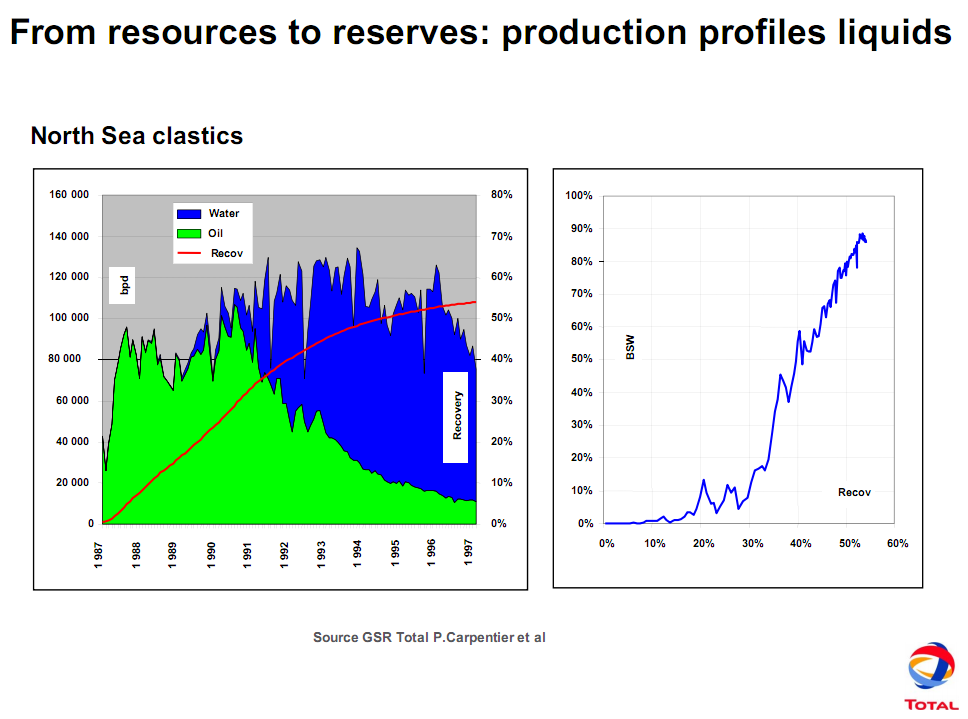
Figure 1 - Production profile of a North Sea Clastic Oil Field. Source: Pierre Mauriaud, TOTAL (click for large version)
Together with the increase in water content of production in a clastic reservoir, overall oil production begins to decline, a process which can be postponed only marginally according to Mauriaud.
“After 20 or 30% of production in the field you get more and more water, whatever you do. There are a lot of little things you can do to improve it, but on the long term you cannot produce more. There are extremely good reservoirs in the north sea where you can produce up to 50%, but normally the average world you cannot get more than 35-37% of oil because you get more and more water. And that is the case for all clastic reservoirs such as in the north Sea and deep offshore fields.”
The oil to water content of production is highly different for a carbonate reservoir, where the oil “sticks” to the rock and water is also initially found between the pores. Mauriaud told the audience that when a reservoir is in this case produced too quickly much more water is produced and the oil recovery factor declines. The reason is that the oil can become immobilized once the water front has gone past the pores. In general water production along with the oil in these reservoirs comes very quickly already at the beginning of production, shown in figure 2 for an unnamed Carbonate oil field in the Middle East.

Figure 2 - Production profile of a Middle East Carbonate Oil Field. Source: Pierre Mauriaud, TOTAL (click for large version)
By doing the exercise above in a more detailed manner for various different basins TOTAL found a clear pattern in that all fields begin their decline around 25% to 30% of the oil originally in place (OIIP).
“Whatever the size of the field, you can put Ghawar the biggest field in the world and a very small one together, there is some physical law that after a recovery of about 25% - 30% of the Oil Originally In Place (OIIP) in the reservoir oil production will begin to decrease.”
In performing their analysis, TOTAL created their own view on how future oil production in different regions will develop. Mauriaud mentioned in his presentation that once the geological decline begins it is inevitable, except for a few small upward bumps which do not change the decline trend much (shown in figure 3 in the case of the UK). Also, he made the prediction that the decline in Russian oil production will begin once about 60% of all potential to produce reserves are produced, implying that Russia will peak around 2014.
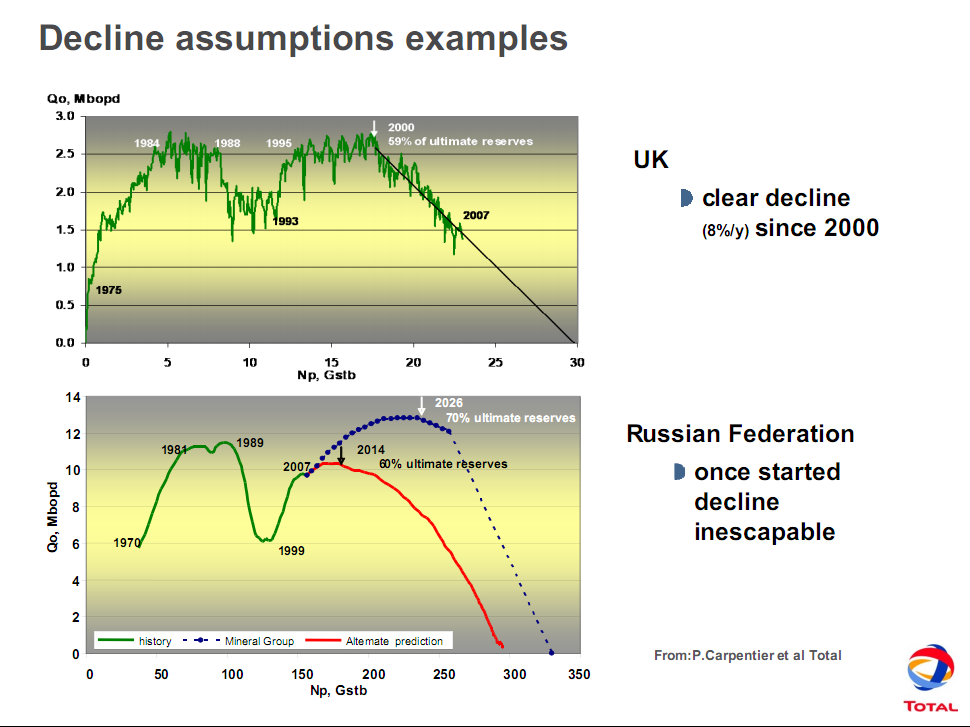
Figure 3 - Production expectation for Russia. Source: Pierre Mauriaud, TOTAL (click for large version)
The key message behind TOTAL’s Peak Oil Expectation.
Just like in past public statements by TOTAL, Pierre Mauriaud mentioned that their key message is not one of a lack of resources. According to the company there are plenty of resources left, including conventional oil. The problem lies in turning these into reserves due to the need for advanced technology, large scale investments, and a lack of resource accessibility of international oil majors.
“When I was thinking about the highly technical and huge investments needed, it is sure that the time of cheap oil is finished and has been for some time. It is something which is absolutely obvious, and the low-cost cheap oil is only remaining in OPEC countries in the Middle East…there are all these more technical oils such as deepwater, extra heavy oil, arctic oil, which can be produced but only when the price is right, and which depends on the law of offer, supply and demand, due to which oil demand is very important”
To underline this view, he presented a highly interesting graph depicted in figure 4 with data on TOTAL’s expectation for production costs of different types of oil, denoted in the break even oil price in 2010 at an Internal Rate of Return (IRR) above 10%. The more technical projects, including enhanced oil recovery and extra heavy oil, require an oil price range between 60 to 90 dollars to give a decent return.

Figure 4 - Break even oil price range in 2010 required to produce a certain type of oil. Includes all sources of oil. Source: Pierre Mauriaud, TOTAL (click for large version)
The cost, lead times, and probably other factors such as unavailability of production inputs like water not mentioned in the presentation, leads TOTAL to believe that it will be difficult to meet demand in the future. Although not explicitly stated by Mauriaud, but mentioned in earlier interviews, TOTAL does not see the international oil majors able to sufficiently increase production by the more complex technical projects. The new detail beyond previous statement’s from Mauriaud’s presentation is the relative quantification given of which regions will be the major producer in the future, as shown in the chart “oil production by 2020-2030 around 95 million barrels per day”, shown in figure 4. This chart shows the relative decline and increase in several world regions, without any quantified number to really know what is going on. From this we can learn that TOTAL sees oil production as stagnating and declining in all regions except for the Middle East. The Americas (Canada and Venezuela) will be able to increase Heavy Oil production significantly, but that is not going to be enough to compensate for mature conventional oil production in the OECD, at least if the bars in the graph are scaled similarly as one would logically expect. Based on this, it can be inferred from the chart that TOTAL expects 45% to 50% of the 95 million b/d will come from the Middle-East in 2030.
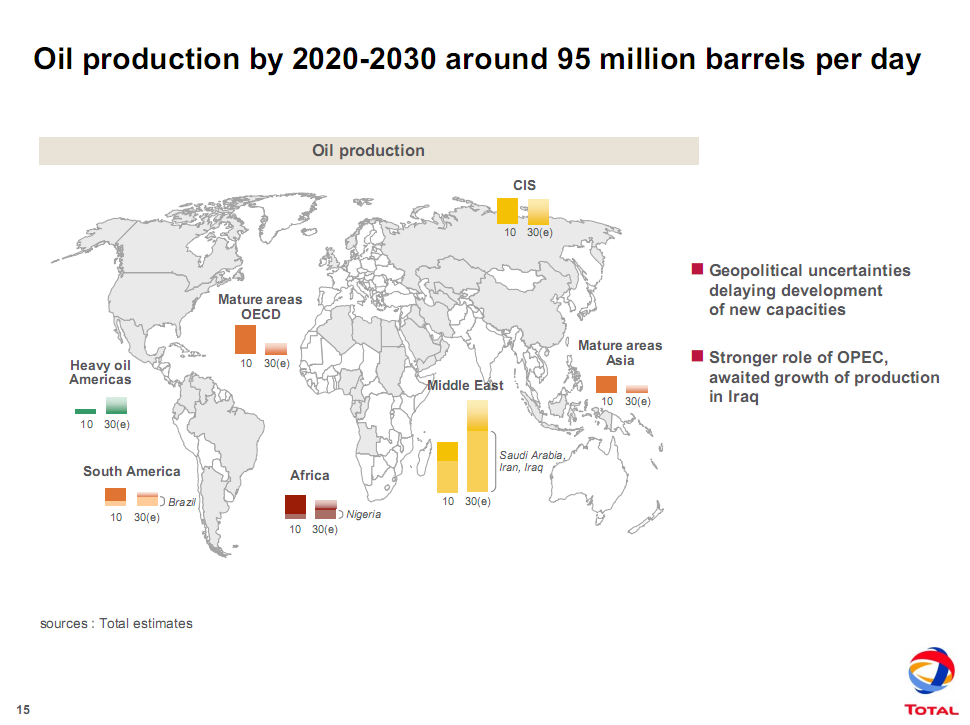
Figure 5 - Total's expectation for oil production in 2030. Source: Pierre Mauriaud, TOTAL (click for large version)
A stable plateau, or large shocks and deviations?
The 95 million barrels per day production level stated by TOTAL is based on a geological comprehension of what is possible, but does not incorporate political changes at a national level nor economic changes in the world economy as also explicitly mentioned by Mauriaud:
“What we will produce is around 95 million b/d mostly in the Middle-East, it will not be flat, no way, just think about what is now happening in the Middle East, between Yemen, Egypt, just think a minute what happens if this happens in Saudi Arabia…that could be going back and forth…basically linked to how the oil is produced the Middle-East produces very slowly and they have good reserves [I think he means large here or good reservoirs].”
To summarize, according to TOTAL the world can likely not produce over 95 million barrels per day due to constraints in producing more technically challenging oil fields such as deepwater, heavy oil, and fields located in the arctic. Furthermore, such a production level is only possible if the countries in the Middle-East, especially Saudi-Arabia, Iran, and Iraq, will be able and willing to increase their production.
Contact
- Content: editors at theoildrum dot com
- Tech support: support at theoildrum dot com
License

This work is licensed under a Creative Commons Attribution-Share Alike 3.0 United States License.
If I'm reading this right, he suggests that Iraq is going to be the saviour of the world, dramatically increasing production (KSA won't, Iran can't). This seems similar to Stuart Staniford's "Iraq Could Delay Peak Oil a Decade", which he's recently stepped back from on the basis of above ground factors, and real world performance. Even the IEA doesn't expect that 10Mbpd increase to come off.
If they are right, then 6Mbpd of that prediction is moot for a start. Add to that the difficult of getting heavy oil to scale quickly or far and he comes into line with the prevalent view here.
Pity he won't open source his model and data though. Allowing people to play with that could really get talk about imminent decline taken seriously.
garyp
The difficulty is the political instability of many of these countries, where predicting events and production is impossible.
Did you predict Libya would end up producing a quarter of what it did last year?
This is one of the most honest appraisals you will get from an oil company, so don't knock it.
Not knocking it, just identifying where I think he's being very, very, optimistic. Iraq *could* pull a rabbit out of a hat, but I'm seeing no signs so far that its better than a 1 in a 100 shot.
Iraq will take 3/4 years to build the export terminal facilities they need, their increase in production will not pull a rabbit out of the hat but it will determine global decline rates.
The great message from Total is that the world will not produce what is needed and even getting to 95mbd will cost an awful lot of money.
Here is Peter Well's conjecture on Iraq from a few years ago:
Which would allow OPEC the following production:
And that translates into the following:
So they are in the same ballpark.
Also, Total's projection doesn't seem to include The Great Oil Squeeze we are headed for:
Still, I agree with Jaz that this is the closest to reality an oil company is being in public...I appreciate their candor.
I think Mr. Peter Wells is a little optimistic as far as Iraq goes.
Iraq crude oil production January 2005 thru May 2011 in Thousands of barrels per day.
As you can see they jumped by about 200 kb/d in January of this year and have been flat since. Their production in May, according to OPEC's OMR was 2,655,000 barrels per day, just about what it was in January. The chart above has them well above 4 million barrels per day by this time and climbing almost straight up. That just ain't gonna happen in my opinion.
Ron P.
Oh, I thought he was optimistic when I first saw those charts. To be fair, they are now over two years old.
If you impose a grid on Wells's graph with a photo editor you can see he forecast right around 3 mb/d for 2010, so I'd say the jury's still out. Opposition has made a firm rebuttal, though: UPDATE 2-Iraq may cut oil output capacity goal -minister | Reuters
Here is what the EIA shows for Iraq total petroleum liquids production and for consumption for 2008 to 2010:
2008: 2.39 mbpd - 0.61 mbpd = 1.8 mbpd (rounded off)
2009: 2.40 - 0.64 = 1.8
2010: 2.41 - 0.74 = 1.7
At the recent rate of increase in consumption, Iraq would have to produce 3.1 mbpd in 2020 (an annual rate of increase in production of 2.5%/year), just to maintain net exports of 1.7 mbpd.
In any case, the first goal for Iraq to get past is to match or exceed their Late Seventies production rate of about 3.5 mbpd. Note that Russia is only just now approaching the absolute peak that they had back in the Eighties, and they have virtually been on a production plateau since 2007, with a very slow rate of increase in production, after 2007, versus the rapid rebound prior to 2007.
As I have noted several times, we have seen clearly defined peaks in regions like Texas, in 1972, and the North Sea, in 1999, despite the fact that these producing regions (collectively accounting for about 9% of total global cumulative crude oil production through 2005) were developed by private oil companies, using the best available technology, with virtually no restrictions on drilling
And of course, the initial production declines in both regions corresponded to huge increases in oil prices. Annual oil prices on vertical axes and C+C production on the horizontal axes:
Based on Deffeyes’ modeling, global conventional C+C production in 2005 was at about the same stage of depletion that the North Sea was at in 1999, and so far global annual C+C production has not materially exceeded the 2005 annual rate of about 74 mbpd and in fact we have seen a cumulative shortfall, between what we would have produced at the 2005 annual rate and the actual production for 2006 to 2010. This is in marked contrast to the rapid increase in production from 2002 to 2005, and annual crude oil prices have all exceeded the $57 US annual price that we saw in 2005, with four of the past five years showing year over year increases in annual oil prices.
As the Texas and North Sea case histories show, once conventional production peaks (in the absence of political factors) in given region, there may not be an oil price, at least a realistic oil price, that will keep conventional production on an upward slope. So far, this is what we have seen globally, with slowly rising unconventional production keeping total global C+C production on a plateau.
Total petroleum liquids really don't look any better. At the 2002 to 2005 rate of increase in total petroleum liquids, we would have been at about 94 mbpd in 2010, which would have been consistent with CERA, et al's projections, but let's look at what actually happened. Here are BP's latest data for for global total petroleum liquids:
2005: 81 mbpd
2006: 82
2007: 82
2008: 82
2009: 80
2010: 82
2005 is just barely shy of rounding up to 82 (and without the US hurricanes in 2005, it would have rounded to 82 mbpd, but there are always disruptions of some type around the world).
westexas
It is not obvious, but from slide 17, he is talking not just about C&C but deep water, ultra deep, extra heavy oil Arctic and also shale oil potential. He implies that the world needs to invest much more but may not be able to pay for it.
As long as the crude oil meets their minimum quality standards, I don't think refiners care where the crude + condensate comes from, and the global C+C numbers include all sources.
As we previously discussed, the most important thing is the inflection point in 2005, following a three year period of rapid increases in production.
Had a look at the PDF of the presentation slides (linked above the fold).
The last one, on page 17, shows a scenario for the world energy mix from 2005 to 2030. I think this is outdated already... it has coal's share dropping from 25% in '05 to 22% in '30. But as Gregor has been harping on for some time, the world turns to coal:
I find it mind blowing that we've actually entered the era of resource wars. I reference today's news of the cable "cutting" of the Vietnamese oil research vessel by the Chinese fishing fleet. we've gotten to the point where we are actually fighting over physical reources... at least overtly.
And that makes it even more clear that we have a robber economy. We had mostly been robbing our children and the destitute. Now we have to resort to old fashion robbing each other.
Thanks Rembrandt. Very helpful.
Please explain "BSW" in Fig. 2. It appears to be the % portion of water to total fluid (oil + water) produced.
@David
The figure 2 indeed shows & portion of water to total fluid produced. I don't know what BSW means it's probably a geological term?
R - BS&W = basic sediment and water. When a well goes on production it's not uncommon for a small amount of water and rock material to be produced with the oil/NG. The water isn't part of the natural water drive portion of the reservoir but comes from the pore space that is predominantly occupied by the hydrocarbons. The distinction is made between BS&W and water production because "water production" implies the onset of depletion. BS&W does not.
@Rockman
Thanks for the explanation on BS&W.
Interesting.
If the world peaks at 30% OOIP(conventional) and it has used 1Tb then the OOIP is 3.33 Tb. If conventional recovery is another 15% then that's another 500 Gb of oil and assuming a straight-line decline of 3% per year that would be exhausted in 33.3 years; 2x 500Gb/30Gb/a =33.3
If EOR can recover 10% of OOIP that's another 333 Gb of oil.
So assuming EOR is used to support oil production, at a combined straightline decline of 2% per year, the world easily could produce 10 Gb/yr in 2044.
That's not including superheavy oil and bitumen which is another trillion barrels of oil, based on a recovery for unconventional oil of 10%. It may be that the peak in unconventional is at 10% OOIP or 1/3 of conventional oil so that would be about 25mbpd
around the year 2100 or straightline growth of about 0.25 mbpd per year.
This scenario starts with a decline from a current peak at 30Gb/yr down to 10 Gb/yr in 2044(2% per year) and then steady at 10 Gb/yr past 2100 based on no new oil but with EOR and unconventional oil. The world can still move 'stuff' around with 1/3 of the petroleum we waste now.
We can avoid a Kunstlerian future.
The problem is a terrible lack of investment(speculation is NOT investment, it is an abuse).
Speculation is setting the correct price. It is a service to the market.
Of course the price is $150 per barrel in today's dollars. What is the world demand at $150 per barrel?
@Majorian
>If the world peaks at 30% OOIP(conventional) and it has used 1Tb then the OOIP is 3.33 Tb. If conventional recovery is another 15% then that's another 500 Gb of oil and assuming a straight-line decline of 3% per year that would be exhausted in 33.3 years; 2x 500Gb/30Gb/a =33.3<
Where do you obtain the 10 Tb figure from? To my understanding the world's initial endowment of conventional oil is estimated between 7 an 10 Tb showing the large uncertainty in the figure.
The USGS reports 1 trillion barrels of unconventional oil with a
10% recovery rate so I conclude that the amount of unconventional OOIP is 10 trillion barrels.
http://pubs.usgs.gov/fs/fs070-03/fs070-03.html
The USGS reports 1 trillion barrels of unconventional oil with a 10% recovery rate so I conclude that the amount of unconventional OOIP is 10 trillion barrels.
Well, no. The USGS is assuming about a 13% recovery rate for the world's heavy oil resources, and a 32% recovery rate for Canada's bitumen resources, plus about a 13% recovery rate for the rest of the world's bitumen resources. That would give a total for the world's unconventional OOIP of about 6 trillion barrels.
If you add in the world's conventional oil, which they estimate at 952 billion barrels recoverable, and assume an average 24% recovery rate, the conventional OOIP would be around 4 trillion barrels and the total OOIP (conventional+non-conventional) would be close to 10 trillion barrels.
We're both wrong on unconvention OOIP but you were closer.
(Of course I left off oil shale completely.)
Maybe 3.6 trillion barrels unconventional OOIP with (531 + 238 -40 ) 729 billion barrels recoverable for a recovery rate of 20%=729/3600
My point was that the oil is there if anyone wants to get it.
The 3.6 trillion barrels of unconventional OOIP they cite is just for Venezuela and Canada.
The USGS is claiming that there are another 168.6 billion barrels of recoverable heavy oil outside of Venezuela and 119.8 billion barrels of recoverable bitumen outside of Canada, for a total of another 288.4 billion barrels of oil.
Assuming an average recovery rate of 13%, that gives another 2.2 trillion barrels of OOIP in the rest of the world, for a total of 5.8 trillion barrels of OOIP. Then, they claim there is another 212.4 billion barrels of bitumen-in-place in small deposits in Russia, which gives a total of close to 6 trillion barrels of unconventional OOIP. They could have said that up front, but they didn't.
The fundamental problem for countries that want to continue to use oil at current rates is that this oil is going to be much slower and more difficult to produce than conventional oil and will never achieve the same production rates. There will still be a peak in total oil production in the near future, and the main effect unconventional oil production has is to stretch the decline curve out for a century or more, rather than following the steep decline in conventional production we are likely to see.
And of course, the document doesn't include the US "oil shales" (kerogenic marlestones) which are going to be even slower and more difficult to produce than heavy oil and bitumen.
the oil shales in the u.s. and pasquia hills in canada may be years away,but like the oilsands in the late 60's they will be producing one day,and at close to 1 trillion barrels they will make a difference.
Both the OOIP and URR are guesses that improve with time as more evidence comes in. (see the discussion on Bayes Rule in this thread) I can imagine that the some of the early OOIP estimates contained a significant fraction of water misidentified as oil. How would the geologist actually know the percentages without a lot more evidence early on?
So as time goes by, the concentration focuses on URR and the OOIP becomes less of a factor, or it gets corrected to remove that water fraction. If it doesn't get corrected at least some of that OOIP will never get achieved because the estimate consists of water.
I haven't seen any discussion on the topic of misidentification of liquid content.
Do they identify the 'liquid' content using core samples, or by remote sensing?
Then again there are 1.7 trillion barrels of OOIP bitumen in Alberta.
http://en.wikipedia.org/wiki/Oil_sands
and 1.2 trillion barrels of Orinoco oil sands plus inconventional oil here and there in NA.
http://en.wikipedia.org/wiki/Orinoco_Belt
Oil shale reserves amount to 2.8T barrels OOIP.
Today China is the largest producer of oil shale oil producing +400000 Mt of shale oil at ~$18.46 per barrel at Fushun.
http://en.wikipedia.org/wiki/Oil_shale_in_China
http://en.wikipedia.org/wiki/Oil_shale_reserves
I just can't see how you can end up with 6 Tb OOIP, maybe 4.5T; 3.6/0.8=4.5
Heavy oil and bitumen are not confined to Venezuela and Canada. There are substantial amounts of heavy oil and bitumen in the Middle East, Russia, and other places worldwide. This is the source of the extra OOIP.
The whole issue is somewhat academic, however, because most of these resources, outside of Canada and Venezuela, are nowhere near being put on production in this century. Maybe in the next century?
This is an impressively clear presentation from an oil company representative. What I am wondering about is why Total is so blunt and (almost) admitting that peak oil is about now, whereas others (especially BP) keep on the lulling track that we should not worry. The latter looks more logical (although unethical) to me for an oil-selling company, whereas Total's openness sounds to me like a drug dealer saying "Heroine will become expensive, so you should overcome this habit."
Being responsible for a billion dollar business I don't think that the Total managers don't know what they are saying. So does anyone have a clue if the company has a "hidden agenda" or why they make these statements?
They are French. Maybe the French are more honest. Less afraid of the truth than the English.
More committed to nuclear is I think closer to the mark. I agree its a French thing, due to the French commitment to nuclear, they don't have the same fear of openly talking about oil running out.
BP were one of the first on AGW, and is a British thing that goes back to Maggie deciding it was a possible threat to Britain in particular. Subsequent research has failed to show that a rerun of the Younger Dryas is a likely consequence of AGW, so Britain is not as keen on AGW as it used to be as its no longer seen as a particular threat to Britain rather than a general global one. So the politics has retreated to rhetoric and BP has retreated from Beyond Petroleum.
I rather suspect BP reflects a Russian attitude rather than a British one these days too. As Nixon put it, "When you've got them by the balls, the hearts and minds follow"
@drillo
I don't think that TOTAL is blunt, they are very considerate especially in relation to other oil companies and most people within for example ASPO. The task of modelling all the world's oil fields, carefully thinking about your assumptions etc. is a good effort. This also shows in how they think about operating in difficult regions (far different stance then for example Shell).
As to the impact of such statements, I think they are limited as the bottom line is relatively similar than for example Shell, but the phrasing is by far different (and the oppennes in taking ASPO people serious). One of the reasons is the influence of Jean Laherrere.
R - Maybe there's another factor that I don't have time to research right now but maybe you know: who owns TOTAL? Am I remembering correctly that the French govt owns (or use to) a big chunk of the company? If so maybe the govt has pushed a little reality into the picture to help deal with the public and the inevitable. There could also be a bit of profit motive: if there were a public oil that wanted to get public support (i.e. get them buying its stock) they could frame the PO situation and, at the same time, show that their understanding of the situation puts them in the position of benefiting financially.
Remember I've worked in the oil patch for 36 years and have seen countless promoters "mine" private investors by offering very gloomy pictures of future oil shortages/high prices. Think about it: what story would make it easier to raise capital: there lots of oil in our future so your investment will make a lower return or that oil will be running out and you'll make a killing if you give me all your money and let me drill?
And yes, if it isn't obvious: I don't take the words of any public oil as gospel or assign a moral motivation. Been doing this too dang long. LOL.
RM - The state involvement idea sounds reasonable (the french govt is heavily involved in nuclear energy in order to reduce oil imports, is promoting electric cars etc.) but in fact according to Wikipedia the company is private and was from the start a private sector company (it was listed on the Paris Stock Exchange for the first time in 1929).
Asking for public support might be a motive (especially from a US perspective, where this works perfectly well; also the public warnings might have been motivated by an attempt to curb he high taxes on oil companies) but I am not sure if this works in nuclear-focused France, under the anti-subsidy control of the EU commission.
Well, this only works if I can be sure that you'll find a profitable oil field with my money. Otherwise...
drillo - Thanks for the research....been trying log a well that's given me fits.
"Well, this only works if I can be sure that you'll find a profitable oil field with my money. Otherwise..." Well in my 36 years I've seen greed shove billions at drilling projects that had little chance of working. We call them money disposal wells. Did you see my tale about a promoting oil company that drilled 18 dry holes in a row during the boom in the late 70's and the senior guys retired millionaires?
And it is true: the term we actually use is "stupid money". And it rolls in by the truck load when the oil patch booms.
Rockman, I don't have to go that far back to think about the first time I realized what "stupid money" was. A Japanese LLC in the GOM decided to start an exploration program shortly after an aquisition program. They decided to do this around 2005-2007. The problem was that all the "good hands" from the top to the bottom of the food chain were all working during that busy period. Well since they didn't want to pay top dollar to get the best people, they didn't get the best, far from it.
What they ended up with was a bunch of people they met in Houston's bars these cats gave real drunks a bad name. One of our shore base dispatchers was a stripper just before landing the shorebase dispatcher job. She sent out a load of equipment on a crew boat manifested as "a load of red thingys". Well it was red.
We had one well in particular that we had drilled in about 40 foot of water out of West Cam (I think) that one cost as much as the average deep water well. We flow tested the well and I asked the well test supervisor when he was going to start to flare the well, laughingly he said, he was. The flame was about the same as when his butane tank was on prior to opening the well. The fields flow line pressure had to be lowered just so the well could just buck the system pressure.
The Japs got screwed for years before they realized what was happening. It was a poorly ran "brother in law" operation, if you were a vender or service company and you were in with the President of the company you could get in on the action easy. They wasted money like it was being sent from Japan with no strings attached(it was). I had never seen something so blatant before.
Your absolutely right, the higher the commodity prices get the harder it is for some E&P companies to make money especially if they get caught in a mania of sorts.
Is it? "be greedy when others are fearful and be fearful when others are greedy" I may have butchered that quote, but you get my drift!
At the time this Total’s guy was showing his slides, the company was investing 1 billion €uros in SunPower a US PV manufacturer:
http://www.pv-tech.org/news/total_to_buy_sunpower_as_it_makes_major_play...
I can tell you that they are working on other renewable solutions, it is a little sign showing that something is really going on….
I watched the entire presentation video. The very last slide showed oil production increasing slightly until around 2020 then remaining flat until 2030. And he stated during the presentation that we will not leave the oil age because we run out of oil. Is this whole presentation nothing but more cornucopian BS from another oil company? This whole chart seems totally unrealistic to me.
But I would love to hear from others who thinks this is a realistic chart.
The bottom beige zone is Oil, next going up is biofuels (dark blue sliver), gas, coal, nuclear (in red), then biomass excluding biofuels, hydro and the very top is solar, wind, etc.
Ron P.
An alternative outlook follows. (2005) top five net oil exporters' (about half of global net oil exports in 2005) production, consumption and net export numbers through 2006, along with Sam's projections and actual data for 2007, 2008 and 2009 shown circled. BP shows about 20.8 mbpd in (2005 top five) net exports for 2010, versus 23.7 mbpd in 2005.
The five year decline in top five net oil exports, about three mbpd, is equal to twice what Libya net exported last year.
Following are what we show for Global Net Exports (GNE), using the updated data, with revisions, through 2010:
Global Net Export Data*
2002: 39.1 mbpd
2003: 41.6
2004: 44.8
2005: 45.5
2006: 45.5
2007: 44.6
2008: 44.5
2009: 42.3
2010: 42.6
*33 net exporters with 100,000 bpd or more of net exports in 2005, BP + Minor EIA data
Saudi net oil exports were down from 7.3 mbpd in 2009 to 7.2 in 2010. Note that Russian net exports have been at or below 7.1 mbpd since 2007. The (2005) top five went from 23.7 mbpd in 2005 to 20.8 in 2010. So, the (2005) top five fell by about three mbpd over a five year period, while the bottom 28 showed basically no change from 2005 to 2010.
Chindia's combined net oil imports went from 5.1 mbpd in 2005 to 7.5 mbpd (inclusive of the rather curious increase in reported Chinese production). In any case, their combined net oil imports, as a percentage of GNE, went from 11.2% in 2005 to 17.6% in 2010.
So Available Net Exports (ANE), i.e., GNE not consumed by Chindia, fell from 40.4 mbpd in 2005 to 35.1 mbpd in 2010. I'm projecting that ANE will be down to about 27 to 30 mbpd in 2015.
I 'understand' this chart.
It shows continuity and slow growth(1.3% energy growth) rather than a disaster.
http://en.wikipedia.org/wiki/Rule_of_succession
As the days go onward it is surprising how little change has occurred in our lives.
And it also shows all energy peaking after 2030.
Laplace's rule of succession eventually evolved into Bayes Rule. The example that Laplace used with the sun rising was laughed at by quite a few people at the time and it actually worked against adoption of Bayes Rule for a long while. People knew the odds of the sun rising was a lot higher than what Laplace's rule told us.
Bayes Rule most practically applies when you have uncertainty in some behavior and then you update your belief based on the evidence that you acquire. If there is some physical evidence or theory, such as the earth revolving around its axis, then you don't need Bayes Rule and Laplace's original rule is also unnecessary and overly confuses things.
A better way to understand how people reason about trends is to use the heuristics of dead reckoning (to get at slopes) and that of moving averages (to get rid of noise). Dead reckoning is essentially looking at the most recent slope and expecting it to continue at that same slope. If there is an acceleration or deceleration in the slope sometimes you will see someone apply that as a second-order correction, but that is in general how people think about these charts. They have no other understanding of the underlying behavior or process and therefore put their head in the stand.
Majorian obviously sees the deceleration in the curve and imagines the peak at 2030, so he is doing a mental second-order dead reckoming in his head. We have to realize that for a lot of people even that kind of mental agility is not possible, and many likely don't even understand what a graph represents.
Given that the graph is two years old and it already does not match the actual productions I would not believe it.
One thing missing is price. He assumes investment will be as large as needed to get the result he wants. He assume oil buyer will pay as much as needed to get the result he wants. These are both false assumptions.
@edpell
I agree with what you are saying about the chart, but don't agree with what he (Pierre Mauriaud) or TOTAL assumes. They realize very well that it is unlikely that this will occur as such, that sufficient investment will be forthcoming etc. If you read the post I wrote above you can find that he mentioned the political situation in Saudi-Arabia.
There's a difference between the technical stance of what is geologically possible (and what is shown in the chart) and the economic/political environment. My co-organizer of the conference, Patrick Brocorens, also discuss just about this with Pierre Mauriaud of TOTAL after the presentation.
We need graphs of oil production versus year at several different price per barrel (ppb) points. The peak will move out as the ppb moves up. At some ppb we exceed the cost of alternatives like oil from algae and then substitution takes place. The question is of course what ppb can we afford to pay? This is not one number for the whole world it will vary by region and by class within a region. The folks in Palo Alto can afford $400 per barrel. The poor in Bangladesh can afford $20 per barrel(?) and will consume little even at that price.
We need graphs of demand versus ppb.
@edpell
Basically we need a solid sturdy general equilibrium model....with proper assumptions.. but that's difficult to make with some many unknowns
Edpell's point is valid, but price really masks falling net energy. If you take figure 4 and turn it upside down you have a chart of Energy Returned on energy Invested. That shale oil (in this case kerogan in marlstone) will likely never be produced because the net energy is zero or worse.
Here in the US the cost of energy is already too high to maintain the size of our current society. Bridges are falling, roads decaying, water systems leaking, etc. Our net energy is already too low. From looking at net energy over time about 20:1 or higher is needed for growth and 3:1 is absolute minimum *.
(* for any energy source that makes up more than a fraction of societies total. Society can choose to waste energy on making energy as much as it can waste energy building pyramids or fighter jets. But not much of the total energy supply and not for long.)
Edpell,
What you are saying is that we need to know the demand curve for oil; that would show different quantities of oil demanded at different prices. The problem is that the demand curve for oil can shift rapidly as global rates of economic growth change. If I knew what global economic growth was going to do, I could come up with a reasonably accurate demand curve for oil.
But neither I nor anybody else knows what is going to happen to global GDP growth. And the situation is (mathematically) complex, because to a large extent the price of oil influences the rate of global economic growth. What we are now seeing is economic growth being choked off by high oil prices. But if global GDP growth goes negative, the demand for and price of oil will decline. If global GDP growth remains positive, the demand curve for oil will shift up and to the right, though perhaps slowly.
Of course, if we are interested in oil prices, then we have to look at oil supply as well as oil demand. Net exports of oil have declined since their peak in 2005, and they will continue to decline because depletion outruns discoveries of new oil resources. The decline in supply could lead to higher oil prices even if global demand for oil stagnates.
The price of oil will continue to be volatile, because oil is price inelastic for both demand and supply. In other words, small changes in either supply or demand cause large changes in price.
Not sure if its been posted, but Total purchased US based solar company Sunpower, for about USD 2.3 Billion a couple of months ago. They certainly believe in the future of solar PV, and are putting up real cash to buy into this exponentially growing industry.
The French are forward thinking nuclear and solar. Basically independence. Or is that "Liberty, Equality, Fraternity".
I don't think it's got anything to do with Total == Good and BP == Bad, the Total presentation reads like a ransom note to me.
What they are doing is using the spectre of peak oil to demand more investment, in the hopes that frightened investors who are afraid of losing their initial capital tip in some more so that Total can exploit more difficult / expensive fields.
The shape of the production profile liquids looks interesting, as it is quite different from the regular Hubbert curve (with its production peak at 50% of the recoverable reserve). According to the graphs in North Sea clastics there is a long plateau period and the decline starts when more than 50% is produced, whereas in Middle East carbonates the decline starts very early (much before 50% is produced).
Are the Total graphs more accurate than the general Hubbert's rule or is there another explanation?
The classical Hubbert curve only applies if the time span is long enough for technology and demand acceleration to take into effect.
Usually this doesn't occur if you are looking at a single reservoir or field. There is some maturation over time, but typically the extraction is maximized toward the front end and then the asymmetric takes over.
Not really, the normalized North Sea fields do not converge into a classic Hubbert shape:
Weighted toward front, not much of a plateau
----
That entire discussion of water/geology differences is a bit of a diversion. Everything about oil extraction is about proportional draw-down. The amount of oil is always like the following to first order, where X is the amount left:
deltaX = -k*X*deltaT
this says that we will remove a proportion of the amount left with proportionality constant k. Since the amount left can mix with water it gives something akin to a partial pressure (if it were a gas and followed Boyle's Law).
This goes to dX/dt = -k*X and the solution is
X = Xi * exp(-k*t)
where Xi is the total amount extracted.
To second order it will differ from this simple exponential (due to the detailed fractional flow argument and also to the gradual initial rate at which extraction matures as it comes online) but you can't hide the fact that there is a finite amount that is in every reservoir.
Drillo – I’ve noticed there’s been a little mixing of apples and oranges with respect to curve shapes. The shape of the production curve of any region, from a county in S. Texas to the entire world, is a function of at least two independent factors. First is the production profile of a reservoir. A distinction was made between carbonate and sandstone reservoirs as to rapid and slower decline rates. Actually the distinction is more between granular and fracture porosity. There are many carbonate reservoirs that have porosity character more similar to a sandstone reservoir.
But to the point: a water drive sandstone reservoir will have a flush period of high rate water free production. As the water level reaches the perforations the water cut will rise and the oil yield decreases. And it’s not uncommon for such reservoirs to produce profitably at water cuts above 98%. It’s also not uncommon for the second half of the URR to take 5 to 10 times as long to produce as the first 50%. A fractured reservoir often does not have such a strung out life but can still be somewhat skewed.
Now let’s consider the production profile for Texas. In the early 1900’s some of the larger fields went into production. And then there was the huge E Texas Field in the 1930’s. And then another series of big discoveries in the late 40’s-early 50’s. As you can imagine if new major fields come into production as the previous big fields go into steep decline the combined production curve won’t look like either one. Now imagine this time lag effect applied to many thousands of large fields around the globe. And stretched out over 60+ years. Obviously if all the world’s fields came on at the same moment the profile would look more similar to a single field. But there’s a bit more complication: above ground factors. Consider the huge drop in global oil production brought on by the drop in global consumption during the 80’s recession. Not only did it stretch out the life of older fields but also delayed new discoveries.
Now to the subject at hand: the shape of the curve going forward. If there were no new future discoveries and no major above ground affects it might not be too difficult to plot. That is if we were given the details from the KSA et al. But we’ll set that problem aside for now. Now all we’re left to do is predict the profile profiles of all future discoveries. And, of course, have them spaced out properly in the time domain. No problem there, eh? And don’t forget the complications of predicting their decline profiles. Just consider the very hot Eagle Ford play going on in Texas today. As long as oil prices stay high operators will be drilling like crazy. We’ve already seen a leveling off in the Texas decline rate. But the EF wells are showing severe decline rates…up to 90%. So to keep the oil rate up a lot of wells will have to be continually drilled. That means correctly predicting the economic conditions that would allow this level of activity. No problem there, eh? LOL.
Which is why I wouldn’t argue much with anyone’s prediction. Any plot will have to make some big assumptions. For instance: billions of bbls of oil have been proven in the DW Brazil. But vitally none of the new grease is on production yet. So now predict the timing of those fields coming on line over the next 20+ years. And then don’t forget to predict the decline curves of all those fields starting production at vastly different times. And while we’re at it we also need to predict global recession induced consumption declines.
You first: On your mark…get set…GO! Oh...wait...I forgot. You need to get all that detailed production history from all those exporting countries who have refused to share that info for the last 40 years.
That last seems to make the over-elaborate mathematicalization of models of global production/depletion look like the polishing of ... things that don't polish well.
No the problem that Rockman has is that one can't describe the production profile behavior with words alone, as it is prone to misinterpretation and ambiguity. There is a reason that one should apply some math and at least attempt to do a formal model of the behavior -- as it is concise, unambiguous and reproducible by anyone else that wants to take a stab at quantifying the empirical observations.
I saw this post by Rembrandt today, transcribed the interesting new data provided in the TOTAL presentation and fit my current model to the data. That's another reason why you do mathematical modeling -- it provides a means to do regression tests against your previous understanding. Any new data that doesn't agree with your previous model will become immediately apparent, and you don't have to invent a new narrative in English to explain why you don't understand what is going on.
Web - Actually think I painted an absolutely beautiful word picture that perfectly shows the problem of predicting the future production rate. I think you've done an outstanding job modeling future discovery volumes. Now I'm anxious to see your model for the future production rate curve and see how it compares to my qualitative analysis.
My model converges fairly closely to what TOTAL has used for their presentation
http://www.theoildrum.com/node/8001#comment-811807
The two models are around 5% apart largely because TOTAL has some stronger earlier backdating in their data which leads to my model having a slightly smaller URR.
The big difference is really in attitude. TOTAL is being somewhat more forthright but still don't present their model in a completely open manner and so you still have to infer the piece parts. OTOH, what I try to do is keep the model completely open and transparent. The fact that these approaches may eventually merge is a good thing.
$110/barrel is the range where large scale replacement in the form of algaeoil can take place. http://www.solazyme.com (this company recently IPO'd) I find it interesting that KSA is so adamant about keeping the price below this level. In a way crude oil just competes with sugar. And there is enough sugar in the form of macroalgae in the worlds oceans to bury the world in algae oil THROUGH FERMENTATION.
TOTAL according to the linked PDF document estimates a cumulative discovery number up to 2005 of over 2300 billion barrels which is higher than the number published by Laherrere of 1930 billion barrels.
This is about a positive 20% difference.
Then look at Figure 4 and it has a fuzzy URR at around 2800 billion barrels of oil. The number for 2300 billion barrels ends at the line for Arctic exploration, and that for 2800 billion ends up at the fuzzy boundary at oil shales.
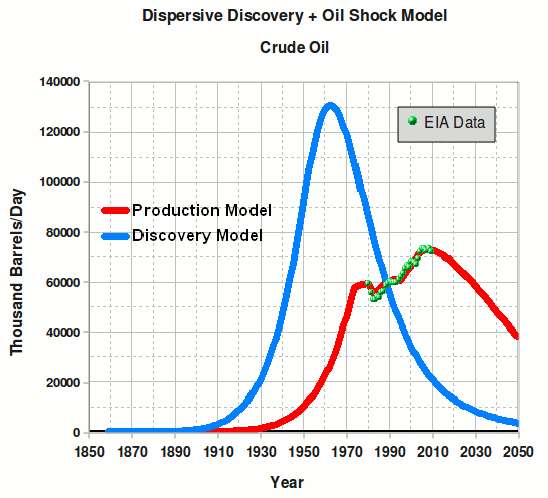
I also used 2800 billion barrel URR for the Dispersive Discovery/Oil Shock model and estimated a production peak at around 2008. This is what you would call a conservative approximation for how much oil we will eventually extract and still leave an extended tail based on the current extraction rate.
When I compare the Dispersive Discovery Model against the TOTAL discovery data it looks like this:
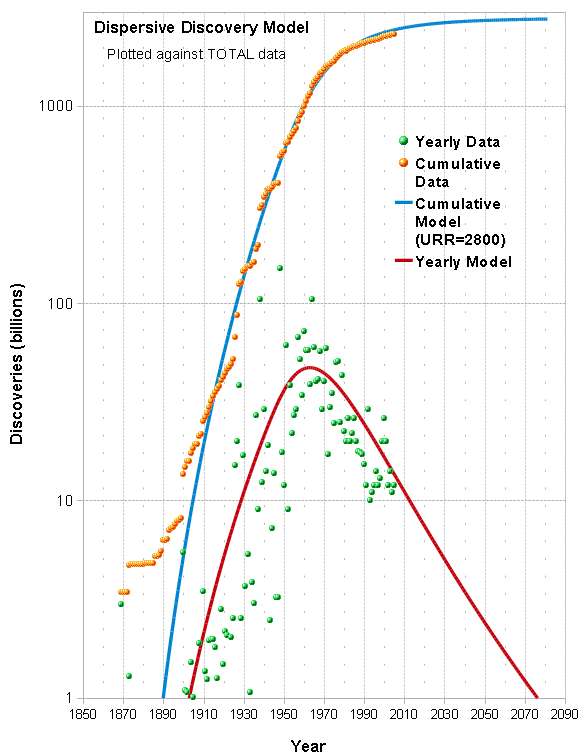
Note the asymmetric tail in the discovery peak which is a remnant of fat-tail dispersive effects. Lots of discoveries will continue to dribble in, but it will still show a gradual diminishing return.
There is one significant observation that I want to point out based on the data. For one, TOTAL revealed some inconsistency by both publishing their discovery with URR data and claiming “oil production by 2020-2030 around 95 million barrels per day”. No way can they up to this production level in 10 to 20 years without placing a huge extraction pressure on the current and future reserves. What I can conclude is that this specific claim has to include the category of ALL liquids.
If this is indeed the case, it matches what we have thought all along. The discovery data is only about the crude oil and the production takes into account any kind of liquid fuel that they can include. In other words, the usual confusion between crude and all liquids.
@webhubbletelescope
>There is one significant observation that I want to point out based on the data. For one, TOTAL revealed some inconsistency by both publishing their discovery with URR data and claiming “oil production by 2020-2030 around 95 million barrels per day”. No way can they up to this production level in 10 to 20 years without placing a huge extraction pressure on the current and future reserves. What I can conclude is that this specific claim has to include the category of ALL liquids.<
I don't recall such an inconsistency, where has TOTAL stated that oil production of 95 million b/d does not include extra heavy oil, polar oil, EOR, oil shales etc.? Or do you mean with all liquids also coal to liquids, gas to liquids etc.?
>I also used 2800 billion barrel URR for the Dispersive Discovery/Oil Shock model and estimated a production peak at around 2008. This is what you would call a conservative approximation for how much oil we will eventually extract and still leave an extended tail based on the current extraction rate.<
What happens if you model Middle-East and non-Middle East separately? I think the basic idea behind the TOTAL model at an aggregate level is a (relatively) slow decline in NON Middle East compensated for by a large increase in Middle East. Would it be possible to then reproduce the production shape as per slide 17 (at least until 2030)?
Rembrandt
>What happens if you model Middle-East and non-Middle East separately? I think the basic idea behind the TOTAL model at an aggregate level is a (relatively) slow decline in NON Middle East compensated for by a large increase in Middle East. Would it be possible to then reproduce the production shape as per slide 17 (at least until 2030)?
I think you have this the wrong way round. The basic idea is that there is still lots of oil available to be produced in the Middle East (slide 11 in the linked pdf) and that Middle East oil rates decline slowly, so it will last.
So you need to ask what that 34 years of production at current rates on slide 11 actually is, and I suspect it might be OPEC reserves being taken at face value. If you believe that Iran, Iraq and Saudi have the reserves they say they do, I think you should find his 2030 projection credible. If you think the actual investments being made in production belie the reserve claims, you should discount that 95 down towards 75 depending on just how inflated you reckon the reserves are.
Well, they (TOTAL) have the discovery curves available in their PDF presentation and so one can apply an extraction convolution to get an idea of what the production profile would look like.
Based on the fact that I modelled a discovery profile that looks very similar to the TOTAL discovery profile up to 2005, I am able to make some good comparisons. For one, I wasn't able to extend the peak much beyond 2008 without having to up the average yearly extraction rate from reserves above 4%. The value of 4% looks like a good mean value, but increasing this towards 10% will defer the peak a bit but at the expense of a stronger decline once the extraction can't be maintained.
Go to the http://theoilconundrum.com to see the production profile I modelled
But like I said, if they are using all liquids for production numbers, yes the peak will extends, but it is no longer a crude oil peak.
Right...and let's not forget that the Total production is likely impossible because it would require a depletion rate for yet-to-be-found fields far above 7%, the historical rate at which oil has been extracted. Not impossible but very, very unlikely.
See section 3.2 of:
The Peak of the Oil Age - analyzing the world oil production Reference Scenario in World Energy Outlook 2008 (Energy Policy)
http://www.tsl.uu.se/uhdsg/Publications/PeakOilAge.pdf
from the Uppsala Global Energy Systems Group.
It's one thing to say the oil is there to be discovered, it's quite another thing to say it can be produced at the rate required. The International Energy Agency basically ignored historical depletion rates and allowed themselves to draw some lines on a graph the looked pretty and showed no decline for the foreseeable future.
But if they had applied some rigor they would have checked whether the oil could be extracted at the rate those lines required and discovered that the graphs were basically bull___. If I recall correctly, the depletion rate the graphs from WEO2008 required was 14% — double what the world has seen so far.
I suspect that Total's future production requires equally untenable — and unsurfaced — assumptions.
The 7% extraction rate from reserves was definitely the historical average up until the first real oil crisis of the 70's and 80's. The shock forced all the oil companies to scale back that number to around 4%. This was possible to do at the time as the oil crisis drove consumers and industries to become more conservation aware and the suppliers no longer opened up the taps as wide as they could.
It will be interesting if this extraction rate starts creeping up again. It is a hard number to get at because it is really the proportional extraction rate from provable reserves, essentially the P/R ratio, and the provable reserves takes some modeling to reveal. When you think that a lot of the deep water and shale sources have fast declines, it definitely will have an effect.
Thanks Rembrandt,
For me, Figure 4 in your article demonstrates clearly the dramatically increasing cost gradient required to sustain a total petroleum liquids production plateau over time. Conventional economists assume that capital will flow to where the profit is. However, our increasingly risk-averse society - which may well come to include oil companies and investors, if not already - may increasingly balk at such cost gradients and the inherent risks involved. Likewise, because capital is becoming increasingly scarce, as 'easy oil' capital formation is drying up, the market will enforce a major restructuring of the spatial organisation of society - away from the oil dependent mobility paradigm that dominates today.
n-l-e
I am not a proponent of fast decline after the peak or plateau of world production, but in the same time I have a hard time to believe that we can maintain a plateau at 90millions of barrel from now to 2030 as the curves of Total suggest, when they say on one side that we can't trust the reserves of OPEC and on the other side that oil fields start to decline when the rate of recovery reach 30%. But maybe they know things that we don't know. I guess that they count on the non conventional oil to offset the conventional oil
Me, too. See my comment above about the mistake the IEA made with their 2008 model. Completely unrealistic. I haven't sat down to do the math for Total's projections but my guess is that Total has done the same thing the IEA did: failed to confirm that yet-to-be-discovered fields can produce at the rate required by their projection.
This is a the result of applying the same parametric shock model on the TOTAL discovery data.
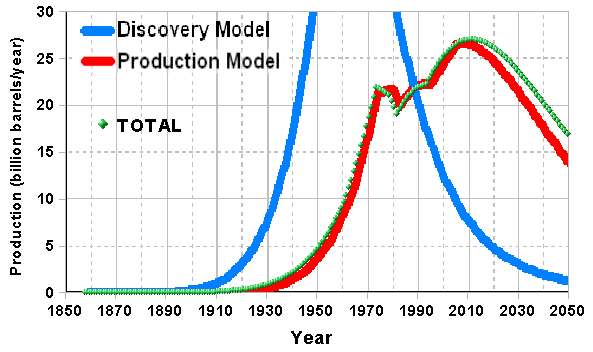
The two projections are pretty close, TOTAL will defer the peak by perhaps two years from what I had (2008 to 2010 maybe). I don't know how TOTAL collected their discovery data, apart from that it says it is based on IHS Energy 2006. My discovery data used Laherrere and applied maturation to the numbers so that the cumulative would approach 2800 billion barrels, which is close to the number that I can infer from the TOTAL data and what they say in the PDF presentation.
I will likely update my model with this new information which is applying Bayes Rule the way it is meant to be applied, averaging in the new information with the old information, thus converging on a better projection.
This analysis appears to be several years old. I wonder how it would be affected by the inclusion of Bakken-type oil shale.
The current projections for production from the Bakken field appear to be in the range of 1M bpd, and there are a number of fields like it in the US and elsewhere. They appear to be economic over $60/b, and costs appear to be stable or falling even with growing scarcity of drilling-related resources (rigs, labor, etc).
How does that change things?
Nick - I don't know enough about the Bakken or how many Bakken-like fields exist around the world. But I do understand the other red hot fractured oil shale play in the US fairly well: the Eagle Ford in S Texas. The initially flow rates as high as 800 – 1,200 bopd are initially impressive until you understand that a decline rate of 90% is not uncommon. One particular well mentioned by some cornucopians came on at about 950 bopd and produced 180,000 bo during its first 12 months. But they fail to mention that after 12 months the rate was down to 97 bopd. Just a rough guess but this well netted around $10 million during the first year. Pretty good for a well that probably cost $4-6 million to drill and complete. Any payout less than a year is considered a great hit. Unfortunately it will take over 250 years to reach one more payout. And that's exactly why my privately owned company isn't in the play: not enough profit. So many of the wells will be profitable but they have no significant life beyond the first couple of years. This explains why all the big players in the trend are public companies: they can satisfy Wall Street’s demand for y-o-y reserve increases. But the decline rate requires a never end trend mill of activity to replace those high decline rates. But as long as oil prices stay high the play will be drilled as fast as possible. But that was the same model for the shale gas plays. And the collapse of NG prices crushed that model to a fair degree.
The high decline rates will be common in all such plays around the world. BTW: as the EF play heated up lease costs jumped 20X to 40X what they were initially. And drilling/completion costs have gone up over 30% and are still rising. But this is normal in all boom trends. Just looking at Texas the oil production rate stopped its decades old decline and has leveled and rose a tad the last few years. The EF will likely improve this trend but given the high decline rates I don’t expect a huge ramp up: we can physically drill only so many wells at one time and we’re getting close to maxing out soon. So IMHO these plays might slow PO up a bit but I doubt it will be a major game changer.
The EF will likely improve this trend but given the high decline rates I don’t expect a huge ramp up: we can physically drill only so many wells at one time and we’re getting close to maxing out soon.
There was an article about the Bakken in TOD several years ago by an oil hand that said the same thing. He pointed out the same problem with decline rates and predicted a peak below 200k bpd and a fast decline thereafter. Instead it's closing in on 400k and is expected to reach 1,000k in several years (based on planned capacity for pipelines, etc).
Have you seen a good source for statistics for EF production??
Nick - I have access to THE complete and accurate source of EF stats: DrillingInfo. That data comes directly from production reports sent to the Texas Rail Road Commission by each operator. I can pull detailed monthly stats that are up to date. Perhaps I'll offer to do a post in the near future. But it's still a tad early to document URR projections: too few wells producing for too short a time. The trend is still expanding and all trends have sweet and sour spots so you have to be careful about dispersion.
But even as low as my expections were I was still a bit surprised by how much worse the decline rates are so far. That I can clearly show now and is very illuminating IMHO.
Decline rates are certainly an important factor.
On the other hand, I think anyone who's looking at these fields understands that, and some analysts seem to be projecting much more than your comments would suggest. I'm not sure how useful decline rates are in isolation - it looks like you really need to do a quantitative analysis that's more complete in order to understand what's going on. I would think the starting place would be overall monthly production from the field, and then start breaking things down.
Again, that earlier TOD post thought that decline rates would prevent Bakken production from rising above about 200k bpd, and it's rising towards 1,000k. There's no sign of a collapse in oil prices that would hurt the business model, as happened with NG prices.
we can physically drill only so many wells at one time and we’re getting close to maxing out soon.
Could you expand on that last? Is the primary limit the number of rigs? How is that affected by new techniques that increase the number of completions from one drilling site?
Nick – I’m not sure I understand what you mean about “isolation”. An EF well may come on at 1,000 bopd but within just a few years that well has no relevance to our oil supply. Nothing isolated about that. In a few years from now there could be 1 million bopd coming from the EF. But if no more EF wells are drilled after that point in time that volume reduces to insignificant in just a few years. Compare that to Ghawar Field which is still significant decades after its discovery. Perhaps I’m assuming too much: the EF is not a field. It is a trend. Or another way to look at it each well is one field. Thousands of potential fields but fields that will be producing a significant amount of oil just for a couple of years. I’m not sure what sort of economic analysis you might be thinking of. I can calc an estimated URR of the 16 EF wells that are over two years old but that’s a rather thin count to hang much on IMHO. Drilling may have started in a sweet spot that will yield a much better average URR than the rest of the trend. Or just the opposite: there may be an untested area that will yield 3X the URR we’ve seen so far.
So I would prefer to just stick with the facts we now have: a limited number of EF have been completed. They appear to be profitable in general and should support more drilling as long as oil prices stay high. But despite tremendous initial production rates individual wells will have very short significant productive lives: a couple of years. Increased drilling will increase EF production over time. But the rapid decline rates will require an every expanding drilling effort to sustain such a ramping up.
Much of the equipment used to drill, complete and frac the EF wells was maxed out months ago. At one point Petro Hawk had drilled 36 EF wells but only 14 were producing because they were waiting on frac trucks. Some service companies are expanding equipment lines but not as fast as needed for a variety of reasons. For instance to build a frac truck you need a powerful turbine. Last time I heard the delivery time from those companies was 12 to 16 months. Drill rigs: the drillers are not rushing here either. Last time they ramped up rig construction to satisfy the E Texas shale gas drilling boom many lost their butt when that play died. That didn’t happen too long ago so the memory is very fresh. It typically takes many years for equipment capex to payout so companies are cautious.
And now let’s talk personnel. All the equipment in the world won’t help you if you don’t have experienced hands running it. All it takes is one mistake to turn a $6 million successful well into a $10 million loss. And we ain’t getting younger. Also, I remind folks that 95% of the physical operations are done by the service company hands and not company employees. And these same hands are in big demand around the world. And overseas gigs typically pay better. A month ago I was lucky to have a hand diverted from his trip to China to one of my wells for a week. And my well wasn’t an EF.
Bottom line: a 1000 new EF drilled tomorrow might up our production by 1 million bopd. But less than 5 years out (maybe a good bit less) they’ll be producing an insignificant amount. But it would be great for the oil patch, the land owners and Texas production tax revenue. Also would help a bit with our trade imbalance. And it will hang in there as long as oil prices stay high and the trend holds.
The bottom bottom line: the EF is a commercial play today and allows all those public companies prospects they desperately need to keep Wall Street happy.
I think a big part of what you're saying is that we don't have enough info for good forecasts - it could rise to 1M bpd...or not. It could sustain 1M for a long time...or not.
The Bakken continues to exceed expectations, but that's a different play.
Is there a good public source of data on EF production?
Nick - A public source but either difficult to mull through or a little costly. One can access the data free from the Texas Rail Road Commission but it's a somewhat messy/inefficient process. But for a couple of $thousand a year anyone can get a subscription to DrillingInfo and access all this data on line instantly. And with their included software you can generate 100's of different data plots in an afternoon just by making simple mouse clicks. Essentially you can down load the entire EF production history into one giant detailed Excel spreadsheet in about 30 seconds.
And yes...I could d/l that data to everyone on TOD in less than 5 minutes. But that would be unethical: I signed a contract that said I wouldn't give or sell the data to anyone. And I may be a "dirty oil company bastard" but I'm an ethical dirty oil company bastard. LOL. I don't bootleg music CD's/DVD's either.
But go to drillinginfo.com. At one time they were offering a free short term teaser license
Rockman,
According to the ND Petroleum Council: "On average, it takes approximately six weeks to drill, fracture and complete a well."
Does that sound right?
If that's the case, then if very high decline rates make it necessary to replace each producing well basically every year, then to maintain level production you'd need about one rig for every 8 wells doing replacement wells, right?
Nick - I haven't seen enough numbers but they probably get an EF well completed a little quicker...maybe 5 weeks plus rig more. Rig up and rig down + move can take a week to 10 days unless you're drilling on the same acreage. Then more like a week. So one rig can drill about 10 wells a year. To maintain a level rate you'll need to replace each GOOD well in two+ years. If you drill 25 wells in the first month they might average 400 bopd each for the first 12 months. That's an average of 10,000 bopd. But they started out at 20,000 bopd and finished the year at 2,000 bopd. So to replace that average 10,000 bopd you need to drill 20 wells that average 400 bopd during the first 12 months of their lives. So now you have 45 wells doing an average of 200 bopd ((25 x 40 bopd + 20 X 400 bopd/45. Take that cycle forward and you'll be produce ever more bbls of oil/day (as long as you keep replacing depleting wells) but your average producion per well continues to drop. Thus you have to drill more than the replacement wells if you want to really ramp up total production. But those additional wells will need to be replaced also because they'll have the same high decline rate.
Bottom line: as long as oil prices stay high they'll keep drilling EF wells (until they eventually drill up all the many thousands of locations) but in the end all of these many thousands of wells will be at or near stripper level except for the last two years of drilling. So maybe in 10 years we'll have 5,000 EF wells but 4,800+ will be strippers making a total of less than 70,000 bopd. Only the wells drilled during Year 9 will have a significant production rate above a few hundred bopd. And by Year 11 or 12 those graet wells will join the stripper club.
So at the end of the day the real impact of EF will be determined only by the last couple of years of drilling. Even if 20,000 EF are drilled by that date the vast majority of those wells will be strippers and only amount to less than several hundred thousands of bbls....and maybe even less than half that amount. IOW the EF is not even a small partial fix for PO IMHO.
If we drill 20,000 wells over 10 years then we're drilling 2,000 wells per year.
The 18,000 old wells might produce 15 bpd each, for a total of 270k bpd. If the 2,000 new wells produce an average of 400 bpd, that's 800,000 bpd.
That's a total of more than 1 million bpd. I'd say that's a substantial contribution.
Now, the next big question would be how long we can drill 2,000 good wells per year...
Nick - Substantial for that year they produce 800,000 bo. But just a few years later those same wells will be producing closer to 50,000 bopd. And that's my point: there is a lot of oil recovery potential from the EF as long as prices stay high but the production rate isn't sustainable without every increasing drilling activity.
Again, don't mistake my pessimism re: the EF putting a dent in PO with a lack of enthusiam for the play in general. This is the only play in the Gulf Coast that will allow a lot of companes to prosper/survive for a while longer. Even though my company wouldn't touch an EF well with a 10' pole the play is of tremendous benefit to us: If the public companes weren't throwing $billions at the EF in the future they would be using that capex to compete with us for the little conventional drilling we have left here in the US.
And that's the problem the cornucopians refuse to acknowledge. Whether it's an EF well coming on at 1,200 bopd or a new DW GOM coming on at 300,000 bopd: these are very short terms gains compared to the old giant fields that are the backbone of global production. These fields, and more importantly, these long field lives, are not being replaced. Yes...many billions of bbls of oil left to recover. But not at sustainable rates to allow BAU much longer IMHO.
BTW: 2000 wells/year = around 200 rigs drilling non-stop. Can be done but will truly tax the system to its limit IMHO.
200 rigs drilling non-stop. Can be done but will truly tax the system to its limit IMHO.
It looks like oil prices will stay above $80 for the foreseeable future. So - wouldn't we expect the whole oil field services industry to expand indefinitely, as long as there is business?
Which brings us back to the next big question: how long can we drill 2,000 good EF wells per year?
nick - Just my guess but you won't see the service companies expand as quickly as the operators would like. First, they expanded pretty fast a few years ago to take advantage of the shale gas drilling boom in E Texas. With the NG price bust many of those companies went under due to the debt load they took on to expand. And more than a few operators were flushed down the toilet with those service companies. This memory is very fresh in everyone's mind...especially the bankers who loan out the capex. But if oil prices stay high long enough some expansion will occur. But there's a good 12 to 24 month lag time for the major equipment to reach the market once it's ordered. None of this stuff is sitting on a shelf somewhere.
And like I said: having the new equipment is one thing...having a competent hand to run it is another. Even the least skilled position takes a few years for a hand to "braek out" and be able to contribute on his own. And then there's the wear and tear on the quipment as well as loses from having inexperienced folks working for you. Less than an hour ago I got a picture of a dozen frac trucks burned to ground on an E Texas Haynesville well. Despite it being against standard safety practices someone decided to fill the gas tanks on one of the trucks while it was still runing. A total loss of $32 million (which insurance might not pay a penny due to negligence) as well as a loss of revenue perhaps over $100 million. Frac trucks are the most highest demand of all oil field equipment today
you won't see the service companies expand as quickly as the operators would like.
I'm sure you're right - these are classic boom and bust cycle dynamics, and the last cycle was pretty recent.
The NG boom and bust demonstrates how difficult forecasting is: everyone had been predicting nothing but higher NG prices since as far back as 1980 (Hubbert among them), and here we are back at low NG prices.
Could shale do the same thing to oil? I agree that it seems mighty unlikely, but I can see pretty easily a point in the not too distant future where the US eliminates oil imports fairly painlessly through production increases and consumption decreases.
Nick - Just got an update on the rig count in the EF: 157. If 8 - 10 wells/year/rig is a good guess then we're talking 1,200 to 1,500 wells per year right now. And the system is fairly wll maxed out. If nothing else we should have some pretty good production stat in a couple of years. IMHO with a 2 year production history the URR for every well should be pretty accurate.
Here's total monthly oil production from North Dakota. A key point to keep in mind is that not all production from North Dakota comes from the Bakken Shale.
Thanks for the chart westexas. I wonder if any savvy chart geeks here can overlay charts of the North Dakota rig count and the price of oil on this chart?
A key point to keep in mind is that not all production from North Dakota comes from the Bakken Shale.
True. Other areas still exist, though they're declining. We would see a higher growth rate if we isolated Bakken production.
Conversely, it's important to keep in mind that the Williston/Bakken extends beyond North Dakota in neighboring states and Canada, and things are happening there as well.
About 25% of the Bakken Formation is in Saskatchewan. The effect on Saskatchewan production was not as pronounced as on North Dakota because Saskatchewan has other major oil fields as well, and its oil production was already over 400,000 b/d. The Bakken play will just turn a slow decline in total oil production in Saskatchewan into a modest increase.
It's worth pointing out that when you see exponential growth curves such as North Dakota oil production, that these are almost invariably just the first part of a logistic curve. At some point the curve will pass the saturation point and level off. The real question mark is what production rate it will level off at.
Yes, the rate of increase looks a bit more linear than exponential, lately. It's obscured a bit by seasonal variation - we just had a bad winter.
I follow the North Dakota Industrial Commission, Department of Mineral Resources, Oil and Gas Division at https://www.dmr.nd.gov/oilgas/
They could be any number of curves that look similar to a logistic curve.
What you are describing is a leveling off to a carrying capacity. Unfortunately there is no such thing as a carrying capacity for oil. Because it is a finite resource, it always levels off to zero. Therefore this whole discussion of it following a logistic curve (in the sense of modeling a logistic carrying capacity) is completely misguided.
What you are actually thinking in your head is some sort of logistic model that levels off to a URR. That is better but still wrong. What we are actually seeing is a dispersion of rates over a range of subvolumes which ends up looking like a classical peak shape.
Except that we're not: US production is increasing, and that increase appears likely to continue for a while.
Geology is important, but so are economic incentives and technological change.
I wouldn't want US domestic drilling to distract from the important thing, which is kicking the addiction to oil - the more we do so, the better off we'll be, in many, many ways. OTOH, we have to be realistic: US production is looking less and less like a Hubbert peak shape, and on the whole that's probably good.
The last data that I saw show that US C+C production has been between 5.5 and 5.6 mbpd since the fourth quarter of 2009.
I'm looking at lower 48 oil production. That's the only fair thing to look at, for consistency's sake, right?
We see that the curve isn't symmetric: it rises a bit in 1985, drifts lower, then starts clearly rising in 2009.
Here's the data:
U.S. Field Production of Crude Oil (Thousand Barrels per Day)
Alaska Field Production of Crude Oil (Thousand Barrels per Day)
Net Lower 48 b per year
Hubbert Curve b per year
1930 2460 0.8979 0.69
1931 2332 0.85118 0.73
1932 2145 0.782925 0.78
1933 2481 0.905565 0.83
1934 2488 0.90812 0.88
1935 2723 0.993895 0.94
1936 3001 1.095365 0.99
1937 3500 1.2775 1.05
1938 3324 1.21326 1.12
1939 3464 1.26436 1.18
1940 4107 1.499055 1.25
1941 3847 1.404155 1.32
1942 3796 1.38554 1.40
1943 4125 1.505625 1.47
1944 4584 1.67316 1.55
1945 4695 1.713675 1.63
1946 4749 1.733385 1.72
1947 5088 1.85712 1.80
1948 5520 2.0148 1.89
1949 5046 1.84179 1.98
1950 5407 1.973555 2.07
1951 6158 2.24767 2.16
1952 6256 2.28344 2.25
1953 6458 2.35717 2.34
1954 6342 2.31483 2.43
1955 6807 2.484555 2.52
1956 7151 2.610115 2.60
1957 7170 2.61705 2.69
1958 6710 2.44915 2.77
1959 7054 2.57471 2.84
1960 7035 2.567775 2.92
1961 7183 2.621795 2.98
1962 7332 2.67618 3.05
1963 7542 2.75283 3.10
1964 7614 2.77911 3.15
1965 7804 2.84846 3.20
1966 8295 3.027675 3.23
1967 8810 3.21565 3.26
1968 9096 3.32004 3.28
1969 9238 3.37187 3.30
1970 9637 3.517505 3.30
1971 9463 3.453995 3.30
1972 9441 3.445965 3.28
1973 9208 198 3.28865 3.26
1974 8774 193 3.132065 3.23
1975 8375 191 2.98716 3.20
1976 8132 173 2.905035 3.15
1977 8245 464 2.840065 3.10
1978 8707 1229 2.72947 3.05
1979 8552 1401 2.610115 2.98
1980 8597 1617 2.5477 2.92
1981 8572 1609 2.541495 2.84
1982 8649 1696 2.537845 2.77
1983 8688 1714 2.54551 2.69
1984 8879 1722 2.612305 2.60
1985 8971 1825 2.60829 2.52
1986 8680 1867 2.486745 2.43
1987 8349 1962 2.331255 2.34
1988 8140 2017 2.234895 2.25
1989 7613 1874 2.094735 2.16
1990 7355 1773 2.03743 2.07
1991 7417 1798 2.050935 1.98
1992 7171 1714 1.991805 1.89
1993 6847 1582 1.921725 1.80
1994 6662 1559 1.862595 1.72
1995 6560 1484 1.85274 1.63
1996 6465 1393 1.85128 1.55
1997 6452 1296 1.88194 1.47
1998 6252 1175 1.853105 1.40
1999 5881 1050 1.763315 1.32
2000 5822 970 1.77098 1.25
2001 5801 963 1.76587 1.18
2002 5746 984 1.73813 1.12
2003 5681 974 1.718055 1.05
2004 5419 908 1.646515 0.99
2005 5178 864 1.57461 0.94
2006 5102 741 1.591765 0.88
2007 5064 722 1.58483 0.83
2008 4950 683 1.557455 0.78
2009 5361 645 1.72134 0.73
2010 5512 599 1.793245 0.69
2011 5547.5 537.5 1.82865 0.64
I was replying to what you wrote: "US production is increasing, and that increase appears likely to continue for a while."
In any case, regarding the Lower 48, note that if we do an HL projection using only data through 1970 to generate the model, the post-1970 cumulative production through 2004 was 99% of what the model predicted. As you noted, I'm sure that the post-1970 cumulative production through 2010 is now in excess of what Sam's model predicted it would be. Here is Sam's model and actual Lower 48 data through 2004:
Green dots (annual production data) used to generate the model, in red.
Yes, things can get confusing. I was replying to "What we are actually seeing is a dispersion of rates over a range of subvolumes which ends up looking like a classical peak shape."
if we do an HL projection using only data through 1970 to generate the model, the post-1970 cumulative production through 2004 was 99% of what the model predicted.
But I'm not sure what that tells us. The data through 1970 wasn't adequate to tell us in a robust fashion that we had hit a peak: this is a retrospective curve fitting which could have been done at several times before that point and produced an inaccurate projection. And, the model doesn't fit data through 2011.
Yes, US production has peaked, and Hubbert did a decent job of predicting it. What does that tell us about forecasting US or world production? Not as much we'd like.
This is all about stochastic processes. I essentially worked the USA uptick inside and out and summarized it here:
http://www.dailykos.com/story/2011/06/07/982757/-We-are-in-the-middle-of-it
The gist of the story is that about 17 oil wells came on line in the Gulf and these had a high enough rate that they made a difference in the recent uptick. This is really counting statistics and it won't have a long term impact because the gulf fields have relatively short lifetimes.
Now, why does this happen? It happens because the discovery process is probabilistic within the dispersive envelope. A few large productions can easily create upticks: http://mobjectivist.blogspot.com/2009/12/monte-carlo-of-dispersive-disco...
You can get something like this, green=discoveries, red=production

But then you can also get this with an occasional supergiant

I work out the dispersion analytically, which amounts to getting rid of the statistically variations and replacing it with the expected envelope.
Hubbert didn't actually have a model. He had a heuristic and it worked about as well as it was intended to do.
Well, how do we test this hypothesis statistically to verify that the uptick is within the normal range of random variation?
How do we know that it's appropriate to allocate the uptick to this set of wells, and not to the additional production from the Bakken?
The increase from the Bakken is not due to random variation in discovery. The Bakken increase is due to a change in technology/techniques/engineering - the field has been known for decades, but the roughly 300B barrels have been out of reach until lately.
I absolutely know it is from the gulf, assuming the data supplied by EIA is correct. There are 17 newly counted wells, all greater than 12,800 barrels/day which essentially makes up the ENTIRE difference from 2008 to 2009. I appreciate you asking about this because this is way too easy to deduce.
2008 data
2009 data
Bakken wells are all much smaller that 12,800 barrels/day. The biggest company has wells that average 200 barrels/day.
You didn't really answer my question.
Yes, you've identified a change in production. On the other hand, there was an increase in production in the Bakken of roughly the same size. If the Bakken production increase hadn't happened, then the production curve would have looked closer to a classic decline, and we would have said that the Gulf production was just part of the normal process. So, which is the outlier??
There is in fact an unexpected and very visible increase in overall Lower 48 production, which is three years old now. Basically, you're suggesting that this is just random variation. How long does it have to last to be not due to random variation? How do we test whether it's within the normal range of random variation? How do we prove this suggestion quantitatively??
How are we going to account for 2M bpd from Bakken-type oil shale? It's not a sure thing, but there's a pretty good chance of it. If it happens, that's definitely not going to fit into random variation of a Hubbert type bell-shaped curve.
Again, the increase from the Bakken (and other fields like it, like the Eagle Ford and the Niobrara) is not due to random variation in discovery. The Bakken increase is due to a change in technology/techniques/engineering - the field has been known for decades, but the roughly 300B barrels have been out of reach until lately.
I don't do the brain-dead Hubbert Linearization which assumes a symmetric shape, and have railed against it on TOD for as long as I have been here.
I have the asymmetric fat-tails in my discovery curves for the world and USA if you would care to look.
My global URR is 2800 billion barrels which is bigger than the conventional Peak Oil analysts by at least the 300 billion barrels you quote. What are you trying to say?
I don't do the brain-dead Hubbert Linearization which assumes a symmetric shape, and have railed against it on TOD for as long as I have been here.
I appreciate that.
I have the asymmetric fat-tails in my discovery curves for the world and USA if you would care to look.
Could you point me to the US production curve in your publication? Do you show the data?
My global URR is 2800 billion barrels which is bigger than the conventional Peak Oil analysts by at least the 300 billion barrels you quote. What are you trying to say?
I'm trying to deal with just the US. It seems to me that analysis of our historical experience leaves out two key things: technical change, and price feedback.
Our historical experience is based on a period where there wasn't a great deal of technical change, and on a field-by-field and country-by-country analysis, where depletion doesn't cause a price signal feedback. In our current situation we have permanently high prices, which is a new thing. It seems likely to cause a sustained increase in US production.
This is my model with the data along with it, note the skew to the right, which is about twice the amount to the left.

See http://theoilconundrum.com
Yes, that skew makes much more sense than the symmetric curve.
Still, we still have some problems: this model doesn't include technical change or price feedback. A URR of 240Gb would still be far too low if there were no substitutes for oil.
Fortunately, there are: electricity via HEV/PHEV/EREV/EVs. Ultimately your curve will probably be spot on.
The technical change is modeled as an acceleration in the mean discovery rate. For extraction the rate is kept constant at the current level.
The Lower 48 HL plot (using only production data through 1970) showed estimated URR of about 200 Gb, if memory serves, and through 1970 the Lower 48 had produced about 100 Gb, so it was at the estimated 50% depletion mark. I agree that URR for the Lower 48 will exceed 200 Gb, but it remains to be seen by how much, and I seriously doubt that these shale plays will make a really material difference, but we shall see.
The Lower 48 HL plot (using only production data through 1970) showed estimated URR of about 200 Gb, if memory serves, and through 1970 the Lower 48 had produced about 100 Gb, so it was at the estimated 50% depletion mark.
Which is what you'd expect: that's internal consistency of the model.
through 1970 the Lower 48 had produced about 100 Gb, so it was at the estimated 50% depletion mark. I agree that URR for the Lower 48 will exceed 200, but it remains to be seen by how much
Well, the Lower 48 produced 91.3 Gb from 1971 through 2011, and production is at 1.8Gb per year and rising. I'd say it's pretty clear we'll exceed 100 GB post-1970 by a wide margin.
I seriously doubt that these shale plays will make a really material difference.
The latest estimate is for about another 24 GB from the Bakken alone. "Production results for the Bakken formation in the Williston basin continue to improve with technological advances, prompting Continental Resources Inc. to estimate potentially recoverable reserves of 24 billion boe." http://www.ogj.com/index/article-display.articles.oil-gas-journal.volume...
The Eagle Ford is also important: "With the Eagle Ford Shale alone now expected to eventually deliver 750,000 to 800,000 b/d of oil, industry leaders repeated their growing enthusiasm Monday for a newfound focus on US oil plays over natural gas."
http://www.platts.com/RSSFeedDetailedNews/RSSFeed/Oil/6162878
You said 300B upthread: http://www.theoildrum.com/node/8001#comment-812606
Get yer story straight.
The roughly 300B is the total theoretical resource - actually, estimates have varied from 150B to 400B - I took a rough average. The official estimate of recoverable oil was about .1% of that up to about 3 years ago, then it went to about 1%. Now we're seeing industry estimates of 24B being recoverable - a 6x increase over just 3 years ago.
So....there may be 400B barrels, but all but 24B are still out of reach. Probably. At the moment.
Web/Nick - A little more insight into the Eagle Ford. Again, I can't research Bakken but it does appear to be a very different animal from the EF. Still not a large selection of EF wells with sufficient production histories. But here's a little meat on the bone: between March '10 and March 11 a total of 220 EF went on production. I pulled the max full monthly production for each well which obvious would be the first month it went on line. That averaged 434 bopd. That should average around 158,000 bo the first year. At $90/bbl that would yield about $9.8 million net of all royalty, production taxes and operating expenses. Not bad given that even with high lease cost the average well costs around $6-8 million. Any well that pays out in less than 1 year gives a very high rate of return. But based on the average decline of the first 16 wells that had at least two years of production history that 434 bopd average will drop down to around 50 bopd or less just 12 months after each well first began producing. Thus even if decline completely stopped it would take 5 to 7 years to reach a second payout. And the EF wells won't have that potential: they'll never be water drive strippers: once the pressure falls far enough they'll be down to a few bopd gravity drainage.
In a sense they are perfect for the public oils: as long as oil prices don't suddenly crash by 50% they can keep drilling EF as long as there is acreage left. They'll net little profit in terms of absolute $'s but that's not the primary goal. For those companies it's still about making Wall Street happy with y-o-y reserve increases. the down side: if or when oil prices eve take a nose dive their reserve base will drop so fast if they cut back drilling activity the stock values will crash just like it did for the shale gas players when NG prices collapsed. But until that happens the EF feeding frenzy will continue IMHO.
I pulled the max full monthly production for each well which obvious would be the first month it went on line. That averaged 434 bopd. That should average around 158,000 bo the first year.
If production starts at 434, is it likely to average 434 per day for the first 12 months? I've seen some reports of pressure being throttled back and production being smoothed out to maximize URR, and other reports of finetuning of techniques even during production - will those compensate for decline?
Are they paying the mineral rights owner a bonus on the start of production, or is it all per barrel? Is 1/8 still typical?
Nick - No...the decline rate shown by the first wells drilled with at least two years production history show a 90% drop. So an average well will make 434 bopd the first month and about 45 bopd during the 13 month. So the average per month for the first 12 months is around 240 bopd. Literally the first day you begin producing the decline starts. Again, that's one character that makes these plays "unconventional".
Nope - The wells flow at max rate from day one. These are pure pressure depletion reservoirs. Many wells are going on pump within 6 months because the reservoir pressure drops to low to push the oil up the tubing. Any fine tuning would be optimizing the stroke rate of the pumps. But that won't have any bearing on URR. That's why a year from now there will be very little debate over typical URR. That's one of the nice things about pressure depletion drive: the decline of volume or pressure are essential a straight line and the declines begin the second the well starts producing. Just like opening the valve on a scuba tank.
And royalty: 1/8 royalty on the Gulf coast were a thing of the past over 40 years ago for the most apart. Today if an operator in the EF isn't paying more the a 25% royalty he's lucky. The base royalty on most of those leases was around 25%. And then if company A took the lease at 25% royalty and then flipped it to campany B they might have pulled another couple of percent royalty off for themselves. Many of the big mineral owners in the Gulf Coast have law firms representing them in trades. There are a few rich mineral companies that you either give them a 30% royalty or they won't lease to you...ever.
Lease bonus: usuall paid up front. Before the play got hot: $100-300/acre. After it got hot multiply by 10 to 30 that amount. Also, if you get a 3 or 5 year lease the more savvy owners will require a yearly rental fee until you actually begin drilling. And in a hot play like the EF the rental fee might be equal to the initial bonus. So you pay a landowner $1,000,000 to lease his big tract of land and if you haven't spudded the first well within 12 months you write him another check for $1,000,000. And then another check 12 months later if you still haven't drilled. When he sees wells drilled across the fence on his neighbors lands he wants his wells drilled...NOW! LOL.
That's another reason the high activity level is costing companies a lot of money: you might have leased the land and have all your drilling capex reeady to go. But if you can't get a drill rig soon enough you'll start writting those big rental checks...or you lose the lease.
Ok, so a well that starts at 434 might decline like this?
1 434
2 402
3 370
4 338
5 306
6 274
7 242
8 210
9 178
10 146
11 114
12 82
13 50
1st yr Avg 258
1st yr Total 94,170
Gross Revenue ($90) 8,475,300
Gross Revenue of $8,475,300 would then be reduced by how much in operating expense?
You first have to take out the royalty, which as the Rock pointed out, is usually at least 25% now, and you also have to take out the severance tax, which is 4.6%, based on my checks, so call it 30% for royalty + severance tax. So the gross income to the working interest owners for year one, based on your specified numbers, would be about $5.9 million, before acquisition costs, drilling promotions, capital costs and operating costs. It looks like drilling & completion costs are running around $7 million per well.
I personally like my numbers a lot better. We just ran pipe on a developmental well which has 27' of net (high perm) oil pay at a depth of about 2,500', with an estimated completion cost of $86,000. It cost about a $100,000 to drill. Estimated recoverable reserves on a 20 acre unit are about 270,000 BO.
Boy, it sure looks like a golden goose that everyone (mineral rights owners, service providers, taxing bodies, etc) is trying to extract as much as possible from, while not quite killing it...
Nick - For the public companies it is as much as life preserver as a golden goose. If they didn't have these resource plays to boost their reserve base they would have lost $trillions in market cap over the years. I wasn't kidding: if the oil patch only had the little bit of converntion reserves left to develop in the US there wouldn't be enough activity to support 2/3 of the current companies. Just a rough guess but I think the public oils can still drill the EF all the way down to $70 - 80 per bbl. At that point they might just be getting $1 back for every $1 spent. But they would keep adding/replacing reserves base and keep Wall Street at bay.
I've seen a couple of industry comments that the Bakken is economic down to $60. It sounds like the EF is a little tougher.
Any thoughts about the Niobrara?
Nick - Sounds right given that the bakken appears to have a longer economic life. Don't no anything about the N.
That looks like Boyle's Law, proportional draw-down to first order.
Web - Exactly that. A mixed blessing: easy to project URR...no fat tails...no slope changes. but a challenge for reservoir managment. Mexico's Cantarell Fld is a good example of what pressure maintenance (N2 injection) can do for such a reservoir drive. Unfortunate, due the unconventional nature of these resource plays, pressure maintenance is rarely viable.