The OPEC Monthly Oil Market report for June
Posted by Heading Out on June 15, 2011 - 10:55am
With the turmoil in the Middle East and North African countries (MENA) now more evident in nature, the impacts on global oil production can be more rationally assessed. In this vein, the OPEC Monthly Oil Market Report (MOMR) for June has now been released. The main feature article looks at the prospects for the rest of the year, and as Leanan caught in Drumbeat, one of the major concerns has to be that OPEC supply, at current levels (28.97 mbd), does not reach the anticipated average demand for the year (29.9 mbd). However, putting that in context, MOMR begins by noting that the price of the OPEC basket fell $8.15 in May, to $110/bbl, so there are mixed signals in the air. Further, OPEC currently reports that they collectively supplied an average of 29.6 mbd in 2010, so that the increase in supply needed over last year is only 0.3 mbd.
As I mentioned earlier in the week, the disputes within OPEC have so far left the organization unwilling to sanction the increases needed to meet the anticipated imbalance. Whether this is a ploy by Saudi Arabia (KSA) to appear “friendly” to the customer, while bowing to majority rule and keeping supply tight enough to force prices higher, or whether the KSA will unilaterally release more oil is currently in question. The level of increase that KSA has suggested, 1.5 mbd, may appear to be larger than that needed to bring supply and demand into balance. Demand is seasonal, however, and is expected to maximize in the third quarter, during which global demand is expected to rise some 2.3 mbd, with growth continuing with a further addition of 0.2 mbd in the fourth quarter. Thus, in that context, it is interesting to see how the MOMR reflects the current organizational view of the next six months.
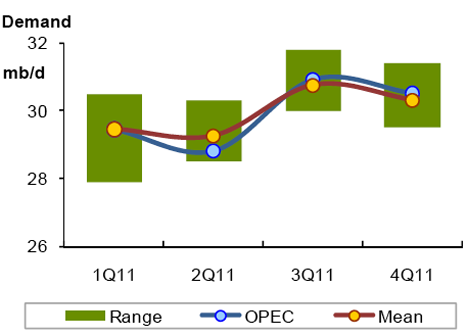
OPEC continues, as it has in past months, to anticipate a global increase in demand of some 1.4 mbd overall, led by economic growth in China and India. Given that this is an average over the year, with second-half increases offsetting first-half declines (which includes the drop in demand from Japan) this explains the larger supply need that will be required to keep markets in balance in the second half, at which time Japan is anticipated to show more signs of recovery. The report notes that it is not only the BRICS (Brazil, Russia, India, China and South Africa) nations that are seeing significant growth, but that, in part because they are now selling oil and gas on the international market, the Commonwealth of Independent States (the former FSU) will also see significant growth. Turkmenistan, for example, which is now selling natural gas into China, is projected to see growth of 8.1%. OPEC recognizes that increasing price will reduce demand, but are currently projecting that the range of this variation, should prices increase, would only be in the range of 200 kbd.
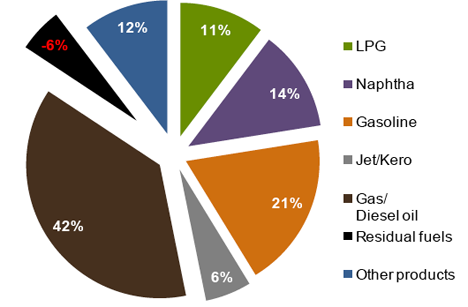
The particular growth in the diesel oil market is, in part, based on a projection that the continued drought in China will reduce the amount of hydro-electric power available, driving consumers to the use of diesel generators. It also recognizes that bio-diesel is entering the market, citing in particular Malaysia, but points out that even when the 5% biodiesel mix becomes national (it has just started to be available at stations), the production levels will be 10 kbd which, against a market demand of 542 kbd, makes it effectively insignificant. Internal Middle Eastern demand for oil is expected to rise to 7.4 mbd.
Given these increases in demand, it continues to be interesting to see where OPEC anticipates that the additional supply will come from. Non-OPEC sources are expected to produce about 0.7 mbd of the increase, so that if the demand increase of 2.3 mbd is to be met, this would explain, roughly, where the KSA suggestion of an increase of 1.5 mbd in production comes from. (And in that context the 28.97 mbd produced by OPEC in May was up some 171 kbd over April). Yet, if one looks at the overall OPEC view of where this year’s supply is to come from, it is particularly interesting to note the projection of no sensible growth in the 2011/2010 interval from the Middle East.
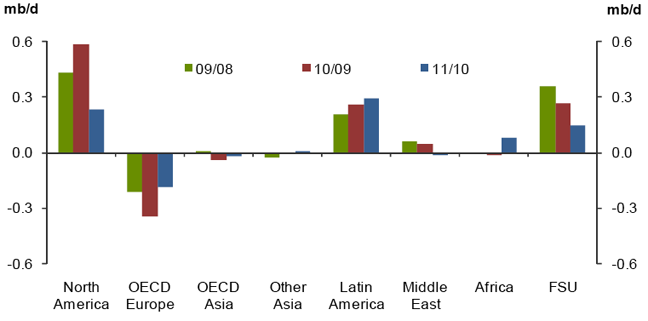
The regions that are expected to contribute most to the growth are North America, increasing by 240 kbd; Latin America with a 290 kbd growth; and the CIS countries producing an additional 140 kbd. There are also declines, so that overall non-OPEC growth is set at 660 kbd.
United States production is anticipated to grow from 8.69 mbd in the first quarter to 8.74 mbd in the fourth, with growth coming from increased output from the Bakken and Eagle Ford shales, biofuel growth, and an increase in NGL supplies. Canadian production will increase by 140 kbd, ending the year at 3.6 mbd. Mexican production will fall slightly, 30 kbd, and will average 2.93 mbd for 2011.
In Latin America, the main gains will come from Colombia, which will increase production by 110 kbd to average 0.91 mbd for the year. Brazil is projected to have the highest growth outside of OPEC, with a growth of 190 kbd, to average 2.85 mbd in 2011.
Recognizing that Yemen is now in flux, and that production is falling, along with the loss from Libya (unmentioned) one presumes that OPEC policy is that these losses will be made up within the organization to keep overall production from the Middle East relatively constant.
Growth from the Former Soviet Union countries is focused on that from Russia and Kazakhstan, which together will provide the additional volumes that will, on balance, increase production from this region by 140 kbd in 2011 over the average for 2010. However, the increase from Russia over the rest of the year is trivial (50 kbd) with growth coming from the Uvat and Verkhnechonskoye fields. (Stuart Staniford is somewhat skeptical that we can see much further growth, albeit production in May averaged 10.25 mbd.)
Of course these projections do not take into consideration the current controversy within OPEC itself over the relative benefits of increasing production over those for holding production and watching the price rise, an argument best made by those who can’t increase production due to their field conditions. In short, this is an ongoing movie with this MOMR providing just a snapshot in time of the conditions as they continue to change. But it does help in the understanding of the overall current picture. We will wait to see what next month brings. But for those curious, the MOMR does include tanker traffic numbers, and they can be interpreted, though not, I'm afraid, by me.
Contact
- Content: editors at theoildrum dot com
- Tech support: support at theoildrum dot com
License

This work is licensed under a Creative Commons Attribution-Share Alike 3.0 United States License.
Thanks for this report. Any chance of including some Rembrandt-style graphs on total production in future monthly reports?
On this quote:
"Recognizing that Yemen is now in flux"
Is this purely because of political unrest? Have they reached geological peak? How soon till they reach zero exports a la ELM?
Classical case of peak oil
http://crudeoilpeak.info/yemen
http://crudeoilpeak.info/yemen-fuel-shortages
Another 7 years and they have basically nothing. Maybe enough to fuel the fishing boats. So whatever population they can support on fishing will survive.
Wait just a second.
Being in the midst of an oil rich region, they can always import crude oil.
Yemen is another case of peak followed by steep dropoff, it isn't a case of being shut out of imports (yet).
However as more and more countries face peak, then yes net exports will decline and eventually countries will no longer be able to import. The crucial variable is domestic demand in oil exporting countries, which may not be as fixed as people imagine.
At some point, yes, the M.E. is in terrible shape but I'd say we are still awhile from that point.
They can only import if they have money to pay for the import. They will not be getting money from exporting food or energy. They can export their value added products like Japan does. But I am not aware of any value added products coming out of Yemen. Maybe some tourist money if they have peace.
Yeah this. Yemen is dirt poor. Yemen has always been somewhat unstable. A small amount of oil exports stabilized the country somewhat . . . but now that small amount of oil exporting is going to drop sharply. Reduced oil exports and dropping water tables mean that Yemen is going to become a disaster. It will be Afghanistan in the mid-East.
Saudi Arabia is worried. They just gave 3 million barrels to Yemen to help stave off disaster.
http://news.yahoo.com/s/afp/20110608/wl_mideast_afp/yemenpoliticsunresto...
I fear what is going to happen in the mid-East as various countries lose their oil exports. It could get ugly. Real ugly.
While fret over not being able to buy from them, there are other sellers (for now) . . . they fret about not having anything to sell. Not much they can do to fix that.
Seems to me that they have resource and labour to increase and perhaps quadruple the export of egg timers.
Yemen is a classic case history of "Net Export Math."
2002 Vs. 2010 Data (BP & EIA):
2002:
Production: 457,000 bpd
Consumption: 112,000
Net Exports: 345,000
2010:
Production: 264,000 bpd (Down 42%, -6.9%/year)
Consumption: 163,000 (Up 46%, +4.7%/year)
Net Exports: 101,000 (Down 71%, -15.4%/year)
Given an ongoing production decline in an oil exporting country, unless they cut their consumption at the same rate as, or at a rate faster than the rate of decline in production, then it is inevitable that the net export decline rate will exceed the production decline rate and the net export decline rate will accelerate with time. In practical terms, this means that a single digit production decline rate will, absent a sufficient cut in consumption, inevitably result, with time, in a double digit net export decline rate, e.g., Yemen.
Incidentally, let's use US annual spot crude oil prices as a rough indication of of what Yemen received in nominal cash flow from their net export sales:
2002: 345,000 bpd X $26/BO = $9.0 million per day
2010: 101,000 bpd X $79/BO = $8.0 million per day
Thanks, Matt. Things do look about as grim as they could be.
Will these guys join up with the Somali pirates? Will some other country take them in? Will the rest of the world just send them food? People do not generally just die peacefully where they are without making some kind of more and more desperate attempt to find food, or at least revenge.
And wasn't this area already a major breeding ground for terrorists?
I'm guessing that whatever country still has cash will hire them as cheap mercenaries to suppress others crying out for food and freedom.
Beeing concerned about Yemen and following the development closely, I have some guesses. Although no crystall ball to look into the future.
A) KSA fence in Yemen, taking a lesson from the Israeli way of dealing with palestinians. Humanitarian disaster follows within Yemen.
B) KSA invade Yeman and make it a saudi protectorate. In this scenario the people will get some humanitarian aid, but this will be to the expense of the people of KSA, wich will reduce oil exports to some degree. Powerty will linger and deepen, though.
Under A we can expect Yemen to merge with Somalia as Piarate Land. They will face similar poverty, failure of state, and already have the same kind of islam. They will make a nice couple.
With export basicly gone in 4 to 5 years, we won't have to wait long to find out.
Option A is not really open to KSA. The tribal loyalties do not follow national boundaries. The Bin Laden family originated in Yemen.
Option B is more likely. KSA has already attacked rebel groups in Yemen in the past.
Jedi Welder,
Perhaps we wont have to wait even a couple of months to find out maybe they are already there. I found this interesting quote from De Spiegel on line
"And finally there is Yemen, whose sovereignty the Saudi Arabian air force had until recently routinely ignored to bomb Shiite rebels across the border. But now that it has been confronted with sheer chaos since the eruption of the Arab Spring, Saudi Arabia is pinning its hopes on stability. On Tuesday of last week, the Saudis announced that they were sending a donation to the orphaned leadership in Sana'a, in the form of 3 million barrels of oil."
If you want to read the article yourself here is the link
http://www.spiegel.de/international/world/0,1518,768368,00.html
Monthly graphs of OPEC crude oil:
http://crudeoilpeak.info/latest-graphs
Graphs on the Saudi Aramco Annual Review 2010
Crude production flat, crude exports flat, product exports declined by 10%
http://crudeoilpeak.info/saudi-arabia-export-peak
Matt, there are some pretty solid contributers to the commentary here, and you are one of them. Thanks.
Following are what we show for Global Net Exports (GNE), using the updated data, with revisions, through 2010:
Global Net Export Data*
2002: 39.1 mbpd
2003: 41.6
2004: 44.8
2005: 45.5
2006: 45.5
2007: 44.6
2008: 44.5
2009: 42.3
2010: 42.6
*Top 33 net exporters with 100,000 bpd or more of net exports in 2005, BP + Minor EIA data (99% of global net oil exports)
Saudi net oil exports were down from 7.3 mbpd in 2009 to 7.2 in 2010 (versus 9.1 mbpd in 2005). Note that Russian net exports have been at or below 7.1 mbpd since 2007. The (2005) top five (Saudi Arabia, Russia, Norway, Iran and the UAE) went from 23.7 mbpd in 2005 to 20.8 in 2010. So, the (2005) top five collectively fell by about three mbpd over a five year period, while the bottom 28 collectively showed basically no change from 2005 to 2010.
Note that Saudi net oil exports have shown year over year declines for four of the past five years (BP), while annual oil prices have shown year over year increases for four of the past five years. This is in marked contrast to the 2002 to 2005 pattern, when the Saudis showed a very large increase in net oil exports, in response to rising oil prices.
Chindia's combined net oil imports went from 5.1 mbpd in 2005 to 7.5 mbpd in 2010 (inclusive of the rather curious increase in reported Chinese 2010 production). In any case, their combined net oil imports, as a percentage of GNE, went from 11.2% in 2005 to 17.6% in 2010. At the 2005 to 2010 rate of increase in their net imports as a percentage of GNE, Chindia would consume 100% of GNE some time around 2030.
So Available Net Exports (ANE), i.e., GNE not consumed by Chindia, fell from 40.4 mbpd in 2005 to 35.1 mbpd in 2010. I'm projecting that ANE will be down to about 27 to 30 mbpd in 2015.
Are there any statistics from which countries these 5 mbpd came from?
Also is there any estimate of which percentage of those 5mbpd came from "demand destruction" (in the sense of e.g. less miles driven or lower thermostat for heating) vs "efficiency gains" (in the sense of higher fuel economy or better insulated houses or switch to other fuel types)?
Which are the countries who are likely to feel the decline in GNE first and most heaviest?
Apmon; that is one of the key questions us ordinary folk need to get our heads around:
"Which are the countries who are likely to feel the decline in GNE first and most heaviest?"
I suspect that since the oil supplies into net importers are seldom arranged by the State, the provision of oil is arranged by the individual multi-national oil retailers from their own external sources.
BP no doubt orders through its global oil channels; Shell through Shell head office etc.
So when there is a decline in supply, the allocation of what remains is not organised in a 'democratic' manner by an Energy Allocation Sub-committee of the United Nations (perhaps using each nation's population and kindliness as the distribution parameter) but instead by company men at their desks.
And so what parameters will these company men use to decide where to send the oil to, and how much?
Does BP UK run an in-house bidding war against BP New Zealand to see who gets the most? Will it be a 'falling lid' across the board, or will it all go to the biggest customer-states first, and the devil takes the hindmost?
Remeber that some 90+% of all oil is pumped by NOCs. What BP and Shell does is quite marginal, in the bigger picture.
The 3 mb/d Westexas mentioned are shown in this graph:
http://crudeoilpeak.info/oil-exports
It all adds up
Sorry, I meant on the consumption side, not on the production side. If available net exports go down by 5 mbpd, then imports must equally go down by 5 mbpd. I was interested which countries have so far (had to) curtail their consumption and through what methods/uses those curtailments have been "achieved".
In general, relative to 2005 consumption levels, it would seem that many developing countries are showing increasing consumption, while the developed countries are taking what is left over.
This will be determined by price. The US, with 23 barrels per year per capita use and a USD set for implosion (debt) may have significant problems outbidding other countries for the 11mbpd it wants. Poorer countries will revert to the stone age first. In contrast China uses 2 barrels per year per capita, though clearly this is very uneven. Even so, this means they are much more resilient against rising fuel prices. Also, with their huge forex reserves they can outbid the US (even though much of this forex is USD). Resource wars?
Reuters has an article today that suggests that OPEC spare capacity will be all but gone by 2012. Last week Aramco published its 2010 review. Oil production and oil exports declined very slightly at about 7.9 mb/d production and 5.53 mb/d exports.
Those who are sharp eyed will note that the refining capacity/ demand was 1.37 mb/d leaving a gap of 1 mb/d. where did it go. Up in smoke producing power and water - as direct crude burning. It also appears that a further 43 kb/d BOE of liquids were also burnt in lieu of methane, most probably LPG.
So much for the supposed SA spare capacity then. I never believed the 12.5 mb/d SA cpacity and I do not believe it today. What the true cpacity of OPEC really is is open to debate but on a long term basis I doubt if it it much more than at present and on a rising trend of consumption in the OPEC countries.
Bad news for the OECD.
Very interesting.
Although it all completely confirms what we've known since the Wikileaks documents on Saudi Arabia:
http://www.guardian.co.uk/business/2011/feb/08/saudi-oil-reserves-overst...
It says that in 2012 the capacity will be entirely depleted. And it should be noted that these documents were written well before the Libyan fallout.
P.S.
Matt's old site has a take on things here, using the Wikileaks documents as a base for claiming that Saudi production capacity cannot go much higher than 9.8 mb/d(10 mb/d would be a stretch but not impossible).
I recently read on (Reuters too, I think) that Goldman Sachs now believes that SA spare capacity will be around a mere 500 000 barrels per day left if production indeed increases to 10 mb/d to cover the demand this year.
This seems slightly cornucopian in view of the other information but even if this was so, this alleged 'spare capacity' is very sour and heavy and it's not at all known who will buy and how much and at what cost, if they will buy at all. And even if all these conditions are met, 1 mb/d barrels in effective world spare capacity(0.5 mb/d from Saudis and 0.5 mb/d from the rest of OPEC, and this is optimistic) in going into 2012 will inevitably lead to another crash, unless the economic conditions get there first and we shouldn't rule that out at all.
No surprise Here, with Libya and also global production.
http://www.eia.gov/cfapps/ipdbproject/iedindex3.cfm?tid=50&pid=53&aid=1&...
Hopefully the EIA will continue their Energy Stats, I do not see any cover up in March Stats, I think they do a good job in a murky business.
No, I think the people on TOD are actually the ones that do a GREAT job with murky stats. EIA are just a bunch of mindless paid bureaucrats.
Besides they are discontinuing reporting the international energy outlook numbers, among other things, due to budget cuts:
http://www.energybulletin.net/stories/2011-05-02/there-goes-data-major-c...
Just saw this: http://www.reuters.com/article/2011/06/14/us-energy-summit-opec-idUSTRE7...
Surely, a shortage doesn't materialise. ;-(
Another setback for an OPEC member:
(click on the article title for more)
Who are these "secondary sources"? that OPEC quotes. I mean, who are the companies that do this kind of tanker tracking? Has anyone ever contacted them to see what they charge for this information? They might be willing to provide data that is a year out of date for a reasonable fee. Not helpful for gaming the markets, but very useful to knowing what did happen. (Actually, this might be the source of the EIA adjustments often seen a year or more after publication.)
Would the TOD editors consider inviting the EIA or IEA to write a post that explains how they arrive at the numbers they publish? This might be the one place on planet earth that being an oil statistics guru might get you some fame and fortune! :)
The loss of Libya's production is finally showing up in the EIA stats (last data point is for March):
Quote from the article: "United States production is anticipated to grow from 8.69 mbd in the first quarter to 8.74 mbd in the fourth...".
That numbers seem way to high and nowhere found in literature.
Example:
Quote from http://resourceinvestingnews.com/17554-shale-oil-to-set-off-us-oil-boom....
"Despite a recent surge in domestically produced oil, the 5.5 million barrels per day (bpd) of crude produced in 2010 is nowhere near the all-time high of 9.7 million bpd in 1970."
Roughly that breaks down as
Crude + Condensate 5.6mb/day
NGLs 2mb/day
Biofuels 1.1mb/day
Total 8.7mb/day
HO could also have added "Refinery Gain" of roughly 1 mb/day to reach the EIA's "Total Oil Supply" figure for the US of about 9.7mb/day (Q1)
Bye Bye Peak Oil?
Quote: "A RAND Corp. study found in 2005 that crude oil would have to range from $70-95 per barrel for shale oil to be economical, but also estimated that this threshold could decrease to $35-48 per barrel within 12 years, once second-generation facilities and processes are established. Technological advances have since led to claims that a threshold of even $20-30 would make shale oil viable." From the article http://resourceinvestingnews.com/17554-shale-oil-to-set-off-us-oil-boom....
Six years later and where are we now?
Great if it happens. It still proves Peak Oil. This stuff discussed is very dispersed and fits on the tails of the discovery model.