| The Saudi Arabian Protectorate of Bahrain | The Oil Drum | Opec Meeting Reveals Further Degeneration of the MENA Region |
OPEC spare capacity, rig count and the big picture
Posted by Euan Mearns on June 29, 2011 - 10:10am
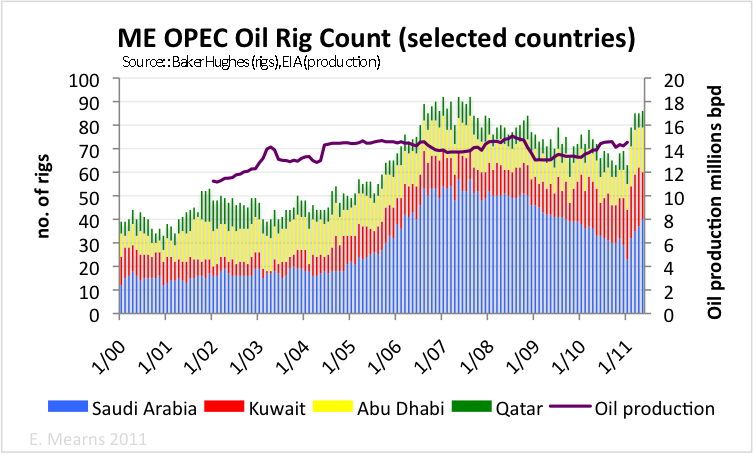
There has been much speculation on these blog pages about the existence of OPEC spare capacity. The oil rig count for Saudi Arabia, Kuwait, Abu Dhabi and Qatar (SKAQ) provides some clues. The sharp rise in operational oil rigs in February 2011 suggests to us that usable spare capacity does not exist and that new useful capacity (light sweet?) must be built by drilling new wells. This takes time. It also suggests that there is goodwill among these OPEC members to try and boost supply to tame oil prices.
This post is joint with long term TOD contributor Rune Likvern.
Disclaimer: neither author holds any energy related investments.
OPEC spare capacity
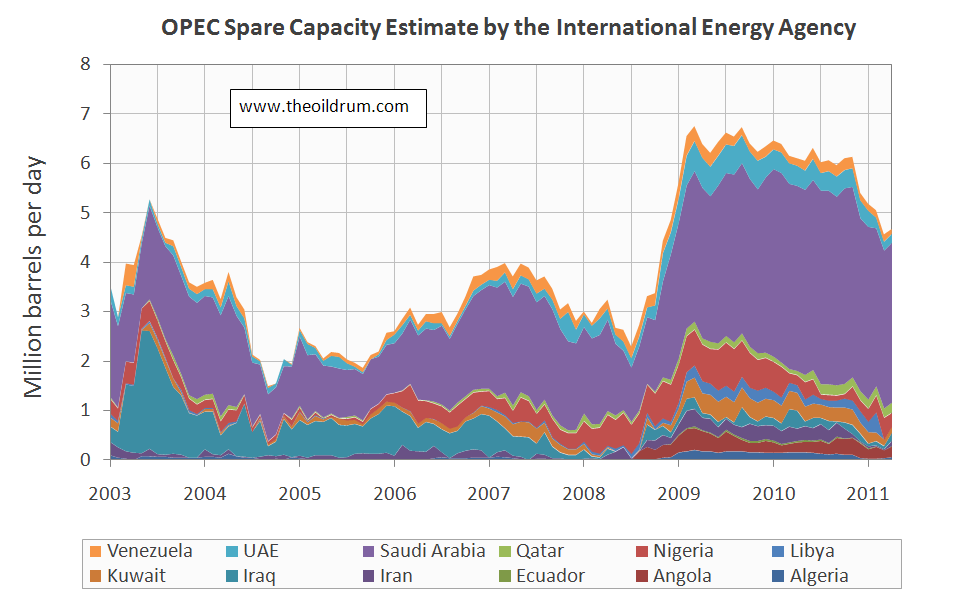
The chart of OPEC spare capacity shows spare capacity running at around 4.5 mmbpd. It seems quite clear that if SKAQ could simply turn on taps to produce more usable oil then they would not be scrambling rigs right now. If the spare capacity does in fact exist, then it must be of sour and heavy grades of crude that cannot substitute for the loss of 1.6 mmbpd light sweet crude from Libya.
Different types of wells
Baker Hughes provide three categories of wells: oil, gas and miscellaneous. For SKAQ, plotted in the chart up top, the miscellaneous column is empty, hence we are looking at simple split between oil and gas. Wells can be drilled for 4 main functions:
1) Exploration
2) Production wells
3) Work overs - intervention to improve well performance
4) Water (gas) injection - to maintain reservoir pressure
It has to be assumed that the oil rig count encompasses all of these functions. Exploration wells will not lead to increased production in the short to medium term. But drilling production wells, workovers and injection wells will lead to an increase in production if the combined new production capacity is in excess of declines for a given country.
Understanding the rig count
We quite often find that when we have an idea for a simple post that the data are far more complex than we expected it to be. This is such a case.
Key observations:
1. Oil production from the SKAQ countries has been stable at around 14±1 mmbpd since 2003, this despite rig count varying and rising from 40 to 90 operational oil rigs.
2. Spare capacity shows much wider variance from about 1.5 mmbpd in 2004 to > 6.5 mmbpd in 2009.
It may therefore be deduced that these OPEC member states produce according to their quotas. They drill wells when needed to develop new fields etc, and these are kept in reserve until declines dictate they are brought on stream to maintain production levels. The thing that distinguishes these prolific OPEC producers from the more conventional OECD operators is that they still have an inventory of discovered assets to drill and are therefore able to offset declines in one area with new production and thus maintain stable production profiles. This situation may persist for a fair while yet.
The bigger picture
And so what of the much vaunted failure of Saudi Arabia to meet the shortfall produced by Libya going off line and the recent announcement of the IEA that it was to raid OECD strategic reserves? Understanding exactly what is going on and what is about to happen requires a careful look at data and markets that are increasingly manipulated by government.
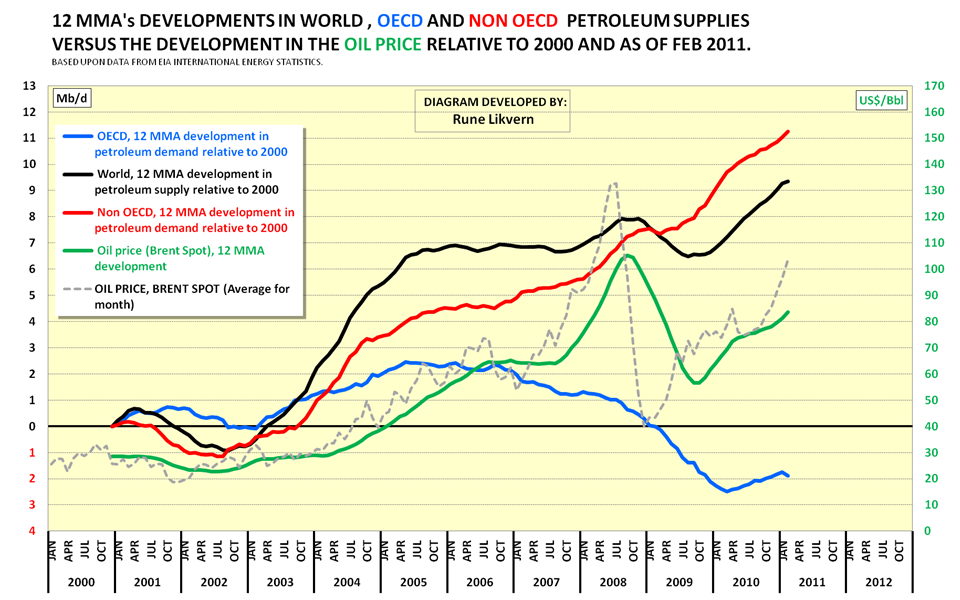
The chart below (Figure 3) shows oil price (weekly average Brent) and petroleum products (gasoline, heating oil etc) supplied to the US market. The latter may provide a proxy for economic health. Note the sharp decline in petroleum products accompanying the 2008 crash! Demand for petroleum products in the USA showed weak growth in the period July 2009 to Dec 2010, peaking in that month. Since then, throughout 2011, demand for petroleum products has been in decline with signs of lower highs and lower lows on the chart. The 52 week MA has turned down. Is this a leading indicator of recession? Broadening the outlook to look at OECD petroleum demand shows the 12 month moving average turning down (Figure 4).

The top of the recent price spike (so far) was $126.59 on April 28th. Prices fell back since then but showed temporary revival mid June following the disorganised break up of the OPEC meeting. The revival was short lived, and on Thursday 23rd June, Brent was clinging to its $110 support when the IEA announced their raid on the OECD SPRs, sending Brent sharply lower.
Where does Libya fit into this picture? In 2010 Libya produced 1.659 mmbpd of mainly light sweet crude and much of that has been lost to the market. The civil conflict got properly underway mid February and at the time added around $10 to already sharply rising oil price. Our speculation is that global demand was already slowing at this time, with certain OECD economies already buckling under rising and high oil prices. Hence the loss of Libyan oil may have coincided with slowing demand, and it has not yet been necessary for OPEC to officially cut supplies to support price since the Libyan conflict has already done this job for them. Note that demand for petroleum products has fallen by >1mmbpd in the US alone so far this year.
Our speculative reading of the current situation therefore is that a second recessionary dip may already be underway in certain oil importing OECD countries, with slowing demand creating over supply and weak price. Meanwhile, the SKAQ countries have responded to OECD appeals and have increased drilling activity to create more spare capacity. And the IEA has signaled their intent to flood this market with oil.
Contact
- Content: editors at theoildrum dot com
- Tech support: support at theoildrum dot com
License

This work is licensed under a Creative Commons Attribution-Share Alike 3.0 United States License.
Immediately prior to the IEA reserves raid announcement on 23rd June, Brent was trading at $110. Today it is back to $109 suggesting that the promise of 18 hours additional expensive supply at some point in the future has done little to impact the big picture - what a surprise!
The blue line shows a 1 year running average. In the past when the oil price has been >$100 for a year it has led to recession. Are we on another collision course with destiny this Fall? The IEA action does at least signal awareness among OECD governments of the risks posed by high oil prices to the economy. But the markets are focussed on Greece today. With little prospect of meaningfully boosting global production, the IEA and OECD governments need to focus much more on energy efficiency and conservation - and in America that means smaller cars:-(
In the USA we could do a huge amount with Green Transit operating subsidies to actually
RUN existing trains, lightrail, buses and shuttles in major Metro areas.
Since 2008 over 150 transit systems have faced severe cuts in service and fares:
http://t4america.org/resources/transitfundingcrisis/
This does not take years as it does to turn over car fleets to smaller, electric or more efficient cars but just requires restoring Transit operating subsidies which were in place for
years until Reagan.
Just provide a few billion in funds to Metro areas to actually run the transit systems
already in place.
The potential scope of Green public transit in the US is a LOT more than commonly supposed!
On May 12th the Brookings Institution released results of a 2 year study of transit stops,
census data and jobs in 100 US Metro areas which showed that transit stops are
ALREADY within 3/4th's mile of 70% of working Americans across those Metro areas:
http://www.brookings.edu/reports/2011/0512_jobs_and_transit.aspx
The problem is the frequency of transit, connections, and the last mile shuttle service
or even sidewalks or bike lanes for the last mile connection.
Despite access to transit only 30% of working age Americans could reach a job in under
90 minutes on current public transit schedules!
In all likelihood by simply running more trains, lightrail, buses and shuttles the US
could save 10-20% of oil usage in a year.
Remember that according to the US Federal Highway Administration 79% of Americans already
live in urban or urbanized areas.
This could easily be funded with the $20 billion spent by the Pentagon to air condition
their tents!
After that then we can revive out of service rails, vital branches, convert medians from
highway lanes to light or heavy rail.
Compared to the billions already spent by the US across all levels of government on
roads this would cost a pittance and could bring results very quickly.
It would be difficult to measure the effects of the SPR release on prices. I think maybe one could quantify the recent relationship between the stock market and the price of oil.
Maybe the price of oil would have went up $10 this week but the SPR release is moderating that...
-That's a scary though: what would the price have been today if the SPR hadn't been released?
Releases can't last forever just like the primary oil supply can't...
Nick.
Nick et al - Catch me up please. Last I heard a few days ago no oil had been released. In fact no one has offered to buy it. Been difficult to get verified details but this is how I understand how the process works: the oil is offered on a bid basis. The minimum bid price is determined by existing law: the oil has to be sold at the running 5 day average of S La Sweet which would be $113/bbl. And I think the earliest delivery would be 1 August. But last I heard a few days ago no one had bid for any of the oil.
Just spent a while searching very link that popped up and not one mentioned any oil actually being sold and produced yet. What have I missed?
Here's the latest on the sale.
http://www.bloomberg.com/news/2011-06-30/u-s-strategic-reserve-oil-may-b...
Fuser - Mucho thanks...sheds a lot of light on the situation. Based upon the author's analysis it sounds as though the release won't have much impact on US oil prices but might (a big "maybe" it seems) on oil prices in the EU. But one statement seems a tad off: “Every additional barrel of oil stored in the U.S. is a barrel that does not need to be imported, ultimately freeing up barrels to move to Europe" Maybe if that oil is stored by a refiner that is in the process of making a run with it. Otherwise a bbl of oil stored in a US tank farm doesn't decrease the daily demand by our refiners. They still have to buy every foreign bbl of oil they had in their forecast.
The administration will have a difficult time making the argument that the release was done to help lower fuel costs in this country if the SPR oil is bought for the same price as oil had been selling for. And right now it looks like that might be the case. We'll have to see where the bids end up. In fact, I'm wondering if our net oil bill might not go up if our refiners pay a premium for light sweet over what they've been paying for heavy sour they'll be substituting for.
Yes, but that will take a long time until that changes the car fleet and fuel consumption. Direct and immediate saving measures are needed. The IEA actualy did a 170 page report on this. Here are some extracts:
26/06/2011
Save, baby, save - in a hurry
http://crudeoilpeak.info/save-baby-save-in-a-hurry
Brent was $114 when the SPR release was announced. There are hints that rumours of the announcement were leaked leading to significant sell-off the previous week.
The price now seems to have bottomed out and is once again testing $110 , as the European markets are rebounding on the assumption that Greek debt default has once more been delayed, and they are salivating at the national asset fire sale to come. The optimism may yet be miss-placed.
Greek default is now being priced into the market, but when it comes it will almost certainly lead to reduced economic activity and oil demand in Europe. However, it seems for now that the rest of the world is more than ready to buy up all available oil at rising prices,
The SPR release is a flash in the pan. It has not turned the economic weather. I cannot imagine the experiment will be repeated. If it is, it will be a clear act of desperation.
10 days of Brent spot from the FT. Do you know when exactly the IEA announcement was made? I became aware of it early afternoon, immediately after the sharp drop. I think the spike in trading volume picks out when the announcement was made. If news of the announcement was leaked then the IEA are going to have to be very careful about possibilities of covertly manipulating markets.
The dip in price immediately before the announcement (spike in trading volumes?) looks suspiciously like some insiders made some fast bucks.
It has occurred to me that maybe the SPR release was a pre-emptive move for an anticipated future supply issue.
For example if Chavez was to die without clear succession. He is clearly not a well man. Maybe the US has intelligence not widely known.
Not, of course, that the intelligence is guaranteed to be correct. I won't go further, as this gets rapidly into conspiracy territory.
So 10 more rigs is going to create a bonanza of oil production? Am I reading this graphic correctly? Even if each well avg. is 5k per day and it takes 2 months per well. I don't see a huge growth of production in any type of useful window.
The low point for these 4 countries in January was 63 and is currently 86. So lets say 10kbpd per well, with 2 months to drill. 23*6=138 additional wells per year * 10000 = 1.4 million bpd additional capacity.
But if all of those rigs are in Manifa, you are not going to see anything for a couple of years.
Be careful with Baker Hughes rig counts as they have a very narrow definition of an "active" rig:
"To be counted as active a rig must be on location and be drilling or 'turning to the right'. A rig is considered active from the moment the well is "spudded" until it reaches target depth or "TD". Rigs that are in transit from one location to another, rigging up or being used in non-drilling activities such as workovers, completions or production testing, are NOT counted as active."
Not only has it to be drilling, it must also be doing that for a minimum of 15 days in the counting month. This can produce anomalies, for example, Unocal/Chevron Thailand drilled wells so quickly that their rigs were "active" for less than 15 days per month and therefore were not counted even though they were using Hughes Christensen drill bits.
Euan,
"Note that demand for petroleum products has fallen by >1mmbpd in the US alone so far this year."
Looking at your graph of US petroleum products supplied, it didn't seem to indicate a reduction of more than a couple hundred thousand bpd, or am I missing something ?
Thanks.
Fair comment, my prose are a bit sloppy. The peak at end of last year was >20.5 and the recent trough <18.5, so I took half of the spread. Difficult to make proper statements from such variable data, I guess we'd have to compare 3 month means or something of that sort Rune has the data. Main point is that a weakly rising trend seems to have turned down.
You are right, it could have been worded more specific.
It all comes down to what time period you are looking at. From January 2011 and as of now it seems like US consumption is down around 1 Mb/d.
Looking at the 52 Weekly Moving Average (which describes annual consumption rate at a defined point in time) consumption is (as of June 17th) down 0,12 Mb/d from its recent high. Not significant, but starting to confirm a trend over some weeks.
Ah ! I was in fact only looking at the 52-week moving average. But I think that's the better way of looking at it, as the monthly / seasonal movements are too variable.
Latest 4 week running average compared to last year 19.050mb/day (2011) vs 19.581. YTD average 19.067 vs 19.181
Gasoline however is running at approximately the same level as last year - in fact slightly up. Latest 4 week running average 9.321(2011) vs 9.237.
Almost all of the reported fall in total US consumption is in "Other Oils" (down an astonishing 10.7% 4-week avg) which includes such things as "Asphalt and Road Oil" and "Distillate" down 5.7%.
The above based on the latest EIA weekly report. Updated figures for this week out in a few hours of course.
Hello Undertow,
Thanks for contributing!
If someone had data (or links to) on recent price movements for "Asphalt and Road Oil", it could be interesting to see those.
How about this?
http://www.state.nj.us/transportation/business/trnsport/PriceIndex.shtm
Not sure if that can fall much further...
Will be interesting to see the EIA monthly reports when they finally break down the "Other Oils" category and explain exactly how it has plunged almost 11% on last year.
Undertow, thx!
Just by eyeballing the numbers it looks like the price index (roughly) has followed the oil price, while (US asphalt and road oil) consumption is dramatically down. This could be due to lower construction activities and less road maintenance.
....but then there is also this supply and demand thing........
This is not Peak Asphalt, technology is simply reducing demand for bituminous road materials.
There has been a big shift to recycled road asphalt for a number of years now.
http://enr.construction.com/opinions/viewpoint/2011/0209-RecyclingAsphal...
http://eponline.com/articles/2011/04/27/i81-paving.aspx
Hello majorian and thanks!
Is this a thing that would affect prices (i.e. lower prices) for road asphalt?
As far as I can see, it is demand being reduced due to rapidly rising prices, not better technology.
The technology is hardly new. I am sure it was not employed before because Asphalt was cheaper than expensive recycling hardware.
Not that it is a bad thing, but it is a one-off effect. Even in efficiency gains, the low hanging fruit is picked first.
hi
at least here in Finland the recycled asphalt is not used anymore, because it is not hardy enough in our climate and the use of spiked tires in the winter...
BR
Seppo
As previously discussed, we see a clear inflection point in Global Net Exports (GNE, i.e.Top 33 Net Oil Exporters) in 2005.
Following are what we show for GNE for 2002 to 2010 (oil exporters with net oil exports of 100,000 bpd or more in 2005, which account for 99% plus of global net oil exports):
Note that GNE increased at about 5%/year from 2002 to 2005:
2002: 39.1 mbpd
2003: 41.6
2004: 44.8
2005: 45.5
At the 2002 to 2005 rate of increase, GNE would have been at about 59 mbpd in 2010, but let's look at what actually happened:
2006: 45.5 mbpd
2007: 44.6
2008: 44.5
2009: 42.3
2010: 42.6
(BP + Minor EIA data, total petroleum liquids)
I suspect that this inflection point was quite a shock to oil importing countries, especially developed oil importing countries. The gap between what the import market was "expecting" at the 2002 to 2005 rate of increase and what we actually saw was about 16 mbpd in 2010.
The difference between GNE and Chindia’s imports is what I define as Available Net Oil Exports (ANE), i.e., GNE not consumed by Chindia. As you can see, ANE fell from 40.4 mbpd in 2005 to 35.1 mbpd in 2010:
GNE - Chindia's Net Oil Imports = ANE
2002: 39.1 - 3.5 = 35.6 mbpd
2003: 41.6 - 4.0 = 37.6
2004: 44.8 - 5.1 = 39.7
2005: 45.5 - 5.1 = 40.4
2006: 45.5 - 5.5 = 40.0
2007: 44.6 - 6.1 = 38.5
2008: 44.5 - 6.4 = 38.1
2009: 42.3 - 6.9 = 35.4
2010: 42.6 – 7.5 = 35.1
(BP + Minor EIA data, total petroleum liquids)
Note that ANE in 2010, 35.1 mbpd, were below ANE in 2002, 35.6 mbpd. In other words, the supply of global net oil exports that were available to oil importers other than China & India in 2010 was below the supply of net oil exports available to oil importers other than China & India in 2002--and of course it was well below what was available in 2005.
A plausible estimate is that ANE will be down to between 27 to 30 mbpd by 2015.
Obviously, this analysis does not support the popular misconception that generally rising oil price are solely due to “Speculation.” It also goes along way toward explaining the IEA’s decision to release emergency oil supplies.
While US crude inventories are fine, the WSJ reported that European commercial crude oil inventories are at five year lows, and I think that the IEA was quite concerned about supply versus demand problems in the fourth quarter (at current oil prices).
The problem that the developed countries are facing of course is that given a continued decline in ANE, after the release of emergency crude oil supplies, then what? Do they keep depleting emergency crude supplies?
Incidentally, one of the little quirks of "Net Export Math" is that the rate of increase in net oil exports tends to exceed the rate of increase in production on the way up, but given a production decline, the rate of decline in net oil exports tends to exceed the rate of decline in production. For example, production by the Top 33 net oil exporting countries increased at 4.6%/year from 2002 to 2005, but their net oil exports increased at 5.1%/year over the same time frame.
From 2005 to 2010, the Top 33 showed a very slight production decline, going from production of 62.2 mbpd in 2005 to 61.9 mbpd in 2010, but their net exports fell at 1.3%/year. Their consumption to production (C/P) ratio increased from 27% in 2005 to 31% in 2010. At this rate of increase in the C/P ratio, the top 33 would collectively approach zero net oil exports some time around 2050. However, based on multiple case histories, and assuming about 45 years of post-2005 net oil exports, the top 33 probably will have shipped about half of their post-2005 CNE (Cumulative Net Exports) by the end of 2020.
Hello Jeffrey,
The chart below just confirms your point that US inventories of crude oil, gasoline and distillate presently are within the “comfort zone”.
Brent is presently flirting with $110/Bbl.
Hi Rune,
Appreciate the work you and all others put into the posts here. With regard to the inventories being in the "comfort zone", do you have a graph which shows inventories in terms of daily usage?
Hello haggisbasher,
I do not have available charts showing number of days of forward supplies. I think a better representation would be to use number of days with net imports coverage (as the US is the worlds 3rd largest oil producer and presently imports around 60 % of its oil consumption).
Rune,
Gasoline inventories in PADD 1 and 2 have both been close to MOL recently and some physical shortages were actually reported in Pittsburgh (PADD 1) and Memphis (PADD 2) over the last month or so. Both PADD 1 and 2 were well below the EIAs' "Average Range" but have improved,
Here's current PADD 1 again still sitting at the bottom of the average range.
If there are two distinct periods we've seen recently regarding net exports -- pre 2005 and 2005-present -- when do you see the next inflection point hitting? Right now we're coasting on a plateau, and the ANE decline rate you show is fairly modest. Are we going to hit a new inflection point soon where ANE starts dropping by 4+% annually?
I disagree that the ANE decline rate is fairly modest. It was in low single digits, down 2.7%/year from 2005 to 2010, but it dropped at an average volumetric rate of about one mbpd per year for five years, in round numbers from 40 mbpd in 2005 to 35 mbpd in 2010.
At Chindia's current rate of increase in their combined net oil imports as a percentage of GNE they would consume 100% of GNE some time around 2029. As they say, somethings gotta give.
In any case, net export decline rates tend to accelerate with time. An essay on Peak Oil Vs. Peak Exports:
http://www.energybulletin.net/stories/2010-10-18/peak-oil-versus-peak-ex...
Thanks westexas for the GNE & ANE data.
Re: "it dropped at an average volumetric rate of about one mbpd per year for five years, in round numbers from 40 mbpd in 2005 to 35 mbpd in 2010."
That is HUGE. Global production grew 20 mbpd from 1985 to 2005 or 1 mbpd each year on average.
For ANE to decline at that 1 mbpd each year is a very strong contraction. That is a contraction of 2 mbpd from the previous BAU 1 bpd production growth.
- AND - all within the ANE importers.
Modifying a famous quote . . . a million bpd here and a million bpd there, and pretty soon we are talking about a real decline.
Thanks for the reply - that's a great point. And thinking about it that way - that it's about 1 mbpd / year - means the rate of decline is increasing yearly, and that right now we're around 3% / year and could be at 4% / year by 2015 or so.
Spare capacity? Why they have so many untapped fields like Dammam.
baby - Don't know the details of that specific field but there is a general answer to your question. There are thousand of oil wells in Texas that aren't being produced today but it can't be done profitably. I think it's a safe assumption that Damman Field hasn't been developed yet because it would not have yielded an acceptable rate of return. That and a possible lack of immediate demand for that extra production.
The price of oil is the triage mechanism for eventual use. When we are no longer driving ICEs around the suburbs, and grain, livestock and fresh produce are on trains and barges, we will be using Damman and the old Texas wells for lubricants, pharmaceutical stock, and plastics! And they will cost a bunch!
So, who will be making those purchases, and who will be at the end of the line, consuming those products? That is why it will be a true triage. The answer is, whoever has a bit of cash left after the coming crash. Probably not me.
Craig
Not leading. It is at most a coincident indicator, more likely a lagging one.
How would it be leading if employment and consuption are concurrent, and industrial production is lagging? Those are the main factors affecting oil demand.
I think coincident is probably closest. What I am in part meaning is that this is up to date data we have that may betray GDP growth, business and consumer confidence statistics that are normally weeks / months in arrears when they are published. It won't surprise me to hear of severe slow down during 2/4 in the weeks / months ahead and I'd speculate that it is this information that underlies action of IEA.
It is my pet theory that precisely such up-to-the-minute data that was suggesting an imminent downturn was a major prompt for the SPR release.
It's a win-win for policy makers--either it works and the economy improves and they can take credit for this bold move; or it doesn't work, the economy tanks and oil prices with it, and they can claim some part in helping to lower oil prices with this brilliant bold move (not my assessment, just my guess at the words they will likely use).
Is that way too cynical, or what?
Just wondering how the sale of SPR released oil works? Who gets the Check?
Could this be in part about creating some revenue?
Is Rig Count data trustworthy? The more I see of these various oil production statistics in disagreement, the more I realize we may be looking at a new kind of accounting fraud in our system.
Relying on any one accounting effort may be susceptible to book cooking, which is what we saw with Enron and others most recently. Now we see people cannot count bbls of oil, and of course KSA is so secretive.
Why trust these rig counts?
Of course, we won't even talk about the quality of the oil--the available net energy per bbl (Joules per bbl net) and so forth. Those types of accounting would show the real story for recent oil production efforts.
I think we reached peak reliability of all oil-related data quite a while ago.
As an outside observer, this seems to be the case.
But what do I know?
Interesting post, it's certainly intriguing that the rig count is increasing for Saudi Arabia whereas their spare capacity is near record high. It would have been interesting to link the change in drilling activities with planned oil megaprojects (I think Baker Hughes distinguish offshore and onshore rigs also). Shrinking net exports combined with falling oil prices and promises to boost state welfare programs may be the best way to push them to produce more if they can.
Looking at Canada and the US as a model, total meters drilled jumped sharply after peaking. Just a quick look at the rig history back to 1975 shows the rig count was 120-200 over that period. Rig counts have now moved up closer to 300. I wish we had data from the 60's & early 70's so we could see the rig rates when the mid east production was growing rapidly.
The US has about 1800 rigs running, and has almost always had at least 1000 rigs running back to 1949 according to BH. So that is substantially more. It may reflect the smaller resevoir sizes, but also the private nature of US mineral extraction. Anyone who can pull together the capital can take a shot at drilling a well.
It is hard to know from rig counts what is happening to these producers.
Lots of empty bottles in the basement. Takes more effort to find the full ones.
Time to call the beer retailer. Oops ! No one home?
Search baby, search !
That was not 17 syllables.
But I'm gonna give you an A anyway.
Okayo. Back to OPEC.
Cheers,
K.
So the critical question still remains unanswered. How much spare capacity does SKAQ have at the moment?
I think the answers are 1) not much usable 2) total less than IEA report. Rembrandt may have a post on this.
From a North American perspective, it's always striking how *few* rigs operate in the Middle
East. We have about as many rigs running in the state of Colorado as they do in these four nations combined. There are about 2x as many rigs in North Dakota's Bakken field as in these four nations combined. In the past ten years, these OPEC nations have produced more than 40 billion barrels, by rough calculation, without ever needing more than 100 rigs to do it. It's astonishing, when you think about it that way.
Agreed, it comes down to well productivity and geology. Huge structures in ME have focussed much of the oil into a few places. I'll try to do a quick post on global rig counts v production which would make this point.
rudall - You may have already put 2+2 together: What you're seeing is a combination of two related factors. First, it's the essence of PO: smaller and few fields left to develop in general. Over 30 years ago I was drilling 10,000' wells testing 2,000 acre potential reservoirs. Now I'm drilling 16,000' wells (3X the cost of a 10,000' well) for 200 acre potential reservoirs. Second, look who's doing the drilling. For the most part Big Oil does almost no onshore drilling in the US today. Some Deep Water activity but still not dominating that arena. It's the smaller independent companies that drive activity here. Also, there's a big component of public companies drilling not the most profitable projects around but they have no choice. They have to meet Wall Street's demand for an increasing reserve base (regardless of the profit level) or the company's stock will be trashed. This is the prime motivation behind much of our current drilling activity. And such companies are nearly non-existent in the world of foreign NOC's. If the ME were opened up to small operators leasing lands as they can do here I'll wager you would see the rig count explode to many times the current activity.
So what would be the gains / changes of that rig explosion? Regarding peak oil, not economics. Wouldn't they flood the market with "oil at any price" supply, driving down market price and advancing the depletion curve from where it is now?
lenny - more theory than provable facts: I'm not sure it would change PO significantly. I would guess a lot of smaller fields with less impressive flow rates would be developed. So I'm not sure enough oil would bedelivered fast enough to flood the market place. IMHO demand changes would still dominate pricing. Don't think it would advance the depletion curve. Maintaining a lot of marginal wells might actually allow a barely perceptable decrease in the decline rate.
But this is purely a theoretical thought exercize. Unless the US invades the KSA this is just pure fantasy football IMHO.
Rockman
I would appreciate your real world perspective on how the the DIAMETER and cost of drilling and of installed slotted pipe has varied over your watch. I see research and developments into micro drilling and coiled tubing etc.
David - Wow...pop quiz. I'll give a very short incomplete response. I can't say I've noticed a significant change in slotted liner size. A lot of advances in screen design and lengths especially with gravel packing the same. I've read some research out of Sandia re: micro drilling but haven't noticed any serious effort to deploy this technology. There was a company (Hydrocoil or Technocoil?) pushing their very mobile coiled drilling unit. Very fast and much cheaper than a conventional truck mounted drill rig. But couldn't get small Texas operators to give them a try. Moved the ops to Calgary and I heard they were the hottest thing going since sliced bread.
Thanks Rockman.
I found Xtreme Drilling Corp. in Calgary, and Advanced Drilling Technologies in Colorado. Technicoil was bought by Essential Energy Services Ltd. On slotted liner, Regent Energy , G&L Slotco and Schlumberger are a few that come up.
Is this the microdrilling at Sandia you were referring to?
Look forward to your non-pop respose!
david - No...that's not it but very interesting. They were working on a slim hole drilling technology. Slim being less than 6" if I recall correctly. Obviously a lot less cutting and casing than drilling and casing a 12 1/4" hole.
The fellow who told me about Technicoil watched them drill 95 coal bed methane wells to a depth of 2,500' in New Mexico and did so in 105 days. And it takes only a 3 man crew and 1/4 acre drill pad. A closed loop circ system so no pits. Just roll onto the loation, beginning driling within the hour and don't stop until you hit TD. Then POOH and drive to the next location. Mud is already in the tanks and all you need do is slap on a new bit. Was limited to around 5,000' to 6,000' but about half the cost to drill such a hole in the Texas Gulf Coast. But that's how it is with small operators with limited capex: they don't like doing much of anything new. Just stick with what they are comfortable.
If my shallow oil field horizontal redevelopment projects works I'll seriously consider getting a few of those rigs down here to Texas. But about 6 years ago I talked to them about mobing to KY. Not only would they not mob to the US but wouldn't even mob to anywhere outside of Alberta...just too much work there.
Rockman
Thanks for the perspective. Especially: "5,000' to 6,000' but about half the cost to drill such a hole in the Texas Gulf Coast."
For recent pipeline costs I found:
Jan 3, 2011 – National lab uses OGJ data to develop cost equations Oil Gas Journal
Anything better that you know of?
I found the following SPE lecture (date?) detailing benefits:
Slim Hole Technology Roger Hough Shell Canada
I found the following searching for
"Sandia Slim Hole Drilling". That seems more on the drilling technology that you were referring to.
Another hybrid CT drilling company I found is:
Savannah Energy Services Corp.
Is the United States release of it's oil reserves really a big deal. Will these really have any economic impact, or is it just political propaganda?
Consider, Raz... the US release is 30 MB, EC release another 30 from their SR. Total, 60 MBL of oil... about 30 days of shortage from the current unrest.
For a short time, there will be a positive impact on the economy. Then, reality takes over and prices are back up, but with a vengence, because you see, now we need to replace those 30 MBL and so does the EC. Long term, worse off. selling cheap oil and replacing it with more expensive oil. Makes sense when the country faces default, doesn't it?
And, if there is a true emergency, we are 30 MBL light on the strategic reserve.
Yes... it is political propaganda. Of the worst sort. The message: Go ahead and drive those suvs... if gas gets to 4 bucks a gallon, we'll bail you out! Business will continue as usual... nothing to see here... move along.
Craig