An alternative version for three of the “key graphs” in IEA’s 2010 World Energy Outlook
Posted by Chris Vernon on July 7, 2011 - 4:48am
This is a guest post from Dolores García, an independent researcher based in Brighton, UK.
Recently Jorgen Randers (best known for being one of the co-authors of The Limits to Growth, 1972) asked me to do some modelling work on the World3-Energy model, an updated version of the classic World3 computer model that was used in The Limits to Growth that includes a much larger amount of information about energy. He’d like to use it for the next book that he intends to publish sometime in 2012.
I have published on The Oil Drum before the details of World3-Energy (a dynamic systems model), can be found in:
A New World Model Including Energy and Climate Change Data
And a few answers to reader’s questions can be found here:
New World Model – EROEI issues
Part of the work I’m doing for Jorgen Randers is comparing the results of World3-Energy with IEA’s results. I thought the readers of The Oil Drum would be interested in this.
World3-Energy doesn’t have any separation between world regions, but in spite of that, produces aggregate figures that are within the ballpark. I can’t produce any comparisons that are specific to world regions, but we can compare the aggregate figures.
An important difference between IEA’s model and World3-Energy is that World3-Energy is an attempt to model the situation pretty much from “first principles”. It uses little in terms of historical data, the data produced come from the equations, parameters and tables within the model. It isn’t supposed to reproduce history with exact precision, rather it shows that the dynamics in the formulas are probably roughly right, because the results reproduce roughly the history so far. For example, the fact that coal-fired electricity generation is within the ballpark of actual figures suggests that the formula for electricity produced from coal is probably roughly right.
Obviously, IEA have much more detailed data and their model goes into much finer detail than World3-Energy. But that makes it easier to forget that a chain is only as strong as the weakest link, or a formula is only as precise as the variables we know with the least precision. It’s the equation that you haven’t written that will prove your model wrong. That’s why I chose adapting World3, that already had in its equations all the major factors that affect the state of the world, rather than starting from scratch. Of course, this model may also contain incorrect assumptions, but at least it’s taking into account all the major factors.
I believe the IEA model has very high precision in many of its formulas, but a lot of it is rendered invalid because they are not taking into account major factors that will affect in a big way the results. My favourite example is the fact that they think of economic growth as a given, coming out of the blue, when economic growth depends very much on availability of energy (heavily affected by availability of fossil fuels) and availability of food (heavily affected by climate change, that depends on the amount of fossil fuels burnt). World3-Energy instead calculates economic growth from its internal variables, by adding up food, industrial output and services output.
The WEO model is to a some extent a “black box”, but we know enough about it to make a quick table of comparisons between World3-Energy and the WEO model:
| World3-Energy | WEO model | |
| Scope of the model | Like World3, all the main constraints to growth in the world, with a special focus on energy variables | Purely energy |
| Complexity | Relatively simple (about 300 equations) | Very complex (about 16,000 equations) |
| Population | Calculated internally, which means it takes into account things like greater mortality due to climate change | Based on UN projections |
| Economic growth | Calculated internally, which means it takes into account the fact that a diminished industrial output due to less available energy affects economic growth | Based on IMF and World Bank projections |
| Land & food | Included in the model, which allows for considerations such as if food is scarce, resources will be put to maintain food levels, rather than other activities including energy production | Not considered |
| EROEI | An essential part of the model | As far as I can tell, not considered |
| Modelling of energy supply and demand | Supply and demand are estimated separately and then matched, supply takes into account geological and technical constraints | Based on estimations of energy demand |
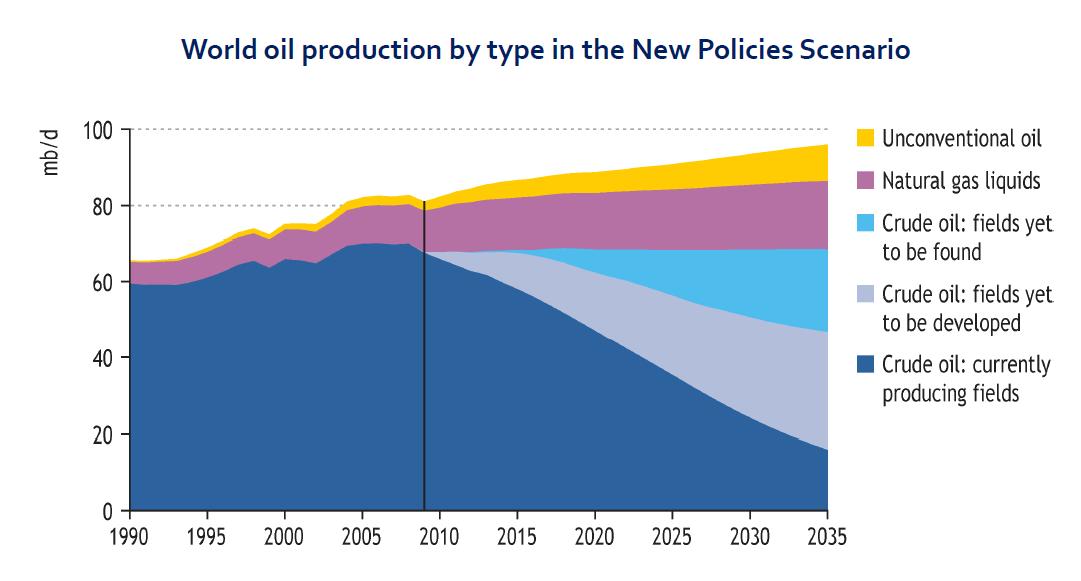
Let’s start with an easy comparison: the IEA’s graph of oil production. Readers of this site will know already that this is one of the most criticised, often because the horizontal straight line looks extraordinarily suspicious. There is no particular reason to think that oil production, under any circumstances, would stay flat for a long period of time. It’s easy to see that it could be flat for a couple of years, but the graph assumes flat production for more than 25 years! Either there is the capacity and the demand, in which case the line would go up, or capacity or demand is lacking, in which case the line would go down.
My model uses conservative figures for ultimate reserves of oil, gas and coal, based on Laherrère’s estimation, simply because they were the ones that produced curves that fitted the past most closely. This is the output of World3-Energy:
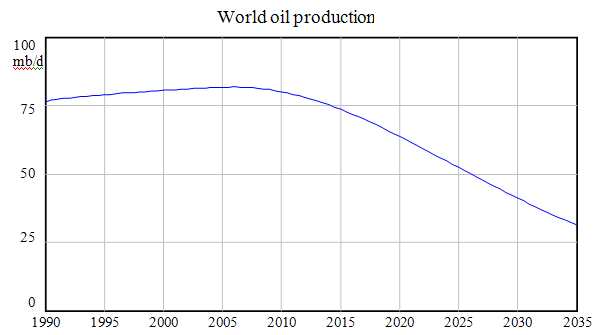
I’m sure oil geologists can produce much better forecasts, though. The aim of World3-Energy isn’t producing highly accurate forecasts, but doing a fairly good job modelling of the big picture.
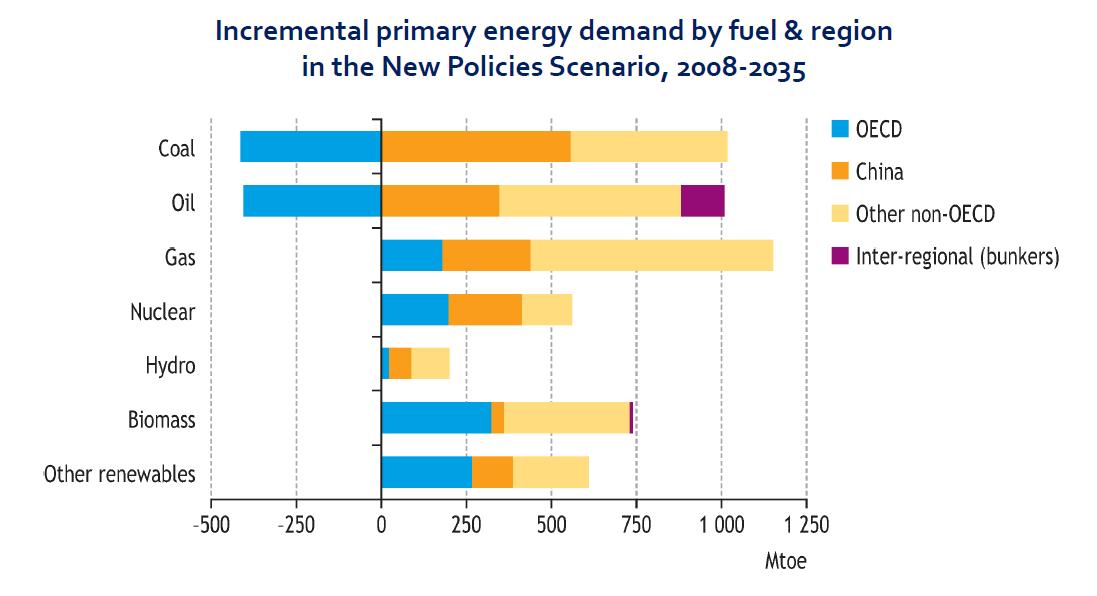
The next graph shows what I see as a fundamental flaw in IEA’s modeling: it’s based on demand, and the idea that demand might not be able to be met, if it’s been introduced, it’s only been as an afterthought.
World3-Energy has the idea that demand may not be met at its heart, and the figures for demand and supply may be different. Some people object to the idea that supply and demand may be different because they are matched by price, so I’ll clarify my terms. What I mean by “energy demand” is the demand calculated based on the requirements of transport, electricity and heat, regardless of any price considerations. What I mean by “energy supply” is the maximum amount of energy that can be produced taking into account geological and technical constraints. The way that the model matches supply and demand is assuming that energy demand is inelastic enough that if there are supply constraints, as much energy of a given source as can be produced will be produced. If there aren’t supply constraints, the energy produced will equal demand. The model doesn’t contain any price calculations or considerations of credit availability.
This is the equivalent graph on World3-Energy. (The units used are Gtoe, rather than Mtoe)
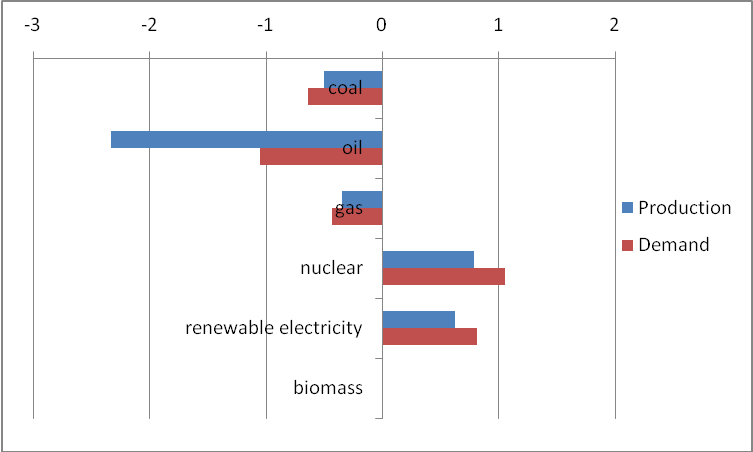
The world here looks very different, with production lagging behind demand on almost every source of energy. This graph is for the “all for renewables” scenario in my model, which means there is a deliberate and coordinated effort to cut use of coal and gas, while oil production is catastrophically low just because geology dictates it.
The World Energy Outlook 2010 has three scenarios: “Current policies”, “New policies” and “450”. “Current policies” is roughly equivalent to my “Business as usual” scenario, and “450” is roughly equivalent to my “All for renewables” scenario. “New policies” is somewhere in between. I haven’t found an exact description of “New policies”, that’s why I’m comparing the “New policies” graphs with the “All for renewables” ones.
Finally, a IEA graph that may look a bit confusing because it combines two entirely different things in the same graph. I’m interested here in the CO2 intensity in power generation:
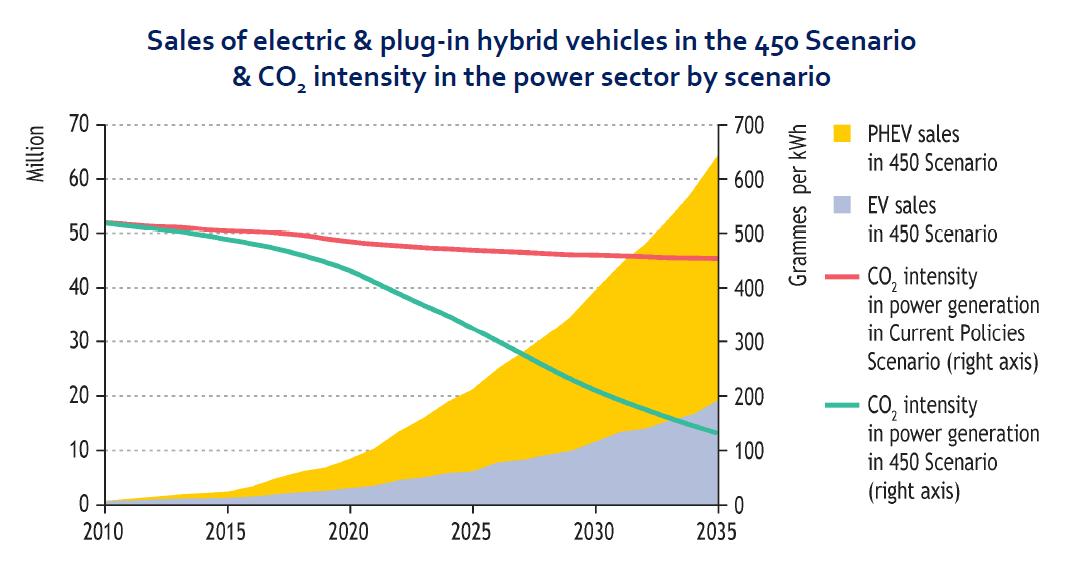
The equivalent graph in my model is this:
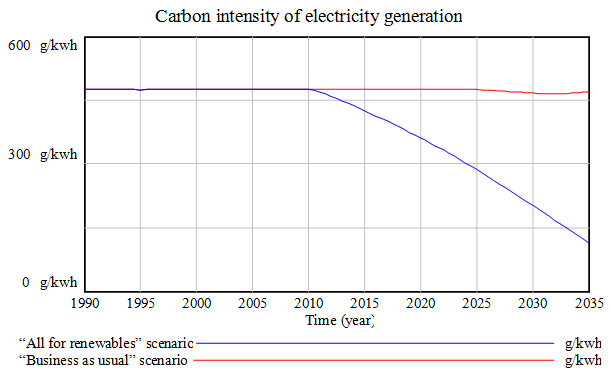
The “Business as usual” scenario is somewhat more extreme than the “Current policies”, because it assumes no policy restrictions of any type. But it’s nice to see IEA and my model have arrived to similar conclusions by entirely different paths in this case. If a policy of strict reduction of fossil fuels is applied in 2010 worldwide, we are in agreement about how quickly it’s technically feasible to de-carbonise electricity. Which means that it’s technically possible to stay below the dreaded 450ppm.
The main point of disagreement is that the IEA seems to believe most of the changes will happen quietly in the background, with the average citizen of the Western world barely noticing that the brand new cars just happen to be electric. World3-Energy suggests that the changes are likely to happen among very real concerns about world food production and other similarly “minor” issues.
An alternative version for three of the “key graphs” in IEA’s 2010 World Energy Outlook
PDF version
56 comments
An alternative version for three of the “key graphs” in IEA’s 2010 World Energy Outlook
PDF version
56 comments
Contact
- Content: editors at theoildrum dot com
- Tech support: support at theoildrum dot com
License

This work is licensed under a Creative Commons Attribution-Share Alike 3.0 United States License.
Given it's in the same game, I wondered what you thought of the DECC's 2050 Pathways tool?
http://2050-calculator-tool.decc.gov.uk/
The Pathways tool is a different type of model. Instead of trying to forecast the future, it allows you to see what would happen under a wide array of possible futures. In many ways, it's better than IEA forecasts, because it makes most assumptions explicit and allows you to pick your favourite one. On the other hand, like any model, it will contain many other assumptions that aren't made explicit. In my opinion, the main problem we have is that most people don't ask enough questions about forecasts and models.
Ms Garcia, your work to extend World 3 to model energy stocks and flows in more detail is incredibly important - if not the most important activity at this juncture of history. As the late Donella Meadows might have said, the only activity with even more leverage than what you are currently doing is actually somehow changing the very attitudes that you model with your equations.
I have read your 2009 post and I will also read the book when it comes out in 2012. Please keep up the good work!
Lady D - "I’m sure oil geologists can produce much better forecasts". You might reconsider that proposition. For 36 years I've evaluated the projections of hundreds of geologists for projects much smaller and with a more detailed data base than you have to analyze. And I've seen the final results of many such efforts. And thus, from a statistical perspective, "we" have not been impressive. Rarely has the volume of fields/reserves been found as predicted. In many cases the results have been zero. Again, I'm referring to situations where much more data was used in the exploration process along with a significant number of man hours followed by critical peer review. And we still drilled a lot of dry holes.
There's a reason it's called exploration: sometimes the pioneer finds a land of abundance. But often he just get an arrow in the back. Deep Water Brazil contains billions of bbl of oil. The Arctic may contain many billions of bbls of economic oil...or not one. As we say in the oil patch: some days chicken...some days feathers. Geologists must always present a very optimistic projection. We require the greed factor to convince folks we're correct even though history proves we are very often wrong. Otherwise no one will pay us a salary. And ultimately that is our primary goal.
The most accurate projections of future production have come from the analysis of existing fields. But that effort utilized a data base containing details that don't now, and probably never will, exists for most of the world's fields outside of the US and a very few other countries. As I've mentioned before I have no doubt the KSA has a very accurate projection of future production from their currently producing fields. And if they made their production history public so would we. With all the data in hand it's neither difficult nor time consuming. But IMHO the truth will eventually be revealed as exports decline in the face of high prices.
p/s/ - Please don't repeat anything I've said. The Geologist Union would be upset with me for exposing our little secret: we kinda make it up as we go along. But the best part: the less detailed data available the bigger the story we can tell because no one can prove we're wrong. At least not until they drill the wells. But by that time we would have cashed the check.
Come on Rock, tell it like it is, most Geologist could not find oil on a dip stick, LOL, I have always loved how the oilfield makes fun of its own but just like family we take to kindly to comments from those outside very well...
A point to note is the use of the term "Carbon Intensity". Carbon Intensity is the amount of carbon emissions generated per unit of GDP. So it is possible to have falling carbon intensity while the total amount of emissions generated stays the same, or even rises.
"Intensity targets
U.S. plans to cut carbon intensity per dollar of GDP by 18% by 2012.[8] This has been criticised by the World Resources Institute as this approach does not ensure absolute reductions if GDP grows faster than intensity declines.[9]
From 1990 to 2000, the carbon intensity of the U.S. economy declined by 17%, yet total emissions increased by 14%.[10] In 2002, the U.S. National Environmental trust labelled carbon intensity, "a bookkeeping trick which allows the administration to do nothing about global warming while unsafe levels of emissions continue to rise."[11]"
http://en.wikipedia.org/wiki/Emission_intensity
Even if GDP falls, we have no guarantee overall emissions will fall, if "dirtier" sources of carbon are used.
More discussion on Energy Intensity at RealClimate :-
http://www.realclimate.org/index.php/archives/2005/06/make-your-own-fore...
"The bottom line is that the change in the world’s energy infrastructure that would be required, to limit the CO2 concentration in the atmosphere, is not small. A few Toyota Priuses are not going to do it, nor is the Kyoto Protocol by itself even close to solving the problem. Conservation helps, but the historical rate of improvement in energy efficiency is already built into the forecast. There is some scope for trade-offs over time, cuts in emissions now versus cuts later. Ultimately, however, tens of terawatts is a lot of carbon-free energy."
Spring-tides
From 1990 to 2000, the carbon intensity of the U.S. economy declined by 17%, yet total emissions increased by 14%
This was a period when almost no improvements in vehicle mpg occurred(SUV craze) and no new nuclear was added. Wind and solar were just beginning to contribute and the economy was growing rapidly.
Now the US has the option to dramatically improve fuel economy and to start to replace some VMT with EV. Wind and solar are growing rapidly where they are now capable of replacing coal-fired electricity and the economy is growing much slower, allowing modest improvements in carbon intensity to outpace GDP growth.
"a bookkeeping trick which allows the administration to do nothing about global warming"
that's unduly harsh, especially since the US population is still growing.
"U.S. plans to cut carbon intensity per dollar of GDP by 18% by 2012.[8] This has been criticised by the World Resources Institute as this approach does not ensure absolute reductions if GDP grows faster than intensity declines."
Unfortunately, since the growth rate of the US economy is expected to be less than "normal" for some time to come, this is unlikely to be a problem in practice. Furthermore, to the extent that the reduced carbon intensity is due to the off-shoring of manufacturing jobs, the economy will stay that much more depressed for that much longer.
From the perspective of doing something about global warming, the offshoring of manufacturing jobs IS the book keeping trick. Do our atmosphere and oceans care where the excess carbon came from?
Unduly harsh ??
"Worst ever carbon emissions leave climate on the brink"
"Record rise, despite recession, means 2C target almost out of reach"
http://www.guardian.co.uk/environment/2011/may/29/carbon-emissions-nucle...
"Greenhouse gas emissions increased by a record amount last year, to the highest carbon output in history, putting hopes of holding global warming to safe levels all but out of reach, according to unpublished estimates from the International Energy Agency.
The shock rise means the goal of preventing a temperature rise of more than 2 degrees Celsius – which scientists say is the threshold for potentially "dangerous climate change" – is likely to be just "a nice Utopia", according to Fatih Birol, chief economist of the IEA. It also shows the most serious global recession for 80 years has had only a minimal effect on emissions, contrary to some predictions."
While TPTB have been playing around with definitions that make them look like they have been doing more than they actually are doing, the climate is being altered beyond repair.
Interesting stuff, I went to the UK House of Commons yesterday to see presentations to the 'All Party Parliamentary Group on Peak Oil and Gas' on the same subject ... the upshot is we are following closely the BAU scenario from LTG 72 ... serious stuff, we are now clearly past world peak on many things including food!!
BTW .... The LTG72 BAU scenario collapses!
If you are interested in learning more keep an eye on the HOC website - they will have the presentations posted in the next few days.
http://appgopo.org.uk/index.php?option=com_events&task=view_detail&agid=...
Glad you could make the meeting, I missed it, but I believe Doly was there?
Yes, I was. Interesting stuff, though I knew most of it already.
What is the end goal of the modeling work? Building a better model only makes it better at answering whatever question it addresses. Building a better model is pointless if it's already good enough, or if the new version still won't be good enough.
I gather that the goal seems to be to depict the world energy utilization scenario for about 25 years into the future under a variety of assumptions. But to what end? At what accuracy?
Some modelers get caught up in the model as a goal in and of itself. It reminds me of those Rube-Goldberg steel ball mazes where the balls flip switches and get caught and then released by other balls so the path of the balls varies in a complex but defined way. It does a lot, but accomplishes nothing but holding a human's attention for a period of time.
Are we looking for peak total energy production? Peak net productivity? Peak GDP?
To me, interesting model predictions are points of high stress. The world is a complex adaptive system, but adapting takes work, and it occurs as a response to stress. At high levels of stress, societies crumble and people die, whether due to war, starvation, disease, or whatever.
Perhaps one indicator of stress is changes in the graph - inflection points, peaks, and steep slopes - for the various parameters?
the purpose of modeling is to understand some situations where experiments are impossible or too expensive. the question when the model is good enough is political, in the sense that one has to ask good enough for what purposes. the question of developing a better model is different because in the (genuine) research the success is not guaranteed. so you know only afterwards if the effort was actually useful.
if you want to model "points of high stress" the first thing would be to define more precisely what this means.
Good point. For me, the goal of modelling is to show people possibilities for the future they didn't think of before. If your plans assume that X is or isn't going to happen, and the model suggests the opposite is a significant possibility, you'd better adjust your plans accordingly.
Yep, you clarified your terms, yet, your definitions are absurd.
First, demand isn't equal to supply because of a price based mechanism; both are equal because their definition are the same.
Second, there is no "requirements of transport regardless of any price", requirements of transport are completely dependent of price.
Third, there is no "maximum amount of energy that can be produced" if you don't take a price level into acount. There is even no concept of resources and reserves without taking in acount the price level.
Fourth, that is not an "honest" nomeoclature (I'm not saying that you are not being honest, but that the names are misleading and were originaly put into that use by dishonest people, you repeating them won't help anybody). What you mean by demand is the projected consuption of oil with varying GDP and population, maintaining the standard of live, and efficiency. Simply call it so; "projected consuption" seems a nice short name, after you explain it. What you call production is also the projected production with varying reserves, maintaining the technology and price level constants. Again, just cal it so. That "both projections can not be true" is a way simpler, more accessible, and less confusing statement than that "supply can't meet demand".
The definitions are not absurd. They are different from the ones commonly used in economics, which has money as a core concept. World 3 has no money, so it has no price. It is an model that uses capital, labor, materials, and energy instead. It is a different, and often more illuminating, perspective.
I would like to request a bit more kindness on the forums. If you don't understand something, please don't insult the speaker. Instead, please ask some friendly questions to get clearer. For instance, "That is a very different definition for demand than I have ever seen. Why are you using that definition? Also, how do you measure demand without price? How do you sort between competing demands (without price elasticity or similar money mechnanism)?"
There are very few places in the world like TOD where very different people can gather and share information. I urge everyone to help preserve this fleeting miracle.
I'm sorry, I didn't intent to offend the poster, and didn't even realise my post was offensive until you pointed it. The overal tone could be better, but I have no other honest word to call those definitions.
Anyway, if you don't take price levels into acount, you have no defined reserve level to get those resources you model. You simply can't model production over some unknown reserve. Also, without a price level you can't even start thinking about more than one kind of resource to extract. You don't need to put a monetary level at the model, but a model whithout any means of weighting the usefullnes of one resource in comparison with another simply can't be realist, and less so at disruptive times.
At the "demand" part, can you point any methododology one would use to quantify the requirements of transport regardless of any price? What volume of goods are to be transported? What number of people are to be transported? Is that transport taking them to work? If so, how much they are getting at that job is not irrelevant. Is that transport taking them on vacation? That is a quite elastic use. Is that transport taking them to markets? What volume of goods they are carrying, and what is the frequency they go to that market?
Again, I'm sorry my post sounded offensive. I didn't mean to. That is such a small detail at this article, but is a detail that gets constantly overlooked, and could discredit the entire work at the eyes of people that know what "offer" and "demand" mean. The actual definitions aren't even relevant at the article, as the actual used values don't conform to them. From other articles, I imagine those values are calculated from equations with initial values comming from current data. If so, the data is simply projections of future consuption and production while keeping the price constant (as the equations don't have a price factor), and it would be much clearer if it was just called so.
The model takes the idea that as resources deplete it takes more effort to do the extraction. Geologists typically use price vs resources, but another way to look at it is energy input vs resources. And resources extraction then stops when EROeI hits 1:1
You are right, and I think the original model there was only 1 resource. I believe World 3 assumes "perfect substitution". Meaning they assume 1 resource because if any run short the economy switches instantly to another. The model above is an extension and perhaps the author can offer some thoughts on how those resources are balanced. (It looks like from her EROeI link she provided that as a resource depletes, the more abundant resources are substituted, so coal is used as oil runs out, etc).
Figures 12 and 13 in "The Limits to Growth" Give the results of computer runs with chromium. The graphs show the effects of the decrease in reserves,the increased cost and decreased usage rate. There is also an explanation of the graphs and the implication that it would apply to other resources.
Quote: "After about 125 years, the remaining chromium, about 5% of the original supply, is available only at prohibitively high cost, and the mining of new supplies has fallen essentially to zero."
Cool, my copy does not have such a figure. I have the 30 year update. Which version has those figures?
30 year update Figure 4-7 Energy Required to Produce Pure Metal from Ore has the energy cost per ton vs ore grade.
http://www.flickr.com/photos/8223133@N05/2232429783/sizes/z/in/set-72157...
The figures JWS mentions are in the 1972 version. The point is that 1970 the resource has a 400-year static reserve index. Extrapolating constant exponential growth suggests a 95 year lifetime. However, when including technology advance, rising costs of discovery, extraction, processing and distribution, increased use efficiency and substitution where possible, the lifetime is extended to 125 years. The point being that a "dynamic" projection yields a longer lifetime than exponential extrapolation but shorter than R/P.
Of course, this dynamic approach produces a bell-shaped curve.
The book goes on to show how a doubling of the resource obviously increases the R/P from 400 years to 800, but only increases the lifetime in the dynamic projection from 125 to 145 years.
The concluding statement: "Given present resource consumption rates and the projected increase in the these rates, the great majority of the currently important nonrenewable resources will be extremely costly 100 years from now. The above statement remains true regardless of the most optimistic assumptions about undiscovered reserves, technological advances, substitution, or recycling, as long as the demand for resources continutes to grow exponentially."
resources extraction then stops when EROeI hits 1:1
Well, no. For instance, oil right now is worth 4x as much per BTU as natural gas and coal. It would be perfectly worthwhile to use 2 BTUs of NG or coal to extract 1 BTU of oil.
The same applies to tar sands: it would be perfectly worthwhile to use 2 BTUs of tar sands to extract 1 BTU of oil.
Of course, it's far better just to get rid of oil, and use renewable electricity instead, but that's another discussion.
Energy resource extraction stops when ERoEI hits 1:1; you no longer engage in the process of energy procurement. That's not to say the resource isn't useful in it's own right, but it isn't a primary energy source at that point.
A few thoughts:
1) That doesn't really apply to tar sands - we can dig up very large amounts really cheaply, and use it to produce oil. Technically the E-ROI might be below 1:1, but as a practical matter it would still be a primary energy source.
2) We're really not anywhere close to 1:1 with any resource, including oil. Oil is still at about 9:1 even in the US, IIRC. Oil production growth is stalled due to a lack of suitable places to drill wells - that doesn't mean the wells still being drilled don't have a decent E-ROI.
The problem with tar sands isn't low E-ROI, it's low flow rate.
3) Oil is the only energy source that's scarce at the moment. It would make sense to substitute other forms of energy in very large quantities for oil production inputs, if needed. IOW, we don't have a problem with our overall primary energy supply, we have a problem with liquid fuels.
4) We really don't use that much oil for oil production. Oil production energy inputs include electricity for pumps, NG for heat, hydrogen, off-shore power, etc. There's a little diesel, but not that much in the big picture. What really matters is Liquid Fuel Returned on Liquid Fuel Invested.
E-ROI is really not that useful for analyzing anything other than biomass.
These are my replies to the questions raised:
>First, demand isn't equal to supply because of a price based mechanism; both are equal because their definition are the same.
Actually, they aren't defined as the same thing in the classic textbook definition. See Wikipedia on the demand and supply curves here:
http://en.wikipedia.org/wiki/Supply_and_demand
>Second, there is no "requirements of transport regardless of any price", requirements of transport are completely dependent of price.
In my model, requirement for transport depends on services output for passenger transport, and industrial output for freight transport. This is because the cost of transport is usually added to goods and services, in other words, often passed on regardless of price. This includes the cost of commuting, that employees pass on to their employers. I accept there are situations where this cost can't be passed on, but demand for transport is notably inelastic.
>Third, there is no "maximum amount of energy that can be produced" if you don't take a price level into acount. There is even no concept of resources and reserves without taking in acount the price level.
Most geologists would beg to differ with that. There is a real, physical limit to how much you can extract from the ground, given current technology, even assuming somebody threw at it all the available money and resources.
>Fourth, that is not an "honest" nomeoclature
Point taken. I'm happy to rename to your suggested terms in the future.
>That is a very different definition for demand than I have ever seen. Why are you using that definition?
"Demand" is the word I knew that came closest to express the concept I was trying to point out. I don't find the economic textbook definition of "demand" particularly useful.
>How do you measure demand without price?
I measure it in energy units, Gtoe to be precise.
>How do you sort between competing demands (without price elasticity or similar money mechnanism)?
I use differences in EROEI for this. It's explained on my first post about the model, the link for it is at the top of the post.
requirement for transport depends on services output for passenger transport, and industrial output for freight transport. This is because the cost of transport is usually added to goods and services, in other words, often passed on regardless of price. This includes the cost of commuting, that employees pass on to their employers. I accept there are situations where this cost can't be passed on, but demand for transport is notably inelastic.
This isn't really realistic. In the short term transportation can change sharply in some respects: for instance, water transport can reduce it's fuel consumption by 50% overnight by slowing down by 20%. In the medium and long-term demand can shift dramatically between modes (water, rail, truck).
Commuters certainly can't pass on the cost of commuting to their employers - at least not in the US!!
I think you need to generally re-examine the idea that energy costs can be passed through - this certainly happens to some extent with surcharges, but in general the current business environment is far too harsh: trucking in particular just has to eat the additional costs in many cases - if they go out of business, they go out of business, and their customers move to other trucking or rail companies.
Third, there is no "maximum amount of energy that can be produced" if you don't take a price level into acount. There is even no concept of resources and reserves without taking in acount the price level. - Most geologists would beg to differ with that.
No, they really, really wouldn't. The standard definition of reserves includes price. Reserves can change by 10x depending on the price level assumed. Heck, Alaska probably has 2T tons of coal at the right price.
How do you sort between competing demands (without price elasticity or similar money mechnanism)? - I use differences in EROEI for this. It's explained on my first post about the model, the link for it is at the top of the post.
Once E-ROI rises above about 10, and certainly above 20, it's irrelevant as a factor for competing energy sources. If NG is at 20:1, and coal is at 30:1, those differences will be irrelevant. Labor and capital costs will be far more important.
Finally, realistically wind is at 50:1, which I don't think is reflected in your model.
I wish there were a better way of forecasting demand than the approach you use. Demand really reflects the consumers' ability to pay for oil. This ability to pay for oil depends on several things:
(1) The price of the oil
(2) The amount of credit availability
(3) Whether or not a consumer has a job, and the pay the consumer is getting at that job.
Charlie Hall has shown with his "Cheese Slicer" models that one big effect of spending more of output for oil extraction is that there is less available to flow through the economy as demand for the products produced.
To me, it is this mechanism that keeps consumers from purchasing oil that has too low an EROI, since too low EROI oil is in many respects equivalent to too high-priced oil.
Gail, I agree with your statements. We often talk about the stair step up in oil prices caused by increasing prices, due to a miriad of factors, mitigated by periodic downturns in the economy, in large part, driven by those same increasing prices.
But it seems we are also seeing another factor entering the equation. As prices step into a new reality, like the $100 per barrel range we seem to be in now, the worlds users tend to look for ways to be more efficient.
Not all of the downturn in gasoline demand, in the US, is driven by the fact there are millions of unemployed no longer driving to work. We are also finding ways to eliminate some of the wasteful habits and activities.
As the stair steps continue, however, the capability of the "low hanging fruit" to mitigate some of these increases will diminish. I believe that will lead to significantly greater volatility. Your thoughts? Bill
Treeman
As the stair steps continue, however, the capability of the "low hanging fruit" to mitigate some of these increases will diminish. I believe that will lead to significantly greater volatility.
At least in the US and other high oil use/capita countries there is a very long way to go before it becomes even slightly difficult to reduce oil/capita consumption.
Three major areas
(1) double average mpg for cars and light trucks
(2) reduce vehicle miles traveled by eliminating a lot of senseless trips by car or car pooling or walking or using mass transit. Some of these will be very easy once gasoline costs are as high as in EU today, others will take time ( especially improved mass transit).
(3) replacing VMT using gasoline with VMT using kWh with either EV or PHEV's. While this will take time it will result in only about 25% of energy use and up to 90% reduction in gasoline/VMT.
(1) OK, I realize this question is not completely well-posed, but, with reference to:
Shouldn't EROEI - or at least something close enough to EROEI as to make no nevermind - simply "fall naturally out of" (as the mathematicians say), any model of this sort that's complex enough to be taken seriously, without having to be put in "by hand" (again, as the mathematicians say)? Do those 16000 WEO equations really manage to include no flows at all of energy into, or dissipated within, the energy industry itself?
(2) I think marcosdumay has more than part of a point about:
On this definition, it should be blindingly obvious that one's "demand" for transport might well be quasi-infinite. If price is not a factor, that is, if transport is effectively free, a family might want to fly to Hawaii every other weekend. OTOH if "requirements" only refers to mere survival with little or nothing of the human enterprise remaining, then "demand" could be quasi-zero. So it doesn't seem like a concept that can possibly be usefully incorporated into a model.
I had similar thoughts on the definition and content of demand, including the notion of fixed efficiency. Obviously, efficiency of use can and will change significantly.
But that's what led me to my post above - does it matter? If the model is good enough as-is, then no, it doesn't. If it won't be good enough even with price and efficiency added, then it's still not a solution.
I cannot tell from the article what "good enough" might actually be. It seems to be a model searching for questions, not a problem with a model devised to offer answers.
As an example, let's think of weather modeling. There are models based on climatic history, simple heuristics, and detailed finite-element theory. Which is "best"? Which are "good enough"? Or "fallacious"? Well, all of them, depending on the question posed.
I should note that building models to gain familiarity with how a system reacts can have value, but you still have to understand the model bounds and assumptions. As Clint says, "A man's got to know his limitations."
Perhaps an interesting question to ask is, "What questions CAN this model adequately answer?"
Edit: Went back and read the linked earlier posts. Mostly this model nicely handles "what ifs" for EROEI and other variables, and indicating where hard crashes vs declines could result. This is indeed the "stress points" I had desired.
The best question I saw, not directly posed, is "Does it help to be smart?". According to the model runs, yes, probably it does. Making purposeful changes proactively rather than natural changes reactively can prevent some of the worst crashes. "There is no need to be hopeful if we can be smart." was a summary quote.
>"What questions CAN this model adequately answer?"
I like your thinking. My answer is: Broad, sweeping questions, mostly focused on the long term. It's about "How could this big factor affect all the other big factors in the world?" So, half the times somebody wants to tweak some detail, I have to tell them: "No point, this model just isn't that precise."
Because there is no price model does not mean that supply is unlimited. It has been a while since I looked at the model but I believe it works like this:
Industrial output works kind of like money, but is allocated by rules other than price. And it goes for lots of things: building more industial capital, maintaining existing capital, increasing food production, dealing with pollution, improving standard of living, etc. Total industrial output is partly dependent on the amount of industrial capital that has been built, so it cannot go infinite, instead it grows exponentially, as a little bit of each years output is invested in growing more industrial capital.
The raw material and energy supply has a cost, but it is a cost in industrial output to produce more raw materials. As a resource depletes, it takes more and more industrial output to produce the same amount of raw materials. (This explicitly simulates falling EROeI)
Much like Hall's cheese slicer, as raw materials become more expensive, there is less and less industrial output to allocate to things other than getting raw materials. Eventually, there is not enough to pay for maintenance and the decline sets in. Each year there is less and less industrial output to allocate.
I do expect (but have not confirmed) that the WEO does have a rising cost of production. The problem is that cost is not as useful as EROeI. The issue is that only about 13% (1) of energy expended ends up as useful work. So a small increase in EROeI from 50:1 (2% of output consumed as input) to 20:1 (5% of output consumed as input) puts a major slam on that 13% total. 10:1 (10% of output consumed as input) is a serious reduction. And a small increase in cost, say from $4.00 per mmBtu of natural gas to $12.00 per mmBtu can do exactly that. The problem with cost is that energy is cheap, so a small increase in drilling cost can mean a heck of alot of extra BTU.
(1) Total efficiency for the US energy system from Crossing the Energy Divide: Moving from Fossil Fuel Dependence to a Clean-Energy Future, Ayres, R., Ayres, E. 2009, Prentice Hall.
"Because there is no price model does not mean that supply is unlimited."
Correct. The issue was with "demand", which, without price, doesn't necessarily have any relevant limits, and therefore can never be "met" if there are any physical limits to supply at all. So "demand" without price still doesn't seem like a fruitful concept.
Disagree. The (economists) price-centric view is mistaken, in reality money is unlimited whereas resources and capital are finite. Money affects the distribution and allocation both geographical and individual, but the aggregate is determined by physical and behavioural (political/policy) constraints. Size of the pie is determined by real physical limits, whilst your share is sliced through human socio-economics. We use "Economic Science" as a rationalisation for our socio-political behaviour.
The important thing about prices is not the value of each kind of good*, but how those values relate with each other. For that it makes little diference if the suply of money is increasing or reducing, neither if it has bounds or not. The only important features are that it doesn't change too fast for society to track and that it is finite at any instant.
* Of course such statement can't go without exceptions... It is too broad. It seems that for the relationship of consuption and investiment (agregated) the change in the supply of money is also important, thus that relation is sensible to the money supply. Notice that the model includes that relation, and thus, should be sensible to the money supply. There is some implicit assumption there about that information.
But, yet again, you, too, have changed the subject from "demand" back to supply. I'm not trying to argue about physical limits to supply right now. I'm still trying unsuccessfully to grok how "demand", which absent a price is functionally unlimited, can play a useful role, or any role at all, in a mathematical model unless a price, or something that functions so much like a price as to make no nevermind, is included.
That is, absent a price, set "demand" to the constant value of infinity in the computer code; then, since that will cause floating-point exceptions or greatly complicate matters, drop it altogether and move on. But apparently the modelers didn't drop it; therefore they must have incorporated what would function as if it were a price, in order that it should not be infinite. Perhaps they just set it equal to supply. But the keypost suggests it was set according to mushy subjective considerations of "requirements" of transport, electricity and heat. Since I don't doubt that some people "require" an overseas roundtrip flight every week or three, and that many more would if only they could, I'm still baffled as to how one even formulates such a "requirement" (or "demand") mathematically to include it in a mathematical model. (That is, before I might ever agree or not with a particular formulation, it would have to exist first.)
Now, I do suppose that we could slice the "share" by way of the human socio-economics of the barrel of a gun wielded by a dictator's minion, rather than by using a pricing mechanism of any sort understood in economics. This has been done many times with horrific results. Or, if humanity were a tribe of dozens instead of a horde of billions, we could slice it by way of the human socio-economics of any of various mechanisms that have been observed by anthropologists studying close-knit tribes. But any of that seems too subjective and/or arbitrary to formulate suitably for inclusion in a mathematical model.
Dolores, I hope you take the opportunity to talk with Andrea Bassi or his colleagues at Millennium Institute (Wash.DC). They produced a dynamic systems model of North American energy flow (with simplified models of Canada & Mexico). This work was funded by ASPO-USA with support from an anonymous donor in 2007. I pulled Charlie Hall and a couple of his grad students into the project to incorporate ERoEI factors into the equation - this is the source of what Charlie and Gail call his "cheese slicer" model. Charlie's guys did the visual interface also. You can watch the model go from 2010 to 2050, with the energy feedback arrow (to produce more energy) getting fatter, while the remaining available energy for "everything else" gets skinnier.
As other commenters here have suggested, (estimated) ERoEI should be a key component of any energy-related dynamic systems model. I would love to build in Jeffrey Brown's / Sam Foucher's database into a comprehensive model as well, but I suspect that's way too much detail for the model you're doing.
The inspiration for all this was "Beyond Oil" (the original 1986 version) an account of a dynamic systems model of energy flow through the U.S. economy, by Robert Kaufmann, Vorosmarty, and a couple of other former students of Charlie's back then. We wanted to expand it to a global model, but funding only permitted the North America version.
Dick Lawrence
>Shouldn't EROEI - or at least something close enough to EROEI as to make no nevermind - simply "fall naturally out of" (as the mathematicians say), any model of this sort that's complex enough to be taken seriously, without having to be put in "by hand" (again, as the mathematicians say)? Do those 16000 WEO equations really manage to include no flows at all of energy into, or dissipated within, the energy industry itself?
I don't have access to the whole model, so I can't tell. All I can say is that I couldn't find anywhere on the report anything that looked like it's been considered. And if it has, no telling to what extent.
Firstly, Ms Garcia excellent work.
Secondly, for those focused on price please explain the connection between $/yen/pound etc and energy.
C
This is great! Are you planning to make any of the source code or data available? Might help to have others' input. The company I work for uses this philosophy: is.gd/8rorJT
I'm happy to make the source code available. You can contact me at d (dot) garcia2 (at) brighton (dot) ac (dot) uk
Once conventional oil production peaks in a given region--in the absence of political factors--there may not be an oil price, at least a realistic oil price, that will keep conventional oil production on an upward slope. The Texas & North Sea case histories, with annual oil prices on the vertical axes and crude oil production on the horizontal axes:
And Peak Oil Versus Peak Exports:
http://www.energybulletin.net/stories/2010-10-18/peak-oil-versus-peak-ex...
The updated 2010 (BP & EIA) data base shows that Available Net Exports (ANE), i.e., Global Net Oil Exports less Chindia's combined net oil imports, fell from about 40 mbpd in 2005 to about 35 mbpd in 2010, a volumetric rate of decline of about one mbpd per year.
Off topic:
Sam Foucher posted a recent analysis of the JODI vs IEA production stats, along with an update on the median and mean forecasts from everyone. Really great.
It made me think that there has not been an update of the mega projects database for a while.
I have been trying to map bottom up production from the megaprojects 2011 - 2015 to the average forecasts. When I squint, it actually maps quite well.
Can anyone help me with a more reasoned approach?
Polytropos, this post would have been welcomed on Drumbeat. It should have been posted there. Key posts moderators do not tolerate off topic posts very well, with good reason. Anyway...
Copied and pasted from Wikipedia Megaprojects...
That is really quite recent. I don't think we can expect updates more frequent.
Ron P.
Ron
Sorry I saw this at the top of the Oil Mega Projects page
"Volumes shown are in thousand barrels per day. The summary table below is produced by a Perl script parsing each annual table. This script is not run every day so some discrepancies may appear (last update: 18-JAN-2010)."
which made me think the data had not been updated in a while
I am interested in working with the original Vensim model, but can't seem to find a copy of the file,"WRLD3-03-energy-sources.mdl". It appears to be no longer available on Uploading.com. Can anyone direct me to a copy of this file?
OK, uploaded again:
http://uploading.com/files/ff65md1b/WRLD3-03-renewable-electricity.mdl/
Could I just switch the order of the layers, so that the more speculative sources are on top?
It strikes me that one of the questions we are dealing with is how do you set price when we move to a supply constained world? Historically, supply generally grew to meet demand with price fluctuations driven by time lags, or supply disruptions, using some variation of the Theory of Storage.
But what happens when we move into a permantly constrained world?
It strikes me that DG's modelling is attempting to descibe the outcome of that but is missing that crucial middle step of how do we get there.
I have traditionally worked with higher prices allowing us to move down the resource pyramid: smaller, better technology, dirtier etc. In that world price works and I understand it, even though it won't meet eventual supply needs.
Another model suggested here is the EROel approach. I have seen comparisons of pricing between alternative energy sources that mostly still support hydrocarbon sources at least in this part of the world.
The question I have for DG is what mechanism did she use to move to low CO2 emmisions sources of energy? Did she use EROeI as a substitute for price? If not, how did she allocate world supply?
Do any of you know if there is an attempt by policy makes to link EROeI to price beyond a carbon tax? I am not aware of it, but it is not my field.
I see that Chris has a whole section on EROiL that I missed. I think my questions are still valid but there is some good information there.
CO - Excellent question about limited resource pricing. Wish I had a good answer. But I can offer a little anecdote you in particular might appreciate. In the super hot Eagle Shale play in south Texas we're almost to 200 rigs drilling nonstop. But there is a huge bottle neck holding up production: frac trucks. A couple of months ago I heard about the problem Petrohawk had: they had drilled 34 wells but had only completed 14...waiting on frac trucks. So tite the service companies won't take any trucks out of the region. Some companies have banded together to tie up trucks long term by a guarantee of 24/7 rates whether the trucks are being used or not. Folks might think the frac companies can charge whatever they want. Obviously not: at some point if frac costs get to high it will cut too deep into the profit motive. But as been pointed out before profits are not solely driving the play: it's the demand from Wall Street that public companies continuously expand their reserve base. Thus the real cost/benefit ratio is based upon the increase in market capitalization and drilling costs. IOW: who derives the greatest monetary benefit from paying the top (but capped) drilling/completion costs?
A side note: folks might think the service companies would be building frac trucks as fast as possible. But it's complicated. It can take up to 18 months to produce a frac truck (lag time for new turbines is the big hang up). Add the uncertainty as to how long the boom will last and that it typically takes several years to pay back such capex investments, the service companies are somewhat hesitant. And if they then were to see a softening of the market the new trucks would push prices down even further. I see the same potential dynamic for the KSA and any efforts they might make expanding their production capabilities. Invest in new production capacity and see a softer market destroy some of the profitability of that investment. Don't add capcity and they keep oil prices higher.
Perhaps the same dynamic would apply to PO limited energy sources: the buyer that can max the value of the conversion of oil in their economy can pay the higher price. As an example: China. Not that the Chinese don't like making a profit but I see a capability on their part to acquire energy resources at prices that don't deliver a significant MONETARY return. But just like the public oil chasing the Eagle Ford there's a different objective: increase share holder equity. In an odd sense perhaps China sees their efforts in a similar light: not so much to make a profit but enable an increase in their "shareholder's" (citizens) equity in the country. The greatest value for the Chinese govt may be completely non-monetary: avoiding social unrest. They seem to be in a conversion mode from communism to free market. And as they do they seem to feed the desire of their citizens for the type of growth pattern the US saw the last 100 years or so..
So the day comes when there's only enough resources to supply the highest bidder. The question of pricing may be determined not such much by rate of return but keeping the natives from getting restless....the Chinese citizens or ours. The problem for the US in that struggle is the Chinese govt's ability to have fairly complete control over the energy and consumer sectors. US response will still be dominated by the profit motives of public/private companies. Given the long standing somewhat adversarial relationship between the US govt and the energy industry it's difficult to expect anything close to a united front for us.
Today the US is deploying an expensive military to stabilize/secure the ME. China is deploying an expensive energy acquisition effort. Time will tell who reaps the greater benefit.
>It strikes me that one of the questions we are dealing with is how do you set price when we move to a supply constained world?
As far as I know, when resources are constrained enough, you end up getting a market failure. At that point, governments usually intervene and institute rationing.
>The question I have for DG is what mechanism did she use to move to low CO2 emmisions sources of energy? Did she use EROeI as a substitute for price?
My model uses EROEI as a substitute for price, because over the long term it seems to be roughly accurate, and it doesn't suffer from many of the problems associated with price.
>Do any of you know if there is an attempt by policy makes to link EROeI to price beyond a carbon tax?
I think EROEI is already roughly linked to prices, by the usual pricing mechanisms. If a source of energy takes a lot of energy to produce, it will also need a big expenditure to exploit.
dolores,
if you have written some technical reports or articles about these models i would be very interested in looking at them in more detail. so could you give links to the relevant papers.