| Oil Shocks Around the World: Are They Really That Bad? | The Oil Drum | Tech Talk - Future Natural Gas Production from Western Siberia |
January Oil Supply
Posted by Stuart Staniford on February 24, 2012 - 4:49pm
Stuart Staniford is a scientist and innovator in the technology industry with advanced degrees in physics and computer science.
This post presents the latest data from the Energy Information Administration (EIA), the International Energy Agency (IEA), and the Organization of Petroleum Exporting Countries (OPEC) on crude oil and associated liquids production and price as of January 2012. This article is cross posted from Early Warning, where it forms part of a long-running series of articles that charts monthly changes in global oil supply (total liquids) from the EIA, IEA, and OPEC.
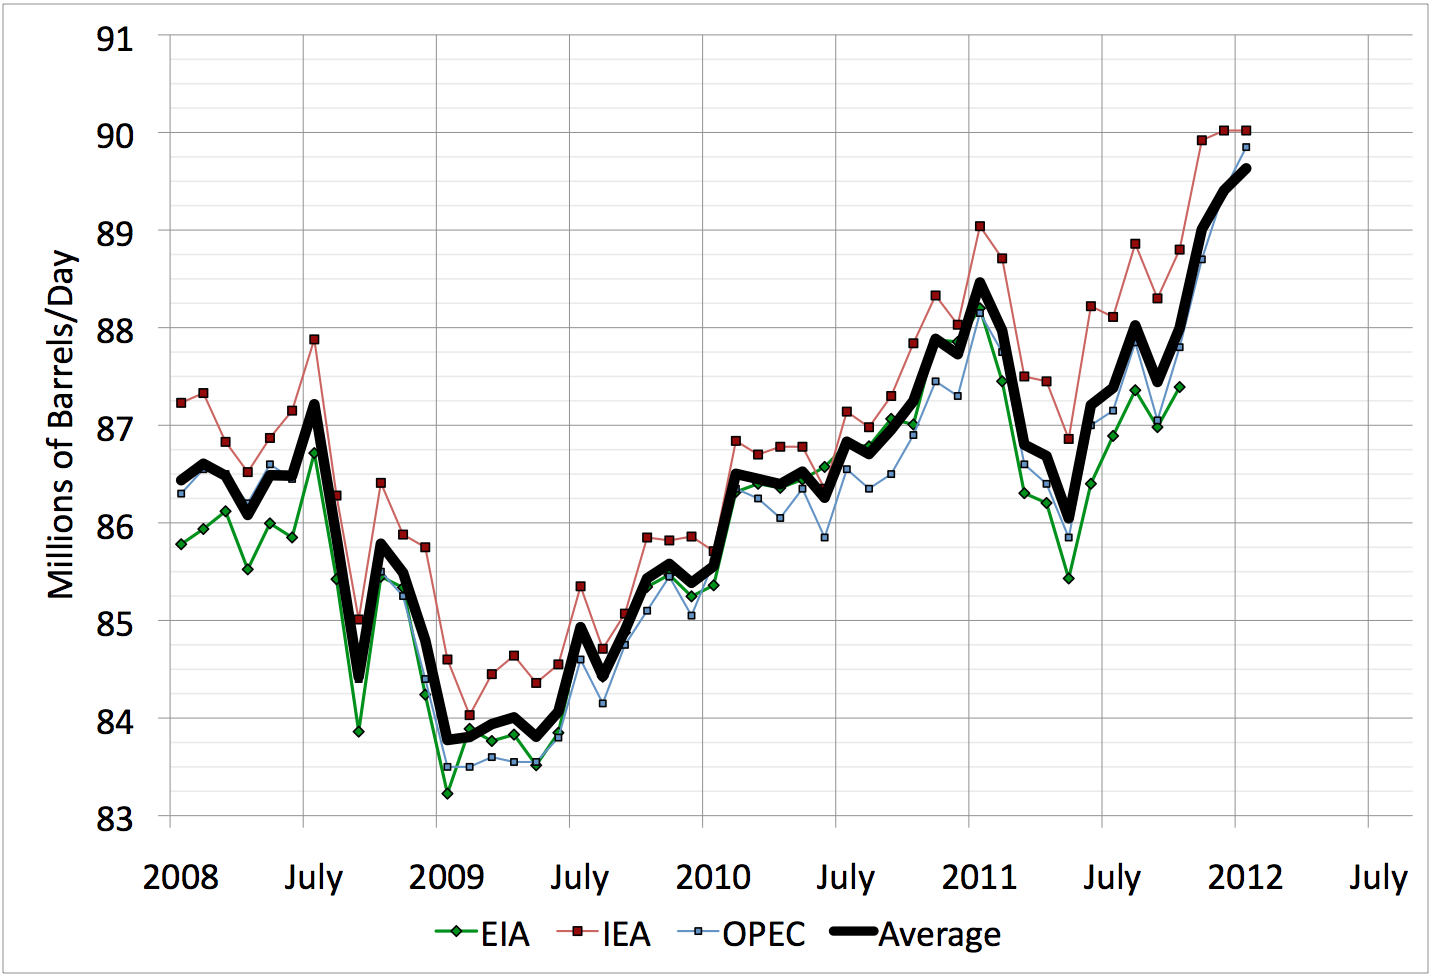
Total liquid fuels were at all time highs in January, according to OPEC and the IEA.
A graph of changes just since 2008 is above, and a longer picture (with prices on the RHS) is here:
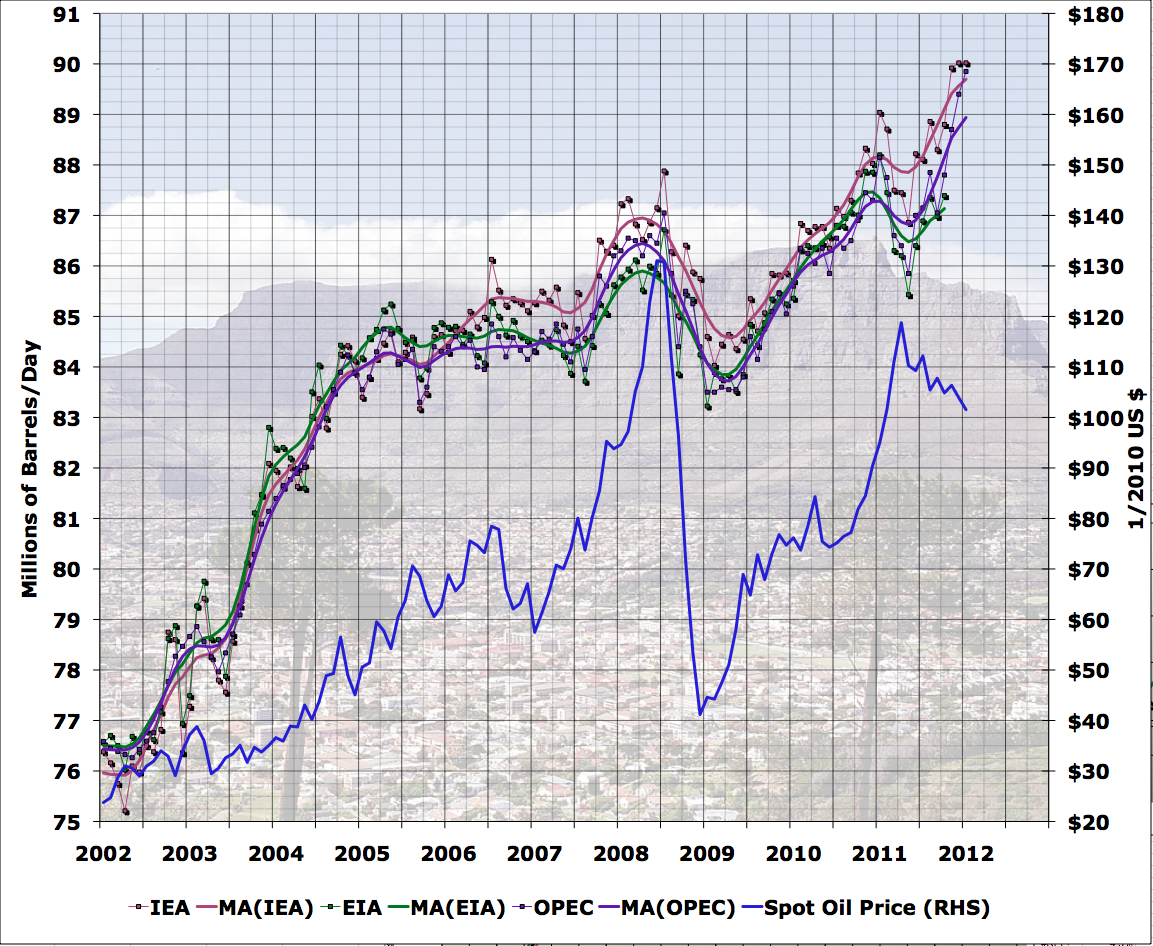
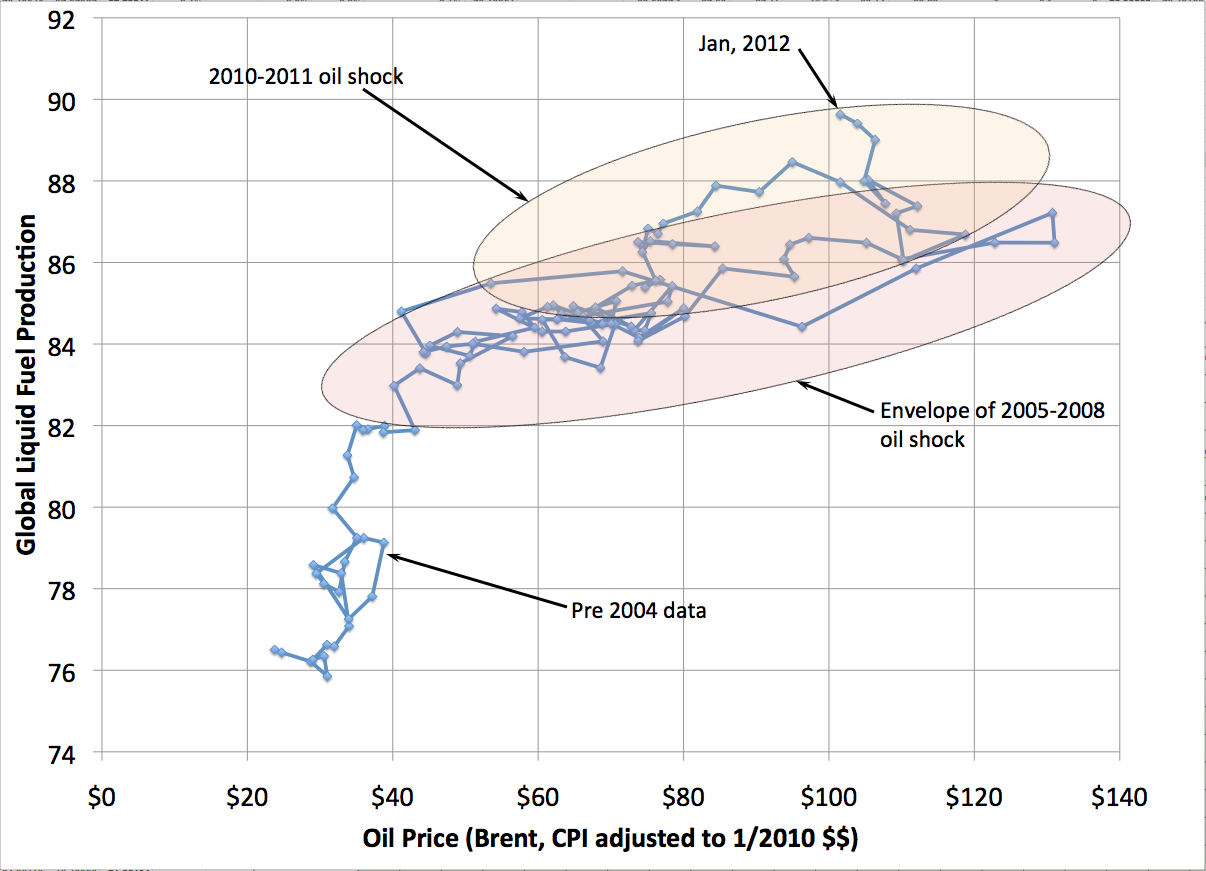
The combination of higher production and (slightly) lower prices is causing the price production curve to push the envelope of recent behavior:
The above data are all for "Total Oil Supply" aka "Total Liquid Fuels". To break it down into components we need to rely on EIA data that only go through October (so we can't see where the surge in Nov-Jan came from yet):
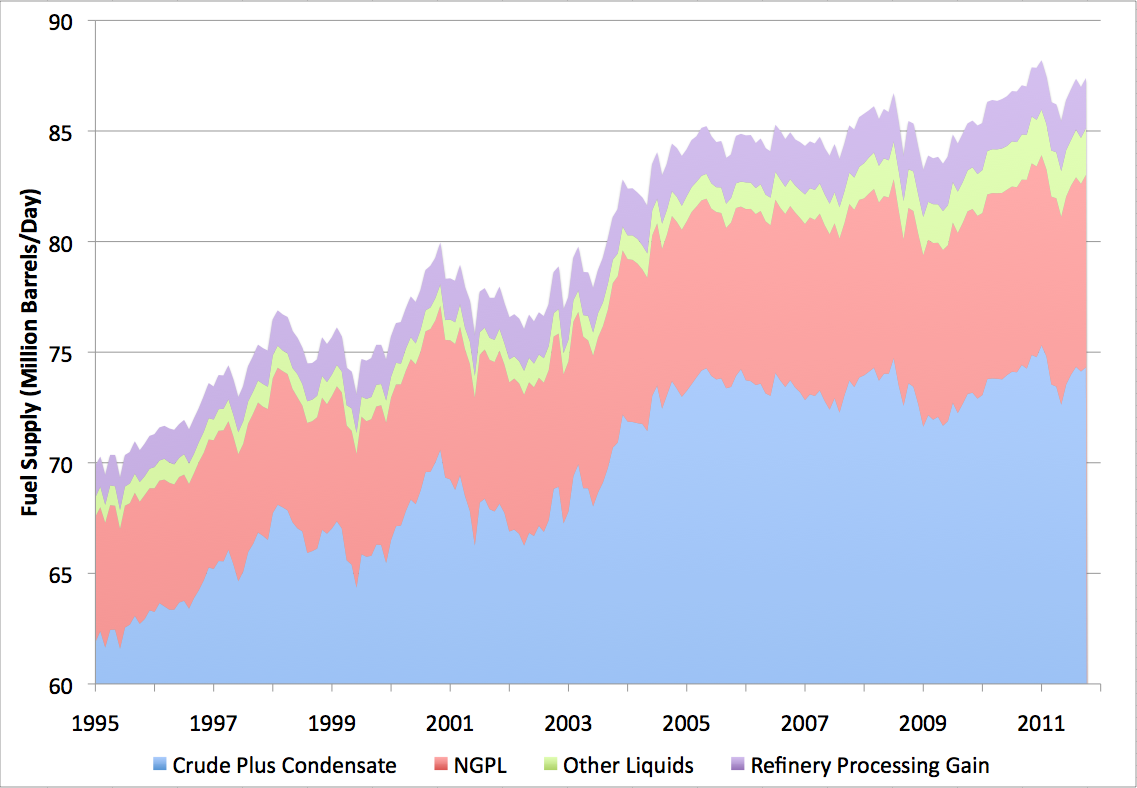
Note the above is not zero-scaled. It allows us to see that "crude plus condensate" (C&C) has been pretty flat since 2005, with increases in the total mainly coming from other components of the liquid fuel stream. This next picture makes a line graph of that data and moves the "crude plus condensate" line onto the right hand scale to make the changes in the different streams more easily comparable:
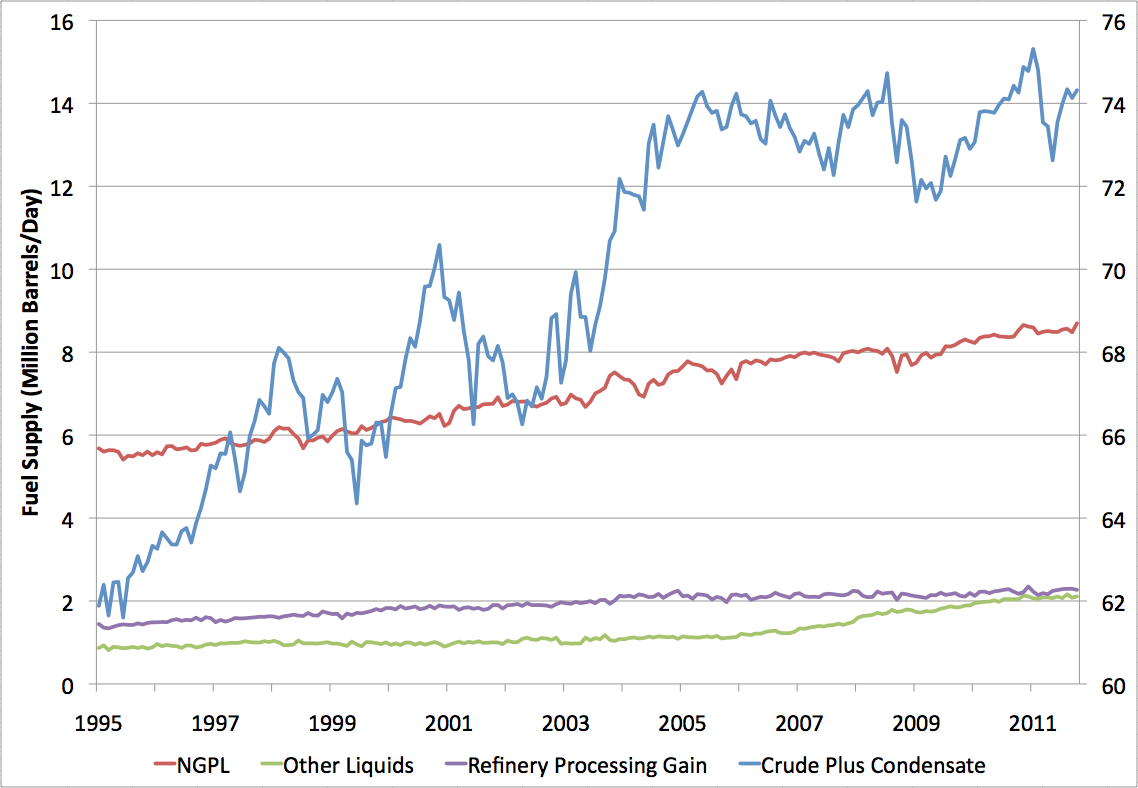
You can see that during the C&C plateau period since 2005, about 1mpd in additional total supply has come from a long standing trend in the increase in natural gas liquids (NGPL), while another 1mpd has come from "Other Liquids" and appears to be specifically a response to the plateauing of conventional oil. This is mainly biofuels. Note that the increases in "Other Liquids" appear to have leveled off in 2011. The world has very limited capacity to produce more biofuel without causing severe increases in food prices.
Contact
- Content: editors at theoildrum dot com
- Tech support: support at theoildrum dot com
License

This work is licensed under a Creative Commons Attribution-Share Alike 3.0 United States License.
Thanks for the report, Stuart. Looks like everything is being thrown at the problem and we're managing to remain flat where it counts the most.
An increase "in total liquids fuels" from 76.5mbd to 89.5mbd in 10 years looks like flat to you ?
And only a 5x increase in price, too! Of course, if one chooses to keep it apples-to-apples, then the crude-only component would actually be down. Moving the goal-posts is a fallacy all its own.
Normalize per-capita and it would be lower still.
Normalize per-capita exports, and it would be lower still.
It really shouldn't be a big surprise that as crude goes up in price, other sources will be leveraged. An interesting graph would be per-capita total energy. Where is the peak for that?
Edit: Easy to answer. Here's a graph of population: 2.5B to 6.5B in 40 years.
http://en.wikipedia.org/wiki/File:World-Population-1800-2100.png
And total energy: 250 to 550 exajoules in 40 years.
http://www.theoildrum.com/node/8936#more
So, we're past peak per-capita energy already.
Not surprisingly, the ultimate solution to energy problems is fewer people.
And as NGLs and ethanol have only about 70% the energy per volume of crude, it would be even more interesting to see that graph on a BTU basis, rather than a volume basis.
AND, as the EROEI of all liquids is dropping - ethanol just a bit better than unity, and shale oil, deep water etc. all much lower than good ol' Texas or Saudi oil spurting from the sand - it would be even more instructive to see a graph of per-capita total net energy on a BTU basis.
Stuart?
The increase in total liquids is somewhat smaller when the energy content of biofuels and ngl is considered. Each of these has about 70% of the energy of C+C. I have made this adjustment using EIA data and have created the following figure for World liquids in millions of barrels of oil equivalent. If the fiqure has a zero on the y-axis scale it looks very much like a plateau from 2004 to 2010.
In addition I have a figure using monthly EIA Data which has been adjusted for energy content as above and smoothed over a centered 5 month period from Jan 2000 to October 2011 (smoothed data from March 2000 to August 2011). Also looks like an undulating plateau from March 2005 to August 2011.
An interesting graph would be per-capita total energy.
Common knowledge? Developed countries decreasing across the board, developing countries increasing. Solution? Develop the developing countries.
http://www.google.com/publicdata/explore?ds=d5bncppjof8f9_&ctype=l&strai...
Also see economic energy intensity (i.e. energy per unit GDP) which is declining nearly everywhere. US has cut intensity in half since 1980.
http://www.google.com/publicdata/explore?ds=d5bncppjof8f9_&ctype=l&strai...
This means also that since 1980 twice as much GDP is dependent on each barrel of oil (or unit of energy). So for each barrel lost to the international bidding war, we lose twice as much GDP as we would have in 1980.
"lost to the international bidding war" That's a bit hollywood sounding. The price is going up, barrels are not necessarily lost, they become a more expensive part of the product, or the manufacturer becomes more efficient and uses less, as the trend so far has shown they can do. It also becomes easier to seek alternatives the smaller the fraction of energy in the cost of the product.
Not to mention that for low EROEI liquids like ethanol, we are essentially double-counting the crude oil products that get used to produce it and other 'all liquids' that take oil-derived energy to create.
Luscar99 is looking at figures that the aggressive predictors in the Peak Oil community didn't predict, but is overstating what they mean:
1. Crude + Condensate, while basically flat, has increased a little.
2. Total Liquids has continued to grow, although not strongly.
Now, I'm assuming that the US production from fracking the Bakken shale & similar fields is included in C+C. Nobody in the Peak Oil community was predicting an increase in US production before it happened, but now it is. The question is how far, and for how long, the increase can be kept up. This will depend crucially on the decline rate from these wells. On the basis of the limited information before me, I suspect the decline rates will be pretty high and that most of the oil in the Bakken shale will stay underground - but I emphasise that I could be wrong and projections for future US production will hinge crucially on this point.
When Total Liquids is disaggregated, it turns out that NGPL is the major contributor to the increased production in recent years. Lots of cars in Australia have been converted to run on what we call Liquid Petroleum Gas - including, I understand, the entire taxi fleet. NGPL, obviously, depends firstly on natural gas production and secondly on the degree to which each NG field is "wet" with liquids that can be stripped out. At present, NG production is rapidly increasing on a global scale, for a range of reasons of which only a minority are linked to resource discovery. Eventually, NG production will peak itself, though I haven't seen work done on this with anything like the detailed coverage of the data that we have with oil. On that basis, I'm reluctant to put a date on Peak Natural Gas. If someone can point us to sufficiently detailed work on that issue, it would be a service.
When the longer term graph of oil production compared to prices is examined, it is obvious that supply constraints are showing up. I believe that, for practical purposes, we've reached a peak of C+C. We don't know when the decline will kick in, though, and thus when it will counter-act the increase in NGPL. And as for biofuels, they don't add materially to the net energy available in society, so I believe they should be ignored completely.
Just a clarification on LPG in Oz. LPG is 1/3 butane and 2/3 propane (your bbq cylinder is all propane). 80% of the LPG in Australia is from NGPL, and 20% is actually from petroluem refining. Australia produces 3.3m tons of LPG per year, and actually exports 42% of that, so there is more scope still for increasing the LPG fleet. The LPG consumption is equal to about 40,000bpd of oil.
http://news.lpgaustralia.com.au/link/id/27015924bc2b640761a0/page.html
The taxi fleet has been on LPG for at least three decades now (My family converted a car to LPG in 1984).
there are now over 500,000 LPG cars in Australia -out of a fleet of about 10 million, so a 5% rate. But more importantly, most of those 5% are in the top % of miles/car/year, as it is the high milers that buy/convert LPG cars. I would not be surprised if LPG represented 10% of car miles.
I have been arguing that the response from the price increase caused by peak oil would keep U.S. crude oil production between 5 Mb/d and 6 Mb/d for about 20 years (there is ~15 years left in that projection). So far, so good.
I have argued that liquid fuels production would continue to rise for some time after peak oil because it is composed of NGL's whose production has not yet peaked.
I concluded years ago that the Stair Step Descent model is the most likely scenario. The world economy would be beaten down by a series of oil price shocks as demand and maximum global supply intersect. Although I am uncertain about the duration of the periods of the shocks, I anticipate the periods will be larger at the peak, shorter near the inflection point on the falling edge and then increase along the tail. Releases from SPR's are unpredictable and can moderate these shocks.
Export Land Model is a cogent theory and so far, is playing out.
I am still forecasting inflation in the price of food and energy while the world economy generally declines.
The comments at TOD contain salient information and are not posted by nobody.
Methinks, like much of society, Luscar99 is grabbing at straws.
It is not clear what Luscar99 actually thinks. There are silly people who think economies and oil production will grow exponentially without limit. But pointing out that the data shows 10 years of growth in total liquids production doesn't make you one of them. Go look back at the alarmist predictions from a few years back (here is one: http://www.theoildrum.com/node/2331). They were wrong. Gives you reason to suspect that the people currently claiming total liquids will fall off a cliff in the next two or three years are probably wrong too. The data presented in this post doesn't support the story that we are near the 'end of an undulating plateau'. Luscar99 pointed that out. Seems like she/he is right.
The data presented in this post doesn't support the story that we are near the 'end of an undulating plateau'.
No, and I don't think anyone here, or the author, was claiming that it does.
But, the data presented sure do support the story that were on an "undulating plateau"
Luscar99 wrote;
An increase "in total liquids fuels" from 76.5mbd to 89.5mbd in 10 years looks like flat to you ?
Now, that 76.5 was the bottom of a trough, a convenient point to come up with the greatest change over 10 yrs, but you could go back two more years and then you have from 80 to 89.5 in 12 years, which doesn't sound nearly as exciting....
It would be more accurate to say something like;
-There was a generally rising trend, of 1.5mbd/yr (all liquids) from 70 (1995) to 85 (2005). A gradient of 1.5mbd/yr
-There was a plateau at around 85 from 2005 to 2009 (with a hump) - gradient of zero
-from 2009 to 2011 (inclusive) there has been an upward trend from 85 to 89.5, a gradient of 1.5mbd/yr
There is no question that we have seen an increase in *all liquids* in the last few years. Does this mean we have broken out of the plateau? Who knows.
What we do know is the actual *crude* has gone from 74 to all of 76 in the last six years - most of the growth has been in non-crude liquids.
So we have even less data to suggest that crude has gotten off its plateau - a 2.7% increase in six years sure seems pretty flat to me.
"..Go look back at the alarmist predictions from a few years back (here is one: http://www.theoildrum.com/node/2331). They were wrong.."
Did you actually read that link or are you just reacting to the headline of the post (btw - that post happens to be the same author of this post under which you are responding.]
The article is actually pretty well balanced - the headline is eye-catching but most are. Some key points: (the bold emphasis is mine) - note that the date for this post was in January 2007 (so 'today' is ~5 years after that post) and the predictions, such as they are ONLY pertain to the C&C production from the Kingdom of Saudi Arabia
"..
Production began to decline again in 2005, and at greater rates through 2006. This was only arrested briefly by the arrival of oil from the 300kbpd Haradh III development in late spring of 2006.
If these trends were to continue, Saudi oil production would halve over the next five years. However, it seems more likely that KSA will find ways to bring smaller fields on line and start to mitigate the decline within this time period.
.."
There IS a bet Stuart refers to in his post for which he raised the stakes to $2000:
"..I'll bet $1000 [upped to $2000 in 2007] with the first person who cares to take me up on it that the international oil agencies will never report sustained Saudi production of crude+condensate of 10.7 million barrels or more..."
Do you care to take him up on that?
He has a graph predicting Saudi production falling off a cliff (his halving over the next 5 years) but his 'mitigated' scenario in 2011 is still below 7 Mbpd. Actual seems just under 9 Mbpd (http://earlywarn.blogspot.com/2011/06/latest-saudi-oil-stats.html) with large fluctuations but very roughly flat over the last decade. I don't study the details to predict oil production so am not interested in bets. But for some reason the scenarios posted around here are very regularly below what actually turns out.
I provided the caveat designed specifically for you it would seem: "where it counts the most". I'm speaking specifically of C+C but it's nice to have that other stuff adding to the total liquids number.
And the increased demand from Japan to provide liquid fuels for generation of electricity due to the idling of 70 out of 73 nuclear power plants is on the demand side, so it does not count as negative "supply"? Right???
No: "Crude plus condensate (C&C) has been pretty flat since 2005" ...and again in the following paragraph: "C&C plateau period since 2005"
Looking at your graph number 4 (crude + condensate in blue), it looks like that one has undulated itself into a plateau
But I guess the brave new word for our brave new world is "all liquids"
When do we move onto "all hot air"?
In chart 4, which sections include bitumen (tar sands), shale oil (a la Bakken), and other "unconventional" oil (ultra deep ocean, arctic)? Also, where does all that NGPL get consumed?
All the "unconventional" crude oil, is still Crude Oil, and is included in the "crude+condensate" numbers.
Thanks Paul. I'd really like to see those "crude" components broken down and quantified.
As it should be. However, such crude tends to be more expensive to produce and sets a clear floor on any anticipated drop in oil prices if only we "drill here, drill now".
In regards to the NGPL question...
I would guess about 8% is consumed in automobiles globally. Propane and ethane are the two major liquids in this category. Propane is used for cooking, heating, and petrochemicals. Ethane is turned into ethylene and used for petrochemicals. These liquids have ~30% less energy than an equivalent amount of crude oil.
Autogas
That leaves me wondering what a 'Net Energy' graph would look like. After all, if we included sea water as a liquid, we could show increases on this graph indefinitely. But the energy represented would be very different.
When you think about the low EROEI of tar sands and deep water plays that make up most of the increase in C&C, and the larger number of wells that need to be drilled to get the same amount of oil, then add in the lower energy density of NGPL, I would bet that most of the apparent increase would disappear.
You would think with the number of wells increasing and pipeline issues that the oil industry is using much more oil itself. I would like to see that data since it would have to subtracted, too.
Thank you goghgoner and dohboi. I have been beating the EROEI, net energy drum for years here. To reiterate, there are at least 3 factors that are ignored in the total liquids graphs up top. One - NGL's and ethanol have only 70% the energy that crude contains. Two - the EROEI of all liquids is dropping - fracking and deep water drilling, just to name two, require much greater inputs per unit of return than does conventional on-shore. Three - the population continues to grow, so per capita available net energy is what matters. And as a corollary to that, the portion of the global population that is reliant upon and has lifestyle expectations based on readily available liquid energy grows every year, so the call on the decreasing net available energy grows even more rapidly than does population itself.
Only a graph that takes into account energy density, net energy and population can accurately paint a picture of the global liquid fuel situation.
Perhaps if we gang up on him, we can convince Stuart to put his considerable analytical skills to creating such a graph...
G. Thanks for your concise answer. I assumed most was for heating and cooking. The automotive portion is what I wondered about. Based on a quick search, it looks like propane for heating/cooking is considerably more expensive than LPG for transportation. Not sure why.
Perhaps because those who use propane for heating and cooking don't have a choice in the matter, as that is what is available in many rural areas, while those who convert automobiles to use LPG are most likely to do so in areas where LPG is relatively cheap. In the USA propane in New England costs twice as much as it costs in the Midwest.
In the old days of farming one could use propane for drying grain. 25000 gallons used to dry your wheat and sunflowers was at a cost of 15000 USD. It is now too costly to dry grain with propane and farmers are switching to coal to fire their grain dryers at a considerable savings.
Coal returns to provide even more energy.
"Total liquid fuels were at all time highs in January, according to OPEC and the IEA."
And Brent closed the week over $125....imagine that.
Higher lows and higher highs, C&C supply is trending up. As for "total liquids", well that's a classic breakout...
I'll leave it to the delusional peakers to make a clearly trending-up graph into a plateau...and slice and dice the supply...I'm pretty sure they will be able to come up with at least one fuel source of some particular API gravity/ composition/method of extraction that was in decline.
With sustained prices well above $100/barrel, one would expect producers to squeeze out a few extra barrels. One month of barely higher production at significantly higher prices says a lot. A doubling of prices over half a decade with only a few percent increase in production = supply constraint, and has peak oil stamped all over it. Your delusion may vary...
Amazing...a few extra barrels huh?..is that an increase or not?...weren't we supposed to have reached peak by now ?...and a few extra barrels actually means about 1.3mbd (million barrels per day) on average per year for the last 10 years...over 13mbd increase in total supply since 2002!!!...
If you live in an oil importing country what matters is how much oil is exported. Are you disputing the fact that net exports reached a peak in 2005 and now are below that number in spite of much higher prices?
[Edit]
Declining exports causes price to go up. High price causes demand destruction.
Bulk of the reduction in US imports is due to loss of purchasing power caused by recession and high price. Only about 0.5 mbpd is due to increase in domestic production.
Don't you think if oil was priced at $20-$30/barrel there would be a lot more demand for it?
Bulk of the reduction in US imports is due to loss of purchasing power caused by recession and high price. Only about 0.5 mbpd is due to increase in domestic production.
The recession is a plausible reason for *part* of the import decline, but clearly there can be others. Why ignore them?
o Domestic crude. The bottom of US crude production (non-Katrina, non-2008 panic ) appears to be about 2006 at ~5 mbpd and has been increasing since then, up about 0.8 mbpd, plus refinery gains.
o Gas liquids. Add another ~0.5 mbpd in new gas liquids.
o Ethanol production nearly doubled from .6 mbpd to the current 1 mbpd 2008-2010.
o Efficiency, conservation. US economic energy intensity (energy required for unit GDP output) has continued its decline, dropping by half from 1980 to present, 10% in the last ~5 years. US energy use per capita continues a downward trend, at 7 tons BOE in 2009. The last time energy use per head was that low was in 1967.
The total miles driven has decreased significantly since 2007. Also, the amount of gasoline delivered to your neighborhood gas stations is down almost 50% compared to a few years ago. Clearly the recession and the high price of gasoline (they are related and not independent factors) have played a major role in lowering oil consumption in the US which has resulted in a big reduction in oil imports. Car fuel efficiency is not much higher today compared to 2007.
The largest consumers of oil (US and EU) are in a recession and yet the price of oil is well over $100/barrel. How do you explain that? Clearly oil importers are in a bidding war for declining exports.
The total miles driven has decreased significantly since 2007
From 10,000mi/yr to ~9700, 3%. This source also shows a 3% drop since summer 2007. Is that significant?
Also, the amount of gasoline delivered to your neighborhood gas stations is down almost 50% compared to a few years ago.
US gasoline supplied last week (3rd week Feb '12) was 8.2m bpd. Gasoline supplied at the same time of year back in Feb 2007 was 9.1m bpd, a decrease of 10%.
Car fuel efficiency is not much higher today compared to 2007.
New vehicle car:
2007: 31.2
2011: 33.8, 8.3% improvement
New vehicle light truck:
2007: 23.1
2011: 24.5, 6% improvement
Average all light duty existing
2007: 22.9
2009: 23.8, 4% improvement over the two years, on trend would be 8% 2011.
The largest consumers of oil (US and EU) are in a recession
There are a distressing number people out of work, but the US recession, as the term is officially defined, ended back in June 2009 with low but positive economic growth since then. Nonetheless consumption has continue to decline while economic growth increased the last two years.
There are other improvements or a switch from petroleum to alternatives. As mentioned up thread Maine, where oil has long been the major heating fuel, cut back on heating oil by 45%.
"Higher lows and Higher highs...well that's a classic breakout.."
Amusing, I wasn't aware that oil production followed the same group psychology dynamic as the stock market. Please continue, I haven't had such a laugh in awhile - maybe all we really need are a few more oil bugs investing in 'the market' and our future oil production worries will be over. Better yet, throw in a few more changes in definition of what is included in the production graphs too (perhaps the amount of entrained liquid 'water' pumped out with the oil and natural gas liquids and then we can show the pumped 'liquids' RAPIDLY increasing)
Yes the trend has been up, as it was in the US until 1970. The past 7 years the growth has been marginal, we may not have reached peak petroleum liquids, but when accounting for differences in energy content we have been within two standard deviations of average liquids output since March 2005 (between 80.3 and 84.6 mbd oil equivalent). Note that other liquids are mostly ethanol so that other liquids and ngl must be reduced by 70% to account for their lower energy content. So bottom line, if a plateau is defined as within 2 standard deviations of the average then that is what we have seen since March 2005. It is possible that we might break above this plateau for a short period, but I think we may fall off on the low side within 5 to 10 years. Stuart Staniford might agree but I won't presume to know his mind on this which has seemed somewhat optimistic of late.
The preliminary monthly data are of course preliminary estimates, which are subject to revision, and monthly data are also distorted by inventory fluctuations. In my opinion, the average annual data give us a better indication of actual annual production. The following is based on annual data:
Recent Crude Oil Prices
We have seen two annual Brent crude oil price doublings since 2002, from $25 in 2002 to $55 in 2005, and then from $55 in 2005 to $111 in 2011. Although prices have of course fluctuated, this is an average one percent per month rate of increase from 2005 to 2011. Excluding WTI, global crude oil prices currently range from $121 to $137. Louisiana Light Sweet, currently at $128, generally is a good indicator of the global median crude oil price.
Global Production & Net Export Responses
In response to the first price doubling in Brent crude oil prices, we did of course see a substantial increase across the board in total liquids production (inclusive of low net energy biofuels), in total petroleum liquids, in crude + condensate (C+C), and in Global Net Exports (GNE) and in Available Net Exports (ANE). GNE and ANE numbers are calculated in terms of total petroleum liquids. ANE are defined as GNE less China and India’s combined net oil imports.
In response to the second Brent crude oil price doubling (2005 to 2011), we have so far seen a very slow rate of increase in total liquids production (up 0.5%/year from 2005 to 2010), virtually flat total petroleum liquids and virtually flat C+C production (through 2010), and a 1.3%/year and 2.8%/year respective decline rate in GNE & ANE (through 2010).
If we simply extrapolate the 2005 to 2010 rate of change numbers for the Top 33 net oil exporters and in the Chindia region’s net imports, the 2010 to 2020 rate of decline in ANE would accelerate to about 5%/year, and if we extrapolate the other rates of change, but assume a 1%/year production decline rate for the top 33, the ANE decline rate would accelerate to about 8%/year from 2010 to 2020:
I estimate that there are about 157 net oil importing countries in the world. If we extrapolate the Chindia region’s rate of increase in their combined net oil imports, as a percentage of Global Net Exports of oil (GNE), in 19 years just two of these oil importing countries--China & India--would consume 100% of GNE.
I estimate that the current CANE (Cumulative Available Net Exports, post-2005) depletion rate could be on the order of about 8%/year (versus a 2005 to 2010 2.8%/year rate of decline in the volume of ANE). The CANE depletion rate would be the rate that we are consuming the cumulative post-2005 supply of global net exports available to importers other than China & India. Based on a simple model and based on actual case histories, note that it is common for the initial depletion rate to exceed the initial annual rate of decline in net exports.
If, and obviously this is a big "If," but if we extrapolate the 2005 to 2010 data trends, I estimate that the post-2005 cumulative volume of (net) exported oil available to importers other than China & India, or CANE, will have fallen by about 50% by the end of next year, 2013.
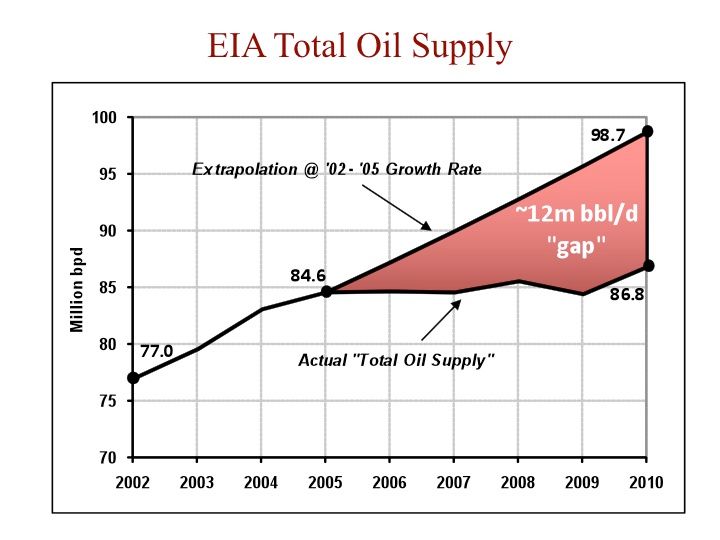
And some "Gap" Charts:
EIA Total Liquids (including biofuels):
BP Total Petroleum Liquids:
http://i1095.photobucket.com/albums/i475/westexas/Slide06.jpg
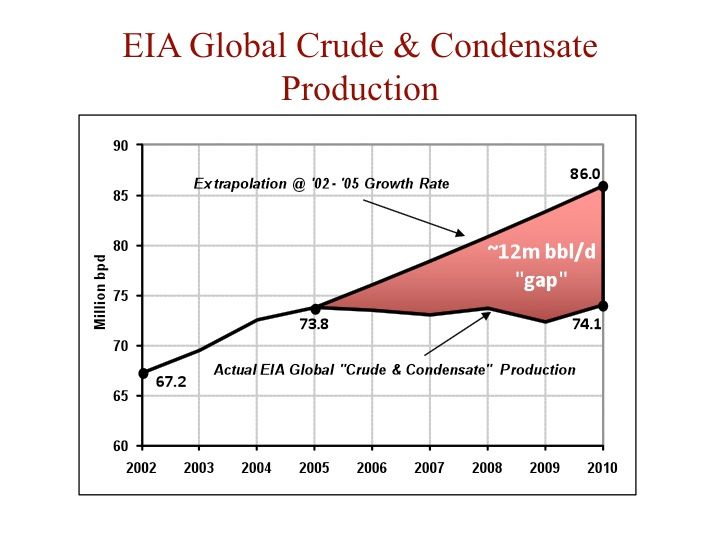
EIA Crude + Condensate:
Global Net Oil Exports (GNE, BP & Minor EIA data, Total Petroleum Liquids):
http://i1095.photobucket.com/albums/i475/westexas/Slide07.jpg
Available Net Exports (GNE less Chindia’s net imports):
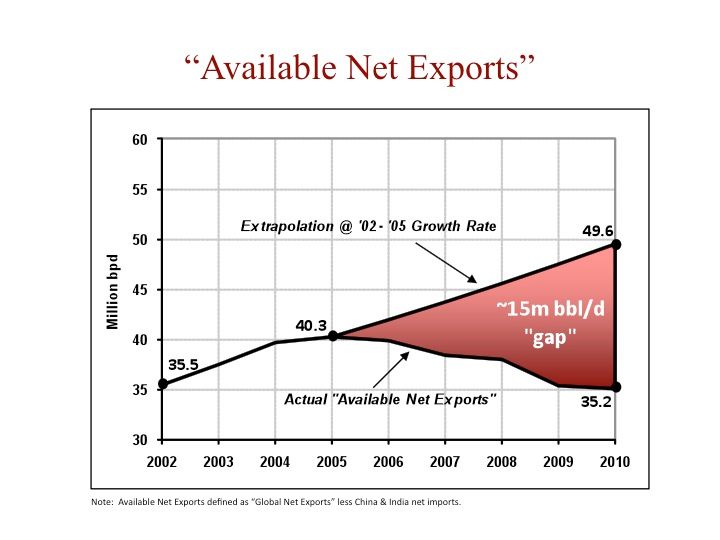
I would particularly note the difference between the first chart, total liquids, and the last chart, Available Net Exports (ANE).
The CANE metric is very much analogous to a fuel tank. If we project current trends, the "fuel tank" that would provide exported oil to about 155 oil importing countries would be full at the end of 2005, and about 50% empty by the end of next year.
Thanks for staying on top of the situation, Jeff.
I've updated my spreadsheet tracking FOB crude prices in the US 30 years ago, post price-spike leading into recession. The top was $36.93 in Feb 1981, slowing coming down to $27.36 44 months later, in Sept 1984. This can serve as the analog to the June 2008 spike at $123.34; 44 months later we're at $105.48 (a tentative number I'm arriving at taking the average of WTI and Brent spot prices) in Jan 2012.
These equate to 85.52% of the peak price for Jan 2012, and 74.09% of peak in Sept 1984. These percentages met up a year ago and quickly settled into a band of ca. 11% difference on average since, dipping as low as 4.47% in August and as high as 19.47% in April. Following the early 80s price pattern we would enjoy $91.38/bbl FOB for January. Obviously that hasn't quite happened.
The US climbed out of the recession which began July 1981 in Q1 1983; that would equate to around July 2010, if a 1:1 equivalency were at work. No one had doubts about the economy not humming along; GDP certainly wasn't making the anemic showing it has of late. I took a stab at guessing at what spare capacity was like then, too, given a lack of actual numbers to use; something like 9.6 mb/d in 1984? None of your piddling biofuels and NGLs there, no neither. Just a gusher of good ol' LSC.
If there is anything more overlooked than the export numbers, it's the projected Cumulative Net Export (CNE) depletion numbers. Here are the numbers for the ELM and for three case histories:
Note that about half of post-peak CNE tend to be shipped about one-third of the way into a net export decline period. If we project, and as noted above this is a huge "If," but if we project the 2005 to 2010 rate of increase in Chindia's combined net oil imports as a percentage of Global Net Exports (GNE), the Chindia region alone would consume 100% of GNE around 2029, which is 24 years after 2005.
So based on the above model, about half of the post-2005 Cumulative Available Net Exports (CANE) would have been consumed 8 years after 2005 (one-third of 24 years), which would be 2013, which is the end of next year.
Saudi Arabia Cuts Oil Output, Export: Industry Report
The OPEC heavyweight saw production decline by 237,000 barrels per day (bpd).
The draw-down was sharper for the actual amount exported, declining by 440,000 bpd, or 5.6 percent, to come in at 7.364 million bpd, the data also showed.
In its monthly report on February 10, the IEA put Saudi Arabia’s production number for December slightly lower at 9.55 million bpd, a disparity of 260,000 bpd versus the JODI data.
http://www.cnbc.com/id/46445698
I posted a chart of annual Saudi net oil exports down the thread.
Finished fuel prices are increasing because raw material (crude) prices are increasing, and crude prices are increasing because the world's oil reserves have entered into a late stage depletion phase. In 1960 87.3% of oil's potential energy (140,000 BTU/gal) was delivered to the end consumer; in 2012 it will be 44.9%. The portion of oil's potential energy that will be delivered to the end consumer will continue to decline and the price will continue to increase until the end consumer's portion hits 31.6% in 2030. This is the maximum allowable theoretical Second Law thermal efficiency, 70.2% (calculated from liquid octane, MW 114.2, stand ref. p-T, 100% theoretical air).
(the 1.8% discrepancy between the end consumer portion, 31.6% and max theoretical, 70.2% arises from the application of two methodologies, and also because max. theoretical is a function of crude's average molecular weight, MW. Octane was used here because it is a frequently referred to standard in Thermodynamics texts)
The Hill's Group
Westexas has made a valuable contribution to the Peak Oil discussion with his Exportland model and supporting arguments. On the other hand, I don't think it is useful to extend the concept, as he has been doing recently, to "Available Net Exports". This is because I am not aware of any substantive reason to posit China & India as having preferential access to oil from exporting countries. Westexas has replied to a previous post of mine on this point with a graph of ANE. I could, however, with access to the original data (which are publicly available, though I haven't had the time to search them out), pluck any two countries out of the air and use them instead of China &/or India for a graph of "Available Net Exports".
The Exportland model gains its power because of an underlying political fact. When push comes to shove, the head of government in an oil producing country has the power to say "I don't care what you could get for this on the world market, we need the oil here & it's b***** well staying here"*. Neither China nor India have this power over oil producing countries. and the only way they can make oil "unavailable" to other importing countries is to outbid them on the world market. Westexas's ANE graph, therefore, while looking pretty scary, doesn't tell us a lot.
Therefore, I'd like to ask Westexas to justify why China & India, which have obviously been chosen because of their population size & recent rapid growth, deserve to be treated as special cases which have the power to make oil "unavailable" to other importing countries.
* OK, I understand Canada may be an exception to this, due to a treaty with the US, but I'm not aware of any other exceptions.
The Chindia region's combined net oil imports as a percentage of GNE increased from 11.2% in 2005 to 17.6% in 2010.
We can argue about what will happen, but there is no doubt about what has happened. Normalized oil consumption by China, India, top 33 net oil exporters and the US from 2002 to 2010:
That doesn't answer the question.
We all agree that China's oil imports are increasing rapidly. But, what does that mean?
I'd argue that it's a bad sign for China, and falling imports in the US is a good sign for the US: dependency on oil imports is a big negative.
Here is the question I was addressing about China & India:
Here is what BP shows for changes in total petroleum liquids consumption for China, India and the US from 2005 to 2010:
China: +2.2 mbpd
India: +0.7 mbpd
China + India: +2.9 mbpd
US: -1.7 mbpd
Chindia's combined net oil imports rose from 5.1 mbpd in 2005 to 7.5 mbpd in 2010 (BP). Over this time frame, Global Net Exports of oil (GNE) fell from 45.5 mbpd to 42.6 mbd.
Therefore, Chindia's combined net oil imports, as a percentage of GNE, increased from 11.2% in 2005 to 17.6% in 2010. If, and it is a big if, but if we extrapolate this trend, the Chindia region would consume 100% of GNE in only 19 years. Given the fact that the Chindia region showed increasing consumption and net imports, as annual Brent prices doubled from 2005 to 2011, it seems reasonable to expect to see Chindia's net oil imports, as a percentage of GNE, to show a long term rate of increase, at some rate.
it seems reasonable to expect to see Chindia's net oil imports, as a percentage of GNE, to show a long term rate of increase, at some rate.
I think we all agree on that. Still, that oil is still "available" - Chinese consumers just find it more valuable.
I've noticed the local taxi drivers suddenly "getting religion" on converting to hybrids - $4 gasoline just isn't worth the price, and they're making very cost effective investments in substitutes and greater efficiency.
People often forget how dynamic consumption is, and how prices and markets can incentivize change.
I'd say $80 oil is the point at which most uses for oil are no longer cost-justified (at least in the US), and substitutes become better choices.
We need to remember that substitution takes a little time - R&D takes time, and ramping up production and replacing existing equipment takes times. That means that it will take a little time to see the impact on consumption of a 4x increase in prices.
People often forget how dynamic consumption is, and how prices and markets can incentivize change.
Elsewhere that's a truism, apt to gain the response, "yes of course, so?". Here, unfortunately, consumption is either decreasing, i.e. society is collapsing, or increasing, i.e. accelerating the pending collapse of society.
* OK, I understand Canada may be an exception to this, due to a treaty with the US, but I'm not aware of any other exceptions.
It's a myth that Canada is an exception. I've read the treaty and it doesn't say what people claim it says. Canada can do whatever it wants with its oil, subject to some trade rules that it is going to carefully avoid triggering.
That being said, Canada will probably not cut off its exports and will sell its oil to the highest bidder regardless. Unlike most major oil exporters it is not particularly dependent on its own oil because of its massive hydro, natural gas, coal, and uranium resources, and can cut its oil consumption if it makes economic sense to export it.
Ab – I can't give you an accurate count of the amount of oil involved but there are several methods by which China has first call on various sources of export oil. The simplest is direct ownership. Much of the oil China import from Angola isn’t bought from the govt there or other producers. China actually owns that oil. They participated in the development of fields there through direct investments. They’ve made similar investments around the globe. They have also been buying an increasing volume of Canadian oil sand fields. And they don’t need to export that oil to China to control it. They can simply do a “paper swap”. Assume they own 300,000 bopd of Canadian oil. They can swap that oil for 300,000 bopd from, let’s say Equatorial Guinea that was scheduled to be exported to the US but China out bid us. So we get the EG oil and they get the EG oil.
They also have joint ventures with oil exporting countries. One example is Venezuela. Some years ago China agreed to build a number of tankers designed specifically to carry Vz heavy crude. They also built refineries in China to process the same crude. In return Vz guaranteed an increasing volume of crude to be sold to China. I think the current volume is 450,000 bopd.
Additionally China has secured a number of ROFR contracts…Right of First Refusal. Under those terms China has the right to match the price any other buyer and purchase. Though it hasn’t been confirmed by either country it has been rumored that such a ROFR contract was done between China and Brazil when China loaned Bz over $100 billion for their Deep Water development program.
And China is not the only country or international oil companies that have similar arrangements. Now if you want to suggest that the US will use gunboat diplomacy and ignore the World Court to ignore all these aspects go right ahead. I don’t consider such expectations seriously.
All of those arrangements are at market prices. If someone else wants the oil, they can bid more for it.
It looks to me like China is simply guaranteeing that they'll have the ability to bid for oil - there's nothing evil or coercive about that.
Consider what happens economically to the country that halts crude oil exports. Those governments are dependent on the revenue from selling the crude oil abroad. The output of the Cantarell oil field is decreasing, but Mexico did not decide to halt crude oil exports. They borrowed money to do more drilling and exploration desperately trying to increase the oil production. Paying back the loan makes them more dependent on the revenue from exporting the crude oil. Think about countries that subsidize the domestic cost of gasoline, like Saudi Arabia. Removing the subsidy would crash their economy and make the people angry. They are building their country based on cheap transportation fuel. Saudi Arabia would be more inclined to decrease domestic consumption to increase the amount available for export.
Westexas's ELM also refers to phase 1 and phase 2 of the curve. During phase 1 the exports decline while the revenue increases. During phase 2, the exports decline while the revenue decreases. Phase 2 is a moment of truth for the exporting countries: they have a decision to make about whether domestic supply or money is more important. I estimate that almost all will choose money and continue exporting. Eventually their production will decrease below their domestic consumption. Because countries that are dependent on the oil revenue will not be able to afford imports, they will likely go the way of Egypt (revolution).
Consider the decision that Russia might make during phase 2. 1) Produce at maximum rate to maximize declining tax revenue or 2) shut down some production making the tax revenue suddenly plunge further and making some of his wealthy cronies go bust.
As ELM becomes widespread, one would expect energy-centric endeavors to gravitate toward the production areas, and for vertical integration to export high-value end-products to replace low-value raw products. I think that's what the Saudis desire, but I'm not sure a country that imports labors and technology is well-placed to make such a transition.
Looking at fractured countries like Iraq and Libya, it seems that maintaining some level of exports is essential for countries which lack other resources. For better-endowed countries, the option to go upscale in products may be a better option.
In any case, ELM appears to set the tone for localized peak behavior, and will will help make the pain more acute for import nations. A new paradigm will likely emerge post world peak, but by then ELM will have done its damage already.
A key point to keep in mind is that given an ongoing production decline in an oil exporting county, unless they reduce their consumption at the same rate that production declines, or at a faster rate, the resulting net export decline rate will exceed the production decline rate and the net export decline rate will accelerate with time.
Some ELM "What If" scenarios follow. Assumptions: Production of 2.0 mbpd at final production peak and consumption of 1.0 mbpd, and thus net exports of 1.0 mbpd. Production declines as 5%/year, similar to the North Sea. For the following we are looking at rates of change for Peak + 8 years, for various rates of change in consumption, and thus net exports, versus a -5%/year rate of change in production. P = Production. C = Consumption. NE = Net Exports
P: -5.0%/year
C: +2.5%/year
NE: -26.5%/year
P: -5.0%/year
C: No Change
NE: -13.5%/year
P: -5.0%/year
C: -2.5%/year
NE: -8.2%/year
P: -5.0%/year
C: -5.0%/year
NE: -5.0%/year
So, as noted above, given an ongoing production decline, only if the exporting country reduces their consumption at the same rate, or at a faster rate than, the rate of decline in production will net exports fall at the same rate as, or at a rate slower than, the rate of decline in production.
And as noted above, if there is anything more overlooked than net export decline rates, it's the post-2005 Cumulative Net Exports (CNE) depletion rate. An accelerating rate of decline by its very nature means that the depletion rate is sky high. This especially applies to the ANE & CANE metrics.
BTW, here are the observed rates of change for Saudi production, consumption and net exports from 2005 to 2010 (BP, total petroleum liquids):
P: -2.1%/year
C: +6.8%/year
NE: -4.7%/year
As a "What, if" scenario, if we project these production & consumption numbers out to 2015, we would see the following rates of change for Saudi Arabia for 2005 to 2015:
P: -2.1%/year
C: +6.8%/year
NE: -6.0%/year
Saudi net oil exports would be down to about 5 mbpd in 2015 versus 9.1 mbpd in 2005. If we use Brent as an approximate indicator of oil prices, Saudi nominal cash flow from export sales in 2005 would be about $500 million per day (9.1 mbpd X $55/BO), and if we assume an oil price of $165 in 2015, their nominal cash flow from export sales would be $825 million per day (5 mbpd X $165/BO).
Yes, reducing domestic consumption in the oil exporting country would buy them some time and additional revenue but probably would not reverse the decline in exports. Waiting until phase 2 to address the problem of declining revenue means the oil exporting country will not be able to adapt by domestic conservation and building refineries to sell finished products.
With the Consumer Price Index in Saudi Arabia around 5.5% annual rate, $825 million / day would make their purchasing power in 2015 about equal to 2005.
Show us a report of total BTUs. Counting barrels of liquids with varying BTUs of energy is deceptive.
Make that NET BTUs
Irrelevant. We don't pump NET BTU's in the car's tank. We pump gasoline, diesel, propane and ethanol. In this order. Thinking about it, if we were to pump BTU's that would be really nice right now...Imagine filling the tank with BTU's obtained from natural gas in North America...dirt cheap. So cheap that Encana, Devon, Chesapeake and other nat gas producers decided to cut production and leave it in the ground for now.
Liquid fuels have immense practical advantages in many applications, particularly transportation. Ultimately, the net energy available after their production and distribution is the true measure of their impact. We know that the production of biofuels and unconventional oil is energy intensive and ethanol, the most common biofuel has a significantly lower energy density relative to conventional liquid fuels. Consequently, the improvement in the overall production numbers is more apparent than real. As others have noted, the bottom line is that, even though the demand for oil has been restrained by factors including increasing prices, the substitution of natural gas for oil where feasible, improvements in vehicles and widespread economic malaise, the trend of rising oil prices and at least some declines in inventory levels is clear evidence that the prospects for significant increases in the production of liquid fuels are problematic.
The natural gas glut in North America has depressed prices and this has helped moderate increases in overall energy costs. However, the current situation is a temporary one - in the medium term, natural gas production will fall if prices cannot cover production costs. In the longer term, we cannot escape the fact that it is a finite resource.
We don't pump NET BTU's in the car's tank.
We most certainly do. By definition, the net btu's are what's left after whatever btu's were burned to find, produce, refine and transport the fuel.
But you might have really meant we don't pay by the btu, in which case you'd be right.
But, even so, your ENGINE runs on net btu's - regardless of what you paid for them. Fill up a flex fuel car with ten gal of E85 instead of regular unleaded, and then tell me if the distance you drove on it is more reflective of the net btu's, or the price you paid at the pump?
Imagine filling the tank with BTU's obtained from natural gas in North America...dirt cheap
Well, you don;t have to imagine, you can. just go here and click on the map option;
http://www.altfuelprices.com/stations/CNG
If you are lucky enough to drive a CNG vehicle in Utah, you are paying all of $1.50 per GGE -Gasoline Gallon Equivalent- which by the way, is "net btu's" you said can;t be pumped.
Don't forget the higher compression ratio possible with ethanol: it's possible to reduce the ethanol penalty from 30% to 12% with the proper engine adaptation.
Net BTU's is all we can pump in a car's tank. The fuel used to obtain fuel is USED and not available for car tank filling.
voiceinyourhead, whaleoil, w_smith, Paul Nash, oxidatedgem - I concur. Per capita net BTUs available to society are what matter. See my comment above re: convincing Stuart to put his considerable analytical skills to creating such a graph. Only then will we have a clear picture of our true liquid fuel situation.
like this?

This is more typical of buses in the First World:
For small cars it's less convenient:
For doing a retrofit into a small car it is certainly less convenient, but if the car is designed from scratch to be CNG, then the cylinders can be located under the floor.
For front wheel drive cars, it can be done to have two tanks, one in front and one behind the rear axle(s), for a minimal loss of interior space.
You do lose the spare tyre, but many cars go without that these days.
naw - just a big gas bag on top - will go down well in Texas - shoot'em up,boys!
:)
http://www.handyshippingguide.com/shipping-news/embracing-natural-gas-po...
Forbin
I wonder how many forms, documents and telephone calls the emergency services would be handling prior to sending their men within 50ft of the burning wreckage to rescue the trapped occupants after a truck had just ploughed into the back of it?
hmmmm.....
Marco.
Marco,
The energy content is similar to gasoline, so the risks will be too -- whether battery, gasoline, or NG, really. The nice thing about NG is that it wafts away, and the tanks are considerably stronger than those for gas.
It's not like a Pinto. Most installations (all?) should include a heavy plastic wrapper and vent in case of leak or rupture.
The IEA says non-OPEC is down 200,000 bp/d in January. Highlights of the latest OMR
Non-OPEC supply fell by 0.2 mb/d to 53.2 mb/d in January, on lower global biofuels output, an escalation of conflict in Syria and between Sudan and South Sudan, and continuing outages in the North Sea.
While OPEC says OPEC crude only was up 56,200 bp/d in January. OPEC home (Click on "Oil Market Report)
And Jodi says, in December, Crude + Condensate was still 972,000 barrels below the peak of February 2006. Okay so a lot of natural gas liquids must have came on line. But that ain't crude oil.
JODI crude + condensate thru December 2011 in thousands of barrels per day with EIA data inserted for JODI not reporters of Gabon, Equatorial Guinea, Kazakhstan, Sudan, Syria, Vietnam and Yemen. The last data point is December 2011 and was 72,233,000 barrels per day. The peak was February 2006 at 73,368,000 barrels per day.
Nothing really great happened in January except Crude + Condensate was down about 150,000 barrels per day if the OPEC data and the IEA data is anywhere close to correct. But if you count bottled gas or natural gas liquids as some call it, then I have no idea what kind of record was set. But cars and trucks don't run on propane so it really doesn't matter.
Ron P.
"But cars and trucks don't run on propane so it really doesn't matter."
Actually they do. From wiki: "Propane is also being used increasingly for vehicle fuels. In the U.S., 190,000 on-road vehicles use propane.... use it for power. It is the third most popular vehicle fuel in America, behind gasoline and diesel. In other parts of the world, propane used in vehicles is known as autogas. About 13 million vehicles worldwide use autogas."
http://www.propanefacts.ca/about/news/backgrounder/
[edit]
[edit]
There are 254,400,000 passenger vehicles in the USA according to wiki. so 190,000 would be 0.0747%
of the total. That is seven one hundredths of one percent or one in every 1,339 vehicles. Not enough to matter. And if you count the trucks it would likely be less than one in every two thousand vehicles. Those are the facts!
So Crude + Condensate is all that matters as far as cars and trucks go. Crude + Condensate peaked in 2006. [Edit]
Ron P.
From Stuart's graph just above, it appears a "new peak" was in 2011. [Edit]
The confusion (being generous) here stems from not comparing apple's to apple's. Stuart provided many graphs - plus commentary. Refer to the fourth graph from the top - below that Stuart states:
".. It allows us to see that "crude plus condensate" (C&C) has been pretty flat since 2005, with increases in the total [liquid fuels] mainly coming from other components of the liquid fuel stream.."
In its 5th graph (blue line), Stuart shows that a new peak occured in 2011.
If the small deviation above the mean on that undulating plateau makes you feel better - then go with it. It really isn't worth arguing over which of those peaks along that curve to use. The important issue is that Stuart's data also demonstrates that despite the high prices of petroleum products (which have made marginal sources economically viable to pursue) the industry has been unable to bring production growth back to the trend line of the late 90's and early 00's.
No, it shows that ethanol and other liquids are better able to meet demand at that price than can crude. From the data presented here one can not tell if oil is simply being left in the ground because of the price, as for instance we know is the currently the case with natural gas, or if it is simply not there.
Seriously gents, that's the news (blue 2011). Where did that juicy C+C come from in 2010? Tar sands finally hit their stride? I thought they were pretty mature already by that point, but I guess they were still small news as late as 2007 and the rest is tangled up in Lehman, so maybe it could match the curve. Russia?
Speaking of the graphs, are 'natural gas liquids' (propane) in one category (NGL), and STP/real liquid oil from natural gas (i.e. bakken) in another (C+C), a tad confusing? Makes sense, but I'm looking for confirmation. I doubt that's anything like the tar sands contribution, but it's notable enough to want to know what line it bumps.
I sure wouldn't mind if headingout would shortcut by a few fields and give the 2012 perspective on the tar sands, but maybe he did it last year and I missed it.
Desert
Continue supplying contrary arguments. I want to hear the best contrary evidence. If what data we have points in a different direction that what most say here, i want to hear about it. So far I am not convinced that there are better fits for the data we have. To me it appears that we may be at peak oil + condensate peak. There may be some growth yet to come, but with rising prices for crude oil and no growth for the last five years, supply constraints appear to be in play and to be a relevant factor in price increases since 2005. There is an increase in other liquids, which means we are still able to continue business as usual for the moment. Given what I've heard about projects coming online and finds of crude, the plateau may last up to five years for crude + condensate. It's possible that there may be more undiscovered reserves which change the picture, but the probability of that appears to be diminishing. Given what we know now, what ASPO projections are, what Westexas and others are saying, I would expect declines in crude and condensate between now and the next five years. Depending on the rate of decline of crude, the other liquids, which are mostly of lower energy density, will not prevent the decline of all liquids for a long period unless the other liquids grow at a much faster rate. For example, natural gas, at least for a relatively brief period, could be used for methanol production. I would like to hear from those who disagree with my summary as well as those who agree and hear evidence for and against the propositions.
The argument that price spikes should cause an increase in production makes no sense at all. It's the exact opposite. Price spikes quash demand, which leads to lower production.
How many times does it have to be stated that any demand that is destroyed here in the U.S. is offset by GROWING demand in China and India, as well as a few other growing economies.
Some people just can't seem to get that shit through their heads. To them the U.S. is the be-all and end-all and the fact that their are huge growing economies anywhere else just seems to be an alien concept.
According to the EIA the peak of C+C was in 2010 at 74,084,000 barrels per day. The average through the first eleven months of 2011 is 74,060 bp/d. So the December numbers could push us above 2010. But my point was about the JODI numbers. Jodi, based in Riyadh Saudi Arabia, started collecting oil production data in 2002 because, I suppose, too many people felt the EIA data was unreliable. Jodi queries each nation every month and reports exactly what each nation says they produced that month.
However there are five producing nations, and sometimes more, that do not report to JODI. For the missing JODI data I simply used the EIA data. Using that data the peak of Crude + Condensate was, as my chart above shows, in 2006.
The December JODI data just came out a few days ago. The average C+C production for 2011 was 71,176,000 barrels per day. The average for 2006 was 72,740,000 barrels per day or 1,572,000 bp/d below the 2006 average. Again I was using the EIA data where JODI data was missing.
Ron P.
Ron,
I think your last paragraph has an error ? Should the second part of the third sentence read: "1,572,000 bp/d above the 2011 average" ?
Thanks Hinson, and yes I did make an error. The sentence should have read:
The average for 2006 was 72,740,000 barrels per day or 1,572,000 bp/d above the 2011 average. The world peak in Crude + Condensate production was 2006 according to JODI.
Thanks for the correction, Ron
Conversion is surprisingly simple (my sister-in-law's brother did one on his pickup). If it's cheaper to use electricity than propane, and cheaper to use propane than gasoline, I wouldn't be surprised by some fair-sized market shifts. There are 1M LPG fueled vehicles in India.
Well there are always drawbacks: Natural gas vehicle
Twenty minutes refueling time. I don't think that will catch on. Also Propane is just not all that cheap. Propane Prices
And a gallon of propane does not equal a gallon of gasoline: BTU Value Propane Vs. Fuel Oil
And that makes propane about the same price as gasoline, or at least not worth the conversion cost and the 20 minute refueling time.
Ron P.
The wikipedia article cited is visibly mixing specifics of LPG and LNG, I would not use it as a source. Refueling time is pump/car specific, much like gasoline. Propane vehicles present less accident immolation hazard than gasoline vehicles (although less safe than diesel). Propane has higher octane than gasoline, so efficiency tends to be higher than 1:1 on a BTU basis. Range depends on tank size, but for an equivalent tank size is 85-90%. Engine maintenance and emissions are both lower with propane. U.S. propane prices are dominated by low volume (BBQ and forklift) and delivered (home) sales. Vehicle LPG fuel prices are lower than quoted for propane in general, especially when used for fleet vehicles. Like heating oil, relatively high propane prices should lead to conversion of propane homes to electricity and natural gas. This should lead to lower propane prices, and increased fleet conversions. Propane would stay cheaper than gasoline, but follow it up as fleet conversions occurred. These are the market shifts I speak of. It is easier to convert to propane than natural gas, so I would expect propane to continue to be the #3 light vehicle fuel internationally (with growing market share). What happens in the U.S. will probably depend mostly on government incentives (which may advantage NG or electric vehicles). Natural gas is more attractive for heavy vehicle conversions.
Agree, however, I feel compelled to point out I can pump 40 gal in less than 10 mins in my truck, so something was amiss in the example quoted. I can substantiate the BTU difference - just like filling up with E85, you see the mileage hit the skids immediately. Also, residential customers are captive and always get hosed on the price. You can find propane as low as $1.75/gal in AZ. Still, that doesn't exactly make it worthwhile or any kind of saviour, I'm just saying. You'd think with the natural gas glut, you'd have seen the pump price of NGL fall this year, but just like gasoline, I think the refineries got all the gravy. For the moment, they are still additional BTU's to propel BAU, so it helps a touch with that plateau, but I'm with you that it doesn't amount to a fly's rear in any big picture you choose. Doubtless we'll be Fischer–Tropsch'ing it one day anyhow...
Desert
Remember that the market in India is distorted by government subsidies. Petrol is not subsidized, but diesel, LPG and kerosene is.
Remember that the market in the USA is distorted by government taxes. Even more so in Europe.
Conversion is surprisingly simple
To an extent, but it is not simple to convert to CNG and get the same 400-500 mile range of the typical gasoline sedan with an energy density ratio of almost 4:1 (gasoline:CNG at 3600PSI).
The conversion being discussed was to LPG. Ron doesn't want to count LPG as a liquid fuel (and on a short timeframe he's largely right).
And ethanol, 1m bpd. With 70% the energy density of gasoline call it 0.7m boepd if you like.
It's up to more than 1 in 1000! The 190,000 number is a few years old. It's about 16M internationally.
Funny thing is that the crude peak is still holding, so peakers are right, but substitution is also at play, so economics is right. The only problem is that economists haven't done a very good job at predicting the price at which substitution occurs. Apparently choosing to do without is a valid substitution too!
It's a slow and bumpy train-wreck of a ride we're experiencing....
"The only problem is that economists haven't done a very good job at predicting the price at which substitution occurs"
That's hardly a surprise. There is not one single price where substitution occurs, there is a broad band depending on the marginal value of the oil to each particular process. And not only does that value depend on the particular process, it also depends on what substitutes are available. In the East you might go to coal, in the South to natural gas, in the Northwest to electric.
Here's a chart showing world C&C production going all the way back to 1973. Data is through October, with recessions shaded in pink just for the heck of it. Original data is from the EIA, graph created thanks to economagic.com.
Notice it's basically returned to the trend which was established in the 90's. The run-up in the early '00's appears to have been a short-term spurt, rather than part of the longer-term trend.
C'mon, show the whole chart, don;t cherry pick your time frame;
Now, there has been a fairly linear trend from about 1980 to 2005, but from 2005 to 2011 you could put a spirit level on that line and the bubble would be in the middle.
You could still be right, of course, and if your investment adviser was telling you to bet your job, house and kid's education on the last six years being an aberration, and that it is going to "return to the upward trend", would you go "all in" with your family/country's future on that?
[note - WTI price is not inflation adjusted, and couldn't find the Brent price on this browser]
http://www.economagic.com/mgif/M20601160370390404405047047734.gif
http://www.economagic.com/mgif/M20601160370390404405047047734.gif
Can you please give the web address of the previous plot? Thanks
lets try this;

So, the last six years has been the flattest period of production in the last 40 years, yet we are led to belive that it is "returning to the trend" of the last 30...
I created this chart from the Economagic site - fairly easy to do. Address for my chart is
https://lh5.googleusercontent.com/-hs0-nXSjAE8/T0k9Bfx6cJI/AAAAAAAAAGQ/o...
Thanks for the chart. What is interesting to me is that after the peak in 1979 it took 18ish years to get back. In effect during that period after '79 one could have made the argument that oil production had peaked for a almost 2 decades and have been right.
I find it very difficult to keep a long-term perspective and it is almost impossible to not draw conclusions from all the month to month data (changes)..
Rgds
WeekendPeak
No, I lived through that period and we all knew exactly what was happening. Every so often we get some person who cannot remember the Oil Embargo of 73 and 74. Then they cannot remember the Iraq-Iranian war or the ensuing Tanker Wars or the Iranian Revolution. All of which started in 79 and lasted until the mid 80s. And they say something like this: "Look at that. I'll bet those doomers back then thought that peak oil had arrived. Boy were they wrong."
No, no one thought anything of the sort. There were a few, like President Carter who saw that eventually there would be an oil problem. But no one used the term "Peak Oil" in those days because we all knew what was happening and we knew why it was happening.
The Iranian Revolution started in 79. The Iran-Iraq war started in 1980 and ended in 1988.
Ron P.
I too lived through both oil embargoes (in europe though). I do not claim to know what "they" thought or think for that matter.
My point is simply that looking at month to month data when discussing a long-term phenomena can be problematic because of the mismatch between the horizon of analysis with the frequency of datapoints. Noise can look like signal.
That is all I tried to get across - my bad for failing - should have been more clear.
Rgds
WeekendPeak
I would call the 1979-95 period even "flatter." You also have to remember that 2-3 of the past 6 years featured the deepest recession since WWII. Something like that is going to put a damper on both consumption and production.
And in response to Darwinian, there were plenty of people back in the late 70's and 80's telling everyone we were running out of oil. I'm old enough to remember that period as well.
Yes Carter and others said it was time to look at the supply of oil. But no one ever mentioned "Peak oil". No one talked about "peak oil" except M. King Hubbert and he said it would not arrive until about 1998. And he stated in the video, linked below, that OPEC could cut oil production and extend the peak ten years or so. And that is exactly what happened.
No Abundance, running out of oil was not a major concern in the early 80's. Of course, as I stated, President Carter correctly warned us that we should conserve our oil resources because they were finite. If only we had taken his advice.
M. King Hubbert on Peak Oil in 1976.
Yes Abundance, even in 1976 we, or one oil geologist named Hubert, knew about peak oil and knew that only an OPEC cut in production could push it past 2000. It did and according to JODI it happened in 2006.
Hubbert predicted, in 1956, predicted that the US oil production would happen around 1970. He was spot on. He predicted, in 1976 that the world would peak around 1998 unless OPEC cut production and extended the peak up to ten years. He was spot on once again. He was the only one that I am aware of that talked about peak oil during the 70s or 80s. But if you have a link about someone else talking about peak oil sooner, please post that link.
Ron P.
The fact that few people called it "peak oil" per se doesn't mean that people haven't been worrying about running out of oil for decades.
July 05, 1943
The subject was not the 1940s but the 1980s and the big dip in Middle East oil production due to huge mess in Iran and Iraq.
Ron P.
Hubbert stated that world oil production would peak in 1995. And that 2 trillion barrels would be all the oil ever produced. And that once a country's production peaks, it goes into irreversible decline. He was wrong on all accounts.
Carter stated that all of the oil in the world would "run out" by the end of the 1980's. He was obviously wrong as well.
The video I posted he said 1998 and he also said an OPEC cut could extend the peak 10 years. I post links for my claims. You posted nothing. So either post a link for your claims or don't make them.
Carter never said any such thing. You just made that up. Again, post links for your outrageous claims or don't make them. What he really said:
Jimmy Carter delivered this televised speech on April 18, 1977.
And it did not continue. Oil production dropped dramatically starting in 1980 and never returned to the dramatic growth rates seen in the early 70s.
Ron P.
Hi Ron P.
In the video you posted, Hubbert cleary states that world oil production would peak in 1995 (1:58 in the video). Perhaps you should go back and listen to it again. Hubbert also stated world oil production would peak in 1995 for a National Geographic article published in 1974.
http://www.hubbertpeak.com/hubbert/natgeog.htm
And this is the Carter quote I was referring to:
"World consumption of oil is still going up. If it were possible to keep it rising during the 1970s and 1980s by 5 percent a year as it has in the past, we could use up all the proven reserves of oil in the entire world by the end of the next decade."
http://www.pbs.org/wgbh/americanexperience/features/primary-resources/ca...
Obviously, Hubbert and Carter had grossly underestimated total oil in place, and didn't understand the concept of reserve growth. A common problem with peak oil doomers.
Cornucopia, you are correct Hubbert did say 1995. I was looking at the chart and thought it looked like 1998 and just assumed that was what he said. Anyway he was correct that OPEC did cut back production and extend the peak by 10 years. Though he was still off by one year, the actual peak was 2005 though peak oil exports were in 2005.
However you were way off on what you said that Carter said. Your statement is cut and pasted here:
Of course that was not at all what he said. Here it is copied and pasted directly from the speech.
If we had continued to increase by 5 percent from that point then the world would have been at 120 million barrels per day by 1990 and would have consumed half a trillion barrels during that time. Okay so he had total proven reserves a little low but not too far from what was known at the time.
But the point is he did not predict that we would run out of oil but only said that IF we continued to increase consumption at 5 percent per year we COULD use up all known proven reserves. That is quite different from what you stated he said.
But the quote that I copied and pasted above from the same speech lays it out very clearly. Picking a quote, then altering it to make him say something definite when he was only stating what COULD happen IF we did not cut back is really not kosher, to put it mildly.
Ron P.
Ron, care to share any thoughts on the discrepancy between the JODI C+C Peak in 2006 and the IEA/EIA C+C peak in 2011 by the way? Any previous articles touched on this (seems I recall last year sometime?)
Desert
Notice how for both OPEC and Non-OPEC the EIA reports their production lower, compared to JODI in the middle of the decade but the difference increases dramatically toward the end of the decade, with the greatest difference in 2010. But it was far greater for OPEC than the non-OPEC.
The average difference between 2006 and 2010 was 158,000 barrels per day for non-OPEC but was 2,396,000 barrels per day for OPEC. The last data points are November 2011
The charts below are the difference between JODI C+C and the EIA C+C in thousand barrels per day.
The only way I can explain such a disparity is is just sloppy work. No, I don't think it was any kind of conspiracy. It is just that when you are estimating, and the EIA does estimate the production of a lot of countries, they let their desire affect their wishes during the last years of the decade. JODI does not rely of estimates, they receive production numbers directly from the countries.
Ron P.
"World consumption of oil is still going up. If it were possible to keep it rising during the 1970s and 1980s by 5 percent a year as it has in the past, we could use up all the proven reserves of oil in the entire world by the end of the next decade."
So was Carter mathematically correct? What were the proven reserves at the time he was speaking? He said "we could use up", I take that to be a warning and considering where we sit today I would say he was correct to warn us.
{ligtheartedly} "He didn't understand the concept that reserve growth in a supply-constrained environment requires prices that cause demand (and general economic) destruction. A common problem with cornucopians."
Supply is constrained and price aggravated both by lack of new Gawhars & Prudhoes, and declining EROEI (tar sand is a low-grade ore). So, 'reserve growth' is code for 'price hike' in the current era. Plus it's not like reserves vs. price is linear clear up to the sky in the face of unflagging demand, you do hit a point at which you're not getting any more up at any price. One can be concerned that this is a problem that needs some near-term attention without tinfoil hats and a bunker of canned goods (not that I write off canned good stockpiles per se).
Desert
I would call the 1979-95 period even "flatter."
I would call it a rapid decline (verging on falling off a cliff), and then steady recovery to get back to where it was, 16 years later.
To be "flat" implies that it is remaining steady, or within a defined range. You have to take a pretty large defined range to call 79 to 95 "flat", but if you do, then the 05 to 2011 period, since it can fit into a smaller range, is even "flatter".
It has not gone on for 16 years, so you could call 79 to 95 a "longer, flat period".
But really, that is pushing the limits of "flat".
If you were buying land that had the kind of gradients we see from 79 to 95, and the real estate agent was trying to tell you it was "flat" would you believe him? If you had bought it sight unseen to build on because he said it was flat, and then found it was a substantial valley, that just happens to have matching elevation at each side, would you be happy with him?
We can argue about predictions as to whether it is going to rise, fall or stay the same, but it is undeniable that 205-2011 has been the least variable production period of in the last 40 years.
Production declined because, what do you know, consumption crashed - practically overnight. Between better MPG and fuel switching in power plants the US alone shed something like 3.5 mb/d in the space of three years. I've been commenting on this for about 6 years on these forums. China will not repeat our performance, they've already shed most of their residual fuel consumption, and proven themselves big big big fans of cars, to absolutely no one's surprise.
U.S. consumption started growing again after we gutted CAFE and FUA.
I had no choice. The economagic series only went back to 1973, which, I believe, is when the EIA began collecting that set of data.
1973 is fine - but you left out the 2005 to 2011 part - which, coincidentally, is where the plateau is.
His chart was complete, you just had to open in in another tab/window, unless you have a 40" monitor or something.
To actually show trends you need you to be able to add trend lines to charts. Even slapping one on with a photo editing program would do the trick. It's easy to do with a spreadsheet program, though, they all have these functions built in nowadays.
It's there - just that the plot is sized too large for the window.
If you R-click (control-click with mac) on the plot you can "view image" and see the whole thing.
Abundance,
My apologies.
As the comments noted above, I did not see the whole chart as it did not display in my window.
While we may disagree on the interpretation, we are at least on the same data page.
Thanks for the chart, abundance.concept.
Eyeballing it - actually, laying a ruler over the screen - it looks like we're about 2 million to 3 million barrels per day below the 1982 to 2007 trend.
If we use the 1991 to 2000 trend as you suggest, we're about 11 million barrels below the ruler trend.
What has happened, I think, is that the doomers have been proven wrong time after time. Still, the mild skeptics were right all along.
Peak Oil is a recurring phenomenon. We have to rememeber, the Western world has been in a recession for the last 4 years which has been incredibly deep.
So basically, growth requires oil. Which is why America simply won't get out of the slump, because you need 4-5 % growth consistently.
In the CBO forecasts they predict that the economy will grow by that amount after 2014 well into 2018. That, plus massive tax hikes. Sure, the Bush tax cuts mostly went to the wealthy. But people forget that a lot of middle class folk also got some. Taxes need to go up over the long term, but a tax hike is still slowing the economic recovery in the short term.
This, plus the barely inching of oil. Everyone here underestimated shale oil, Gail perhaps more so than everyone else. There is an atmosphere here sometimes where it's all doom. People have made up their minds and seek to fit all new information into their worldview.
I think we can be quite clear that there will be no economic recovery in America and the recession will become permanent, with periods of stronger and slower growth.
Employment will steadily decrease. Europe is in some ways even more finished, even if Europe(if you discount the weak energy situation) has a better financial position than America, it's policies are Herbert Hoover-esque. A total disaster.
The key thing to watch is China, which is already slowing down. It's housing bubble has burst and it remains to be seen if they can contain it. They may need to add more stimulus to the economy, but that would again increase commodity prices. And again, about oil, can it be done? Japan also needs more oil now post-Fukushima, something few talk about. The Saudis are building like crazy in their country, which is consuming oil.
Net exports can be deceiving because sometimes the growth countries are the producers themselves. This is mostly true except a few Asian countries. Most of the OECD is in oil use decline, so declining net exports isn't really a problem in this sense.
The true problem, as always, is the actual production peak. Most of the reasonable estimates I've seen point at 94-95 mb/d in best case. That would give us about 6 years under depressed circumstances, or about 2018.
But this is barring a new Libya, Iraq blowing up in sectarian civil strife, Russia peaking and Iran's production not going into severe decline.
It's been said before and bears repeating again: The main factor for the next 5 years deciding the so-called 'ultimate peak' will be geopolitical.
Still, there's a lot technology can solve and in ways many here won't think about. Just take the fact that you can now manufacture meat in a lab. It's pretty much in beta stage, stable but not perfected. It would take about 10 years to ramp it up on a massive scale, but this would save tons and tons of resources, water not least, but also a lot of oil and fossil fuels(like phosephorous). The 10 year horizon would be achievable because it would be gradual. So even in 5 years, say, you would be able to bring down a lot of fossil fuel usage.
And then we have the whole sector of robotics, nanotechnology and so forth.
We're at the cusp of a genetic revolution, and China's leading the way(although this doesn't matter much because the amount of time you keep an advantage in the frenzied times of today is mere months, not decades like it was 100 years ago, so China's doing a lot of heavy lifting for us).
I think in 2020 our world will be like the world in 1820, but in hypermode. In a sense: completely changed from what was the case for centuries before it. Only change happens in years not decades(or centuries) this time around.
The question is: will Peak Oil doom modern industrial civilization before it can free itself from it's shackles? I don't think, per se, that technology will be able to significantly improve oil production. The aim would be to nullify it in other areas, like meat production but also in genetical enhancers, which could mean we wouldn't even have to eat at all and run much faster(meaning transportation would be pointless in cities) and without tiring and so forth. Living much longer.
So we could use oil for the gentle stuff, that which requires very high temperatures and for which we do not have replacements(yet, although there is a lot of progress on replacing plastic by algae and similar things).
For me, Peak Oil is a transition phase, not into the medieval world but into a brave new world. But, that being said, the transition will be so volatile that anything could happen and in worst case, that progress could be abruptly ended.
Still, if some people here spent more time looking into the newest research on genetics and the like you'd be blown away. We've advanced more in this area in the last 10 years than we had in 1000 years before it. And the pace is increased at incredible speeds. People are still stuck in the 1950s in how they view the world.
Excerpts from my comments up the thread:
L - "What has happened, I think, is that the doomers have been proven wrong time after time." Well, certainly some have but I haven't. OTOH I've never predicted a specific date for a peak per se. Fine for those that do but I ain't one of them. I've been a plateauer all along. And, with respect to C+C, I've been correct. Granted how one defines variances to stay within the plateau determines if we are still there or not: do variances of 5% or 15% push you out of the plateau? Each can chose for themselves.
As fas as production demands: I keep to what I believe is the original definition of "peak production": the max C+C production CAPABLE. IOW it doesn't matter if the world is consuming less C+C than peak C+C...it does change the peak volume. We might know know what that peak volume is since we're not producing at max rate but that number still exists.
IMHO all the discusion about peak liquids and CNG/LNG are valid and critical to understanding what's forthcoming. But this is the "Oildrum" and not the "Liquiddrum". PO is Peak Oil...not PL: Peal Liquid. Both are obviously critical to our future. So are alts, conservation, coal. etc. For the most part I see very little of the thoughts here as not worthwhile. But there does seem to be a good bit of mischaracterzation of the points some folks are making and what they imply about the future. Sorta like my PO daddy can beat up your PL daddy or your PCoal daddy or your PAlt daddy. Amusing at times but it can become tedious IMHO. But still worthwhile I think. That's why I hang out here.
Sorry Leiten but that is simply not the case. A few doomers who predicted the plunge to start in 2007 or around about there have been proven wrong. The cornucopians who expected crude oil production to continue rising at 2% to 4% per year have been proven wrong also. We have been on a relative flat plateau since 2005.
The data is conflicting and suspect also. As I report above the JODI data differs considerably from the EIA data. And one IEA insider says the data has been manipulated. From Wiki on Peak Oil:
A senior official no less. If the EIA would try to persuade the IEA to manipulate the data, just imagine what the EIA might themselves do. That is why I trust JODI and say that Crude + Condensate peaked in 2006.
Also I must add that the EIA and the IEA simply report their best guess production rates for most countries. And because their predictions have always been quite optimistic, this could have greatly influenced their guesses. JODI, on the other hand, queries each country and when the country does not report they report a zero for that month. They don't guess.
Ron Patterson
Yes. Let us not count the many ways:
1. Cassandra
2. Malthus
3. Hubbert
4. Neanderthal Doomer Man
5. Winston Churchill versus Peace-in-our-Time Chamberlain
6. Homo-TODus sapien
I have a kind of stupid/beginners question:
I'm slightly familiar with where the pipe ends with West Texas and Brent and how the spot is related to the delivery price - but what about the rest of the world?
What proportion of world crude is bought from each (WT and Brent) pipes at those prices?
And what proportion is bought elsewhere/or at different prices (long term contracts, state subsidies etc?)
Are there any other notable markets (spot prices) for crude delivery one could follow (for example Russia)?
ransu - No stupid questions just occasional stupid answers. Most important when you see someone offer WTI, Brent, etc prices those numbers almost never have anything to do with any oil in the world is selling for at the time. Those numbers are typically what futures contracts are base upon and put out by the MSM.
But you can go to a spot buyers website and see what they are paying for WTI, Brent, etc depending on what particular oil is in their market. So let’s say they are paying $110/bbl of Brent. So they’ll buy my N Sea Brent for $110/bbl, right? Not necessarily. They’ll only pay me $98/bbl because my oil has a lot of sulfur in it and they pay only (Brent - $12). And if I sell my oil on a long term contract I’ll still get Brent less some deduct. Or I may get $115/bbl because my oil has a higher gasoline/diesel yield. I’m producing oil from a Gulf Coast Texas field that is similar to the general quality of WTI. But I’m not selling it on long term contract for an adjustable WTI benchmark price. It’s being barged to La. and being sold for the La. Sweet Light benchmark less $4.80/bbl…cost money to move that oil 170 miles.
And if I had the same exact oil in OK I would be getting something much closer the WTI benchmark. So to you question: how much is how much oil is selling for around the world. I don’t know and neither does anyone else. No one knows how much oil I’m selling and at what price. My contracts, just like every other oil producer, are confidential. Saudi might sell millions of bbls of oil to a major oil company and the exact volume and price are never released. In fact, if a Saudi employee were to do so they could be sent to prison.
And that is exactly why the MSM always throws out the futures contract prices as an indication of what oil sells for: it’s easy…go to the NYMEX website and read the number. Unfortunately what I sold my last load of oil for had nothing to do with what anyone was selling futures contracts for that day. And never will. My buyer offers a price and I either sell it for that price or I leave it in the tanks. Another company down the road from me is selling oil. I can pull the records and find out how much they produced last month. But I can’t find out what they were paid for it. And for much of the other areas in the world you can’t research the volume and will never know what it’s selling for.
Of course you can never know what Saudi sells each grade of oil for but you can get a pretty good idea. It should always be within a few dollars, either way, of the OPEC Basket Price which closed Thursday at $121.70. That was just 40 cents above the closing price on the Dubai Mercantile Exchange on the same day.
This, the DME Oman Crude Oil Futures Contract (OQD) is the Asian crude oil pricing benchmark. Most OPEC physical oil contracts, from the Middle East, will be priced within a few dollars of this benchmark, but will vary according to the grade of oil of course.
Ron P.
I was listening to Ian Bremmer plugging his latest book and his description of the worlds largest oil producers all being state companies, locking up most of the worlds resources from the 'free market':
Simple people (like me) have a picture of 'world oil market, as if we can always get our oil from 'somewhere'. Well if you start actually looking at the places where the oil comes from - production figures - you'll find that this strategic resource is already locked-up along political lines. Iran's 'blockade' is a recent illustration of this: choosing to abandon Europe as 'irrelevant market' to them in favor of the east: Pakistan, India, China, South Korea, Japan. For the moment Europe thinks it can afford this luxury. But who really is delivering oil to the Europeans? Almost all of the oil producers are countries that have less than favorable relations, and almost no dependence of Europe.
The middle-east, north-Africa, south-America, Russia - all have cozy mutual relationships with the major growing economies: china and India - and one can guess they get their oil at a significant political as well as economic-exchange-discount. Europe and the US are out of this loop. They pay the full price - and ones the market has shifted enough - might be left out all together the moment it becomes politically expedient.
I guess what I really want to know (foresee) is how will this play out: it seems we're heading into a situation where the next 'spike' in oil prices will have very unequal effects around the world: most states will have comfortable long term contracts, agreements, even 'understandings' between each other - and then there will be those of us who will actually have to pay the full spike price - or even be left with no delivery.
Not to mention all the economic and political analysis and calculations going to the toilet (garbage in garbage out): when you consider that the price the different parts of the world will pay for oil - and how much more and easily they receive oil they need - as opposed to others - is not going to abide by the laws of 'free market' anymore (if it ever did).
We could even end up in a situation where Chindia will negotiate "appropriate" delivery prices with the producing states for us in the west in order to keep its consumer market going a bit longer.
Ironically the extreme neocons were right: we should've occupied the middle east oil "when we could" - the producers ultimate have us by the balls.
One way to think about the situation you describe is that of being Vertically Organized: Owning all the assets used from production to retailing, which provides a big comparative advantage. China understands this and has/is worked/working hard to make it a reality. And while US politicos understand the viability of such a business plan, they are busier trying to deny China's implementing such a plan rather than trying to do the same for their nation. US based IOCs have no obligation to supply the USA except from their domestic sources, and their future behavior can be judged by their behavior to supplying the finished products market to whoever bids highest. Natural resource extraction industries ought to be seen as Natural Monopolies and National Assets, which is the view of most of Earth's nations. Bremmer is mistaken to think only dictatorships have such a view and perverts history by saying Iran was one at the time it nationalized its hydrocarbons.
Saudi Arabia, U.S. Seek to Manage Iranian Threat to Oil Market
http://community.nasdaq.com/News/2012-02/saudi-arabia-us-seek-to-manage-...
As noted up the thread, I think that monthly production data can easily be influenced by inventory changes. Here are the annual BP data for Saudi net oil exports (total petroleum liquids) from 2002 to 2011* versus annual Brent crude oil prices:
Note that Saudi net exports and annual prices tracked each other from 2002 to 2005, but diverged starting in 2006. The cumulative post-2005 shortfall between what the Saudis would have net exported at their 2005 rate and what they actually net exported through 2011 was about 2.5 Gb.
If we extrapolate the 2005 to 2011 rate of increase in Saudi consumption to production ratios, Saudi Arabia would approach zero net oil exports in about 17 years. This extrapolation suggests that Saudi Arabia may have already shipped about half of their post-2005 Cumulative Net Exports.
*I estimate that 2011 annual Saudi net oil exports were between 7.5 and 8.1 mbpd. The chart shows a midpoint estimate of 7.8 mbpd, versus the 2005 annual net export rate of 9.1 mbpd.
Studebaker entered the car market ca. 1906 with an electric powered model.
http://earlyelectric.com/carcompanies.html
In 1899, electric cars were preferred and outsold ICEs. If electric cars worked back then they can work today. Taxis in New York City were electric versions.
It is nonsense that electric cars are not superior, for all practical purposes.
http://www.todayifoundout.com/index.php/2011/04/in-1899-ninety-percent-o...
Now how did they get those electric cars to work without having to plug them in to charge the batteries?
The Bakken flows northward, so it may be best to drill at the north end towards the Canadian border and into the Three Forks. There are Bakken formation wells that were drilled in either the sixties or early seventies and are still operating. A rather low depletion rate, imo. The Bakken will probably have an additional 12,000 wells added in the next ten years on top of the current 6211 that are there now. A projected 40-45 thousand wells in the 15,000 square mile area of Bakken depocenter will probably produce at least 4,000,000 bpd after all 40,000 wells are there. It's the Obi Wan Kenobi of oil patches.
Oil will be well above 200 per barrel by then, so it is good for the Bakken.
A total of 30000 holes have been dug in the Bakken 250,000 square mile area over the last 65 years, so there is a lot of data on where the oil is. The success rate is 97 to 99 percent. You will strike oil in the Bakken just about every time you drill.
http://www.searchanddiscovery.com/documents/2006/06035flannery/index.htm
Peak Oil is very beneficial. Increases the price of oil per barrel, creates more efficiency and spurs exploration. Extends the timeline of the end of oil. Gives us all something to do.
Makes dollars and sense.
Ward – There will certainly be a lot more all oil coming out of the Bakken even with oil prices staying where they are today. So you’re 40,000 wells will be averaging 100 bopd? Unfortunately that might be the case if all 40,000 wells were drilled over a short period of time. Unfortunately many of the earlier wells will be plugged and abandoned by the time the last few thousands of wells are drilled. The decline model vs. new production model could be meshed to make some prediction but I don’t know enough about the Bakken to do it. Maybe some other TODster can do it. The decline rates I’ve seen for some Bakken production isn’t as bad as some other plays like the Eagle Ford but it isn’t insignificant. If 40,000 Eagle Ford wells are drilled in the next 10 years then by the end of that period the great majority of those wells will be producing only 10% of their initial rate…if they haven’t been plugged by then.
I have no boubt that most of your 6,211 previously drilled Bakken wells will still be producing. And those that are won't be producing a significcant amount of oil. As others have said: Depletion, like rust, never sleeps.
And let’s not forget: eventually all plays run out of locations to drill. I don’t know how many potential Bakken drill sites there at today’s price but it is a finite number. Over 20 years ago the hottest US play was the Austin Chalk in Texas. Makes the Bakken/Eagle Ford look calm. But not nearly as much AC drilling today: many thousands of wells drilled, produced and abandoned across hundreds of miles of countryside.
An analysis I did about 1 year ago:
Looking at Continental Resources’ (CLR) and Brigham’s reports we find one excellent consistency and a couple of major inconsistencies.
Brigham’s average production of 1800 b/d for the first week, 1100 b/d for the first 30 days, and 830 b/d for the first 60 days falls on a smooth curve that includes CLR’s 450 b/d for the first 90 days. This curve implies a production rate of 90 b/d at the end of the first year, only 5% of the first week’s average production rate.
If we take a production rate at the end of the first year of 100 b/d, declining to zero at the end of the 10th year, we have 165 kb for those 10 years. Add in the 75 kb from the first year and we have 240 kb EUR. This is a long way from the 300 to 400 kb EUR projected by CLR in their EUR vs frac stages chart. Their median EUR projection seems to be about 360 kb which is still high vs the decline curve, but much lower than the 518 kb they have modeled. Very strange.
I have tried curves using the 30, 60, and 90 day average rates as end of period rates, or as average for each of the first, second, and third 30 day periods instead. Thus I have a range of EURs from 240 to 410 kb, with a middle value about 340 kb. However the low end is the one consistent with both companies’ real wording. The safest EUR number to use is probably 250 kb/well.
In their curve of IP vs EUR Continental shows a first 30 day IP of 600 b/d corresponding to an EUR of 500 kb, and a 30 day average IP of 1000 b/d as an outlier vs 1100 as an average for Brigham. However a 30 day IP of 600 subtends a 90 day average production a long way below 450b/d, and therefore a much lower EUR. CLR’s EUR estimates look totally unrealistic, and inconsistent with their other data.
There is a lot of inconsistency in the Continental data. Their 30 day production rate curve vs frac stages must be for a lower producing set of wells than the 90 day curve. Both curves suggest that anything over 18 stages is well into diminishing returns. Near 15 stages looks optimum.
From Nov ’09 to Aug ’10 CLR has gone from 4 to 18 rigs, and from about 25 to about 33 “days on well”, about 10 wells/rig/yr at end 2010. Elsewhere they report 800 “gross” wells for 562 “net” wells. This would suggest 30% non-producers, , ie 7 producing wells per rig per year. With 164 rigs in Q4 2010, one would expect an average of at least 120 for the year, providing less than 700 new wells. A judgment call would suggest 6 producing wells per rig per year.
CLR then shows about 2300 wells producing in the Bakken at mid 2010, of which 2075 are horizontal multi frac wells. 2300 wells produce about 350 kb/d at end 2010, or 150 b/d/well. It looks like there were 400 wells added in 2007, 550 in 2008, 500 in 2009, and > 600 in 2010. An average production in the first year of 500 b/d/well, declining to 160 in the second year, 80 in the third year and 65 in the 4th year, etc., would give us near 150 b/d/well at end 2010, which is consistent, and is also consistent with an EUR of about 250 kb/well. So we now have some numbers to project future growth in output.
Production prior to 2011 seems to decline 90% in 5 years relative to the first year average. 2011 saw a lot of news about improved frac'ing methods which might improve both initial production and decline rate.
CLR claims there were 164 active rigs working in the Bakken in late 2010. If we add 60 rigs per year to 2020, and maintain 7 wells/rig/yr, and if my calculation is correct, we would be producing 3 million barrels/day in 2020.
There may not be enough water to support such a growth rate, and Rockman has pointed out that there may not be enough producing area either.
Murry – Great numbers…gives some sense of scale. A couple of points. “Net wells”: if they are using the conventional oil patch meaning this doesn’t imply a success rate. I may drill 500 wells but if I owned only a 50% working interest in each well and other companies owned the rest I drilled 250 “net wells”. The majority of wells are drilled as such “joint ventures”. And from I understand dry holes are rare in the Bakken. But a successful well, by definition, is one that is completed and produces hydrocarbons. But that doesn’t mean it was a profitable well. I’ve completed and produced many wells that never recovered the cost of the investment. I’ve seen a number of companies go under despite having successfully drilled the majority of their wells because, in the end, the effort was a net loss.
Your potential 3 million bopd: did you model in the depletion of the previous wells? If the rate is going to be that high you must anticipate a very high drill rate at that time given the high decline rates you offer. And to hold that 3million bopd you must be drilling a lot of wells continuously.
Yes, the 3 million bopd is after declines of existing wells.
(> 600 wells added in 2010) / (164 rigs in late 2010) = > 3.7 wells/rig/yr
Estimating 7 wells/rig/yr does not appear to be supported by your data. 4 wells/rig/yr would be more reasonable.
Sanity check: The Bakken Boom - A Modern-Day Gold Rush, December 12, 2011:
A rate of production of 3 Mb/d would deplete the Bakken in 2.7 to 3.9 years. 315 kb/d for 8 years plus 550 kb/d for 9 years would extract 2.7 Gb by 2020. Using the highest estimate of URR, 2.7 Gb / 4.3 Gb = 63% depleted by 2020. Trying to get to 3 Mb/d, assume an average of 315 kb/d for 8 years and an average of 1.8 Mb/d for 9 years causing 6.8 Gb to be extracted from the Bakken by 2020. You are estimating a much larger URR for the Bakken than the USGS.
Blue - Your numbers point out the flaw in most cornucopian fantasies. Though I'm not sure Murray falls into that category since I'm not a Bakken expert. It very easy math to say a new well comes on at 500 bopd and predict X thousand wells will be drilled each year for the next Y years. And ...Shazam!...you end up with millions of bopd production. Unfortunately, like rust, depletion never sleeps. Early wells will be producing little or no oil by the time most future wells are added to the mix. Of course the numbers add up quickly...when you don't subtract depletion decline.
Blue - Your numbers point out the flaw in most cornucopian fantasies. Though I'm not sure Murray falls into that category since I'm not a Bakken expert. It very easy math to say a new well comes on at 500 bopd and predict X thousand wells will be drilled each year for the next Y years. And Shazam! You end up with millions of bopd production. Unfortunately, like rust, depletion never sleeps. Early wells will be producing little or no oil by the time most future wells are added to the mix. Of course the numbers add up quickly...when you don't subtract depletion decline.
Similarly I would have a great balance in my savings account today if I had never spent any of my paychecks
The first estimates I saw for the Williston Basin, some years back, were 100 times higher than the current USGS estimates for the Bakken. Companies working in the Bakken come up with projections 10 times higher than the USGS estimates. So yes, I have assumed that the USGS may be being conservative for a change. However, I expect it will be depleted quickly anyway, maybe 15 years max., or peak production will be much lower than 3 mb/d. I agree that the 3 mb/d is a long-shot, but I wanted to see what might be possible given an optimistic estimate of how quickly rigs could be added and crews trained.
The USGS's 4 billion barrels in the Bakken is already ancient history. Continental says it's now up to 20 billion barrels, and in their earnings conference call last week they discovered a whole new zone of the Three Forks formation is oil-bearing which, according to their calculations, places the amount of oil-in-place in the Bakken/Three Forks system at 900 billion barrels instead of 577 billion barrels. Which will surely increase the amount which will eventually be recoverable. A 5% recovery rate gets you 45 billion barrels.
No. Four billion barrels is in the distant future. Cumulative production may be up to 0.3 Gb.
And CLR still has credibility ?
Leigh Price, who's study never got peer-reviewed - because he died, estimated the total oil generated in the 200 - 400 Gb range. Where did the additional oil come from ?
http://www.undeerc.org/price/TableofContents.pdf
Quoting Jack Stark from the conference call transcript:
"We're using the core and metaphysical data". LOL !
I doubt Jack Stark said metaphysical data - probably petrophysical data. These transcripts are often full of mis-quotes that never get corrected. Texan and Oklahoman speak needs to be interpreted into actual English !
Price estimated up 200Gb URR for the Bakken.
There may not be enough water to support such a growth rate,
Can hydro frac water be recycled well to well?
Falstaff - I know of one company trying to do just that. I haven't seen the details but it appears to be a rather expensive process. I haven't heard of any significant usage in the Eagle Ford yet. Frac fluids are a rather complicated chemical mixture which doesn't work well with salt water or previous used frac fluids. Given the hundreds of $millions spent by operators to properly dispose of frac fluids it's easy to see the motivation to come up with alternative solutions.
Someone in Oklahoma is trying to do just that. They have built one very large pond to aggregate the fluids from a few wells. I think it is Devon in the Anadarko, Cana, Woodford.
Various estimators have projected current oil production to decline 4%/yr, which is now about 3 mb/d/yr. The Megaprojects WIKI shows total expected production from new projects as 2.5mb/d/yr in 2012 and 2013, so NGL will have to grow at least 0.5 mb/d/yr just to keep all liquids flat, and close to 0.7 mb/d/yr to keep total net energy flat. Since beginning 2008 it has grown about 0.1 mb/d/yr. It seems likely that we visibly start the decline from the long plateau of production not later than mid 2013. Demand growth might remain sufficiently depressed by already high prices and the ongoing economic problems world-wide to avoid shortages at least until the end of 2015.
There are many problems with the bottom-up approach to forecasting future oil supply.
1) Omissions. Projects get omitted.
2) Omissions. Megaprojects don’t include the Bakken, Niobrara, Frontier Eagle Ford, Granite Wash or others. Using the 10,000 bpd threshold, some of these plays would qualify year after year or in some cases month after month. NGLs are omitted.
3) Omissions. Smaller projects falling below the 10,000 bpd threshold. Columbia is a good example. Columbia is not even listed on oil megaprojects. Apparently the logic is that smaller projects don't amount to anything. Basic math, using any reasonable decline assumption, shows that the Megaprojects understate supply.
4) Omissions. Due to front end loading of projects. Projects are scheduled in the start-up year. Never to be heard from again. If peak rate doesn’t happen, for whatever reason in the first year, production for years prior to peak year are omitted. Iraq is a good example. Looking at Iraq, the Rumaila project, with a peak rate of 1.85 million bpd is listed, all of it, in 2010. Peak is forecast for 2016. None of the incremental increases 2011 through 2016 are listed.
5) Projects that perform better or worse than forecast.
Megaprojects provides a convenient tabulation of oil and ngl projects.
If all of the smaller projects in the world falling under 10,000 barrels/day average say 6000 b/d, we need 80 of them per year to make up the 2012/2013 shortfalls. Hopefully they will have some impact, but there is no way they can help with 2014. All of the USA fields listed above probably won't provide an incremental 100k b/d/yr. Do you have any quantification of why Megaprojects doesn't provide a pretty good indicator of when we fall off the plateau?
You should have read on to 4) - front end scheduling. Megaprojects would need an overhaul to be of quantitative value. Rumalia is just one example.
West Quarna is not listed:
http://finance.yahoo.com/news/Exxon-breaks-silence-rb-3946867504.html?x=0
390 kbpd from 244 kbpd with peak rate of 2.825 million bpd scheduled for 2017.
The "total liquid fuels" statistic is garbage. All that matters is crude oil.
Not so fast.
The move towards gas central heating in homes easily has the ability to displace C+C useage where the oil/coal power generation went to heating home via electricity AND the generation of electricity itself from gas......Same with many others that take C+C up to BOOE...they can displace C+C usage.
Yes we measure C+C as a benchmark for where we are on the peak oil curve, but that particular hydrocarbon measure is arbitrary insofar as being an enegy source that we pick to measure. It all counts in some way.
The important part is the fact that inspite of this rise in available hydocarbon, prices are still climbing on average 14+% per year which the global economy is barely able to cope with short term, let alone long term.
Marco.
Brazilian ethanol has very limited effect on food prices. They just announced their intention to spend $35B to put another 20000 square miles of pasture into sugarcane for ethanol over the next 4 years as well as investing to improve yields on existing fields. I would expect this to add about 800kbd to 1mbpd to the biofuel numbers.
Gasoline usage is only down because there are fewer people working and commuting to work. Deeper analysis shows that those working in high paid jobs are commuting further afield, and those unemployed are having to search further for employment (so much for the local economy) - INCREASING GAS/AVIATION USAGE eg http://www.bloomberg.com/news/2012-02-23/super-commuters-surge-as-stuck-... - also China is looking to invest heavily into US manufacturing to partially offset global transport cost. I view peak demand as bunk, and nothing more than a convenient business mantra.
Gasoline usage is only down because there are fewer people working and commuting to work.
Clearly there are other possibilities, like improved transportation efficiency, telecommuting, etc. Why ignore them?