The Myth That the US Will Soon Become an Oil Exporter
Posted by Gail the Actuary on April 20, 2012 - 11:04am
Countries trade crude oil and oil products back and forth. When all of these transactions are netted out, is the US close to becoming a “net” oil exporter?
With the recent increase in oil production (perhaps even exceeding that of Russia on a “barrels-per-day” basis), a person might think that US oil production problems are behind us. If we look at the data, though, it is very clear that the US is still a long way from becoming a net oil exporter.
There are several reasons for confusion. One is the fact that excess refinery capacity can lead to the ability to export both gasoline and diesel, even though the United States continues to import large amounts of crude oil. Another is that tight oil (extracted through “fracking”) is growing from a small base, but can’t necessarily ramp up very far, very quickly. Another source of confusion is with respect to how different types of liquids should be combined for comparison purposes.
In this post, I would like to explain why the idea that the US is about to become a net oil exporter is simply a myth.
1. On what basis does the US Energy Information Administration (EIA) make forecasts of oil and other energy supplies?
When the EIA makes forecasts of oil and other supplies, as in its recently issued Annual Energy Outlook, Early Release 2012, it looks at future consumption and future supplies in terms of the amount of energy supplied in Btus. In doing this calculation, oil is combined with natural gas liquids. Biofuels (which in the case of the US are almost entirely corn ethanol) are treated separately, as part of “renewables”.
It seems to me that the EIA’s approach is about the only reasonable way of making comparisons, since it is energy value, and not volume (barrels-of-oil per day), that is important. Furthermore, if we are talking about oil imports and exports, we want to know about oil, perhaps including natural gas liquids (which are sort of like oil) by itself. Biofuels are a separate issue.
2. Where are we now, relative to being an oil exporter?
On a Btu basis, the US imported 58% of the oil it consumed in 2011. This percentage is down from a high of 67% in 2005 and 2006, but it is still very high.
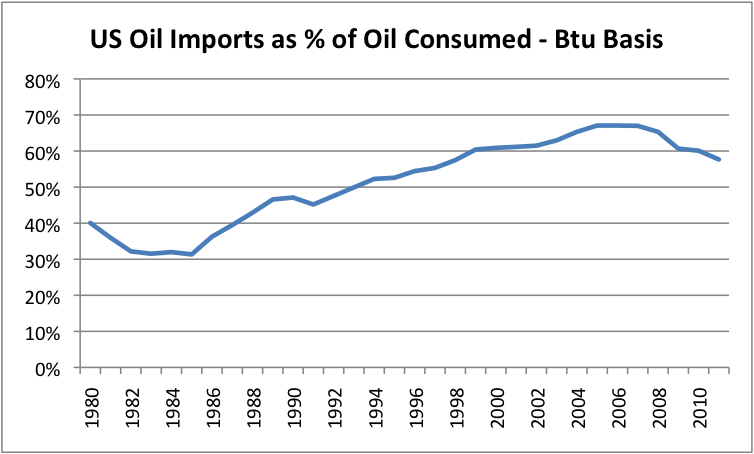
If the US wants to become an oil exporter, it must first get its imports down from 58% to 0%, and then ramp up production by enough to have oil to export as well.
3. What does the US Energy Information Administration (EIA) forecast regarding oil imports/exports?
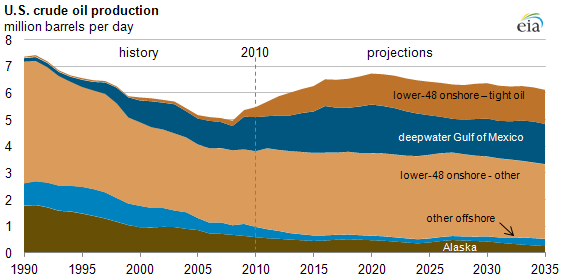
In EIA’s Annual Energy Outlook 2012 Early Release, EIA gives the following forecast to 2035. (2010 and prior data are actual amounts.)
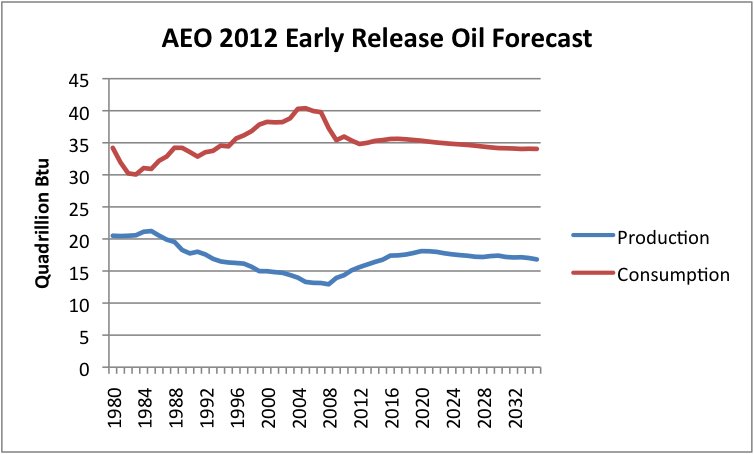
We can use the forecast in Figure 2 to create a graph similar to Figure 1, but with the EIA’s forecast included. Such a graph is shown as Figure 3 below.
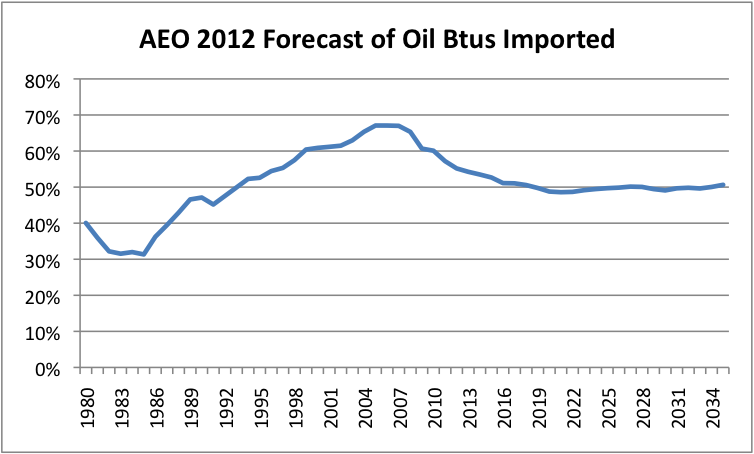
This graph indicates that while percentage of oil imported will drop a little (from 58% down to about 50% or 51%), the United States will not become an oil exporter before 2035.
4. How about if we make our own forecast regarding when we will become a net oil exporter, based on how consumption and production have been trending recently?
Yes, we can do this. I do this in Figure 4, below.
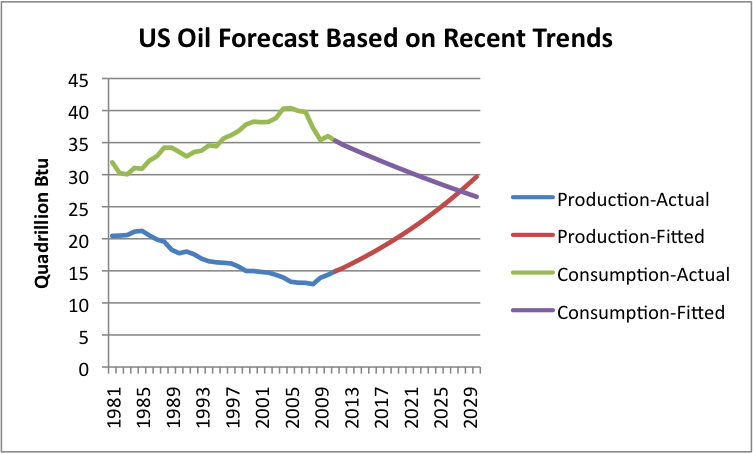
Based on this approach, if the US could keep up the current trend, we would become an oil exporter in 2028, which is 16 years from now. This result is better than the EIA’s forecast, but is still a long ways away.
5. Isn’t the production of tight oil, obtained by “fracking,” doing very well?
Yes, it is. According to the EIA’s This Week in Petroleum, a graph of tight oil production by play is as shown in Figure 5, below. Tight oil is the oil that is typically extracted by horizontal drilling and hydraulic fracturing. It comes from shale and other very-low-permeability rocks.
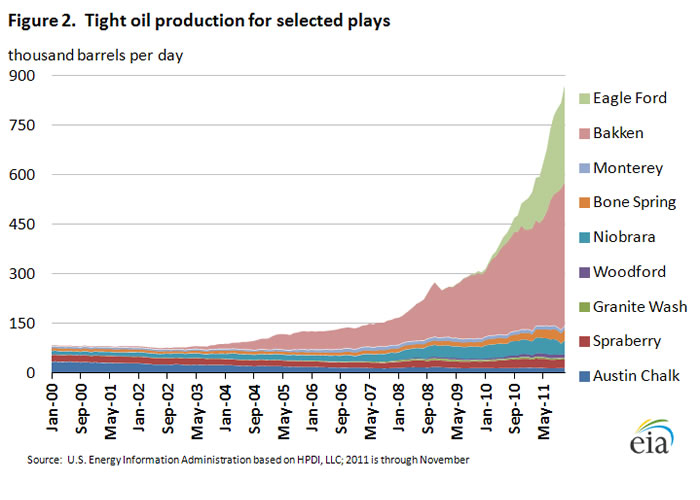
This graphic indicates that tight oil provided about 850,000 barrels a day of oil, as of November 2011. The United States consumes a little under 19 million barrels a day–lets say 18.5 million barrels a day. The 850,000 barrels a day of tight oil amounts to a little less than 5% of the 18.5 million barrels a day we consume, so is only a small fraction of what we use today.
If we look at a graph of recent US crude oil production by area, this is what it looks like:
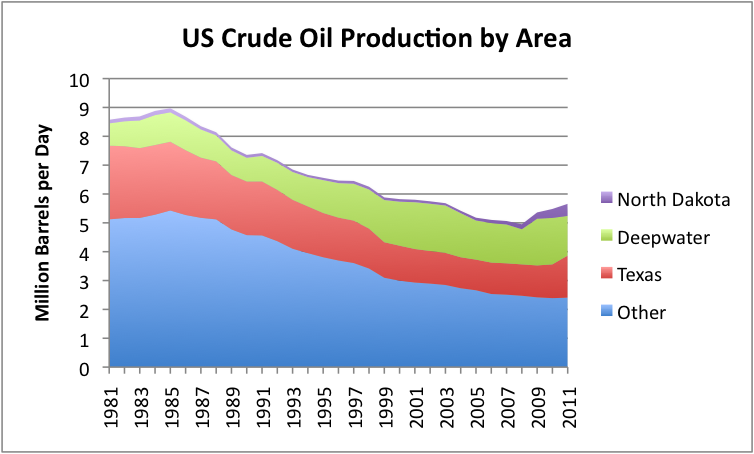
Bakken tight oil is in North Dakota, which corresponds to the purple area in Figure 6 above. The Eagle Ford play (as well as some of the smaller plays) are in Texas, which is shown in red. At the same time these two sources of production increased, deepwater production decreased, so the total increase in US crude oil production was less than the increase in tight oil production.
We have a long-term problem with declining oil production on older fields (illustrated in Figure 6), so we can expect that such declines will continue. As a result, whatever new production we gain from tight oil or other new sources is likely to be offset by declines elsewhere. It is only to the extent that new production is greater than these declines that overall US production will rise.
6. Can’t we just keep ramping up the tight oil production, by drilling more?
We can probably ramp up production by drilling some more wells, but at some point we start running into limits of suitable horizontal drilling rigs and of trained workers.
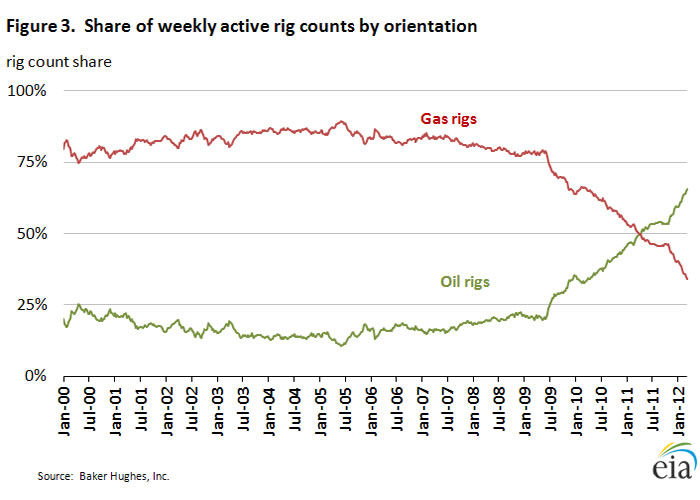
The figure above shows that there has been a big shift in use of drilling rigs from gas to oil. Current Baker Hughes data shows that as of April 13, 2012, 32% of drilling rigs (vertical and horizontal combined) were gas and 68% were oil. At some point not too far in the future, we end up being maxed out on how many horizontal drilling rigs can reasonably be transferred from gas to oil. More horizontal drilling rigs can be built, but this takes time and investment capital.
One characteristic of wells in tight formations is that production starts out very high, and then drops off quickly. Because of this, it is necessary to keep drilling new wells, or total production in an area is likely to drop off very quickly. New fracking techniques may help make the drop-off problem less severe, but it is hard to imagine that it will go away completely. If we want production to keep rising, this means that we are likely to need more and more horizontal drilling rigs, more and more fracking equipment, and more and more capital. These considerations help put a lid on how quickly and how high production can be ramped up.
7. How much tight oil does the EIA forecast can be extracted?
The EIA forecasts that tight oil will max out at 1,325,000 barrels a day in 2030. The EIA does not have a good track record of foreseeing changes before they happen, and the chart above shows production already at 850,000 barrels a day. Suppose the US really produces five times as much as the EIA forecasts, or 6,625,000 barrels a day. This increase will still not be enough to cause the US to become a net oil exporter, especially if other sources of oil continue to decline. (This is not to say that I think that production can really be ramped up this much. We would likely run into a number of bottlenecks before reaching this volume–drilling rigs, workers, fracking equipment, capital, etc.)
8. Haven’t we been reading about exporting gasoline and other oil products recently? Does’t that mean we are becoming a net oil exporter?
Yes, indeed, we are exporting gasoline and other oil products to a greater extent than we have in the past. But we continue to import crude oil, so, on balance, we are still a net oil importer.1
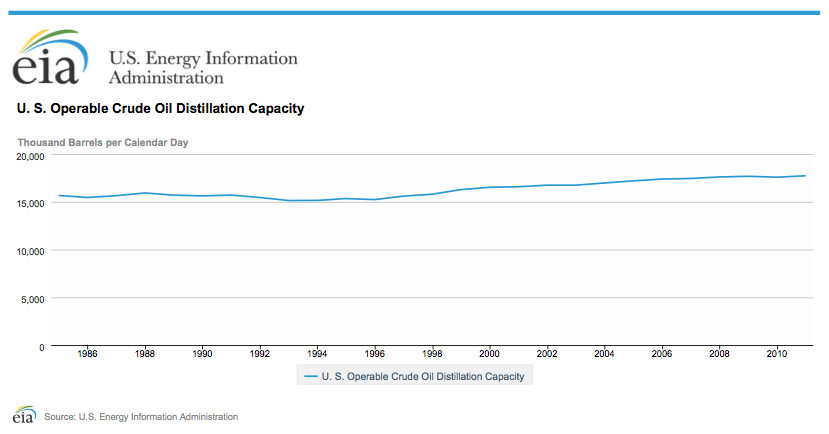
What has happened is that we have continued to add to our refinery capacity:
At the same time, we have reduced our own need for gasoline and other products. One of the ways we have done this is by ramping up corn ethanol production. We are now producing so much ethanol that we are exporting some of it (Figure 10, below).
The other way consumption has been reduced by reducing the miles driven per capita (Figure 11, below).
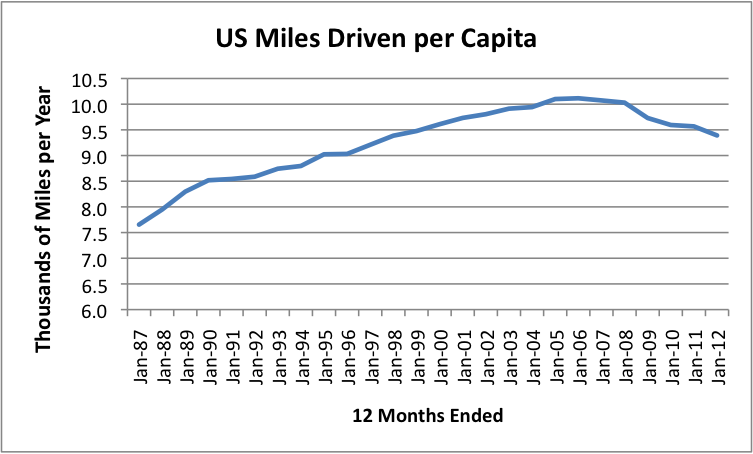
The peak year for vehicle miles traveled per person was the year ended January 2006. (All of the data in the chart is for years ended January 20xx.) Since then, per capita vehicle miles driven have dropped each year, and are now 7.2% below their peak.
Total miles driven for the entire US population has also dropped. The peak year for total vehicle miles driven was the year ended January, 2008.
There may be other changes that affected oil use, but I don’t have data for them. For example, transferring heavy industry offshore would tend to reduce oil use; an increase in average miles per gallon for vehicles on the road would also tend to reduce oil use.
The net effect of all of the changes is that US oil consumption is down significantly since its high point in 2005. Figure 12, below, shows an enlarged view of recent oil consumption.

A comparison of Figures 9 and 12 shows that refinery capacity was increasing at the same time that US oil consumption was decreasing. If we have more refinery space than we need, refiners can import crude oil, refine it, and sell the products as exports. That is pretty much what has been happening recently.
A few things have happened in the past few years that have made US refinery capacity especially attractive:
1. The US has a good supply of “complex” refineries that can process heavy sour crude oil. There is relatively more heavy sour crude being produced now, than previously, raising demand for these refineries.
2. The US has a low price for natural gas, compared to the rest of the world. Natural gas is used in refining heavy, sour crude oil, so our cost of refining has been relatively lower than other locations with similar facilities.
3. The amount of sulfur that is permitted in diesel and other fuel is being regulated in the US and elsewhere, to control pollution. If a country wants to have at least some fuel that meets international regulations, it now needs to find a refinery with complex capacity to remove the sulphur from its crude oil. Many countries do not have such refineries of their own. For example, Mexico sends us oil to refine, and we send oil products back to Mexico.
9. Why do I keep reading so much about “barrels of liquids,” when talking about US oil supply?
The US government likes to talk about “barrels of liquids” because comparisons with other countries are more favorable on this basis than they are using Btus, or considering crude oil only. If we look at a breakdown of US “liquids” production through 2011, this is what we see:
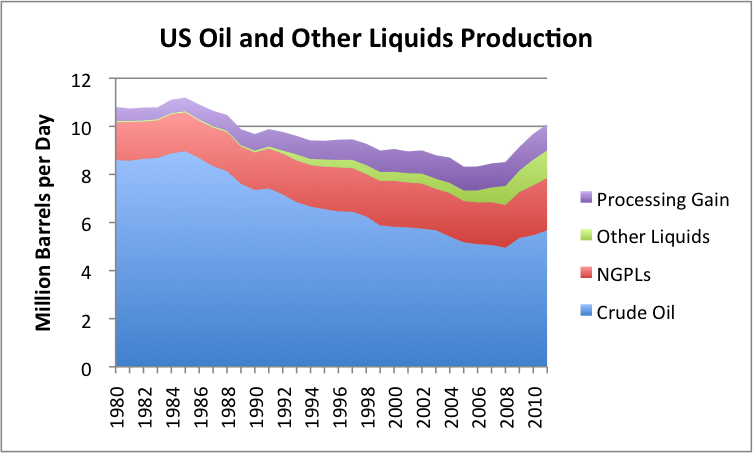
I noted above that US oil consumption is approximately 18.5 million barrels a day. If liquids production is about 10 million barrels a day (shown in Figure 13 above), then a comparison of production on this basis would leave a shortfall of “only” a little more than 8 million barrels a day. So even on this basis, we are still a long way from being a net oil exporter.
The problem in making a comparison on a volume (barrels-per-day) basis is that very dissimilar liquids are being combined. Both NGPLs (natural gas plant liquids) and “other liquids” (mostly ethanol) have only 60% to 70% of the energy content of crude oil. It is doubtful that “refinery gain” adds much energy content at all. The EIA has made adjustments for differences in energy values in its calculations on a Btu basis.
For those interested in finding data on a Btu basis, the Total Energy section of EIA reports gives data on this basis. They are also available (with a lag) in International Energy Statistics.
Note:
1. It is easy to confuse “net oil exporter” with “net oil product exporter”. We can think of net oil exports as the combination of the following four items:
a. Crude oil imports
b. Crude oil exports (virtually zero in the case of the US)
c. Oil product imports (like gasoline and diesel)
d. Oil product exports (like gasoline and diesel)
Net product exports reflect only the combination of Items c and d, omitting consideration of Items a and b.
In 2011, the US became a net oil product exporter. This means that when Items c and d were combined (in other words, omitting consideration of crude oil imports), we exported more oil products than we imported. This situation can happen very easily, if we are importing a lot of crude oil, and have excess refinery capacity.
This post originally appeared on Our Finite World.
Contact
- Content: editors at theoildrum dot com
- Tech support: support at theoildrum dot com
License

This work is licensed under a Creative Commons Attribution-Share Alike 3.0 United States License.
gail,
Thank-you. This is another one of your wonderful "no-spin" articles that vividly illustrates the topic. Anyone with any reasonable understanding of how to read a graph would be blind and dumb not to understand your point.
I just wanted to add that the real situation for the US is more complicated (as you know better than most!). The reality that Mexico, other Latin American countries and especially Canada will continue to export to the US under almost any reasonable imaginable circumstance means that the US does not need to be an "oil exporter" in order to maintain its dominance in the world (at least militarily). Canada in particular is so "joined at the hip" with the US (NAFTA, NATO, NORAD, history, families, geography, food trade, etc., etc., etc.) that their surplus from the Oil Sands, which will grow significantly over the next 10-20 years. The real question is whether or not NORTH AMERICA (at least) can become a net oil exporter. That is probably an even more important question.
Despite the border hassles between Canada and the US, the "single market" is an effective reality for the largest trading relationship in the world. That is not going to change unless the US becomes very cold (no food exports), but then Canada would likely be colder!! Interestingly, Global Warming would likely be a plus for Canada (lots of marginal northern crop lands with yield dependent on the number of frost free days). Now what would that do to the oil export equation??
Thanks again,
IWylie
The BP data base shows that the combined net oil exports from the seven major net oil exporters* in the Americas and the Caribbean fell by 1.4 mbpd from 2004 to 2010, from 6.2 mbpd in 2004 to 4.8 mbpd in 2010 (Total Petroleum Liquids).
*Canada, Mexico, Venezuela, Argentina, Colombia, Ecuador and Trinidad & Tobago
Globally, based on extrapolating 2005 to 2010 rates of change in consumption to production ratios, I estimate that post-2005 Global CNE (Cumulative Net Exports) were already about 22% depleted, through 2010, and I estimate that post-2005 Global CNE that are available to importers other than China & India (Chindia) were about 40% depleted, through 2010.
Rising US oil production is critically important, but the dominant trend we are seeing is that developed oil importing countries like the US are gradually being shut out of the global market for exported oil as the developing countries, like the Chindia region, consume an increasing share of a declining volume of Global Net Exports of oil (GNE).
Anyone with any reasonable understanding of how to read a graph would be blind and dumb not to understand your point.
You've just excluded about 98% of the U.S. population. And substituting "lazy" for "blind" would be more accurate.
Thank you Gail!
Another way to look at becoming a net oil product exporter is that the US economy is now being out bid for refined oil products. Others are willing to pay a higher price than US consumers, and so oil products are leaving the country in record amounts, going to higher paying customers.
Eventually I would expect new refineries to be built in countries with growing oil imports, and then we could expect even more US refineries to close.
That is another good way of looking at things.
I keep saying: Oil products go where the jobs are. This happens for two reasons:
1. Manufacturing of goods and transporting them to new locations usually uses oil.
2. The wages of the people who make the goods allows these people to purchase goods that use oil, such as cars or motorcycles, and vacations.
"Demand" depends on having the income available to buy goods using oil. If we offshore our manufacturing jobs to China, the ability to buy products made with our oil tends to go to China. If the wages of workers in the United States are cut to be more competitive with China, this leaves our workers with less discretionary income to buy goods made with oil products.
As a mathematician I am sorry to see a graph like Figure 4. You took 3 or 4 data point and used them to extrapolate over 20 years into the future. Extrapolation is very dangerous especially when there is such a meager database. The word ‘fitted’ you used is misleading since it is used to describe the process of interpolation (fitting a curve to points over a entire interval) that is more sound since data are available over the whole interval up to the end point and not just for the beginning.
Figure 4 is dangerous since it can be used by ignorant people to ‘scientifically’ proof that the US will become a net exporter and hence will be self-sufficient in 2029.
I tried to explain I didn't expect this to really happen, because limits would be reached first.
When we have an underlying physical situation that is changing, I don't think that any one procedure is "right". We have way too many people who are convinced that as long as we fit trends to the long-term situation, the result is valid. Such reasoning seems to be the basis of a lot of standard economic thinking. Just because we have had growth in resource extraction and economic growth for a long period in the past says nothing about the future.
Figure 4 is useful, as long as it is properly explained. Basically, Figure 4 is what is necessary to come to pass if the US is to become a net oil exporter.
You then need to show what that would entail:
(a) What it would take for production to ramp up by 87% on a BTU basis in 16 years. This would have to include enough to overcome field decline in all existing fields over that time, before you even start increasing from current levels. It would also need to cope with, as Gail said, the precipitous decline rates that accompany fracking for tight oil. It would be interesting to see how many rigs would be needed to turn this production figure into reality.
(b) What it would mean for consumption to decline by 23% on a BTU basis in 16 years. Remember also that the US population will continue to increase over that period, even if birth rates plummet immediately, so the per capita decrease will need to be 33% (assuming a 15% rise in the US population in that period). Fuel efficiency standards are legislated to improve, and could quite credibly be toughened further. That does not, however, necessarily translate into lower consumption? What price of oil would it take to prevent people in the US turning Jeavon's Paradox into reality and simply driving further? Or buying bigger SUVs? Further, what sort of economic growth figures would be behind that 33% per capita drop in consumptiton?
Basically, exploring Figure 4 would reveal that the proponents of the theory that the US will become a "net oil exporter" by 2028 are either wild-eyed optimists on geology, economic doomers, or both.
A per capita decline of 33% could be pretty easy and painless. About 50% of current liquids consumption is for personal transportation - a 50% decrease wouldn't be that hard: that gets us 25 of those 33 percentage points. The other 8 points can come out of industrial/commercial consumption pretty easily: freight, for instance, will move from diesel trucks to NG trucks or rail.
If you look at driving stats over the last few decades, you'll see that US drivers have been increasing their driving less and less every year, regardless of price. Greater efficiency and lower costs per mile wouldn't change that. http://www.fhwa.dot.gov/ohim/tvtw/tvtpage.cfm
Gail,
I like your figure 4. If the trend line for oil production was then broken down by the trend lines for various sources of production in figure 6 I believe that what it would show is a massive expansion of oil production from N. Dakota and Texas - the only growing components.
Similarly it would be interesting to see what the downward trend in aggregate consumption implies with regard to the individual components e.g where would miles driven per capita have to go to.
Regarding increases in production, it seems like there are always some locations where oil production is increasing while others are decreasing. This allows whoever is talking about the situation to always be right, part of the time. This may partly be related to where the rigs are drilling. If they are one place, they are not in another place. Of course, production should not decline too quickly for a while after the rigs leave, but this doesn't necessarily happen.
With respect to consumption, I had the same thought about how much vehicle mileage would have to drop. It seems like there would have to be other declines as well--decline in asphalt use, decline in diesel used by trucks and trains, decline in lubricating grease. This time, going offshore wouldn't help, unless offshore they had a good supply of oil.
Gail,
Can you comment on LNG and this recent story of export of LNG? Should USA convert more of its transportation to LNG, as I see happening in the public sector in India. This has considerably reduced pollution in its capital metro New Delhi.
The US has a surplus of natural gas right now, for a variety of reasons:
1. It is an unwanted by-product of oil and natural gas liquids production. Producers will produce it regardless of price, because they make their money on "liquids".
2. Shale gas producers find it expensive to drill shale gas, but because they have signed leases and have large amounts of outstanding debt, find it necessary to continue, even if the price is low.
3. We had an unusually warm winter.
Eventually, items (2) and (3) may go away, especially if the "cheap" gas is enough to fill our needs. If not, natural price will have to rise quite a bit, to make it profitable for the shale gas producers to continue to produce. So we will either have less natural gas, or higher prices, or possibly both.
Because of these issues, it makes it hard to plan for the long term. Both Europe and Japan have far higher natural gas prices than the US--several times as high as US prices. So this is the reason for interest in export of LNG. It is expensive to make natural gas into LNG and to ship it long distance, but given the price differential, sending it overseas makes sense from a business point of view. People who have to put up with fracking in their back yards may feel differently.
If natural gas is to be used in a vehicle, there are various ways this can be done. The most common is compressed natural gas. This can be done fairly simply, using natural gas from the pipeline and compression equipment. Alternatively, natural gas can be cooled to minus 259 degrees so that it is a liquid, and then be used in that form, In that form it is LNG (similar to when it is shipped oversea). It takes up less space as a liquid, but the cost is higher and it needs to be kept cold.
If natural gas is used as a vehicle fuel, careful plans need to be made, so as to match up the amount and type of fuel available with the number of vehicles using the fuel. Very often, natural gas vehicles are city busses, or some other type of vehicle that operates from a central hub, where they can fill up. If there are too many vehicles for the system, when it gets cold and demand for natural gas for heating is high, there may not be enough for everyone.
When cost comparisons are done now, the assumption is usually made that cost will remain low, and that natural gas will not be subject to gasoline taxes. Neither of these assumptions is necessarily true for the long run, although because natural gas is the less-convenient fuel, it probably will continue to be somewhat cheaper.
So it seems to me that we need to be adding vehicle use of natural gas as a measured pace, not too rapidly, so as not to exceed the capabilities of local pipelines and of producers. I don't think we can ever expect natural gas to make up a very large percentage of vehicular travel.
Hmmm....
From the Wikipedia link you provide on compressed natural gas, I learnt that the country with the most number of natural gas vehicles is Pakistan! And non-significant natural gas countries like Argentina and India are in the top 5.
Something does not compute. If these countries can have a large natural gas vehicle fleet, US with probably fairly abundant natural gas reserves cannot promote this cleaner burning fuel? It just does not make sense!
Those countries don't have a huge number of vehicles in total, compared to the US.
They are also not using their natural gas for heating homes and businesses--they are warmer countries so don't need to heat.
We have so many vehicles, we certainly do not have enough natural gas to convert any sizable percentage of them. Some parts of the country are better supplied than others with natural gas. The better supplied parts could stand to add more natural gas vehicles than the less well supplied parts.
Methanol, often considered as a biofuel, is most economically made from natural gas and has been tested at scale:
I have no doubt that natural gas as a transportation fuel feed stock will be increasing, and as mentioned, will be increasing in price. Our obsession with being mobile will eventually result in NGs availability and price reaching parity with other liquid fuels, driving up the costs of other uses (e.g. fertilizer and heating). No free lunch there.
NGs availability and price reaching parity with other liquid fuels, driving up the costs of other uses (e.g. fertilizer and heating). No free lunch there.
NG historically prices at ~15 to 20X the price of oil (mbtu vs bbl). Presently the ratio is 50X. So while there is no free lunch, a cheap lunch is certainly possible for years to come via natural gas derived fuels.
Figure 12. Recent US oil consumption, in Btus.
It looks like US peak oil consumption has come and passed. Seems still a lot of room of VMT reductions and vehicle mpg improvements as well as replacing oil based fuel with CNG and electricity.
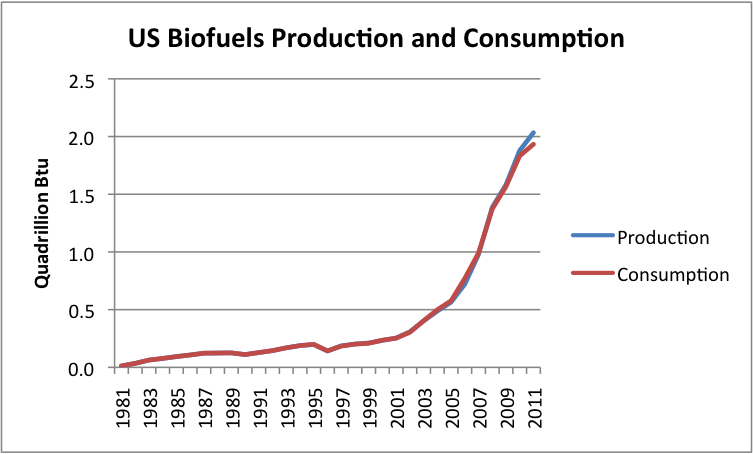
With bio-fuels at 2QBtu that is a significant figure in comparison to U.S. crude production between 6 and 7QBtu.
Are you expecting that bio-fuels will level off or are they going to be able to make more noticeable gains?
Biofuels are limited by the amount that can be mixed with petroleum-based fuels. Right now, most production is ethanol, and production is at a level where most gasoline is already at 10%, so sometimes you will hear the saying, "We are hitting the 10% blend wall." This is part of the reason for exporting some ethanol in 2011--we couldn't use it. Look at my graph in the post.
Now, there is an effort to get 2001 and newer cars to use fuel that is blended with 15% ethanol. The EPA has approved it, but it is not clear how much farther it would go. If a user of an older car, or a small engine, uses E-15, it could be damaging to the vehicle. It is also not clear that the pumping equipment can handle E-15 without changes. Stations might find themselves needing to sell E-10 as well as E-15, meaning the need for extra pumps and other equipment. Whether this will happen is uncertain.
If E-15 really is adopted in practice, there is a chance that we could use more ethanol--theoretically eventually close to 50% more than what is used today. If not, ethanol use is pretty much maxed out. As gasoline use drops (fewer miles driven, better milage per car), its use will drop as well.
There is also a very small amount biofuels of other types being made (say, from restaurant grease). This theoretically could increase.
There is a tiny amount of "chemically equivalent" biofuels made, using very different approaches. (Robert Rapier is an expert on this. Check out his blog.) These can be used up to 100% in an appropriate vehicle. These are being tested for use in, say, a few military airplanes or trucks. These could theoretically be ramped up, but from a small base.
What I don't understand is why don't you try to get published in mainstream magazines and news papers offering your different viewpoint...the wave of "we are going to be energy independent" is everywhere...take a look at page 48 of the new wired magazine..they state that the u.s is moving closer to energy independence...go on talk shows...To the point with warren olney has a lot of shows about energy but the only voice they have is daniel yergin.....this a great medium but you are only preaching to the choir here.
I do need to write a book or something else that will be more widely disseminated.
I have some high level contacts, so even what I write on blogs gets read pretty widely, but not widely enough.
I have tried a few WSJ editorials, but with no success. I have not tried writing for business magazines. The more a person writes in one publication, the less time they have available to write in other publications.
My articles now are carried on quite a lot of non-peak oil web sites, including Business Insider, Forexpros.com, Financial Sense, and OilPrice.com. All of these organizations contacted me about carrying my posts. If you know of others who would be interested in carrying my posts, let me know.
Oh that sounds great about getting in to mainstream media...I read everything I can on energy and wants I get into the mainstream it seems to be all Daniel Yergin opinions. I know he is not the only energy expert out there. But there never seems to be a counter to him at all. Alex Chadwick of NPR is starting a new program called Burn about our energy future. I would love to hear a debate with Yergin and one of the TOD regulars. It just might take someone with your credentials to contact these networks. I think this is really important at this time especially with the steady drumbeat of we have so much oil in this country. I don't know why the sudden increase of this talk but it is being taken as truth by a lot of people.
I have been on a number of NPR radio shows, and they went reasonably well.
I feel like I am better with the written word than talking on radio or TV. I can't show a graph on the radio. I haven't sat down and learned a set of gee-whiz percentages and amounts to quote.
Robert Rapier is good on the radio, and Nate Hagens speaks well. Jim Hamilton also talks well to audiences--has a large number of figures he quotes when asked a questioned about oil prices.
Thanks for this article Gail.
I had a subscription to Time magazine and was infuriated by their March 26th edition, under the Economy secion, titled 'Crude Awakening'. Bryan Walsh implied in the article that as of 2011, the US is a net petroleum exporter!
I sent a letter to the editor of time about the article, advising them to review articles before publication to avoid mis-informing the public. I got no response, and cancelled my subscription.
To be fair, I must say that Mr. Walsh has since published a feature article in Time regarding Oil production and use that was much more even-handed, but there was no retraction regarding his previous article.
As long as mainstream media such as Time magazine is publishing such misleading information regarding the energy situation, we are all at a huge disadvanage is resolving this issue.
Thank you for the explanation. I know ethanol is a somewhat recent development so I was not all that surprised to see the growth rate in Figure 10. What I wasn't aware was the production level it reached in comparison to crude oil in the U.S.
Bio-fuel still shows to be a small player on figure 13. Over the same period domestic crude production fell more than bio-fuel supply rose. So, the large percentage growth vs. crude was due more to the loss of crude production than the rise in ethanol production.
Interesting data Gail. In Ag we are ramping up on biofuels.. We currently are in the process of planting the largest corn crop in about 80 years here in the US. If we hit trendline yields we should be able to add to stocks.. feed useage.. exports.. and yes biofuels.
Trendline corn yields would give us something on the order of a 14.1 billion bushel crop which would be about a 14% increase over last year's 12.3 number. On top of that in my area we are wall to wall wheat and dependent upon how that finishes out we should be able to also add to stocks there. Currently we convert about 5 billion bushels into corn ethanol.. but remember that about a third of this comes back to us as livestock feed. So the net net is that about a quarter of the corn crop is being dumped into the nation's gasoline tank at the 10% level.
You correctly pointed out the challenges to more biofuel useage in that we are hitting the 10% blend wall. We can use more with the installation of "blender pumps" which will mix any combination from 10% ethanol, 15%, 30% which seems to be the sweet spot.. up to even 85% which flex fuel vehicles can burn. Currently ethanol is about a dollar cheaper than RBOB gasoline.
We have the infrastructure in place to hold surplus production of grain.. Some of which I've built myself.. which is something that has been put into place over time.. locally we have a lot of room for this expected record production.
Over the past decade we brought online almost 200 biorefineries.. at one point there were another 200 on the drawing board which never got built. We have been consolidating the expansion that has occured into the system... however there are still some plants that need to be completed and brought online.
In Canada they are planting a record amount of Rapeseed which can be refined into biodiesel.. we can also increase that crop here in the US although the Diesel market is smaller than gasoline.. about 4 mbpd vs 10..
We farm about 300 million acres in the US out of about 2400 of the land mass.. There is another 300 miln acres or thereabouts coming online in South America.. so.. there is the ability to continue with this rampup in production.. although I'm sure there will be bumps along the way.
I enjoy following this site.. better hit the hay.. This is gonna be a big week here.. The planters are gonna be running hard tomorrow.. The US will plant a near record 94 miln acres.. we were 17% in last week.. the majority of that acreage will go in over the next 10 days include my farm.. I run a 16 row.. 40 foot planter that is GPS driven.. it's a lot of fun to run when things are working.. We should be done within the week.
Have a good one.
Isn't the catch that while ethanol is $1gallon less than gasoline on per gallon, it is still a little more than gasoline, when converted to energy equivalent basis? I was just looking at E85prices.com, and they were expecting a national price spread of 15% to 19% less than gasoline. Low natural gas prices are helpful in keeping the price down, but removing the 45 cent a gallon subsidy works the opposite direction.
We will have to watch and see how much ethanol actually gets bought in the US. I read a while ago that Brazil's crop was expected to be short again this year, so they likely will continue to need imports. My guess is that part of our crop will go to them.
Gail - Actually I'm starting to see more non-ethanol blend pumps in SE Texas and SW La. My wife's friend lives in the Lake Charles area and swears by the no-ethanol fuel. I've seen those reports that some cars do suffer some MPG loss from the blend. She says she get 100 more miles out of a tank of the non-blended fuel in her little 4 cyl car. I doubt it's that much but I did see a report that in some of the worse cases certain vehicles lost 10-12% MPG with ethanol blends.
If nonsubsidized ethanol can compete with gasoline so be it. Just a tad of a shame IMHO that we're trying to maintain BAU by utilizing our food growing capabilities.
Burning tomorrow's top soil and water in today's SUV? Pushing GMO crops and Monsanto's latest chemical iteration on an ever more adaptive ecosystem? It's the same thinking that got us into this mess. Full speed ahead, reality be damned...
To even have half a chance to become a net oil exporter, the US would have to pursue an all fuels, all efficiencies approach. We'd have to push hard for mpg gains, alternative materials to petroleum supplied goods, increased building efficiency, some nat gas based transport, ramping up chemically equivalent biofuels, increased electric vehicle production, responsible production of the tight oil, still reduce vehicle miles a bit, increased wind and solar energy to free up nat gas for transport and materials, and probably some other options as well.
I think Gail's right about tight oil not being able to do the job all by itself. It's definitely significant, but you've got declines elsewhere to fight and you'd need about 9-10 mbpd of the stuff to do the trick. 6 mpbd is probably very optimistic. Realistic best case is probably between 2.5 and 5 mbpd once you max out all the plays. The resources in ground seem to be very large. So the recovery rate will mean quite a lot. Right now, USGS looks like it's estimating 1-2 percent. Some in the industry say they can do 5 or more. And then there's that crazy decline rate to take into account.
I guess if we were very lucky, and we worked really hard at an all of the above approach (when all of the above includes major increases in efficiency and non-fossil fuel sources) we might have a shot at it. Low likelihood, though, and highly, highly unlikely with oil alone. Even now, the all liquids figure contains 4.6 million barrels per day that's not extracted crude. That's roughly 60/40. When you include refinery gain as oil (some of it from imports) you're talking about 80/20 crude/non-crude. Probably closer to 85/15 from a btu standpoint.
Lots of figures and crazy optimism flying around in the media and in industry. Looks like a gold rush mentality. But the articles claiming or implying that we're a net oil exporter now are just irresponsible misinformation.