| Norwegian Crude Oil Reserves and Production as of 12/31/2011 | The Oil Drum | Updating World Deepwater Oil & Gas Discovery |
New IMF Working Paper Models Impact of Oil Limits on the Economy
Posted by Gail the Actuary on May 11, 2012 - 5:19am
The International Monetary Fund (IMF) recently issued a new working paper called “The Future of Oil: Geology versus Technology” (free PDF), which should be of interest to people who are following “peak oil” issues. This is a research paper that is being published to elicit comments and debate; it does not necessarily represent IMF views or policy.
The paper considers two different approaches for modeling future oil supply:
- The economic/technological approach, used by the US Energy Information Administration (EIA) and others, and
- The geological view, used in peak oil forecasts, such as forecasts made by Colin Campbell and forecasts made using Hubbert Linearization.
The analysis in the IMF Working Paper shows that neither approach has worked perfectly, but in recent years, forecasts of oil supply using the geological view have tended to be closer than those using the economic/technological approach. Since neither model works perfectly, the new paper takes a middle ground: it sets up a model of oil supply where the amount of oil produced is influenced by a combination of (1) geological depletion and (2) price levels.
This blended model fits recent production amounts and recent price trends far better than traditional models. The forecasts it gives are concerning though. The new model indicates that (1) oil supply in the future will not rise nearly as rapidly as in the pre-2005 period and (2) oil prices are likely to nearly double in “real” (inflation-adjusted) terms by 2020. The world economy will be in uncharted territory if this happens.
It seems to me that this new model is a real step forward in looking at oil supply and the economy. The model, as it is today, points out a definite problem area (namely, the likelihood of oil high prices, if growth in oil production continues to be constrained below pre-2005 rates of increase). The researchers also raise good questions for further analysis.
At the same time, I am doubtful that the world GDP forecast of the new model is really right–it seems too high. The questions the authors raise point in this direction as well. Below the fold, I discuss the model, its indications, and some shortcomings I see.
The Two Models
Economic /Technological Approach. With the economic/ technological approach, the assumption is made that high oil prices will encourage substitution and/or new oil production. Because of this, high oil prices are not expected to persist. Instead, the most important consideration in determining future oil supply is the level of future demand. The level of future demand, in turn, is primarily driven by anticipated GDP growth, since world GDP growth and world oil production growth tend to be highly correlated.
In effect, models of this type assume that whatever oil supply is needed will be available; they don’t consider the possibility that geological considerations may limit oil supply over the long term. As an example of how well these models have worked for prediction, the paper shows a graph of historical EIA forecasts (Figure 1, below).
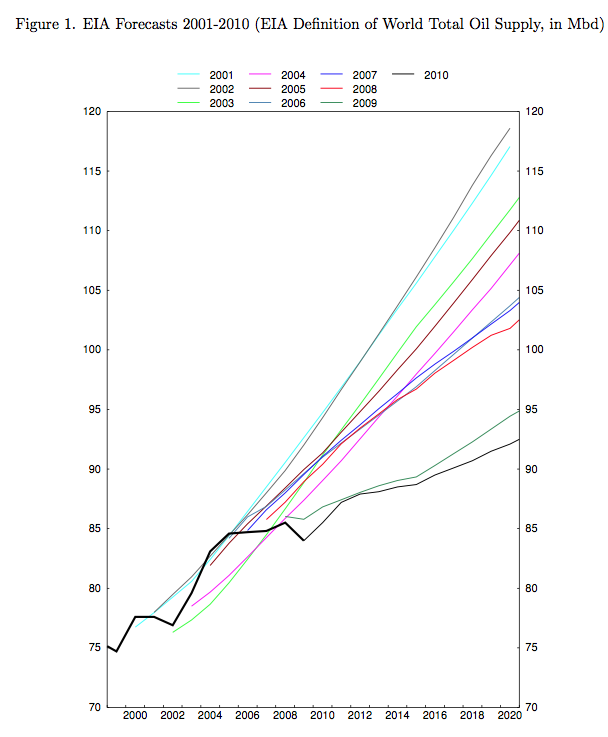
Each year, EIA’s forecasts have been adjusted downward, because actual oil supply growth was lower than forecast.
Models Based on the Geological View. The paper considers forecasts of oil supply such as those of Colin Campbell (shown in ASPO-Ireland Newsletters) and forecasts based on Hubbert Linearization to be models based on the Geological View. The paper observes that forecasts of oil supply based on geological view have tended to be too low, but not by as big a margin as those made using the economic/technological approach. As an example, it gives the following graph of changes in forecasts by Colin Campbell.
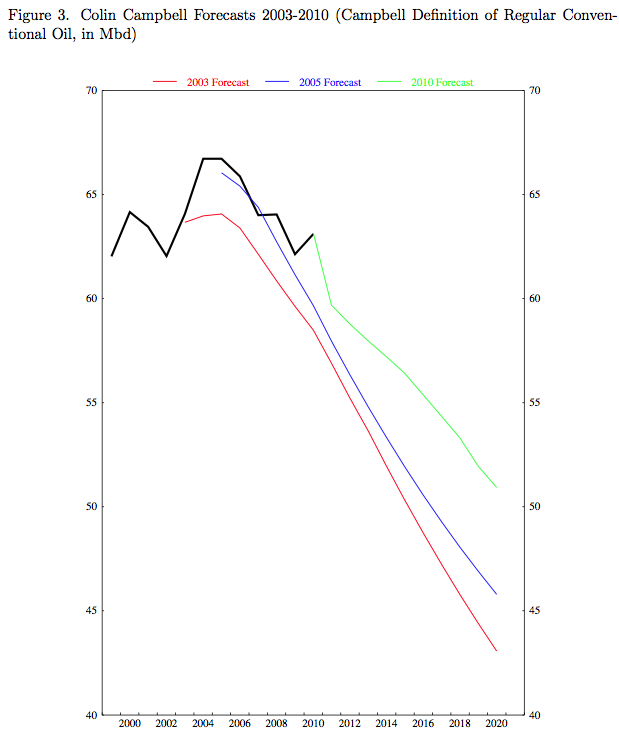
A review of the two methods by the IMF group indicates that neither works precisely as hoped, but each has some validity. While oil production did not rise as fast as the economic/technological view would predict, higher oil prices have allowed oil production to stay on more or less a plateau after 2005, rather than declining as predicted by geological methods. The new model in the IMF Working Paper combines indications from both points of view, using an approach that allows them to estimate the relative contribution of geological impacts vs higher prices.
How the Two Methods are Combined
The oil supply equation in the new model is set up so that there are two different ways that the forecast oil supply can change. There is a downward tug from oil depletion at the same time that there is an upward tug from oil prices. It is expected that in the short run, high prices will get producers to utilize spare capacity, and over a longer period (estimated at 4 to 6 years), it will get producers to add new capacity. I will not try to explain all the variables and coefficients, but the blended supply equation is

In the above equation, qt is the quantity of oil produced in year t and Qt is the cumulative quantity produced in year t, so the ratio qt / Qt produces the familiar downward-sloping line one sees in charts used for Hubbert Linearization. The first two terms to the right of the equal sign are the ones based on the geological approach to depletion. The later terms depend on pt, which is price of oil at the time “t”. Adding the pt terms tends to raise the line at later periods so it does not slope downward as quickly as if depletion were the only factor affecting the relationship.
Growth Rate of GDP
In the model, high oil prices have some impact on GDP, but as we will see in Figure 5, below, not very much. There are two places in modeling GDP where high oil prices come into play. The first is in the Potential Growth Rate of GDP. According to the paper,
The growth rate of potential world GDP is specified as fluctuating around an exogenous long-run trend, with oil price changes making the fluctuations more severe. Oil prices are allowed to have persistent but not permanent effects on the growth rate of GDP. . . The estimated steady state world potential growth rate of potential GDP equals four percent. The average annual growth rate of real oil prices, which is the growth in oil prices at which the model assumes zero effect of oil prices on output growth, is seven percent. The results indicate that an oil price growth that is higher than that historical average has a small but significant negative effect on the growth rate of potential. [emphasis added]
Interesting–the model assumes real oil price growth of 7% per year has no impact growth rate of GDP. Perhaps this is supposed to be picked up by the second place where high oil prices come into forecasting GDP, called Output Gap. This is an excerpt from what the paper says about Output Gap:
Apart from allowing for an effect of higher oil prices on the growth rate of potential output, the model also allows for the possibility that higher oil prices can cause fluctuations in the amount of excess demand in the economy. . . . Similar to the equation for potential, the coefficient estimates show that high oil prices have a small but significant negative effect on excess demand, and that this effect is highly persistent.
Model Output
When all is said and done, what does the IMF model forecast?
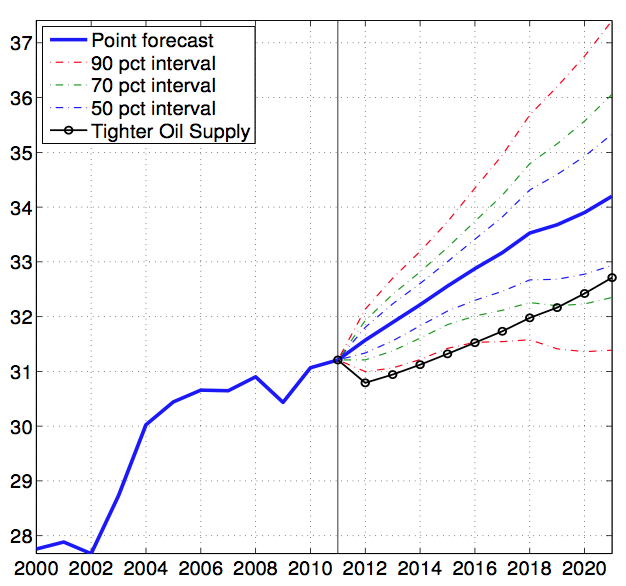
The forecast for future world oil supply, shown in Figure 4 above, is similar to EIA’s most recent forecast of world oil supply (but lower than earlier EIA estimates). Oil supply is expected to rise a 0.9% per year. An alternate tighter oil supply forecast is given as well.
The forecast for world GDP growth (shown in Figure 5 below) is not too much different from standard estimates, either. The point forecast is about four percent per year.
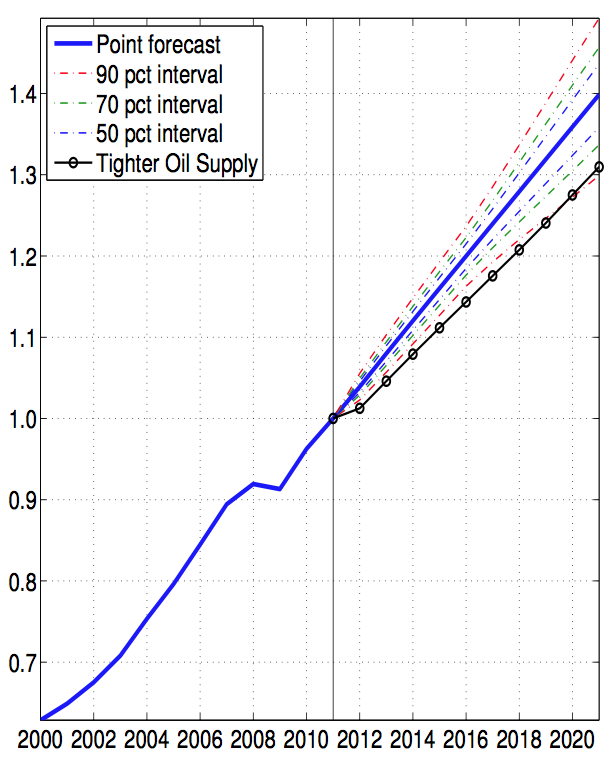
The thing that is different in this analysis is oil prices (in inflation adjusted dollars). Forecast oil prices are expected to be much higher that what the EIA is estimating.

The report points out that these high oil prices are a real concern. The report says:
The predicted average annual growth rates of oil output are well below the historical forecasts of EIA, but above the forecasts of proponents of the geological view. . . . However, this projected positive trend in oil production comes at a steep cost, because the model finds that it requires a large increase in the real price of oil, which would have to nearly double over the coming decade to maintain an output expansion that is modest in historical terms. Such prices would far exceed even the highest prices seen in 2008, which according to Hamilton (2009) may have played an important roll in driving the world economy into a deep recession.
Need for Enhancements /Areas of Concern Pointed Out by Authors of Paper
The authors raise of the IMF Working Paper raise the following issues:
1. Impact of high oil prices on GDP growth. The expected impact of a continued rise in oil prices on forecast GDP is small, according to the model as constructed. Perhaps the relationship should be non-linear (convex) instead of linear. More generally, what is the importance of the availability of oil inputs for continued overall GDP growth? The report mentions studies showing the close connection between energy growth and GDP growth, such as by Ayers and Warr.
2. Substitutability for oil. What is the substitutability between oil and other factors of production? Is it reasonable to assume that elasticities of substitution will become greater over time? Or is there a possibility that there are limits to the extent of substitutability of machines and labor for energy?
3. Is there a pain barrier? At some point, does the effect of high oil prices on the economy change, and become much worse?
4. Independence of Technology from Fossil Fuel Availability. Perhaps a reduction in fossil fuel availability will negatively affect the availability of future technology improvements since, for example, it takes fossil fuels to make new more efficient cars. This has not been reflected in the model.
5. Smaller Amounts of “Spare” Oil Capacity Available in the Future. The model reflects amounts of OPEC spare oil production capacity available in the past. In the future, less spare production capacity seems likely.
My Comments on the Paper
The IMF is to be commended on putting together this analysis. To me, the big step forward is that questions about the impact of geological depletion of oil on the economy are starting to be addressed. The fact that the paper also points out the level to which oil prices will need to rise, if oil production is to rise at 0.9% a year between now and 2020, is important as well.
Some of the issues I see that aren’t addressed in the paper:
1. Factors underlying world long term growth rate, other than energy. It would seem to me that there are a number of factors which have permitted long term world economic growth, over and above the economic growth enabled by fossil fuels. Some of the following seem to be diminishing in importance, so perhaps the forecast of a 4% world GDP growth rate going forward is too high, apart from oil supply issues:
a. Trend Toward Globalization. The trend toward globalization has allowed greater synergies to occur, and thus has contributed to world GDP growth. The trend toward globalization started over 4,000 years ago, with trade from northwest India to the Mediterranean region (Chew). In recent years, we seem to be approaching a maximum level of world globalization. In fact, higher price of oil has been raised as an issue cutting back on trade of bulky, low valued items (Rubin). Higher cost of oil may also have an adverse impact of commercial airline flights for international companies to oversee their distant operations, because the costs of these flights is now supported by a large number of international tourists, and this international tourist trade may dry up. Thus, the trend toward globalization that has been supporting world GDP growth in the past may not persist, and may even reverse.
b. Growth in Education. Part of what has supported world GDP growth is likely growth in education, since literate workers are better able to use technology. There is evidence that the advanced economies are now plateauing in terms of educational level of new workers, relative to the existing work force. Even less advanced economies, such as China, are showing much higher levels of literacy. (See this post). To the extent that educational levels are reaching a plateau, the “boost” to historical GDP rates that came from this factor can be expected to be lessened.
c. Growth in Debt. GDP growth is enabled by debt growth. Consumers are able to purchase more goods and services, with increased levels of debt; businesses are able to increase their investment in new plants and equipment through more debt; and governments are able to undertake the development of new construction, roads, and other development, through the addition of more debt. But we seem to be reaching limits on debt growth. Theory also suggests that higher levels of debt are enabled by higher economic growth rates (Tverberg). Governments have been aware that increased borrowing can be used to pump up economic growth, but limits are being reached on the amount of debt that can be added. To the extent that debt fails to grow as quickly in the future as it has in the past, this can be expected to have an adverse impact on world GDP growth rates.
d. Quantitative Easing and Extraordinarily Low Interest Rates. An argument can be made that GDP growth of advanced economies in recent years has been held up by quantitative easing and extraordinarily low interest rates. These would seem to be a temporary fixes that cannot be continued long-term. If this is the case, world GDP rates can be expected to be lower in the future, regardless of oil supply growth.
2. Limits on Substitutability of Other Fossil Fuels for Oil. The paper does not address the issue of whether there are limits of substitutability of other fossil fuels for oil. Stationary (as opposed to transportation) uses of oil have been substituting away from oil for years. There are millions of vehicles and other machines that use oil currently in operation. There will be a high cost in replacing these before the end of their normal lifetimes. Also, significant fossil fuels will be required for making vehicles and supporting infrastructure that use another fossil fuel source.
3. Limits on Capital Available for New Investment in Substitutes for Oil, and in New Oil Production. In recent years, we have made heavy use of debt financing for new investment. Government subsidies have also been used. To the extent that debt financing and government subsidies are less available, less investment can be expected in the future.
4. Impact of High Oil Prices on Diverse Parts of the Economy, Not Reflected in the Model. For example, prices of homes may be affected by high oil prices. People with less discretionary income are less likely to “trade up” to a more expensive homes, so high oil prices seem to be one of the reasons for the decline in home prices (Tverberg). Lower home prices affect ability of homeowners to borrow against the value of their homes for new purchases, so affect GDP, apart from oil price’s direct impact on the number of new homes built.
5. Which comes first: Oil Growth or Economic Growth? The assumption in the model is that GDP growth drives oil growth. While this is true, it is to some extent a “chicken” and “egg” situation. Perhaps the availability of inexpensive oil and other fossil fuels is one of the main drivers of economic growth (in addition to the other drivers I mention in the subparts of Item 1 above). Perhaps the cycle is started by the availability of cheap fossil fuels for industrial use and continued by the increased demand to which this growth gives rise.
* * *
I appreciate the work that has been done by the IMF in putting together this model and look forward to seeing further enhancements to the model. The work that has been done and the questions that are being raised are important ones.
I expect that commenters to this post will be able to point out other plusses and minuses of the model. The report itself is very interesting. Again, it can be found at The Future of Oil: Geology versus Technology.
This article originally appeared on Our Finite World.
Contact
- Content: editors at theoildrum dot com
- Tech support: support at theoildrum dot com
License

This work is licensed under a Creative Commons Attribution-Share Alike 3.0 United States License.
Interesting article. If august organizations such as the IMF highlights oil's price and availability impact on 'growth' then it should raise the subject's profile in other mainstream media, which has to be progress of sorts.
With regard to the EIA's ever decreasing forecasts it would be interesting to see them plotted as some kind of 'error' chart - for example deviance from the 'latest year's 2020 production predictions' (or maybe a 'moving' window, say 20 years out, if such data is available). We would also have to represent the over-pessimistic peak oil decline forecasts to show due impartiality of course!
This is a research paper of the IMF, and doesn't represent the position of the IMF as a whole. Perhaps it will get the rest of the IMF thinking as well.
"doesn't represent the position of the IMF as a whole."
True, Gail
But I see nothing in this paper which contradicts the observations made in last year's World Economic Outlook, Chapter 3 of which contained some rather pointed observations re. "oil scarcity:"
http://www.energybulletin.net/stories/2011-04-14/review-imf-analysis-oil...
The new WEO is not as focused (re. oil supply) as last year's, but the importance/role of oil is addressed in several sections and from various perspectives. I have gone through the new WEO (though not as carefully as I'd like) and I'd like to offer the following observations:
- IMF lists among its key assumptions that "the average price of oil will be $114.71 a barrel in 2012 and $110.00 a barrel in 2013 and will remain unchanged in real terms over the medium term" (p. ix).
I did not see an explanation for the predicted $5 drop next year other than that this prediction is "in line with prices in futures markets" (p. 9). Elsewhere it says, "Risks through 2013 remain to the upside for oil prices" (p. 14).
- "geopolitical uncertainty could trigger a sharp increase in oil prices: an increase in these prices by about 50 percent would lower global output by 1¼ percent. The effects on output could be much larger if the tensions were accompanied by significant financial volatility and losses in confidence" (p. xvi).
I have a hard time believing that a 50% spike in oil prices would reduce global GDP by only 1.25%. Their second point is more plausible: a 50% price spike would surely result in volatility and shaken confidence.
- The possibility of unsettled financial markets is stated more clearly later: "The short-term impact could be significantly larger if the adverse oil shock damages confidence or spills over to financial markets, effects that are not included in this scenario" (p. 16).
- The potential for interactions to set off multiple negative feedbacks is mentioned here:
"In the current environment of limited policy room, there is also the possibility that several adverse shocks could interact to produce a major slump reminiscent of the 1930s. For instance, intensified concern about an oil supply shock related to the Islamic Republic of Iran could cause a spike in oil prices that depresses output in the euro area, amplifying adverse feedback loops between the household, sovereign, and banking sectors. In the meantime, the oil price shock could also trigger a reassessment of the sustainability of credit booms and potential growth in emerging Asia, leading to hard landings in these economies. This could, in turn, prompt a collapse in non-oil commodity prices that would hurt many emerging and developing economies, especially in Latin America and Africa. More generally, a concurrent rise in global risk aversion could lead
to a sudden reversal of capital flows to emerging and developing economies" (p. 18).
Here's the link to the April 2012 WEO ("Growth Resuming, Dangers Remain"):
http://www.imf.org/external/pubs/ft/weo/2012/01/pdf/text.pdf
You and others will be much more familiar with the IMF than I am, but my sense is that its analysts are much more willing (during the past 14 months) to acknowledge the validity of PO concerns, which is encouraging.
Thanks for your additional observations. There is a lot in the report--hard to cover everything.
I know that there was some overlap in the people who worked on Chapter 3 last year vs the new IMF report. The issue was definitely raised last year in Chapter 3 as well. It is good to see the issue getting some "traction".
I just read with interest that Iraqi officials and Shell have agreed to reduce the planned target output from the super-giant Majnoon field from 1.8 million/bbl/day to 1 million (must be nice to have such large fields eh?). Again, a quick calculation shows that as about 0.3 billion barrels per year.
If this has not been factored into the chart then you can take a third of a gigabarrel away from the thick blue line in figure 4 above. The upside is that the plateau will last a bit longer.
This news item also suggests other oil majors will seek to reduce their earlier optimistic production targets for Iraqi developments. Those earlier contracts were agreed upon boosting Iraqi production to 12 million barrels per day by 2017. Those targets are now alleged to be nearer 8 million per day, with some analysts predicting 6 million barrels per day being more realistic.
Again, I wonder if these revisions factor in the EIA estimates anywhere? Some must do already. If not take another 2.2 giggabarrels off the 2017 production...!
http://uk.reuters.com/article/2012/05/08/uk-iraq-shell-idUKBRE8470H22012...
Bargaining phase.
Methinks that the IMF analysts are gradually trying to break the news to their audience that we live in a finite world, with finite natural resources.
Above is a model for world output using Webhubbletelescope’s oil shock model and dispersive discovery.
Actual discoveries from 1900 to 2009 were used for the discovery curve with a dispersive discovery model used to fill in discoveries before 1900 and after 2009 where the actual data is unknown (this is essentially a statistical guess using a maximum entropy estimator.)
URR for the four scenarios is 2795 GB for crude + condensate, a Hubbert Curve with a URR of 2560 Gb is also presented, based on a Hubbert linearization from 1993 to 2011 using EIA annual C+C data.
For future years beyond 2011 four scenarios were created low, medium, high and plateau. The difference lies in different rates of extraction from mature reserves. Below is the extraction rate profile for the four scenarios.
The profile is the same for every scenario from 1858 to 2011 and then varies from there until 2150, after 2150 the extraction rate is the same in all scenarios.
The low scenario matches the hubbert curve rather closely from 2011 to 2035.
The most likely scenarios are the plateau, medium, and low scenarios.
The high scenario attempts to ramp extraction rates to 1973 levels over a 30 year time frame, this seems quite unrealistic when considering that Saudi Arabia and other middle east OPEC members were aggressively ramping up production at the many of largest oil fields discovered to date. I doubt that such world wide extraction rates will be seen in the future, but included it to illustrate that even if it were accomplished the peak would only move by a few years (to 2021 from 2019 in the medium scenario).
Even the medium scenario is somewhat unrealistic as it ramps to 1990 extraction rates over just a 5 year period, the reality may fall between the plateau and medium scenarios.
The future is quite hard to predict, this model does not benefit from the inclusion of price forecasts that the excellent model presented by Gail does.
If there were an easy way to incorporate price forecasts it would be through the extraction rate in this model. Higher prices would push extraction rates up, though I think the 1973 rate could be seen as an upper bound.
I chose 2800 Gb as an optimistic URR for crude plus condensate.
Fallow=6 years,build=8 years, mature= 10 years in the general shock model.
DC
Thanks for a sanity check.
URR
The 2800 trillion URR is a number that is definitely high-ball for crude and it gives lots of reserve growth potential in the tail of the production curve.
Another high-ball estimate is 3500 trillion which Shell Oil has given as a BOE (barrel of oil equivalent) estimate. If one were to use that number, it would definitely have to apply to the all-liquids curve.
Extraction Rate
The effective extraction rate spiked into the 1970's as the world was increasing production at the rate of 5% per year and reached a peak at the time of the Arab oil embargo. The west was paying such a low cost for oil that it was flowing like water, and the middle east had no choice but to try to throttle the flow. In the ensuing years, consumers basically learned how to practice conservation and essentially cut the demand way down, and the late 1970's/early 1980's world-wide recession created demand destruction as well.
The question is whether we have sufficient capability to increase the extraction rate like we have in the past. As DC shows, to even maintain a production plateau for a 2800 URR number will require a significant increase in the average extraction rate. The oil is getting tougher to extract, and in many places the flow is rate-limited as it is (i.e. stripper wells) or it is high flow-rate over necessarily short time-spans (i.e. high operational cost deep-water).
--
So the technical detail in the modeling amounts to an accurate accounting of grades of oil and trying to project the effective extraction rate. Is the 2800 URR value realistic or should we use that as an all-liquids cumulative? I haven't a good answer for this apart from doing a dual plot, one oil shock model plot consisting of a lower URR for "crude-only" and a higher URR plot for "all-liquids".
WHT,
Thanks for the comments. I tried the higher 2800 Gb URR to present the optimistic case for C+C, also I know you do not think highly of the HL method, but it points to around 2500 Gb based on annual data from 1993 to 2011 for C+C (using EIA data). It seems that the HL often underestimates the URR due to the thinner tail in future years so I wanted to choose something higher than 2500 Gb. In your suggestion at the end were you thinking maybe 2600 Gb for C+C and 3500 GB for all liquids and would you try to remove the biofuels from the all liquids (because this has nothing to do with petroleum extraction.)?
DC
Beautifuly put...
There are millions of vehicles and other machines that use oil currently in operation. There will be a high cost in replacing these before the end of their normal lifetimes. Also, significant fossil fuels will be required for making vehicles and supporting infrastructure that use another fossil fuel source.
Do we really have to replace most vehicles faster than they are presently being replaced ?. If not then no additional FF would be required and todays infrastructure would be adequate to support ICE vehicles replaced by electric or PHEV's.
Well that would depend on when the world stops building ICE vehicles and starts building an all electric fleet. Right now that point is not in sight. There is not even a plan to replace heavy load trucks or off road work vehicles such as tractors or construction equipment. They are all ICE with no replacement in sight.
Only when it becomes very obvious that crude oil is in very serious decline will there be any Manhattan type projects to replace all ICE vehicles. By then it will be way too late to avoid any draconian hit on world economies.
Ron P.
Darwinian,
converting all ICE vehicle production to EV and PHEV is not on the scale of a Manhattan project. For the US this would enable about 50% of VMT to be electric in 7-8 years. We would expect very high oil prices to favor high mpg ICE vehicle use over low mpg vehicles so additional savings would occur during the transition until most ICE vehicles are replaced. The is no immediate need to replace ALL ICE vehicles just drastically reduce oil consumption by having most VMT under electric power.
By then it will be way too late to avoid any draconian hit on world economies.
That really depends upon how quickly oil price increases occur. Would $10-20/gallon gasoline cause a draconian hit to the world economy??
Are you kidding? First gasoline prices are not linear around the world. But if crude oil prices increased enough to cause a tripling of US gasoline prices the effect would be draconian. And such an increase in crude prices would hit European nations just as hard and some much harder. And since many European nations are already on the brink of collapse, this would no doubt push them over the edge.
Yes, crude prices rising enough to triple US gasoline prices would most definitely have a draconian effect on the economies of most world nations. With the exception of oil exporting countries of course.
Ron P.
But if crude oil prices increased enough to cause a tripling of US gasoline prices the effect would be draconian.
Are you implying that in time it would not be possible for the US economy to adapt to say a price( in 2012 $$) of $12/gallon.?
The adaptations I would expect would be a rapid shift(over a 10 year period) from low mpg cars and light trucks to high mpg ICE and HEV's and as manufacturing capacity is expanded to EV and PHEV's. While this is happening other adaptions possible are more car pooling for work commuting a slight increase in mass transit use, perhaps less driving and flying vacations( but staying longer), less frequent shopping visits( but buying more per visit). Longer term structural changes would be more local corner stores less shopping malls, local schooling enabling children to walk to school rather than being driven.More rail and less truck long distance transport. Conversion of diesel/gasoline long distance trucks to CNG.
What I wouldnt expect is;(1) mass relocation from suburbs to inner city (why not just buy a new or used high mpg vehicle) (2)collapse of world trade( ocean transport can just go a little slower) (3) collapse of vehicle sales( demand for high mpg and EV will remain strong, mass transit would not be able to handle all car commuters)
If these changes result in about a 2/3 reduction in oil imports then the US balance of trade would be about the same at $300/boe as it is now at $100-120.
For starters I was talking about the world economy. The USA is not the world. And if the world economy collapses the USA is very likely to collapse right along with it.
Car pooling? The problem would the gradual collapse of buying power because of high oil prices. High oil prices would drive up the price of everything else right along with gasoline prices. People would have a lot less to spend which would be a huge drag on the economy. Millions of people would be laid off. They would have no jobs to car pool to.
A mass relocation to the city would mean trillions of loans to homeowners would be defaulted on. Banks would collapse and that alone could sink the economy. And the collapse of vehicle sales you speak of would collapse millions of jobs... more unemployment.
It never ceases to amaze me how so many people can come up with such magic bullets to fix everything then completely ignore the fact of massive unemployment that these massive changes would bring about.
It would be a vicious circle. More people laid off means these people buy a lot less. And when these unemployed people buy a lot less, more people are laid off. And the vicious circle continues.
Very cheap energy has been responsible for the massive increase in industrial production, cheap driving, cheap vacations and cheap everything else. Very high energy costs will cause everything to collapse like a house of cards.
Ron P.
"The USA is not the world. And if the world economy collapses the USA is very likely to collapse right along with it."
You're talking here about a world economic collapse as a direct consequence of high oil prices, right?
But today and for as long as it doesn't reduce oil consumption below its current ~25% of world production, the USA is the world's "swing consumer", just as the USA once was and Saudi Arabia is (or was until very recently) the world's "swing producer". Voluntarily or involuntarily, it is millions of barrels of American demand that is "destroyed" each time the oil price spikes.
So the pertinent questions are not, "will the world economy collapse, and if so, will it take the USA with it?", but
"Will the USA economy collapse, and if so, will the world be able to carry on without it?"
I would not be surprised to find the answers are yes and yes.
At least for the North American economy there seems to be a fairly hard limit to how much of the household budget can be devoted to energy consumption. That limit seems to be between 4 and 5%. The oil price spike in 2008 drove energy costs above 5% which contributed to a large swing in consumption patterns -- especially for light vehicles and real estate in low density areas.
The forecast period that is used in this article seems to end in 2020. I note that 2020 is only 8 years from now. Most of the technology that will be used to deal with a doubling or tripling of oil prices is in place now. Gail's point that the use of expanded credit to help ease the transition to higher oil prices is temporary is very valid. Many European economies have already hit debt to GDP levels above 120%. The US isn't far behind. I expect that contracting debt levels will combine with higher oil prices to cause a painful adjustment period. The adjustment period might not start tomorrow or even this year, but 2020 is not really that far away.
I am not sure what would constitute a collapse. Five years ago would we have said that persistent 10% unemployment levels and a growing number of jurisdictions becoming essentially ungovernable due to slow economic growth and high debt levels constituted a collapse?
At least five European countries are in danger of collapse right now and they are likely to collapse long before the USA does. Then the rest of Europe, then the USA, Canada and many Asian nations will fall like a row of dominoes.
But the real problem will be, in Europe, In America, and in Asia will be unemployment. Debt default will be rampant. With no money to borrow massive unemployment will be the obvious result. And this all started when oil prices shot up due to peak oil.
But unemployment is a subject you don't seem to want to address. On well.
Ron P.
With:
1. The Bush tax cuts
2. Oil imports
3. Trade deficit with China
4. military budget
it's hard to see how the US economy won't go down.
Trade figures with China:
http://www.census.gov/foreign-trade/balance/c5700.html
2. Oil imports
Have fallen from 60% to the 40's.
4. military budget
Yes too large, but its growth is trivial compared to entitlement growth (Medicare, Medicaid, etc).
The USA isn't broke because of growth rates, it is broke because of the raw total expenditures.
I could have mentioned the other wealthy countries that are also on the brink of financial disaster, yes.
But they're tiny in comparison with the USA and the portion of their GDP spent on oil is significantly smaller. Their financial woes are less directly a result of high oil prices (not that high oil prices don't contribute).
There are also of course people who will suffer greatly from high oil prices even in the world's poorest countries.
But by and large the "demand destruction" is principally an American gift to the rest of the world. America responds to the tight supply by going into a mild recession and thereby keeps the price rise steady.
I'm not sure why it matters to you that I didn't address unemployment. There are tools for addressing it (such as local currencies) but they're rarely deployed in earnest without a severe collapse in governmental fiat currencies.
We are now over three years into an expansion phase in the economy. The last bottom occurred in April 2009. The longest expansion phase since WWII was 59 months. A lot of the good opportunities for gaining efficiencies and growing the advanced economies have been implemented.
The recovery has been kind of anemic because a number of major economies are working off debts that, in retrospect, should never have been incurred. These debts include mortgage debts in the US, UK, Spain, and Ireland. Government debts had clobbered most of Southern Europe. This unwise borrowing has sapped the strength of the recovery.
High gas prices haven't made a lot of the distressed real estate particularly attractive. Gas prices nearly destroyed the US auto industry (and indirectly real estate values in auto producing states). Gas prices caused much development in Florida and much of the Southwest to be much less valuable.
It looks like real estate prices are starting to stabilize, but are not showing any signs of returning to previous high levels. I am not sure if Europe is making any progress or not in dealing with their stalled economies.
However, no apocalyptic reasons for a new recession within the next 2 years or so are necessary -- reduced profits and austerity induced by high government debt levels should do the trick nicely. Any adjustment required by persistently high (and increasing oil prices) will just make things worse.
The "expansion" in the US since 2008 is a statistical trick from constantly understating inflation via manipulation of the CPI calculator. This turns economic contraction or stasis into growth.
Yes those debts should have never occurred, because we shouldn't have a debt-based monetary system! Those debts were incurred due to zero % interest rates imposed by central banks to attempt to kick start the economy, which predictably failed since the world is nearly out of resources and cannot grow its way out of its debt problems anymore. There will be no economic recovery.
When Europe collapses in the next year or so it will likely trigger the derivatives ponzi scheme and then the US, Canada, and the rest of the world's financial system will collapse, likely into hyperinflation or something similar, as it is a gigantic ponzi scheme.
Yes several EU countries are in danger of default (not 'collapse'), though the end of the common currency is more likely. Why is that, to your mind? Whatever your answer, it needs to explain these countries all over the world where unemployment is high and the economies are strong, who pay the same price for oil +/- as everyone else.
http://www.google.com/publicdata/explore?ds=d5bncppjof8f9_&ctype=l&strai...
Most of those countries in that chart differ from the EU countries under threat: government spending under control, low trade barriers, easy to start a business, taxes not exorbitant relative to other countries, regulation not exorbitant.
More recent IMF figures:
http://www.google.com/publicdata/explore?ds=k3s92bru78li6_&ctype=l&strai...
The timing of replacements looks to be decades away, if ever.
One issue is the higher front-end cost of new electric or PHEV vehicles. Either people/businesses/government need to have more savings, or they need to go further into debt.
This is parallel to what is happening in the oil and gas production area. There are more and more front-end costs, so there is more need for accumulated savings or more debt.
The economy cannot handle a continued shift in this direction, IMO. This is a limiting factor on how quickly a change can be made, and indeed, whether it can be made at all. See my post, Can we invest our way out of an energy shortfall?
I wonder how fast prices for EV's will drop as they become mass produced. The only real cost increasing factor is the batteries, as everything else in the car is significantly less complex than an ICE and therefore should be cheaper. The Tesla Roadster's motor windings were hand wound.
$35K for a Prius or a Chevy Volt. $20K for a Ford Focus which has greater range and is in many ways a more capable vehicle. The reduced fuel costs, spread over a period of years, have to cover the higher purchase price and the total cost of transportation has to leave room in the household budget for other things like food, clothing, shelter, education, health care etc.
I, too, wonder how fast prices for EV's will drop and when the drop in prices will begin. If there is no price drop, it is likely we will switch to bicycles (in the rain) before the price drop occurs.
Gail's comment is apropo!
The Prius and Volt will always be more expensive all else being equal because they are by definition extra complex -- they are hybrids. Not only do they have an ICE but they also have batteries and an electric motor, plus all the mechanism to switch between the two. A pure BEV need not be anywhere near this complex (you can buy a remote control one for $20) and could conceivably drop below an equivalent ICE powered mobile when mass production of batteries ramps up.
Considering that EV's have been on the market for 1 year so far I think there's some room for relative price drops!
I am looking forward to the relative price drops, lower maintenance costs, and increased usable ranges for pure electric vehicles. The old pickup truck is getting a bit long in the tooth.
I'll believe it when I see it.
Gail, and all others participating in/monitoring this discussion:
Would you please cross-check these figures and sanity-check my thought processes (see below)?:
According to this source, some 12.8M light vehicles were purchased in the U.S. in 2011:
http://online.wsj.com/article/SB1000142405297020351360457714044085258108...
According to this source,The mean price paid for light vehicles in the U.S. as of May 2012 was ~$30,000.
http://blogs.ajc.com/business-beat/2012/05/07/average-price-of-new-vehic...
I will offer just two plausible examples, plausible meaning examples of vehicles which have been sold in the U.S. for at least several years (granted in various model year incarnations), and which are vehicles which could easily meet the base transportation 'needs' (as opposed to the 'Like a Rock' and 'Built Ford Tough' wants)of most consumers.
Honda Insight: Base MSRP, no extra geegaws, $19,290 USD, 41 MPG City/44 MPG Highway.
http://automobiles.honda.com/tools/build-price/summary.aspx?ModelName=In...
Hyundai Elantra, MSRP, with added automatic transmission, no other geegaws, $18,470, 29 MPG City/40 MPG Highway.
http://www.hyundaiusa.com/build-your-hyundai/?vehicle=elantra&year=2013
Here, Motor trend has an informative article about a goodly selection of real cars which are in its '40 MPG Club) That;s Highway, of course, but the City Cycle mileage is always above the mean of the spectrum of vehicles currently being purchased by U.S. Americans.
http://www.motortrend.com/features/mt_hot_list/1103_the_40_mpg_car_club/...
My premise is this: The purchase price of many new light vehicles which significantly exceed the mean MPG of the spectrum of all new light vehicles currently being purchased in the U.S. seems to be significantly lower than the mean purchase price of new vehicles in the U.S.
This leads me to provisionally conclude that the purchase price of more efficient vehicles is not the reason more such vehicles are not purchased...the reasons are otherwise.
I also would opine that, from an objective reality standard, the reasons are not that such more fuel-efficient vehicles are incapable of meeting the basic transportation needs of most people (Note: I get the fact that some minority of vehicle owners are farmers, ranchers, contractor/construction workers, and/or live at the end of a 20-mile dirt track on top of a mountain somewhere, and I estimate that these cases probably represent less than20% of the U.S. light vehicle purchasers.)
Ergo, I judge the reason that more highly-fuel efficient vehicles are not purchases is due to style choice, not purchase price or fundamental utility.
I also would opine that the facilitating factor to this is that the price of fuel is sufficiently low to allow style preferences to dominate purchase choices.
Gail (and everyone else), if you have data and reasoning which prove that purchase price is the factor preventing more of the the some 12M light vehicle purchases in the U.S, from being of the high-MPG variety, I would be interested in reading it...because I just don't see purchase price as the inhibiting factor...we need to not focus on outliers such as the Chevy Volt and Nissan Leaf, but, IMO, we should look at the broader spectrum of real-world vehicles being offered for sale.
I found this Transportation Energy Data Book for the U.S., produced by some folks at Oak Ridge, TN for the US Government...it seems to be current I think (at least within a year or two):
http://cta.ornl.gov/data/tedb30/Edition30_Full_Doc.pdf
Perhaps there is useful info in there to do conduct an analysis on the matter.
[Edit] I realize the OP for this sub-thread spoke about the purchase price of PHEVs and EVs being prohibitive...but I think that approach to the idea of how to increase U.S. light vehicle fleet MPG and commensurately reduce oil used for U.S. light vehicle use is overly narrow.
{Concerning Jevon's Paradox} Yes, there would likely be be a small increase in vehicle miles driven per person, but not nearly enough to negate or even seriously dent the reduction in oil use brought about by the increased MPG, IMO. There are still going to be only 24 hours in a day, and 365 days in a year, and increased MPG will not magically allow people to quit their jobs or forgo 6-8 hours of sleep per night, nor forgo time at their home spent on waking personal hygiene activities etc. Then there are issues about vehicle maintenance and insurance costs, etc. which are invariant to the vehicles' MPG.
H
I am personally mystified as to why so many people in the US are willing/able to shell out large amounts for oversized vehicles. I wonder whether in the next downturn, the big default problem won't be on vehicles that people can't really afford (or maybe people make a choice between the cars and their homes, decide that they have to have the cars, and default on their homes, instead).
Yes, you are right, people could buy more efficient cars if they chose to, especially if the average cost of cars is in the $30 range. People seem to be very interested in looking at advertising, and impressing their friends and neighbors with the big, fancy, new car they are driving.
Even people who drive fuel efficient cars can fall into the "impress-your-neighbor" mentality. The difference with them is that they are impressing them in different ways--"fanciest Prius" or first in the neighborhood with a Nissan Leaf.
Gail, you and me both regarding scratching our heads about people's buying choices.
I imagine there are lots of psychological factors involved...keeping up with the Jone's, the idea that bigger and faster are better, the perception that large vehicles are safer...
Of course the Advert industry is in the business of pushing people's mental buttons, and we know that bigger/faster/more gadget-laden/more expensive vehicles have bigger profit margins.
I can try top boil it down to 'sound bites' or 'bumper stickers':
1. Small fuel-efficient and relatively inexpensive vehicles do not produce the high profit margins companies desire.
2. Advert agencies craft adverts which magnify people's tendencies to want bigger/faster/more expensive vehicles
and
3. The price of fuel and the overall affluence of Americans are such that people feel able to afford to cater to their base tendencies/desires, as amplified and stoked by the experts in the Advert industry on behalf of the profit-maximizing vehicle industry.
Add to this some inherent and much manufactured/amplified hostility towards environmentalists/greens/conservation/ and the very idea of there being 'Limits' as antithetical to the liberties and freedoms folks imagine as part and parcel to the 'American Dream'.
I suspect that the 'stair-step' 'three steps back, two steps forward' sawtooth dance of fuel prices, and economic indicators in general, will continue as oil becomes more scarce and harder to extract, with an overall commensurate decline in vehicle miles driven, vehicle sales, and a gradual move towards more efficient vehicles, carpooling, car sharing, etc. as coping mechanisms.
I find it a shame that folks can be bedazzled by the 'poster children' of top-of-the line Priuses, Volts, and Leafs, and swallow those as an excuse to ignore the base model Prisus (there are 4-5 trim lines for Priuses...for each model...the regular Prius, small Prius, Prius V, Prius plug-in), Honda Insight, Hyundai Elantra, and all the other models described in the Motor Trend article I linked to above.
U.S. light vehicle fleet mean fuel economy could be significantly improved if half-three-fourths of those 12M new vehicles bought each years were selected from this stable of practical, useful, inexpensive, high efficiency cars...and folks would actually save a bunch on purchase price (and save even more if they bought the base vehicles), have very reliable and function vehicles, and would save a bunch on their fuel bills.
It is what it is...
I think you're pretty close with your reasoning.
I still remember the appalled look on the salesman's face when I told him I wanted the base model Aveo (as in the advertised loss leader). No "convenience" package, no power windows, manual transmission, and no air conditioning. He almost stroked out on that one. That must be when he realized the bait and switch wasn't going to work. You have a brand new car advertised at $9,500, and that is the one I want. (At the time, the next best car I could find to buy was a 5 year old Neon listed for $8,000.)
And when one of the ladies at work saw it, she asked me how that little thing could be "safe." I reminded her my other commuting vehicle is a motorcycle. She drives a Suburban, of course. And complains about gas prices.
Expectations, stereotypes, and marketing.
America has lots of hybrid cars parked in the driveways of 2000 sq/ft houses. IMHO even most eco-friendly vehicle purchases are made for reasons other than raw efficiency.
IMHO there is another problem that is still on the horizon: The average new vehicle purchaser is not the average American vehicle owner anymore. As people get poorer and vehicles get more expensive, this problem grows. If we get into a situation where "the 1%" are the only people who can afford new cars, then the other 99% will all be driving used versions of the 1%'s vehicle priorities. Good luck getting the 1% to give up their luxury options for the sake of the next few owners of the car.
Gail - A great and balanced presentation...mucho thanks. I've seen numerous "geologic" models of that have not predicted future oil development accurately but the model structure itself wasn't really flawed. The flaw was almost always in the price forecasts. And that error has pushed both ways but typically more towards an underestimate. As you know so well the oil patch thrives on the discounted cash flow approach. Obviously that model is dependent not only on the geologic/reserve/flow rate input but also price forecasts. The typical convention is to use current pricing with a minor inflation factor. Unfortunately this can lead to significant inaccuracies...both pessimistic and optimistic.
Consider the 2008 shale gas bust. I was on contract with Devon during that period and watched first hand future reserve development based upon a NG assumption that was more than 5X the most recent low prices. Obviously as prices fell the amount of economically recovered NG reserves fell. While improvements in horizontal frac'ng may have aided the effort the high cost of that tech worked in conjunction with falling prices to push the recovery model lower. Likewise I've seen the industry pull back from activity based upon an inaccurate low projection of future prices. Negative price forecast are a method of adding an additional risk factor while positive forecasting tends to be avoided. Just as it is today: we've shelved many of our deep NG prospects because they don't cut the mustard at current prices. So why don't we use a higher price forecast? NG prices are bound to rise eventually. But in a NPV calculation "eventual" is not acceptable. If I want to use a higher price I have to present specific "proof" of that expectation. As a wise catcher once said: Predictions are difficult...especially about the future. You simply don't stand before management and argue that you can accurately and precisely make such predictions. You're already making a case for reserves being present when in fact there may be none discovered when you finally start turning to the right.
If I ignore the inability to predict future prices and assume some clever engineers will figure out the tech side of the effort just watch out: we geologists can truly go hog wild with reserve speculation. Consider the current DW GOM play. When I started at Mobil Oil in 1975 I drilled from a fixed platform that was in the deepest water in the GOM: 600'. But the seismic data I had at this edge of the continental shelf showed clear signs of the possibility of a depositional model that would allow transport of reservoir quality sediments to the Deep Water trend. Hydrocarbon generation wasn't a concern: the GOM was long known as one of the greatest oil generating systems on the planet. I had just completed my masters work on such DW deposits in the San Joaquin Basin in CA so it was an easy leap for me. My graduate professor was deeply embroiled in a debate with Exxon over the possibility of such deposits in a certain onshore trend in Texas. He published a number of papers supporting the idea with XOM publishing counter arguments. BTW: have you noticed who the big DW GOM players are? And also noticed that the largest oil company on the planet has had little exposure to the DW GOM trend compared to others? Established corporate mind set can be very difficult to overcome.
OTOH no one was counting any of those potential reserves at the time. Predicting the future price of oil and the cost of tech that far in advance wasn't given any consideration at all. We geologists were full of DW sugar plums dancing in our heads over 30 years ago. But no one was going to generate a recovery model based on those expectations without a solid economics grounding.
And even when you have a handle on the tech and economic factors it's still easy to be on the low side in predicting reserve development. As I've pointed out before my privately owned company has been focused on deep NG development along the Gulf Coast. Not that we don't like oil prospects but there just aren't enough of them to drill. But wait...plenty of oil prospects in the Eagle Ford Shale. Why didn't we jump into that play? Easy answer: the ROR wasn't sufficient for my owner. He could make a better return investing in one of his other companies. So what was our estimate of recoverable EFS reserves? ZERO. But that's just us. But that is our recovery model. So maybe Chesapeake et al are using a different economic model than we use. Actually their models, despite their press release hype, don't differ from ours significantly. CHK's recent finance problems would seem to confirm that IMHO.
A year or so ago when Petrohawk made a huge profit from their EFS play. But they didn't do it by drilling and producing the EFS: they sold their company and UNDEVELOPED EFS acreage for $12 billion. And that's the motive behind the development of the shale plays IMHO: the opportunity to book a significant amount of proved (although not terribly profitable) reserves. And that allows Wall Street to assign a higher value to their stock. This is nothing new to the oil patch. I've seen it many times in my career. The EFS and many other shale trends are not oil/NG plays...they are stock plays. That's where the big profit comes from: Wall Street...not the well head. The good news is that this "profit" can be generated very quickly as the hype sets in. The bad news is that it can disappear just as quickly. Consider that CHK has plunged deeply into the oil rich shale plays during a period when oil prices have sustained the highest year long prices in the history of the oil patch. And CHK stock has lost about 1/3 of its value in the last 12 months. So if CHK isn't making any profit on the stock side of the equation and a small profit on the well head side (a profit but insufficient cash flow to sustain current operations) what does that say about the huge amount of future recoverable reserves some are assigning to the fractured shale plays? And remember companies are using the current high oil prices to justify their efforts and others are using those efforts to justify their optimistic expectations of future reserve development. And if demand drops due to economic troubles in the EU and a slowdown in the US economy resulting in a 10-20% drop in oil prices how many of those projected reserves will vanish? We've already seen trillions of cu ft of anticipated dry NG reserves vanish as prices fell over 75% during the last 4 years. And now there seems to be developing legitimate concerns that even with the high current oil price the economic model for the oil shale plays might not be sustainable on a cash flow basis.
As I would characterize you excellent post: it ain't the geology, stupid...it's the economics.
I agree, it is the economics that is the problem on future oil and gas plays, just as it is on replacement electric vehicles.
I think part of the problem is that decline rates aren't certain. Also, it isn't certain how much technology will improve, and it isn't certain how the undrilled areas differ from the drilled areas. As you point out, prices are also not certain. It is easy to create the impression of a possible very good business model, by making favorable assumptions. People can see that we have an oil and gas problem, and it is easy to jump to the conclusion that any so-called solution will work, and generate money for investors. Unfortunately, workers salaries are stagnant. They can't pay higher prices for oil and gas, without cutting back somewhere. So the model breaks down.
I am wondering if Chesapeake will make it past June 30, 2012.
It will probably be fairly hard to ramp up cheap oil for world wide consumption. Consumption won't be more than demand. It isn't logically necessary that consumption will use up all available supply, but large surpluses seem pretty unlikely.
The logical predictions are that higher oil prices plus excessive debt levels will constrict production and economic activity and will further shift production and economic activity to areas that are more energy efficient and less debt heavy.
It is not a pretty picture.
...and as someone said recently, all unconventional oil is 'manufactured' not 'natural' - in that the good old Texas Tea gets into the transport pipelines at the rate it comes out of the ground all by itself. While unconventional 'oil' and the like (shale, sand etc) is a manufacturing or industrial production process that is controlled by the maximum economic and practical rate of production of the plant involved.
With shale it will be with the rate wires can be strung to provide the energy that can be put into the shale to heat it and the rate water can be supplied and disposed of. With sand its could be the rate trucks can cart it or diggers can strip the overburden. In each case there are capacity-limiting elements in the process that cannot be easily ramped up by several orders of magnitude to get the unconventional oil to be any useful proportion of our daily 81 million barrels.
I think it was Aleklett who recently found that the maximum production of unconventional oils is not likely to get beyond about 8 million bbl a day by 2030. So basically the 'unconventionals' are - as Westexas suggests - Share Plays rather than Energy Plays.
Next topic anyone?
The graph of the EIA production estimates caught my eye - the trend seems so obvious. I wanted to see where their estimate might converge with reality in 2020, so I created the following graph from their 2020 estimates. I used three trend lines to establish a range: linear, exponential and a second order polynomial. If I were a betting man I'd put my money on 60 mbpd...
Interesting! But not so good for the world economy!
Total US Crude Oil Production (EIA):
2002: 5.746
2003: 5.681
2004: 5.419
2005: 5.178
2006: 5.102
2007: 5.064
2008: 4.950
2009: 5.361
2010: 5.476
2011: 5.662
Total US Crude Oil Production, using RRC data for Texas, instead of EIA (Gap):
2002: 5.615 (+131,000 bpd)
2003: 5.548 (+133,000)
2004: 5.303 (+116,000)
2005: 5.059 (+119,000)
2006: 4.948 (+154,000)
2007: 4.898 (+166,000)
2008: 4.813 (+137,000)
2009: 5.199 (+162,000)
2010: 5.285 (+194,000)
2011: 5.324 (+338,000)
RRC Data: http://www.rrc.state.tx.us/data/production/oilwellcounts.php
http://webapps.rrc.state.tx.us/PDQ/changeViewReportAction.do?viewType=Mo...
EIA data: http://www.eia.gov/dnav/pet/pet_crd_crpdn_adc_mbblpd_a.htm
Art Berman will address this topic in his ASPO-USA webinar presentation on 5/17. More info at www.aspousa.org
Note that the net increase in US crude oil production from 2008 to 2009 was equivalent to rising Gulf of Mexico production, as GOM production rebounded after the hurricanes and as some (quick to peak and decline) deepwater projects came on line.
The RRC sums the reported production from Texas producers, while the EIA apparently uses a sampling approach to estimate Texas production. If the EIA is this far off for Texas, what about the other producing states, and what does it say about the EIA's global data?
In any case, based on the RRC data, it appears that a thousand rigs drilling for oil in the US in 2011 served to keep production flat year over year. Note that--based on the RRC data--all of the expenditures by the US oil industry from 2005 to 2011 inclusive only served to bring US crude oil production back to the pre-hurricane rate of 5.3 mbpd.
Glider
Is our "100 year" supply of Shale Oil being included in the projections?
I have no idea - I just used the EIA graph that Gail posted above. My graph is more a check on how quickly the EIA is recognizing world reality rather than a prediction of future production values.
I thought it was "shale gas", not "shale oil" that there allegedly was a 100 year supply of, with sufficiently high price. I don't know of any huge estimates of tight oil supply.
Great article.
I am just once again agog at the ability of economists with strong numeracy skills to have somehow evaded the part of education where one learns about limits, especially the natural sort, and complexity.
I see in their wonderful projection of future economic growth that they've, once again, used the 'ruler approach' very popular among economists where the economy just grows merrily along at a non-changing pace. In their case 4% +/-.
Using this extrapolation they have the world economy growing by 40% at a time when petroleum production is growing at 9% which - surprise! - is the same ratio that has been true of the period from 1970 through 2010. So they really didn't go out on a limb there, they instead went for 'status quo' which is a career safe move. Not very bold, but safe.
What catches my eye the most is that nowhere does the idea of EROEI seem to creep into their views, which is a classical economic blunder...all things are contained within price as if money itself were the primary consideration rather than the derivative.
The reason I think they are desperately wrong here is that even though one could argue that a lower EROEI simply means that there will be more economy being directed into energy even as it steals from other parts of the economy (so it's a wash...GDP wins either way) this utterly ignores just how much of our current economy is built upon faster-than-GDP debt growth that directly supports such useless things as an overbuilt financial sector whose 'profits' and contributions to GDP are really more illusory than real.
So the tasty economic pyramid that currently exists will totter and topple as more and more effort is directed back into energy production and it becomes obvious to all that the prior four decades of too-fast debt expansion was really an aberrant if not abhorrent historical diversion not to be repeated again.
Beyond EROEI, the final section, Factors underlying world long term growth rate, other than energy... seems critical if one is to do a systemic analysis of peak oil; the Peak Everything hypothesis, virtually impossible to predict. So many factors contribute to BAU and the continuing ability to extract and market oil at current rates. I expect that there is more synergy going on than is, or can be, accounted for.
We tend to compartmentalize our analysis of oil production (or debt, food production, industry, politics) as if they are standalone processes, but that's not how the world works. All of these things rely on the others for sustenance , a hyper-complex arrangement lacking the sort of resilience found in distributed, independent modular systems. Welcome to peak globalization. Taking a generalist's view, I expect that human ingenuity and substitution will have minimum impact on the slow declining spriral of industrial civilization. The only solution will be declining consumption due to declining population imposed by bio-physical economic reality. Our attempts to overcome basic physics will eventually steepen the curve as diminishing returns beget increasing negative feedback.
This process is well underway, ie: ethanol production in the US.
Good points, Chris.
Somehow there seems to be a view that resources don't really matter, even as billions of more people need to be fed and housed and clothed.
Factoring in the resources needed to produce the resources would seem to be a worthwhile way of approaching the situation.
A somewhat related issue: One problem I have when looking at GDP projections is that energy (and a lot of other things) seem to impact GDP calculations multiple times in a single year. For example, high oil prices impact food prices and the cost of goods transported to market. To the extent these costs get passed on to customers, it would seem like these would be impacts to GDP for a year as well. HIgher extraction costs would also impact GDP in multiple areas--perhaps favorably in some, because companies that do Fracking and other processes are selling a lot more services.
GDP doesn't reflect physical reality well and GDP and the value of money are uncoupling from the underlying reality of the physics that governs much of the economy. In scientific terms, real work is force exerted times displacement as a hard and fixed law that can not be inflated or manipulated or misstated. See http://en.wikipedia.org/wiki/Work_(physics)
Most of our economy when dealing with work in a physics sense is pushing things around with a force from one place to another. Tractors push around dirt and food. Trucks and cars, trains, and planes push around food and people, resources and wastes, etc, and all of that sums up into the total physical work that we do. The sum of all energy sources is the total available force that we have to work with, and that limits the amount of pushing, displacement, and work that we can do. Our total sum of energy sources to use as force would seem to be directly tied to the total amount of physical work that can done, which is a more true measure of the economy relationship from year to year than GDP for me. GDP uses inflatable money in it's calculation that is not in any way tied to the underlying physics. If our total supply of energy sources declines overall, the amount of real physical work done must decline as well too. That's just physics. Each individual energy sources contribution to real work done can be viewed in the same way. Some sources may grow while others decline, but it is always the net total energy that limits the amount of real physical work that can be done in the economy as a whole.
Sure, we can do some things smarter, and more efficiently, and invent some interesting things to increase our knowledge and level of entertainment. But it does seem like the bulk of much of the work being done is in pushing critical things like food and resources around. Any changes to our ability to push critical things around will reflect themselves in the economy in some way. In a situation where more energy is available to do work and push things around, the economy tends to expand, and in a situation in which there is less energy to do work and push things around the economy tends to contract.
Simplistic, but true. It applies for knowledge based industry as well, it's just that the energy inputs go into hardware, software, wetware, and all the supporting infrastructure.
See my comment below, it has the same theme. Maybe this is why engineers don't get invited to magic shows as we tend to spoil the illusions?
Physical growth in population and infrastructure is a much more energy intensive part of GDP growth than growth attributable to increased productivity. It is possible to increase GDP without increasing energy use. What we have become accustomed to is equating growth from increased population and the resulting increase in infrastructure to growth of incomes due to increases in productivity.
I disagree. This is the conventional approach to measuring energy inputs and productivity outputs without considering the entire cycle. GDP can be increased without increasing the traditional measures of energy, but energy is used all the same. Or, more basically, what is GDP? That measure in itself is flawed.
Increased productivity typically requires more condensed forms of energy - this has been the historical record. Human productivity is fueled by food and water. If food production is increasing, do we also include the solar energy that went into growing the food? No. Yet, is there a real increase or decrease in energy inputs?
If we were to make a more accurate ratio measurement that would benefit the species and the planet, we should be comparing REAL GDP to Entropy. i.e. Lawyers fees and earnings shouldn't count (do they?) because the national economic transaction is a zero sum. The same could be said for insurance paid disaster reconstruction - and I am by far not the first to state this.
Dr. Albert Bartlett postulates the greatest failing of the human species is to appreciate the exponential function, and my corollary is we fail to appreciate the boundary conditions.
So, how do improvements in energy efficiency factor into this? The economy consists of both goods and services. To the extent that both can be delivered in a less energy intensive manner should lead to the ability to consume more of both without increasing energy use. If the population is stable there shouldn't be a need to increase food production or build additional houses that require heating and cooling. I'm not suggesting that growth can continue forever but that there is room within current technology to increase the delivery of goods and services without additional energy. Conversely, we could focus on just maintaining the current level of consumption while reducing our energy use.
In theory, if the FF supported supply of real work were to be remaining constant or growing, or if renewables or alternate could make up for any decline in work available from FF, or increases in efficiency were to offset declining FF, then your statement about being able to consume more of both without increasing energy use could be valid. But if decline rates of 2 to 6 percent per year for FF becomes the norm without anything to offset it, then it may be much more probable that there will just be less goods and services available. The physics suggest that, even though GDP or debt trends may not reflect it.
In terms of oil, a good part of the EROEI is nat gas so to the extent that nat gas is currently relatively abundant, I would think it would somewhat mask the effects of lower EROEI for awhile.
Shale gas may be relatively abundant, but I expect the EROEI of shale gas is pretty low. It is a situation where sales price is far lower than the cost to produce the product.
Some of the other types of gas are essentially byproducts of oil or "liquids" production. The EROEI depends on how much of the energy in is allocated to oil and how much to natural gas.
The reason EROEI doesn't rate much of a mention in the report is that oil is a massively, globally traded commodity on which almost half the world's energy-using technology relies, and other energy sources (which are less widely traded and rather cheaper per unit of energy) still have a very high EROEI. As long as prices can be modeled and energy in other forms is assumed to be abundant, the actual EROEI of oil itself doesn't matter much to the model. Low-price but high-EROEI gas, coal, wind, nuclear and solar energy (in roughly that order) are leverage for getting high-priced, low-EROEI oil out of the ground.
Moreover, at the same high oil prices those energy supplies can also dig "negabarrels" out of the power grid.
You probably still have a strong point about the debt/growth relationship. Do expect large defaults in coming years. But remember, debt defaults are not really novel nor earth-shattering. We've been trained in recent decades to think of money markets as a close reflection of reality, but they're just paper and numbers. Fiat currency debt can still be issued in the midst of a financial meltdown, and after it. Only when *physical* resource limits are being pushed should the economic system fail for real. I just don't see economic collapse happening while high-EROEI, non-oil energy supplies are available.
"and it becomes obvious to all that the prior four decades of too-fast expansion was really an aberrant if not abhorrent historical diversion not be repeated again."
IMHO the public at large will never understand this. Four decades is too long and the evidence of the problem is not clear-cut and direct enough.
Certainly the authors of the IMF paper have taken an improved approach to forecasting. Of course, there are many factors which they probably have no way to take into account in any reliable way. What is the impact of climate change on world GDP? How does water depletion affect economic growth? Which industries are affected by oceanic acidification and what impact does that have? Each of these individually may have small impacts in the next 8 years, but have increasing impacts in the following 30. What is their cumulative impact on GDP? Rockman adds important, although idiosyncratic microeconomic information about how the oil and gas economics works at the level of the producers. When mainstream commentators speak of speculators influencing price, who are these speculators? Wall Street investors trying to time the markets? No model will account for every variable important to the mix which creates oil output. The model which makes very good predictions today may make poor predictions tomorrow as important, unnamed factors change.
Should I lead with the qualifer first...? Yes, like many on TOD I appreciate an attempt at a more balanced model that takes both sides of the dynamics into account. However, the math is not good enough, they can do better. (And using beta for a constant had me thinking they were using Bessel functions).
As we know the production and pricing are results of potential differences. The same principle applies to electrical power system load flow models. If we construct a network model for the entire industry and convert to well known physical parameters a dynamic iterative solution can be achieved. This uses partial differential equations and sparse Jacobian matracies to resolve an NxN node network with a Newtonian numerical method algorithm. (I could be a little dated on this since I haven't looked under the hood of the software for years).
Your lights stay on because of it and is highly reliable. The same principle is applied to other engineering disciplines with "Dynamics".
I would recommend those Tooders of the academic profession take an Economics doctoral candidate and the same from Electrical Engineering and splice the two together in a joint Dissertation. (Since it is my idea, the independent variable goes on the horizontal axis!!).
Get hold of me via email should you wish to discuss further.
I think the limited flow-rate argument is missing from both the economic and geological models.
Where a matrix or network model will truly be useful is in applying to WT's Export Land Model. What happens is that we have all these geographically arranged producers and consumers jockeying for each other's piece of the oil pie. The matrix consists of the imports and exports between every nation-state. This is a very doable NxN node network math project that is only hampered by filling in all the transfer coefficients. The end-result is that one can tweak a transfer coefficient and see how that causes repercussions in the global allocation.
WHT,
A nice idea but I wonder if the assumption of the transfer coefficients remaining stable over time would be justified. If not then using such a model for forecasting would be problematic.
BC_EE,
I am also a little sceptical of modelling the economy as an electical network. I understand that sophisticated analysis is needed to enable the grid to adjust to changes in demand for power, (and admit that I do not understand this in detail). Human behavior is somewhat more complicated than physical processes in that the behavior (say consumer preferences) can be affected by the economy itself in ways that are not well understood. Imagine trying to model a circuit whose loads (impedance) did not follow any well known physical principals, and further that those loads might change based on their understanding of the model. It might be simple from an engineer's point of view, but it does not look straightforward to me.
DC
If the present IC vehicles are to be replaced by electric powered vehicles, is there enough electricity available to power them?
Electricity is the easiest form of energy to "produce", by just burning stuff, so it will be likely that electricity will be around the longest of all. As to whether EV's could be powered indefinitely going forward into the future, that depends on how we proceed and the decisions we make. I think that any suggestion to replace all ICE's with EV's so as to continue 14 lane Los Angeles freeway traffic is ludicrous. I don't think anyone here is suggesting that. But on this site there is a frequent debate between those who see promotion of EV's as a necessity in order to be able to maintain some semblance of organized society going forward (there will always be a need for some wheels to be turned mechanically), versus those who see EV's as another excuse to continue with the car culture and/or techno-worship rather than addressing our problems head-on -- after all, it takes fossil fuels to manufacture and power EV's (this is probably the most frequent debate on this site now, popping up in almost every comments section, now that anyone can go buy a cost competitive EV so it's no longer a hypothetical debate anymore).
I am definitely part of the former group (EV supporter). The way I see it is we basically have two primary sources for energy going forward -- biofuels and solar. Wind may play a smaller role, and is similar to solar in many respects. Hydro seems to be close to being maxed out. Nuclear has huge roadblocks.
So, given that we have two main source of energy going forward -- one from ecological productivity, and one from boundless solar energy, I think it's pretty obvious that we need to do everything we can to minimize the amount of biofuels we harvest from the planet because that will be in direct competition with food production and other ecosystem services. The only reason humanity has been able to ascend so high is because of fossil fuels which allowed us to find energy beyond that which would have otherwise limited us by ecological productivity. If we are to avoid a Malthusian Collapse through destroying the planet, then clearly we will need to do everything to try to replace fossil fuels. Clearly it won't be about continuing on with the growth insanity of the past, because there is no way solar energy could ramp up that quickly, but it's about providing as soft a landing as possible after the financial and Peak Oil collapse. We will be forced to come up with a new economic system anyways, so the greater we invest in renewable infrastructure up until that point, the better.
Basically, despite all the objections over carbon dioxide buildup, the fact is that all recoverable fossil fuels will be taken out of the ground. Millions of starving people will not give such concerns any attention. It's a matter of priorities and we are still animals and when push comes to shove, "me first" trumps all other concerns. Anyone who today decides to lessen their demand for fossil fuels by not purchasing a car etc. and living a simple life is only making those fossil fuels available for someone else to extract and burn, which they will.
So then, we have a choice. Given that all fossil fuels will be pulled out of the ground, and that we have until 2070 before 90% of them have been burned (according the the article on TOD the other day), then we need to answer the question: how are we going to use them? The true doom and gloomers who see technology as an enabler of overshoot, and nothing else, say we should immediately minimize all energy use so as to prolong our energy inheritance as long as possible. Hunker down for the bad times ahead This doesn't solve anything though, all it does is prolong the collapse.
But the thing is, technology is not necessarily only an enabler of overshoot. Solar technology offers a real opportunity to harvest very large amounts of energy -- sustainably and indefinitely, essentially forever. The EROEI's of solar energy really aren't that bad for suitably located installations, and only improving, and some of this electricity could be used to produce hydrocarbons used for making further energy infrastructure. The energy is there; there is no denying that. So I just don't buy the argument that alternatives aren't worth pursuing. I don't have a romantic attachment to medieval horse and buggy culture; barring some global nuclear war, technology will play a part going forward.
Another argument presented against EV adoption is that the future will be very capital-challenged, meaning that the whole car culture society of the past and present has come about as a result of easy credit (debt bubble) to buy those cars. When the financial system collapses and re-emerges as some new beast, you simply won't be able to get a loan to so easily buy a car, so this will present severe headwinds to the capital-intense EV's. To this I have two responses: 1) OK, when lack of capital resources has become such a burden that not even one single ICE is being manufactured, then maybe I'll join in, but until that happens all I see is millions of ICE's being manufactured every year and each one of those could instead be a PHEV. 2) What other better use of our remaining fossil fuels could we possibly have than using them do develop a renewable energy infrastructure with an EROEI of 20:1?
I think electricity is even easier to produce by hydraulic turbines than by "burning stuff". And wind turbines are no more complicated than steam turbines or internal combustion engines, though they are a bit larger.
I don't understand this insistence that fossil fuels are required to produce electric vehicles, or anything else (such as solar panels or wind turbines) for that matter. Of course they *are* used, because today they are still the cheapest form of energy. And I would guess that one of the last uses of fossil fuels will be for reducing metal oxides; though charcoal is quite as well suited as coal to that task and one can smelt many metals electrolytically.
Ultimately anything you can do with fossil fuels, you can do also with other forms of energy. And let us not forget that we already have enormous volumes of refined metals (eg. in ICE bodies and engine blocks) which can readily be recycled without using anywhere near as much energy as was used to smelt them in the first place. Who cares if they were originally produced with fossil fuels ... that's crying over spilt milk, so to speak :-)
Ultimately, fossil fuels are not required for anything in particular.
Substitutes for fossil fuel need to (1) scale up adequately, (2) be cheap, if they are not to create more financial problems, (3) not overly stress the transmission system. I am not sure that we have substitutes that are "there yet". The substitutes we have are "fossil fuel extenders". I don't see evidence that they are anywhere near being able to fully substitute for fossil fuels.
There are financial problems enough as it is, without holding non-fossil energy technology responsible for *creating* any of them. In the long run, it's obviously cheaper to switch away from fossil fuels than to stay with them. Finance is already a matter of smoke and mirrors. No doubt energy issues will trigger financial shakedowns again, but it will be fossil energy that does it (or public fear of nuclear energy), not renewables.
No question that replacing fossil fuels will be expensive -- and a large part of that cost will be in expanding and extending electric transmission -- but the transition doesn't need to replace *all* today's fossil fuel uses. Some of those uses are useless, or will be relatively useless in a constrained world, and for the rest there will always be a little fossil fuel available : even if supplies do crash it won't be to zero overnight. There'll always be *some* heavy oil left, available for a price (even if extracting it yields no net energy at all), and the same applies for gas and coal at lower prices.
In the very long run, technically, there is no purpose for which we use fossil fuels which can't be achieved with other energy carriers. It comes down to costs. The things we find it valuable to do, we'll do at high costs. The things we don't need to do, we won't bother paying for.
#2 and #3 as stated by you are "incomplete" if not incorrect.
Double the efficiency of electrical use and the rate per kWh can double with no negative overall economic effect. Or just increase efficiency by 2/3rds and rates by 60% (see California and Austin Texas on how to do this) and all is well with the rate payers in toto.
Significantly reduced per capita consumption takes the load off the existing transmission grid. Add residential & commericial solar PV where much of production is consumed in the neighborhood to reduce grid transmission loads further.
Some new, preferably HV DC (5% loss per 1,000 miles) transmission will be needed. That is where a small part of the doubling of rates will come from.
Example: 4 GW HV DC of wind from North & South Dakota to New York City (added to 1 GW of hydro from Quebec now going in) is viable. Perhaps 2 GW of a mix of wind & hydro from Newfoundland/Labrador (wind when it is blowing, hydro when it is not @ peak). Dual fuel in NYC - heat pumps for heat when electricity is cheap (the wind is blowing good in the Dakotas) and NG when it is not.
The USA has increased consumption as a % of GDP by 10% since Reagan was elected. Roll that back and there will be a massive amount to invest in viable projects.
Best Hopes for Realistic Assessment,
Alan
PS: On scaling up, one has only to look at global totals and realize that is not a medium term (say 5 years to ramp up production) issue.
Nice summary in the first paragraph. I'm in the second group, at least for near-status-quo uses of EVs. I think we lack the grid, the power plants, and probably the production capacity for that many high-end motors. As an example, the favored motor assist for my cargo bike is no longer available; the manufacturer said his suppliers quoted him such high prices and minimum order sizes that he could no longer make a go of it. That's given our current production of EVs and wind turbines.
The other reason I'm in the second group is that even given adequate energy supplies, our car culture is boneheaded. We use cars for stupidly short trips, then complain about traffic and parking problems (short trips, traffic, and parking problems are symptoms of density). The lack-of-exercise mortality rate dwarfs the car crash death rate; all those seat belts, airbags, and crumble zones completely ignore the larger cause of early death, which is spending too much time sitting in motorized comfy chairs.
Obviously, most people disagree with the second paragraph, else we wouldn't have our boneheaded car culture. However, one thing to consider for future economic adjustments is the cost of moving people and jobs around in ways that create more density. People talk about this like it Cannot Happen, but I grew up in Florida (as did my father and grandfather), and I can tell you that loads of people will move if motivated, because a truckload of them moved to Florida. If the sea level rises too much, if it gets too expensive to run air conditioners, if it gets too expensive to drive (instead of walking or biking, i.e., sweating), a truckload will leave. People also talk about "greater density" as if it were the enemy of various desirable things like low crime and good schools. I live in a town with good schools and low crime, and 5300 people per square mile (including two ponds, some Audubon open space, a country club, and some other open space).
I expect availability of electricity will vary with location. In places with a lot of water power (US pacific northwest, for example), electricity may be OK.
Countries that are taking nuclear offline are likely to have an electricity shortfall, even before considering autos. In a place like Japan, the chance that there will be enough electricity for electric autos seems close to nil, if nuclear is taken off line, and nothing added. Germany and Switzerland have decided to decommission nuclear. This will also put them short of electricity, unless they are able to ramp up coal.
The US East coast also has a lot of nuclear--30% to 35% of total electricity. Most of these nuclear plants are old. It might make sense to decommission them, but with the lack of substitutes, the likely outcome is that most of them will have their lives extended for 20 years. What one does with all of the spent fuel is still an open question. If we should decide to decommission these nuclear plants, I think we will be in a position like Japan, at least on the US East Coast--without enough electricity.
I don't see wind and solar as ever playing a very big role. Their intermittency and the distance of wind from markets are major issues.
Electric cars will probably not use as much electricity as a person might expect, partly because of slow ramp up, partly because they are driven less than regular cars, and partly because electricity is an efficient energy source. As a result, where electricity supplies are already adequate, electricity for autos may not be much of a problem.
A variety of things worthy of discussion in more detail here.
Thanks for those additional figures.
One other related piece--most of the people live in the Eastern part of the United States, and the vast majority of the energy use is in the Eastern part of the United States. (I am thinking 80%, but would have to look it up.) There are really three pieces of the US Electrical Grid: (1) Eastern, (2) Western, and (3) Texas. The "renewable" part of the electricity generation is in the Western and Texas part of the grid. The Eastern part is very much larger, and has very much less renewable energy.
The majority of US wind potential is in the western side of the Eastern Grid (and Texas).
Grids
http://upload.wikimedia.org/wikipedia/commons/f/f4/NERC-map-en.svg
Wind Potential
http://www.windpoweringamerica.gov/wind_maps.asp
Even the orange areas produce a lot of wind. States like Illinois & Wisconsin have the economic resource to produce more than 100% of their total electrical demand from wind - and sites @ the Great Lakes for pumped storage. Add some solar PV for summer peaking.
New HV DC lines and pumped storage (affordable - even if electricity costs more).
And expanded Canadian hydro (25 GW Quebec, 5 GW Manitoba, 3 GW Newfoundland) and Canadian wind will add to the potential for "Eastern" grid renewable power.
Best Hopes for Realistic Assessments,
Alan
Yep. I'm outspoken on the subject of the problems that I think the East faces over the next 25 years. Aging nukes is only part of it. If the US is going to do anything about significantly reducing coal consumption, the bulk of the pain is going to have to fall on the East (in 2010, almost exactly 90% of the coal-fired electricity produced in the US was produced in the states of the Eastern Interconnect). Note that some of that coal-related bias has already started -- the EPA's new Cross-State Air Pollution Rule, which has a number of eastern utilities up in arms, doesn't apply to any power plants in the West.
"I don't see wind and solar as ever playing a very big role. Their intermittency and the distance of wind from markets are major issues."
Gail you repeat this sort of thing over and over, even as wind and solar installations double almost annually and yearly renewable energy investment has outstripped fossil fuel investment globally. You can't *not* be aware of this.
Intermittency and distance, while they have significant costs, have never proved so difficult to manage as frequently claimed by the opponents of wind power. If intermittency is still considered problematic when (or indeed if) the tightening fossil fuel situation becomes truly desperate, technologies now considered too expensive, environmentally destructive or unpopular (such as tidal barrages and electricity-to-fuel) will still be deployable.
While I appreciate your economic expertise and earnestness, and I share your fear of a total collapse in investment if oil production should suddenly fail, or climate change severely for the worse, faster than civilisation can adapt, I can't help think that you're missing a great forest of renewable energy technology growing under your nose.
I think that only a collapse of civilisation could possibly *stop* us adapting to the scarcity of fossil fuels. Wind and solar are *already* playing big and growing roles in this transition.
It is true intermittency of wind and solar isn't hard to handle. The standard method these days seems to be to install natural gas turbines to make up any shortfall in power when the clouds come out and the wind drops....
Nothing wrong with peaking gas turbines, but I think deferring hydro generation, overbuilding and curtailment of wind are every bit as common. Curtailment happens in some regions even during peak consumption hours which means it's the renewables which are handling the demand peak.
I have less than perfect confidence in some of the claims made on the Doty Energy website, but you may find this analysis of the economics of wind curtailment interesting:
http://www.dotyenergy.com/Economics/Econ_Stabilizing_RenewableGrid.htm
"Within MISO, nearly half of the curtailments occur during peak hours. Using wind curtailment has supplanted using rapidly ramping/tamping peaker plants to balance hour-by-hour supply and demand loads. In some cases it is less expensive to over-build wind and curtail it than it is to build a natural gas plant and constantly ramp it up and down."
Wind is cheaper than gas, for *peaking*. Seriously.
I found the article interesting. I was noticing that part of what Doty Energy claims will make their product work is the very low price they are will need to pay for otherwise-curtailed wind, together with "fuel subsidies" (or is that the low price they pay?) plus the value of carbon offsets they would sell, plus other products they would sell (low grade heat, O2, H2).
It seems like at some point, the financial model for wind will become so poor that wind developers will drop out (or utilities will go screaming to legislators to get rid of the mandates). I wonder, too, if this is done on a large scale, whether the markets for the O2 and H2 would become saturated as well.
Just build more pumped storage.
Germany, Switzerland and Austria have agreed to do just that.
http://www.germanenergyblog.de/?p=9306
They don't have that American "Can't Do It !" spirit.
Best Hopes for Realistic Assessment,
Alan
Was a duplicate post (Drupal is telling me to try again, so I do, and double-post. Duh).
But I'll take the opportunity to add that Noway's heavily overbuilt hydro power, with excess capacity intended originally to handle seasonal variation in water availability, is adequate to handling diurnal variation of intermittent generation across several countries. The Norwegians buy cheap and sell dear, nowadays just to Sweden and Denmark (and perhaps a little to Germany via Denmark), but undersea HVDC connectors are proposed to the Netherlands and UK as well for precisely the same purpose.
Both distance *and* intermittency are eminently solvable problems.
Efficacy and prospects of renewable energy should be investigated on the basis of evidence, as reliable as we can find and with the substance cited appropriately.
It does not help that vested interests have proposed a PR campaign to convince the public that wind power cannot succeed.
http://www.desmogblog.com/guardian-exposes-fossil-funded-groups-coordina...
TOD is not part of this effort IMO, but it's helpful to know about so we don't contibute to the noise.
Crash Courses chapter 17 indicates it would take around 750 new Nuclear Power plants to replace our current 10 mbd of oil imports we use in the USA, and it looks like we use 18 mbd including our own production. So roughly 1300 new nuclear plants to get the equivalent amount of work available if there were no oil at all. So roughly on average 26 new nuclear plants per state. Google search says a total of 104 existing plants right now. Seems like we would be adding a lot energy onto the grid. Does anybody have data to roughly guess by what factor of increase the amount of electric energy delivered would be if were to replace the oil energy with electricity? If it was around a factor of 10, what would that do to the current grid wires and transformers? Sounds like an overload situation. Delivering that much energy without building out and expanding the grid by several factors might even be able to melt the transmission lines and transformers.
If all cars and light trucks were EV or PHEV we would be replacing present vehicles using 4gallons diesel or gasoline/100miles with vehicles using about 20-30kWh/100miles when in electric mode. A barrel of oil would yield less than 40 gallons diesel/ gasoline so at most replacing 10Mbd would require 200-300kWh x 10million or 2000-3000GWh/day or approx 100GW average. Present US average electricity consumption is 450GW with a capacity to produce 1000GW peak output.
Providing EV charging is mainly during off-peak times, this power consumption should be manageable with only minor modifications to the power grid. Presently >10% of the US electricity is from renewables(6% hydro, 3% wind) so would need to expand wind power by X10 fold or solar X50 fold, or hydro X3 fold to replace 50% of present oil consumption. All of these seem possible with wind plus solar almost certainly contributing 100GW by 2020.
The answer is somewhere down the middle. However, the hypothetical addition of electrical generation capacity to supplant oil use should be assessed by the type of generation discussed. Nuclear power is base-load and cumbersome to vary (or load-follow) due to the thermal inertia of the large plants.
To answer Michael's original question, the only transmission system topology outcome I can think of is "spaghetti". It is difficult enough to get one transmission line in, so we would want to try 100's short of a despotic government regime? We do have tools and technologies to optimize and really squeeze those electrons down the line, but the social license will be very difficult to come by. (Electrons actually propagate the electrical energy in a wave fashion and do actually flow through the wires despite the well intentioned instructional animations of our times).
Just as we have moved extensively into a digital electronics and hybrid age, so too will the Grid and energy sources/storage. Mostly, the existing Grid is one big analogue machine and optimal solution could be to distribute the electrical generation more and operate the interconnecting bulk transmission more like a bus connected to a switched power supply.
Solid Oxide Fuel Cells (SOFC's) are quickly getting on the technology curve, offer greatly improved efficiencies (50-54%) over ICE-type generation (30-33%), and can supply heat for local water/space. We have an extensive natural gas pipeline network - boy, does this sound "full circle" as we could be going into/back to the higher technology equivalent of gas lighting? Instead of putting $100's of millions or $billions into a new generation plant + transmission, do we install with new or retrofit homes with these local energy plants? Each would take up the space of the average kitchen stove.
We have enough connectivity so we can individually manage our energy micro-plant in conjunction with RE sources such as solar and wind. Both the RE generator and the utility have enough meteorological and historical load data to provide 4-hour ahead information to the micro-plant so it can ramp up and down accordingly. At work and not at home, the plant could be putting energy onto the grid to offset peaking. Nothing new under the sun.
Just spit-balling here...
However, like most, my preference is to de-emphasize the personal automobile as the core transportation and energy consumer/contributor in the longer range infrastructure planning.
'Nuclear power is base-load and cumbersome to vary (or load-follow) due to the thermal inertia of the large plants.'
This applies to the existing US fleet which was not designed with load following in mind.
The French fleet has more flexibility, and future reactors still more, amounting to 5% per minute:
http://www.oecd-nea.org/ndd/reports/2011/load-following-npp.pdf
(pg 8)
The use of things like air heat pumps and the electrification of transport means that a modern society can be run with no decrease in comfort or mobility on about 1.5kwe of electricity to run most things except some air transport etc:
http://2050-calculator-tool.decc.gov.uk/pathways/D0141111111111110114111...
At $5,000kwe about $7,500 in capital costs per person would be needed to run society on nuclear, including electricity for light transport, or $375 plus interest per year for 20 years, moving gradually to more advanced reactors and so on.
We have had the ultimate stress test at Fukushima, where old and poorly designed reactors were hit by a 14 metre tsunami and a 9.0 magnitude earthquake, resulting in exactly nil radiation casualties.
This is in contrast to oil and gas installations, where unknown numbers of survivors were incinerated in a sea of fire.
EV cars break even including road upkeep with petrol at about $4.15-5.00/US gallon.
Above that point the cost of the extra batteries is balanced by your savings in monthly fuel costs.
Much lower maintenance costs on electric vehicles which last until the bottom drops out help their economics.
If oil prices and petrol double by 2020 then the economics of electric transport are unanswerable.
There is absolutely no reason why people should not stay mobile, and have plenty of energy to run an advanced society.
"Electrons actually propagate the electrical energy in a wave fashion and do actually flow through the wires despite the well intentioned instructional animations of our times."
I think you probably meant "do not actually flow" ... but in the case of DC transmission, I'm certain the electrons *do* flow through the wires. Not as fast as the electric current, but, like the Earth around the Sun, still they move!
I seem to remember learning that they flow on average about 1 mm/s
The other day I was mowing the lawn with the electric lawnmower. Everything was fine for 15 minutes then I went through a thick patch, the mower bogged, then died. It took a minute to figure out that I blew the breaker. That had never happened before. Why? Because I was also charging my Leaf on the same circuit! Duh! So that one 15 A 120 V circuit can handle both charging my EV AND mowing my lawn. I have never used a Level 2 charger for my EV, always wall trickling, and it works fine as long as you don't mow the lawn on the same circuit...
I wrote a paper in 2009 that discussed the impact of oil price volatility on future oil production. At the time we had just ended a series of rising swings in oil prices that culminated in the $147 oil we're all keenly aware of in July 2008. At the time I wrote the paper oil had already gone from $147 per barrel to $33 per barrel in 6 months, and then redoubled in price!
It looked like the beginning of a post peak world. Fast forward to today and even though the rising trend has continued, the volatility has diminished significantly on a relative basis. I had predicted that price volatility would render many unconventional oil projects as risky ventures that would lose funding pushing global production into permanent decline. Instead, the complete opposite has happened; stable but rising prices have been a boon for heavy oil production allowing for these unconventional resources to make up for, and exceed, declines in mature fields.
To me the question of future production depends on price volatility, and thus profitability. It seems that the Federal Reserve, ECB, Bank of England, Bank of Japan, PBOC, IMF, etc. will continue to buy bad debt and/or use QE every time the global financial system deteriorates, thus limiting downside potential. Upside potential will be limited by the fact that high oil prices induce recession, so we have a fairly stable band that prices cannot go below or above for these reasons. If this continues we may very well get through the difficult transition period we're on.
If the Central Banks of the world can buy (literally) 5 more years of time without Europe, Japan, or the U.S. debt issues imploding, then we may very well make it through this rough transition period. We just may look back on this as an awkward transition period where we increased efficiency, researched better PV tech, genetically modified microorganisms to produce fuel, stopped buying SUVs, began using LNG, bought more scooters/mopeds, etc. In fact, everything I just listed is happening and continuously evolving at this moment.
Again the wild card is if the powers that be fail to hold our global financial mess together during this transition. I personally believe that everything from the U.S. financial crisis in 2008 to the Arab Spring and Europe Debt Crisis are directly attributable to high oil prices and its various effects on global growth and inflation. Interesting times indeed.
The wild card isn't whether the developed world can print, they can. It is whether or not we can feed the printed dollars out into the developing world. That will depend largely on the success of the military to keep things under control. Not an easy task going forward.
What planet are you living on?
Everywhere around me I see collapse. It's getting to the point of being terrifying, really.
Maybe it's just cognitive bias, or different environments.
I wonder if when the oil price hits a stable plateau then subsequent world GDP will tend to be in lockstep with oil production. In rough terms a decline from 90 mbpd to 60 mbpd would mean a 1/3rd decline in GDP. Economic theory says that when a resource runs out with few alternatives then the price goes up. However I think it is quite possible in the case of oil the price could adjust downwards to maintain constant affordability, that is price relative to income. If so the inflation adjusted price of a barrel of oil at 60 mbpd could be a third less, say $65 WTI. The cheaper oil price would reflect lower economic activity, less vehicle movement and widespread poverty.
There is a lot of room to shift the fuel efficiency of cars and light trucks from the present 25mpg average to 50mpg. The transition will take time but even a 50% improvement in vehicle efficiency will result in 1/3 decline in oil consumption with really no impact on GDP.
The other consideration is that there is not one constant affordability. A prius owner who drives 10miles/day is going to be able to afford a much higher price than a SUV owner who needs to drive 100miles/day. With oil at $100 /barrel many are being forced to change their transport or job or home. This doesn't necessarily mean lower economic activity.
Fair point except some people are trapped. They can't afford a Prius nor can they find a buyer for their house/acreage so they can move closer to town. What I'm seeing locally (SW Tasmania) is people buying 2nd hand compact cars to commute or relocating nearer to the mines which could be in any State. The way it affects me is that Sunday afternoon drivers from the city buy fast food locally and I turn the used cooking oil into fuel. When Sunday driving stops there goes my cheap fuel. I guess when China stops buying minerals the residents will come back and live on welfare. I anticipate that's a when not if.
I think very few people are really trapped in the sense that they cannot change their lifestyle to use less oil. Almost everyone lives in towns or cities, so mass transit or car pooling are options, or a short drive to connect to one of these are options. Buying a second or third hand high efficiency ICE vehicle is also a good option. In the developed world most private VMT are still non-essential.
I am sure that most societies can adapt to permanent high priced scarce oil supplies. Many countries managed during WWII, but it will take time for people to realize shortages are permanent and make permanent changes. Do school children have to be driven to school and sporting events? Do we have to drive to shopping centers 2-3 times a week? Do we have to commute to work alone in a 2 tonne 6 passenger vehicle??
Not sure why China would stop buying minerals?? sea based trade has a lot of room to adjust to much higher oil prices. Locally China seems to be developing a lot of renewable and nuclear power.
I think you are right about the price of oil possibly dropping because people can't afford it. The problem, though, it that if the price of oil drops very much, a lot of oil sources will disappear--perhaps not immediately, but no new expensive wells will be drilled, so there will be a fairly steep drop off, as old wells deplete, and new ones are not added.
Right now, our true financial situation is being masked by all of the deficit spending of governments, plus "QE" by some governments, intended to raise stock prices. Interest rates are also artificially low, trying to get people/businesses to borrow more. Commercial property is being propped up by "extend and pretend" applied to underwater loans. Stopping these things is likely to make layoffs soar and stock prices drop. So our true financial situation is not what it appears to be. It would appear that our GDP could drop quite a bit, if just the "funny business" were to go away.
Hi Gail,
If we assume for the moment that the "funny business" continues for a few more years or until there is a modest recovery (which is optimistic and unlikely), are you thinking here that the oil price could not drop by much under that assumption because oil supply would drop (as more expensive oil projects get delayed or cancelled) and thus drive prices up (or at minimum halt the decline in oil prices.)?
I do not discount the likelihood that the financial manipulation is likely to end badly. It is just that we quickly end up in uncharted waters, where it is all doom and gloom and it seems that evryone creates there own particular reality of how that might play out. Highly speculative and somewhat hard to wrap my brain around.
DC
As per all the large governmental forecasts, the future oil output graph in fig 4, shows total liquids production, not oil production. Only the double counting in things like bio-fuels allows for increases above the plateau, and probably even maintenance of the plateau.
When you add in things like Westexas's discovery of the increasing discrepancy between EIA sampling methodology and actual production from some like the TRRC, then the figures really are rubbery.
The conclusion that can be drawn is that the forecast is not worth much because of GIGO.
Net 'total liquids', available for the economy, ex fuel production, would be an interesting figure. It has probably been in decline for years, yet we have no measurement for it. Percentage of GDP attributed to 'total liquid' production and changes over time would be another interesting number. I would guess that number to be rising, but at what point does it become too high? Obviously we cannot get to 100% of GDP being involved with 'total liquids' production but how high can it get?
Biofuels like corn ethanol are mostly a natural gas to liquids operation (because fertilizer uses natural gas, and electricity typically uses natural gas), rather than an oil to liquids operation (even though some oil is used in corn production). Thus, the double counting is with natural gas, not so much with oil.
I am afraid I don't have figures on costs associated with oil production. I know that in oil exporting countries around the world, only a tiny portion of the population works in oil and gas production. The rest of the population must be adequately fed and housed and provided things like medical care. Oil exporting countries need a very high sales price of oil so that they can pay for these kinds of things. If they stop, there is likely to be government overthrow, and perhaps the countries will break up into warring factions.
Gail,
Tractors use oil, harvesters use oil, transport of the corn to the production facility uses oil, transport of the ethanol to the refinery uses oil. The building of the refineries has the transport of materials, that use oil etc, etc.
I once worked out the numbers for producing canola oil on farm only. With an assumption of electricity for all milling, and oil separation etc, the farm would consume ~15-20% of the oil produced with tractor/harvester use alone (assuming average yields with dryland farming). Farmers have bad years where there is no crop, yet fuel had been used to sow and fertilize, which makes the overall figure even worse.
To really get into the details, one would have to look at the fuel use of all the workers getting to both the farms and mills and ethanol plants as well as the fertilizer factories etc. My point being that there is an enormous amount of oil used in the creation of biofuels that remain hidden, and hence the double counting.
The focus of the IMF paper is too much on the global peak. This allows the debate to go on until judgement day. There are many other peaks which are important and which have been discussed here many times:
The global crude oil export peak in 2005
http://crudeoilpeak.info/wp-content/uploads/2011/04/EIA_Crude_Oil_Export...
We also have Saudi Arabia on a very flat export peak
http://crudeoilpeak.info/saudi-arabia-export-peak
Peaking in Sudan, Egypt, Yemen, Syria, Iran, all with geopolitical consequences
http://crudeoilpeak.info/egypt
http://crudeoilpeak.info/yemen
http://crudeoilpeak.info/syria
Peaking in Argentina leads to nationalisation, for example
http://crudeoilpeak.info/argentina-peak
And by the way, without Russia the world would now be in a much deeper oil crisis.
A 40-page summary what peaking is all about can be found in my submission on the draft of the Australian Energy White Paper 2011, available under downloads on my website
http://crudeoilpeak.info/downloads
Readers who are interested can have a look at the other submissions here:
http://www.ret.gov.au/energy/facts/white_paper/submissions/Pages/submiss...
In February 2012, the Australian government refused to table before the Senate an internal peak oil report (peaking of crude oil around 2015-2017) which was based on a modified Hubbert linearization.
Read about this soap opera here:
24/2/2012
Australian Government kicks own goals in Senate peak oil debate (peaky leaks part 3)
http://crudeoilpeak.info/australian-government-kicks-own-goals-in-senate...
Matt, thanks for the links. Your White Paper is excellent. It pulls together a lot of information that we discuss in dribs and drabs on TOD. I appreciate that you are willing to put yourself out there on projections of recoverable reserves. It seems like we discuss these issues a lot on this site but always seem to pull the punch when it comes to calling BS on OPEC.
In a recent conversation with a Washington API representative she told me, "you can't believe how difficult it is to convince people (Beltway people) how costly it is to produce oil". Adding another model from the IMF that probably is not going to work (to a collection of models that don't work) is not likely to aid her efforts at communicating the seriousness of our oil situation!
Neither the economic/technological or the geological model have been shown to have acceptable predictive capabilities. When extrapolated into the past they both fail miserably. If you can't predict what has already happened, it is very unlikely that you will be able to elicit confidence in futuristic projections.
Both the economic/technological and the geological model are deficit in that they lack a proven theoretical base; neither are based on fundamental laws of physics. The result has been a bizarre set of predictions that has spanned the entire gamma of imaginative results. The EIA's projections have repeatedly been wildly inaccurate, and the geological model has failed from a fundamental mathematical inconsistency. The model is based on a logistic function that when applied to its accumulated production distribution (CDF) has worked with a very high level of precision. The first derivative of that function, its PDF, would thus be expected to show the same level of accuracy. It has not. When Hubbert's bell curve is applied to production of various fields around the world, results are anything but consistent.
There is a model that is based on fundamental physical laws, and has shown a high level of historical correlation (at least within the variance of our data-sets - price and production). However, it is complex in comparison to present models, and relies on precepts that most find conceptually abstract and thus difficult to understand. Convening its conclusions to Washington decision makers will at best be very difficult, if not outright impossible!
The Hill's Group
Trying to quantify the social/economic situation in a bunch of producing and consuming countries would indeed be a trick. None of the models are worth a dam if a producing country with enough firepower elects to produce at a level that just meets their needs rather than at the maximum technical level.
The problem with Hubbert linearization is that it wasn't based on a physical model at all (or worse, an incorrect one based on predator-prey logistics) and so served only as a heuristic. And heuristics will always eventually fail.
The economic model is simple in my view, that of technological acceleration to first-order.
So pit a good stochastic model of geological resources against a good model of technological acceleration and one has a better model of fossil fuel depletion.
This has always struck me as an odd statement, even though it gets thrown around a lot. All of those goods and services were actually produced: the consumer alarm clock, the new factory, the repaved roads. In fact, given the level of under- and un-employment in the OECD countries, it is easy to argue that the world could have produced a much higher level of goods and services than we did.
You can argue that the rate of production is not sustainable because of resource constraints. You can argue that the level of production was possible only because there is mal-allocation of wealth and income in any number of ways depending on your philosophical preference. You can argue that the financial system that allows such mal-allocation is doomed to fail (which is how I interpret the statements about debt). But to claim that the world somehow produced more goods and services than it was capable of producing? No.
The issue has more to do with the developed countries consuming more than they are capable of consuming on a sustained basis.
What the additional debt does is ramp up demand, and so that consumers are able to purchase goods they would not otherwise purchase. Back when oil supply was more elastic than it was today, it probably did mean that more oil was pumped out of the ground --plus more coal, natural gas, copper, and other minerals than consumers could otherwise pay for. Now with oil supply pretty much constrained, it just means oil prices are higher, not that more is really pumped out of the ground. It seems like the higher demand would help the countries with the debt get more than their share of the oil that is produced (compared to a no-debt situation).
Hi Gail... this is what I refer to as basically, the fairy-dust model vs. the reality model.
As you correctly point out, in the Economic/Technological model, the possibility exists that substitution may not occur, or may not occur at the necessary rates. This is the generally ignored drawback to this model.
Oil production under the Hubbert Linearization model must also factor in non-conventional liquids. This is the intervening variable that brings Campbell's predictions pretty much in line with what we're actually seeing. This also tends to muddy the equations quite a bit, but when used against GDP don't really tell us much about what we can expect in the future because we're still basing predictions on past performance instead of looking at physical realities.
The underlying assumption in the IMF paper is that growth is a given with the only variable being under what circumstances it is going to occur and at what price point. But, as you again point out, there are limits to debt, and these are just about at the limit of deniability. We've also just about reached the end of the "drive till you qualify" model of sprawl in home ownership. So, basically, the IMF model is still just fairy-dust.
" there are limits to debt, and these are just about at the limit of deniability."
Hi, Dave
The IMF's new World Economic Outlook devotes an entire section to Household Debt (35 pgs).
Here's their concise summary of "the fundamental problems––weak households in the United States and weak sovereigns in the euro area" (p. xvii).
http://www.imf.org/external/pubs/ft/weo/2012/01/pdf/text.pdf
I don't think that model is taking limits strongly enough. It needs something like a -Qp term in it. Infinite oil at an infinite price is an improvement on infinite oil at current prices, but it ought to be finite oil at infinite price.
The long term GDP growth rate is baked in at 4% by setting g = 0.04 in equation 9 on page 10. It would have been nice to have explored the sensitivity of the model to variations in this parameter.
This is a global model and ignores the effects on individual nations. GDP growth of 4% is not very characteristic of the major economies, with most below 4% and a few above 4%.
The increasing price of oil results in increasing international money flows that must be financed somehow. The international finance system will become more stressed and international tensions will increase as a result. Alliances will shift and new geopolitical blocs will form.
From page 16:
The financial impact of writing down stranded capital that has been invested in obsolete plant, equipment and technology is likely to hit countries differently. This also increases the stress on the international system.
WebHubbleTelescope said:
Hubbert based his analysis on US field data - of which he was eminently familiar. His conclusion was that the accumulated production distribution follows a logistic function. He was correct; his conclusion is now verifiable through Quantile statistics, and when extrapolated to world production using Campbell, Laherrere and EIA data the resulting curve produces a logistic function with a 0.998 correlation coefficient. There can be no possible doubt about accumulated production being a logistic function. For it to be otherwise is almost mathematically inconceivable!
The problem lies in the function's first derivative, the PDF. The outcome is inconclusive when it is applied to individual fields. Even though Hubbert referred to the problem in latter years, he never explicitly explained it. The PDF of Hubbert's distribution is only partially decisive because there is an "undefined variable" affecting it. One that Hubbert seemed reluctant to discuss; probably for fear of further confusing what he saw as an already confused audience.
Hubbert's model is hardly heuristic; it was not invented. It was the almost genius inspiration of a highly trained and observant petro-geologist. It arose from an observation of the data then at hand. Its perceived failure has not resulted from it being incorrect, but rather, because it has been left incomplete!
The Hill's Group
Fantastic article Gail. I enjoy reading your level headed ego free analysis more than anyone else right now. You're right to commend the IMF to for producing this research even if it is not yet officially the view of the IMF. It appears to be a turning point with institutions of their calibre taking on many of the convictions of the peak oil community and coming to much the same conclusion.
I've been looking at drilling figures in the US recently. Since Jan 2009 exploratory and development drilling has increased by 87% yet only yielded a 13% increase in production. As I am sure you are well aware it appears that no matter how many wells are drilled US production will never grow by anything close to oil independence. Current working rigs vs production give similar results.
Keep up the great work!
Andrew McKay