| Updating World Deepwater Oil & Gas Discovery | The Oil Drum | Greasing the Wheel: Oil’s Role in the Global Crisis |
Norwegian Actual and Forecast Natural Gas Production towards 2020
Posted by Rune Likvern on May 22, 2012 - 4:37am
In this post, I present a little about developments in actual natural gas production from the Norwegian Continental Shelf (NCS) and a forecast towards 2020. I will also talk about where gas from the NCS is reported as being sold, and give a closer look at what estimated recoverable natural gas reserves and the Reserves over Production ratio (R/P) as of end 2011 may suggest for the future production of natural gas from the NCS.
Finally, I will talk a little about the likely impact from present plans for developments of natural gas discoveries in the Norwegian Sea.
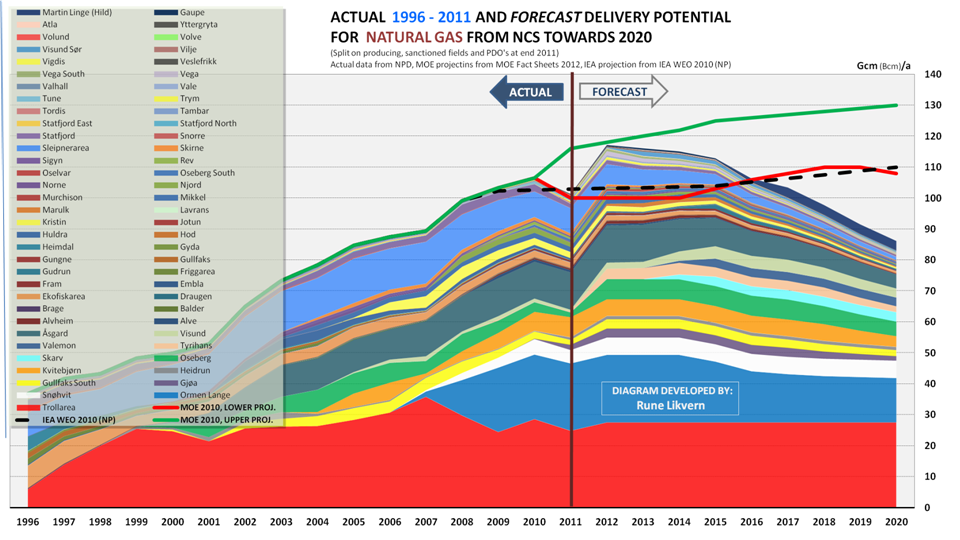
Figure 01: The figure above shows the development of actual Norwegian gas production by field between 1996 and 2011 as reported by the Norwegian Petroleum Directorate (NPD). The figure also shows a forecast (developed by the author) on the potential of deliveries for the years 2012 to 2020. The forecast includes all producing and sanctioned fields and expected effects from developments in the R/P (Reserves divided by Production), NPD estimates for remaining recoverable reserves, facilities constraints, etc.
The forecast does not include the effects from fields being shut down as these become unprofitable. My forecast is based upon recent data from the NPD and shows the future potential for Norwegian gas deliveries under the assumption of "normal" seasonal variations in the buyers’ nominations.
The chart also includes the future expected production range from the Ministry of Petroleum and Energy (MPE) and a forecast from the IEA (International Energy Agency) towards 2020.
Norwegian gas production is now expected to reach a new high in 2012 (see also Figure 3) after a slight decline from 2010 to 2011. For the years 2012 to 2015 Norwegian gas production is now expected to remain on what would be described as a plateau. As from 2016, Norwegian gas production is expected to decline steeply towards 2020 and beyond.
Several discoveries in the Norwegian Sea, like Aasta Hansteen (formerly Luva), Linnorm and Zidane, are now in planning for possible startups from late 2016.
Most of the content for this post was originally published in Norwegian here.
WHERE NORWEGIAN NATURAL GAS IS SOLD
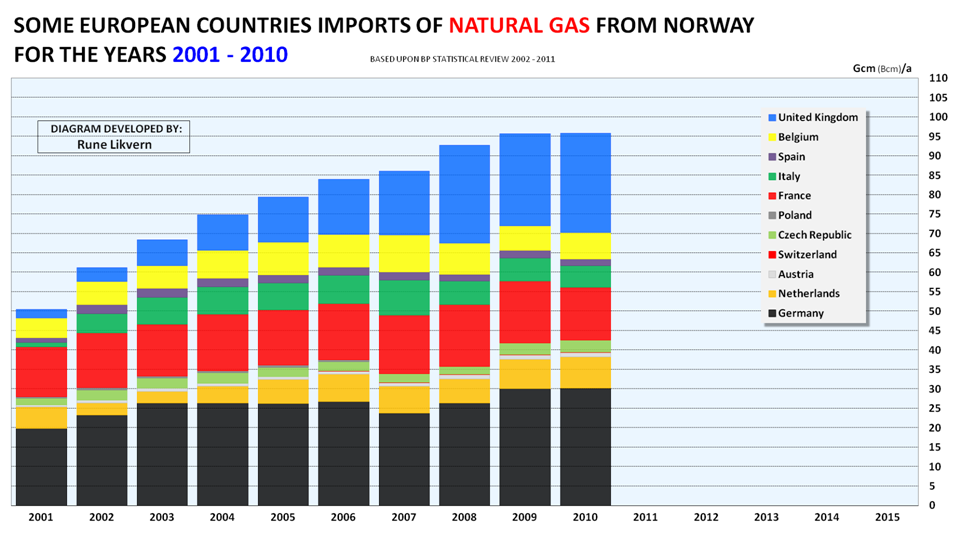
Figure 02: The figure above shows the annual developments in Norwegian natural gas deliveries (for the years 2001 to 2010) and imported volumes by some countries.
- Norway delivered close to 100 Bcm of natural gas in 2011 and most of its natural gas is sold and delivered to customers in Europe (that is, Continental Europe and the UK).
- As of 2011, Norway was the world’s second largest exporter of natural gas after Russia.
- Around 95% of Norwegian natural gas sales are delivered by pipelines and the balance by liquefied natural gas (LNG).
- Growth in Norwegian gas sales post-2005 has primarily been to the United Kingdom, and during 2010 Norway supplied the UK with approximately 28% of all natural gas consumed in the country.
A LITTLE ON SHRINKAGE AND DOMESTIC USES
The observant reader will have noticed that sold and delivered gas volumes as shown in Figure 2 are slightly less than what the NPD has reported as produced as shown in Figure 1.
NPD reports gas volumes metered and delivered from production facilities. These volumes, which are believed to include natural gas liquids [NGL; mainly ethane (C2H6), propane (C3H8) and butane (C4H10)], are all in the gaseous state at normal pressure and temperature. The natural gas which is sold is mainly methane (CH4).
NGLs are often referred to as "bottled gas", as natural gas liquids after extraction and fractionation (as performed at Kårstø and Kollsnes), are sold and delivered under pressure in the liquid state. Extraction and fractionation of NGLs shrink the amount of gas volumes delivered from the production facilities and thus lower sales gas volumes and their volumetric energy content.
The NGL extraction process is required to meet gas specifications from the buyers and pipeline operators.
For 2011, it is estimated that this shrinkage amounted to more than 4 billion cubic meters (Bcm), or about 4% of total reported volume of gas metered and delivered from the production facilities.
Norway uses little natural gas domestically (around 2% of annual production). It is used for power generation at the production facilities, increased oil recovery (Grane), feed for the methanol plant at Tjeldbergodden, and for power plants and supplies to households and industries in Haugesund and Stavanger.
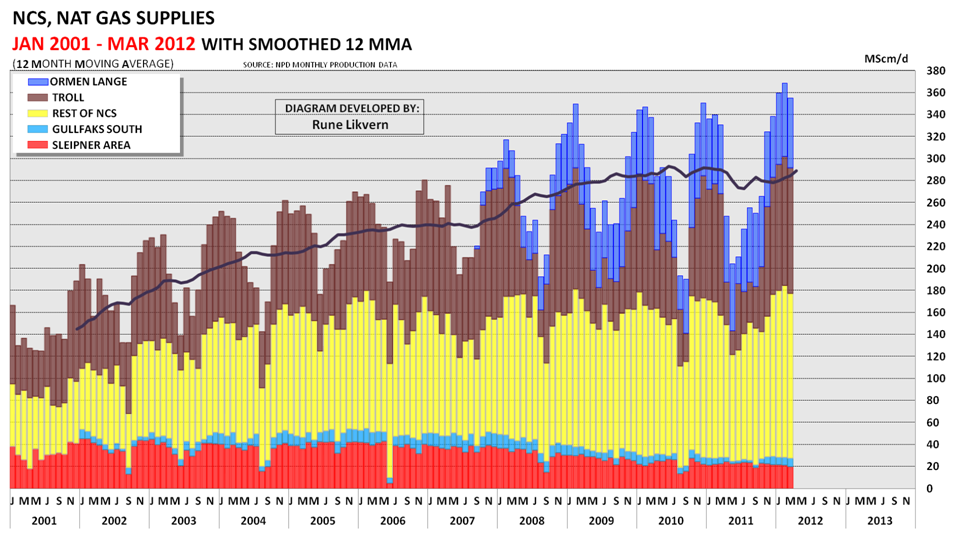
Figure 03: The figure shows actual total natural gas production split by some major fields and groups of fields from January 2001 to March 2012. The figure is based upon monthly NPD data.
A 12 Month Moving Average (12 MMA)black line is included in the chart. In January 2012, Norwegian natural gas production reached a new monthly high. NOTE: The chart shows production per calendar day, thus variations in flows from one day to another are normal.
The chart above also illustrates the seasonal variations in buyers’ nominations for Norwegian natural gas. The chart illustrates that during recent winters two fields, Ormen Lange and Troll, accounted for around 50% of the total Norwegian gas deliveries. Most Norwegian natural gas is sold under long term contracts.
In North America, natural gas production is subject to less seasonal variations than it is in Europe. In North America, seasonal variations in demand are normally covered by storage withdrawals/injections. In Europe seasonal variations are to a larger extent covered by a combination of storage withdrawals/injections and more production elasticity designed into the production installations and pipelines.
For January 2012, the NPD reported Record gas sales in January, which supports the forecast shown in Figure 1.
R/P AT END 2011 AND WHAT IT SUGGESTS FOR FUTURE PRODUCTION
The ratio for Reserves over Production, (R/P), may be a helpful parameter in perceiving future production developments. A low R/P ratio suggests that production should be expected to decline and a high R/P suggests production levels may be sustained or even grow.
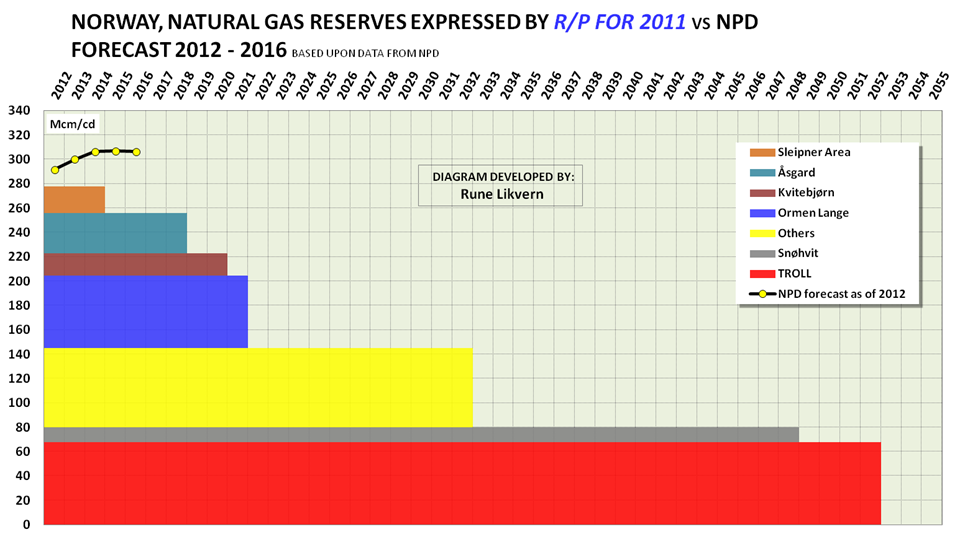
Figure 04: The figure shows the duration of production of natural gas from fields and groups of fields on the Norwegian Continental Shelf (NCS) by applying the R/P ratio at year-end 2011. In the real world the production will not follow a rectangular profile (although it would be desirable for economic reasons).
As reservoirs deplete they will at some point (for natural gas normally at around 70 - 80% depletion) experience a loss of productive potential and follow an exponential decline. The figure also shows the NPD's recent forecast for the years 2012 to 2016. The figure is based on reserve estimates and production data from the NPD at the end of 2011 and includes all fields in production and under development, like Gudrun, Gaupe, Skarv, Valemon, and Martin Linge.
NOTE: The figure shows production per calendar day.
The R/P rectangles above have varying degrees of elasticity and some fields had higher productive potential than what buyers asked for during the gas year 2010 (the gas year starts in October and lasts through September the following year). The fields' elasticity is also related to facilities constraints like liquefaction (LNG) capacity for Snøhvit and by production and export capacities for Ormen Lange (which could be upgraded if new fields are landed at Nyhamna) and by treatment capacities at Kollsnes for Kvitebjørn and Troll.
Based upon NPD data, the Sleipner area had an R/P of around 2.7 as of end of 2011, and this suggests that the production from the Sleipner area is about to enter into a steep decline.
The Åsgard fields and later Kvitebjørn are expected to be subject to declines in their productive capacities in the next few years as these fields continue to deplete.
Kollsnes (Troll and Kvitebjørn) and Ormen Lange are providing most of the swing production for seasonal demand. This leaves primarily other fields (see Others in Figure 3) as sources for any near term growth in natural gas production from the NCS.
As Figure 3 illustrates, Others has, in recent years, compensated for the declining production from the Sleipner area. A look at the R/P ratios for the fields and group of fields shows when new developments are scheduled to start flowing, and their expected production levels leaves little expectation for an increase in total production. For the near future, it is now expected that Others will primarily compensate for declining production from aging and depleting fields.
Figure 4 with the R/P ratios suggests that the production from NCS could grow during 2012 relative to 2011 and that the production then may remain on a plateau towards 2015/2016 before it enters into a steep decline towards 2020 and beyond, as shown in Figure 1.
DISCOVERIES IN THE NORWEGIAN SEA IN PLANNING FOR DEVELOPMENT
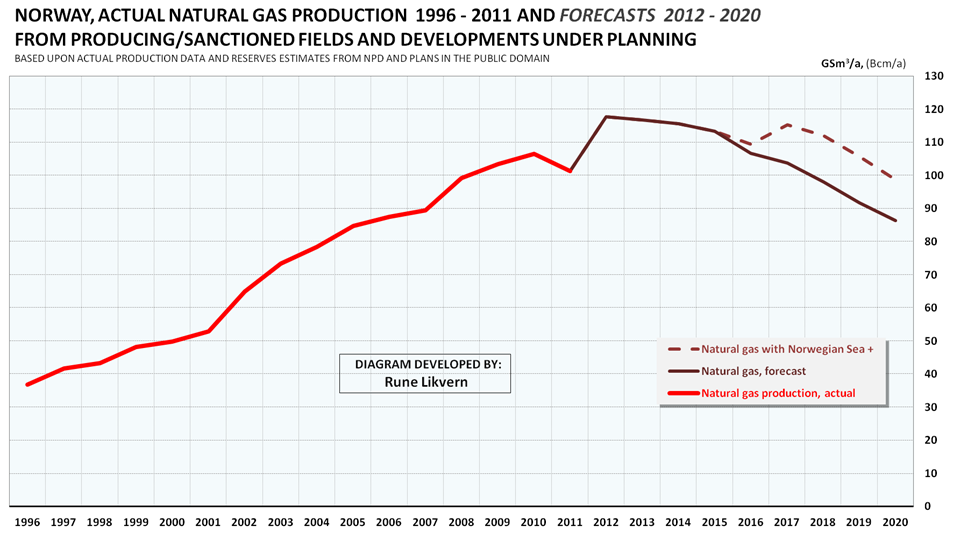
Figure 05: The chart shows actual production of Norwegian natural gas (thick red line), a forecast towards 2020 for producing and sanctioned developments (thinner dark red line) and a forecast for fields in the Norwegian Sea (Aasta Hansteen, Linnorm and 6506/6-1, dashed dark red line) in planning and scheduled to start flowing late 2016.
Plans now call for multiple coordinated field developments in the Norwegian Sea to enable a trunk line NSGI (Norwegian Sea Gas Infrastructure) to Nyhamna (receiving facility for the Ormen Lange and start of the Langeled pipeline).
The fields that are now considered for development in the Norwegian Sea are Aasta Hansteen (formerly Luva) 46 Bcm (Billion cubic meters), 1.300 meters of water, Linnorm, 24 Bcm and 6506/6-1, 27 Bcm.
These 3 discoveries are now estimated to hold a total of 100 Bcm of recoverable gas, which represents the same volume that Norway presently exports and that the UK consumes annually.
These fields in the Norwegian Sea may extend the plateau for total Norwegian gas deliveries by 2 - 3 years, (refer to Figure 5).
Based upon publicly available data it has been estimated that Aasta Hansteen has a breakeven price of 1.60 – 1.70 NOK/Scm (0.50 to 0.55 p/therm) at delivery points like NBP (National Balancing Point in Heeren) in the UK or if related to the US market, $8.00 - $8.50/Mcf at Henry Hub.
This serves as an illustration of what price buyers may expect for future supplies of Norwegian natural gas from new developments.
The chart in Figure 5 also illustrates that as this decade comes to an end it becomes harder to sustain the plateau for natural gas deliveries from the NCS, and also that the developed discoveries tend to be smaller and thus have a short plateau and most likely steep decline rates.
Contact
- Content: editors at theoildrum dot com
- Tech support: support at theoildrum dot com
License

This work is licensed under a Creative Commons Attribution-Share Alike 3.0 United States License.
Rune,
Great article, thanks. Is natural gas discovery data available at NPD? You seem to be able to find much more information there than I can. I also am a little confused by your figure 4. Is the correct interpretation that if each field were produced at its current rate (for 2011) that it would last for the number of years shown on the chart? I generally don't think in terms of R/P ratios so the interpretation was not obvious at first.
DC
Hello DC and thanks,
NPD publishes annually resource account available in both Excel and HTML.
The (NPD) estimates for the resources and discoveries are categorized in crude oil, condensates, NGLs and natural gas.
The resources are organized according to an excellent resource classification system.
The resource accounts are also available from NPDs Fact Pages .
Yes, your interpretation of R/P is correct.
-Rune
Rune,
Thanks for the info. I was hoping for something like your figure 2 from your recent post on Norwegian Oil. That chart must have been a lot of work to put together. As far as I can tell there is not an easy way of finding the amount discovered by year without considerable digging, I had hoped there was an obscure page with the info neatly on a spreadsheet.
DC
DC,
Thanks!
You are right (and few have actually noticed) about the amount of work that went into producing the chart that shows annual developments in Norwegian oil discoveries and their status (my figure 2 from the post on Norwegian crude oil). I found that to be a useful format to communicate the history of Norwegian crude oil.
The work was greatly reduced thanks to Excel and how the spread sheet was set up. When it is done (a one time effort) it takes little time to update it as new data are made available.
Best
- Rune
Rune,
I have put together yearly natural gas discoveries for Norway, they are listed yearly from 1967 to 2010. The total is 3720.4 billion cu meters and the expected URR is 5540 billion cu meters:
1.6
7.3
162.1
81.0
116.2
64.6
9.2
244.6
35.4
7.8
2.0
97.2
1545.1
10.6
281.2
39.0
39.2
188.8
73.4
67.6
35.0
5.9
30.6
19.6
6.7
28.7
0.8
93.7
0.0
18.2
325.6
50.2
0.0
7.4
7.5
0.0
0.4
0.7
0.0
0.0
2.4
10.7
1.0
1.4
These are yearly discoveries of recoverable natural gas in billions of cubic meters. The data is from the Norwegian Petroleum Directorate and was last updated 31 December 2011.
DC
(initial post in error, I left out zero values for 1995, 1999, 2002, 2005 and 2006, now corrected, my apologies)
Your table illustrates that discoveries in recent years have not kept up with production.
NPD estimates on total recoverable gas was 3 876 bill. cu.m at end 2011 for fields and discoveries.
NPD have totaled; Reserves, yet to find and improved recovery at 5 540 bill. cu. m at end 2011.
Yes the 5540 bcm was for natural gas found and expected to find, I figure the NPD knows better than I how much might be found in the future, this is their best guess and it is what I used as an ultimate. I am not sure why I don't get the same total (3876 bcm) by using the spreadsheet found at the following link:
http://factpages.npd.no/factpages/Default.aspx?culture=en
but the difference is small (around 150 bcm out of 3800 or about 4 %).
If the NPD is anything like the US EIA (hopefully not), then the estimate of URR is quite optimistic, I would think the reality may lie somewhere between your forecast and something a little more optimistic. I am assuming that your forecast has assumed that no more natural gas is found in Norway, if that is correct and you believe that the 5540 bcm estimate is not realistic (this would mean 1664 bcm from yet to find and improved recovery) would you guess that 832 bcm in new discoveries would be more appropriate? I have not followed this as closely as you have so I am trying to learn something here. Thanks.
DC
I totaled all gas in producing fields, fields shut down, discoveries under development, discoveries possible for development and discoveries under evaluation.
I have not ventured on any guesses of what remains to be found, but I take notice of NPD's estimate of yet to find.
My forecast is based on what NPD presently estimates to be produced from fields and discoveries.
Any future gas discoveries that is found to be commercial will most likely have no impact on the production profile before after 2020. This because it takes time from discovery until the discovery is developed for production.
I agree that any new discoveries will take at leat 10 years to evaluate and bring on line. Is it possible for fields to be produced more aggresively by means of enhanced recovery and extra drilling in existing fields between now and 2020? I am thinking that the rate of extraction could be increased to some degree if a peak is reached in order to attempt to maintain a plateau. I agree that no increase in output beyond 2012 is likely, but I wonder if a more gradual decline out to 2030 might be possible with agressive methods? I am not suggesting this would be the best way forward, just considering the possibilities out to around 2030. It would probably be best to reduce extraction rates so that prices would increase, just produce enough to maintain revenue.
DC
Presently some projects (Åsgard and Gullfaks South) which involves installation of sub-sea compression closer to the wells have been sanctioned. This allows for production with lowered well head pressure. This has the potential to both increase and accelerate recovery.
I have not seen any estimates on how much this adds to recoverable, but those additions are likely to be included in the annual resource accounting from NPD.
If it not conflicts with good resource husbanding it is possible to draw down natural gas reserves faster. For natural gas associated with oil these are evaluations that will have to consider the effects from accelerated natural gas draw down on total recovery of oil.
Presently there are some discussions going on about accelerated natural gas depletion (primarily involving Snøhvit), but there are lots of considerations that has to be made.
Only field that has some potential beyond 2020 is Troll, but a harder draw down on gas from Troll would impact the total oil production/recovery from Troll.
Things may look different 10 years from now.
Hi Rune,
To test the General Shock model against your more realistic model, I have created a model for Norway’s natural gas production based on discovery data found at the Norwegian Petroleum Directorate (NPD) see chart below for discoveries of natural gas in Norway:
Larger chart at: https://sites.google.com/site/dc78image/images/natgasdisc.png
Note that this chart cuts off the larger yearly discoveries above 200 billion cu meters(bcm), but each point is labeled, four years (1974, 1979, 1981, and 1997) had annual discoveries greater than 200 bcm and 1979 stands out as the Troll field was discovered that year (37 % of total natural gas reserves discovered in Norway so far are in Troll.)
I used WebHubbleTelescope’s General Shock Model with fallow, build, and mature times of 5 years. These time frames worked well for models of Norwegian oil production and I assumed they would work well for Natural gas as well.
For years after 2011, where we have no discovery data, I used a dispersive discovery model to fill in potential future discoveries. The NPD predicts (their mean estimate) a URR of 5540 bcm that includes improved future recovery methods, future discoveries, and the natural gas discovered to date.
Below is a chart of actual discoveries up to 2011 and the future discoveries from 2011 to 2080 which give a total close to the 5540 bcm NPD estimate. Mature reserves are also charted (these are reserves that are ready for production) and are found by subtracting cumulative production from cumulative mature discoveries. Note that in 1979 annual discovery is off the chart at 1545 bcm.
Larger chart at: https://sites.google.com/site/dc78image/images/norwresvdisc.png
In order to match the model with historic output the extraction rate from mature reserves must vary. The historic rates are used to guess at future extraction rates which we assume will follow the historic pattern. The extraction rate profile is below:
Note that extraction rates quickly rose to 20 % in 1980 3 years after the start of natural gas production As more mature reserves came on line the extraction rate decreased to as low as 2 % in 1993, this may have been due to problems with equipment or possibly pipeline bottlenecks. After 1993 mature reserves continued to increase until they peaked in 2005, extraction rates increased slowly from 1993 to 2000 and then increased at a linear rate up to 2010, I assumed this increase in extraction rate would continue at this rate out to 2068 where the rate reaches 25 % and then it is held level at 25 % until 2080.
As Rune might point out, this is unrealistic because as the fields deplete it may be impossible to keep the rate of extraction at high levels due to a drop in pressure (though the fields might be injected with water to keep the pressure up this would raise costs). For this reason my model may be overly optimistic, particularly in later years. Up to 2037 the extraction rate stays below 15 %, it reaches 10 % in 2023. With these caveats, the model is below:
Larger Chart: https://sites.google.com/site/dc78image/images/norwnatgas.png
The model peaks in 2013 at about 117 bcm/year and then declines back to 2010 levels by 2020. Newly discovered fields (these may or may not be found) slow the rate of decline out to 2030 then decline accelerates out to 2040 and then declines at 3 bcm/year up to 2050. The following chart compares Rune's forecast for all Norwegian Natural gas with the shock model out to 2020 (Rune if you would not like your chart used as a background for comparison, let me know and I will modify the chart.)
Larger version at: https://sites.google.com/site/dc78image/images/norwgasfcastlg.png
The model agrees fairly well out to 2019, it is a little low in 2012 and 2017 and a little high in 2015, 2016 and 2020, but overall some degree of confidence that the model is in the ballpark. To account for an uncertain future scenarios are created for optimistic and pessimistic outcomes in hopes of outlining the range of possibilities.
I am also considering models where future extraction rates are limited to 15 % and 10 % at most, as well as a plateau scenario where extraction rates increase more quickly in order to keep output at 110 bcm for a longer period with a sharper drop off thereafter. Any suggestions are appreciated.
DC
Hello DC,
Thank you for sharing your work. I find it both impressive and interesting.
With regard to 1993, there may have been, let me for now call them “commercial” reasons that may explain the divergence.
In 1993 (IIRC) a new pipeline (Zeepipe I, linking Sleipner and Zeebrugge) started operations simultaneously with natural gas production from Sleipner A. 1993 was the year when natural gas deliveries on long term contracts started.
Oil/natural gas prices seems increasingly to affect (timing of) both exploration and development decisions.
Future discoveries is hard to predict also as huge areas of the Barents Sea has not seen a drill bit yet.
So far in 2012 (and from memory) an estimated 30 Bcm has been discovered (there are still some months left of 2012). As oil is more energy dense and thus comes with a premium relative to natural gas (as oil is more easily moved into the market that gives the highest price) the oil companies now seem to have favored drilling the prospects that holds a high probability for holding oil.
For 2011 NPDs resource accounting had the following estimates on discoveries by resource category;
RK 5; 9 Bcm
RK7; 43 Bcm
How would the Shock Model come out if say discoveries remained in the range of 30 – 50 bcm for the years 2012 to 2020 and then a new wave of discoveries came in from around 2020 from the Barents Sea?
If discoveries are made in areas without market access, they may be fallow until a solution for market access is found (pipeline/LNG). Some discoveries may also become victims to time criticality; that is the supporting infrastructure that their economics depend on may be closed down before the discovery can be developed and start to flow. Price is again an important parameter.
Water injection is rarely used as method (too costly) to increase natural gas recovery.
In my forecast it is indicated that the potential for deliveries will peak in 2012. It may turn out that actual deliveries become less than the potential during 2012 which leaves the possibility for a peak in 2013…or later.
For all practical matters it now appears as Norwegian natural gas deliveries is on a plateau that will last to around 2015/2016 and which may be extended 2 or 3 years if developments under consideration in the Norwegian Sea are sanctioned and starts to flow as presently planned for.
Changes to economic activity within countries that buys Norwegian natural gas may affect actual deliveries/production.
Rune,
Thanks for the detailed response. If the discoveries are smaller, the model will clearly change, I could try the model as you propose, but keep in mind that discoveries in 2012 to 2020, are assumed to affect output 7 to 10 years later as they move from the fallow, to build, to mature, and finally to produced natural gas. The "discoveries" in the 2012 to 2020 period cause the flattening of the model 2020 to 2030. I will try it at 40 bcm from 2012 to 2020, with dispersive discovery after that, keep in mind that a large field can be found at any time so this model would tend to err on the pessimistic side. Also, if extraction rates could not increase beyond 10 % or 15 % the output is somewhat lower especially in the later years. Consider the following charts (note that the limit 25% is my first model):
I will try the model with fewer discoveries between 2012 and 2020 and add the data for 2011 which you have provided.
DC
DC,
A couple of things (I do not know how that influences your model).
Some fields are facilities constrained due to a combination of reasons, like presently Snøhvit with 1 LNG train at 5 - 6 Bcm/a.
Troll (due to a combination of optimization of oil production and capacities at receiving facilities at 27 - 30 Bcm/a.
That affects extraction rate, which would thus accelerate with time.
Then there is the seasonal variations in natural gas production.
I agree, one never knows when a bigger field may be found, which clearly (due to size and economics) could change the forecast.
If a discovery of say 200 Bcm were to be made anytime in the near future, it could still take roughly 10 years before it started to produce.
Rune,
My model (actually WebHubbleTelescope's model) is not sophisticated enough to explicitly account for the supply limitations that you mention except by limiting extraction rates. This works fairly well in the sense that only natural gas that can be delivered by existing facilities will be extracted, so the limitations you mention have the effect of placing some upper limit on extraction rates.
As fields deplete there are fewer mature reserves, so if the amount produced stays constant, then the extraction rate can rise.
To make the example concrete, Troll had roughly 1400 bcm when discovered and has produced about 400 bcm total through the end of 2011. Over the last few years production has been around 30 bcm, let’s assume output is 30 bcm in 2012 and there are 1000 bcm of reserves, the extraction rate for this field would be 3 %. Now assuming output remains at 30 bcm for 2012 to 2020, this is a total of 270 bcm so that reserves would be down to 730 bcm and again assuming 30 bcm is produced in 2021, the extraction rate has now risen to 4 %.
When this process is considered for all Norwegian gas fields (which I have not done in detail, only in the abstract), you can see how extraction rates might rise as fields become depleted.
I agree that any discoveries from 2012 to 2019 (no matter how large) are unlikely to have an impact on the forecast out to 2020, I include them to see how things might play out beyond 2020. Even with the optimistic discovery profile that I propose, although the rate of decline slows somewhat, output continues to decline and then drops steeply after 2040. This is even with the rising extraction rates from 6 % in 2010 up to 25 % in 2068 (a linear rise following the historic pattern fom 2003 to 2010.)
I have added a comment at the bottom because my charts were being cut off as the thread became narrower, this shows a model where discoveries are limited to 40 bcm from 2012 to 2019 as well as a plateau model with higher extraction rates.
DC
Excellent article, Rune
Do you have historical consumption and forecast demand figures for Norway?
Hello Harry,
I do not have historical data on Norwegian nat gas consumption and forecast demand.
Thanks
BP, of course, will have the historical.
Somewhere the Norwegian Gov't will have realistic forecast demands (he said, hopefully).
Norwegian natural gas consumption is very small compared to production. Less than 1% of production goes into the Norwegian market, as 98% of electricity is made by hydro, not gas or coal.
That is a very important fact.
Thank you.
Hi Rune,
I created a model for Norwegian Natural Gas with 40 bcm discoveries from 2012 to 2019 and then used a dispersive discovery model to fill in discoveries from 2020 to 2080. The discovery chart is below with 1979 off the chart at 1545 bcm:
link to chart: https://sites.google.com/site/dc78image/images/norwgasdisc2.png
I used the same extraction rate profile as my original model (25 % limit on extraction rate) so I could compare the original (model lg) with the new model (model sm) that has smaller discoveries from 2012 to 2019. I also created a plateau scenario for the smaller discovery profile, both extraction profiles are shown in the chart below, model s+l is the profile for the small and large discovery profiles.
link to chart https://sites.google.com/site/dc78image/images/extrategas4.png
The final chart shows the three scenarios, two of these (model sm and plateau) are based on the smaller discoveries between 2012 and 2019, the third (model lg) is my original model based on larger discoveries between 2012 and 2019.
https://sites.google.com/site/dc78image/images/norwgas2.png
Note that model lg and model sm are similar up to 2019 and then diverge. The plateau model is to demonstrate that a small boost in extraction rates can maintain a plateau for a few years, but there is a limit to how much these rates can rise. I chose 13 % in 2023, though 11 % in 2020 would have maintained a plateau through 2020, attempts to maintain a plateau result in a steeper decline at the end of the plateau.
DC