| Tech Talk - China's Coal Industry | The Oil Drum | Tech Talk - Conclusions on the Chinese Energy Situation |
Blow-by-Blow PV System Efficiency: A Case Study for Storage
Posted by Euan Mearns on September 21, 2012 - 12:07pm
This is a guest post by Tom Murphy. Tom is an associate professor of physics at the University of California, San Diego. This post originally appeared on Tom's blog Do the Math.
A short while back, I described my standalone (off-grid) urban photovoltaic (PV) energy system. At the time, I promised a follow-up piece evaluating the realized efficiency of the system. What was I thinking? The resulting analysis is a lot of work! But it was good for me, and hopefully it will be useful to some of you lot as well. I’ll go ahead and give you the final answer: 62%. So you could peel away now and risk using this number out of context, or you could come with me into the rabbit hole…

System Recap
I started small, with two panels and a handful of parts. Intent on learning the ropes, I built two independent systems—one for each panel. I described the initial system(s) in a 2008 article in Physics Today. The system has since evolved to the point that I now have eight 130 W panels and four golf-cart batteries providing 60% of my home electricity needs. Primarily, the system powers our refrigerator, attic fan, television and associated entertainment components, two laptop computers, the cable modem and wireless hub, and a printer. Occasionally I’ll throw something else on the PV (in much the same way an Australian might casually throw some shrimp on the “barbie”). The current system is described in an earlier post.
I now have two-and-a-half years of stable operation/configuration, and I collect data as impulsively as a squirrel collects nuts. I use the Pentametric system to measure three currents and two voltages in the system, which lets me monitor energy use, battery health, etc. I collect the data in five minute intervals (accumulated, not sampled), and have nearly uninterrupted data spanning years. Are you ready for me to unload it on you?
What’s Being Measured?
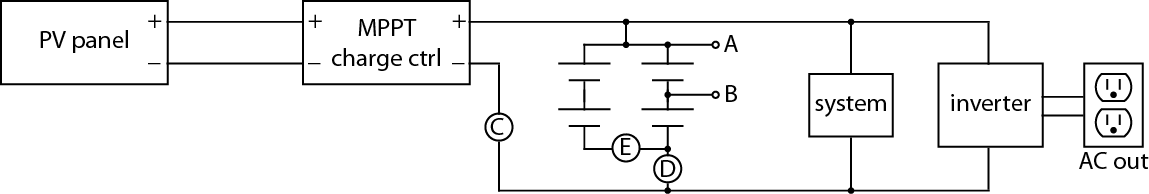
Almost all of the analysis to follow comes from the Pentametric dataset. Currently I have the system configured to monitor:
- VA: the battery bank voltage, across the 2×2 series/parallel arrangement of 12 V golf-cart batteries;
- VB: a mid-point voltage on one of the two battery chains, of secondary value;
- IC: the current supplied by the charge controller into the rest of the system;
- ID: the net current into/out-of the battery bank;
- IE: the net current through a single parallel chain of the battery bank.
VA times IC gives the power delivered by the charge controller. We’ll call this PMPPT, where MPPT stands for the maximum power-point tracker charge controller. VA times ID gives the net power going into or emerging from the battery, which we’ll call Pbatt. ID minus IE gives the current in the other (unmonitored) battery chain, for checking that one chain is not unequally splitting the workload. Once we account for any input current from the solar side, and the net current into the battery, the difference constitutes the total load. At night, when the solar current is zero, the story is simple: the battery must do all the work, so whatever current escapes is going to the load. In the daytime, the battery may or may not be receiving charge depending on whether the solar input exceeds load demand at that moment.
A Peek at the Data
So what kind of information can we get from the above data? The plot below represents a simplified version (leaving out the battery competition piece) of something I look at daily to check the system performance.
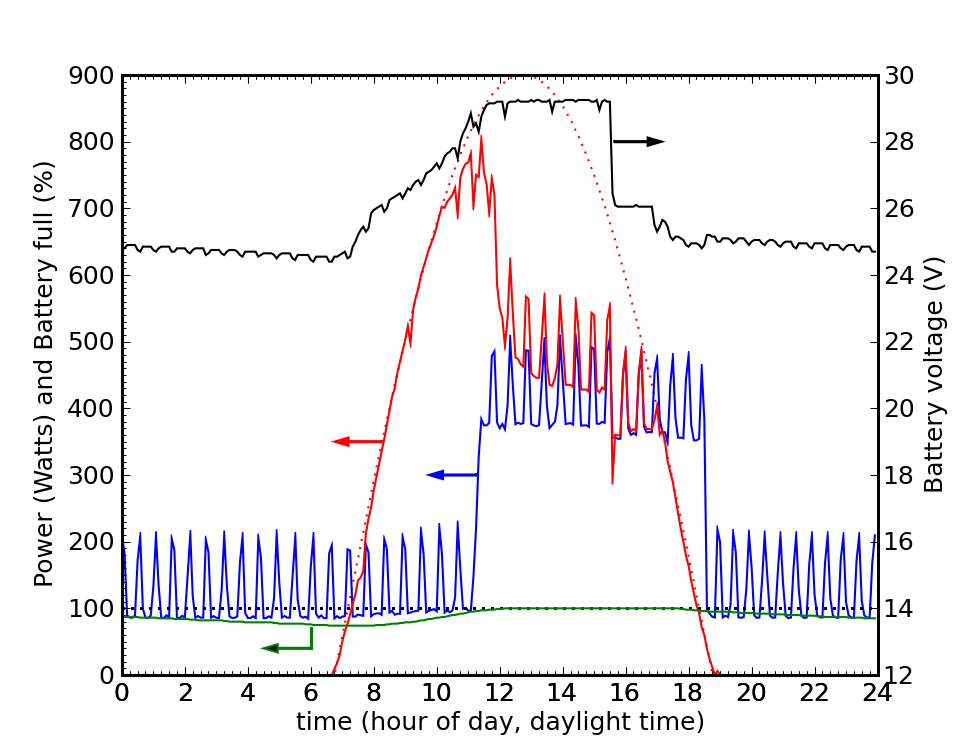
Lots going on here. The red curve that starts out smooth and becomes jagged is the solar input (more exactly, the charge controller output, PMPPT). In a grid-tied system, without having to cater to a stuffed battery, the solar curve would resemble the dotted red curve in the absence of any clouds. The gap between the two red curves indicates the rejected solar resource: part of the cost of maintaining well-conditioned batteries.
The blue curve is the load. All the spikes are from the refrigerator, and the attic fan makes the big bulge mid-day. The attic fan begins demanding juice right about the time the battery is full and begins to refuse more food. This makes for a beautiful pairing: the attic fan only activates on sunny summer days, when the solar resource is abundant, and the batteries are mostly recharged by noon. The baseline is comprised of the constant load of modem/wireless, a 20 W TiVo (since eliminated), standby power of various devices, the inverter baseline power, and the power provided to PV system components (monitoring, communications, etc.). I can tell from the plot that no television activity took place that particular evening. Actually, we were in Seattle, so the house was pretty quiet.
The black curve is the battery voltage (right-hand scale). Every fridge cycle takes a small bite out of the voltage, until the battery reaches its “full” voltage, and transitions from “bulk” charging to “absorb state” charging. After some preset amount of absorb time (4 hours in my system), the battery is declared to be full, and put on a trickle diet called “float” stage. At this point, you can see the power supplied by solar (red) is barely higher than the load voltage (blue). It takes only about 10 W to maintain the float state. At about 5 PM, the solar input fell below the load demand (attic fan still on), and the battery voltage began to sag as it discharged—the system no longer rejecting incoming energy. When the attic fan shut off, the battery voltage recovered slightly before beginning its long nightly decline, scalloped by fridge bites.
Note also the declining amount of power needed to maintain absorb state, ultimately settling to a level a bit over 50 W. Each time the refrigerator comes on, more solar power is demanded, but always about 50 W more, so the battery sees the same net input. A clever load may be able to just match the difference between supply and demand. The attic fan approximates this function, but only crudely so. I do have some control, in that I can flip a switch and put the attic fan back on utility. In hot streaks, the attic fan can become a bit much for the PV system.
Finally, the green curve at bottom is the battery state of charge. It’s pegged at 100% for most of the afternoon, declining to about 70% by the end of the night. In warmer weather (in a non air-conditioned house), the refrigerator demands more power, so the battery sees more overnight drain. But in this sense, the supply and demand are somewhat matched. The refrigerator demands less energy in winter, when less solar energy is available.
Energy Produced
Before we talk efficiency, let’s just have a look at the energy haul over the last 30 months. Presto—we have a graph:
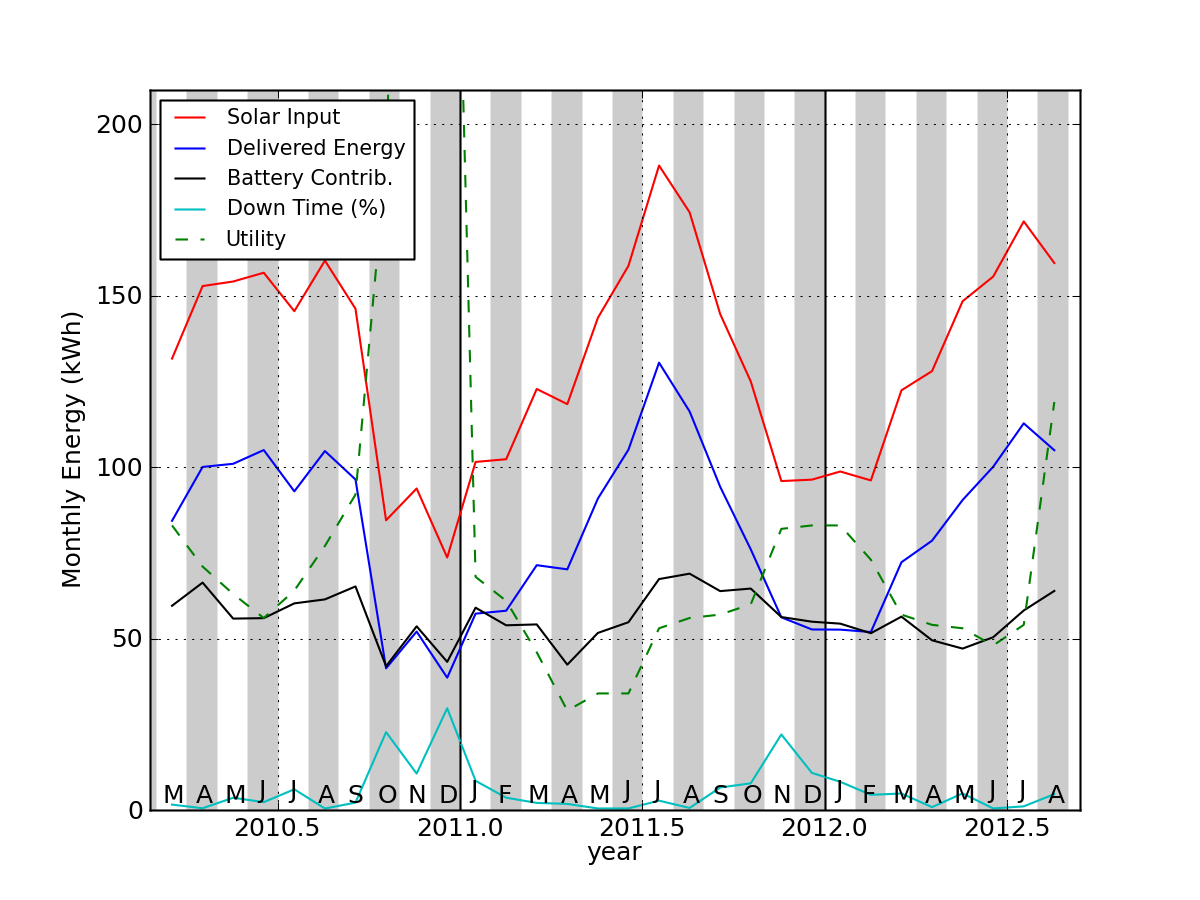
Obviously more solar energy is harnessed in the summer months. Various inefficiencies knock the energy down from the red curve to the blue curve by the time the energy is delivered indoors. The black curve is how much energy came out of the battery, but before inefficiencies are tallied. So it is best compared against the red curve (also pre-efficiency-cut) to get a sense for the role that batteries play throughout the year (more important in winter). The worst system down-time was December 2010, when clouds kept the system shut down for 220 hours, or 29% of the time, at one point being down for five days straight.
The green dashed curve representing utility power has three noteworthy anomalies. In the Fall of 2010, we had a housesitter, who used 190, 464, and 389 kWh in three months, blowing our typical 60 kWh out of the water. Second, we were away during the Spring of 2011, this time producing an anomalously low utility footprint. Finally, August 2012 featured a two day air-conditioning experiment featured in a recent Do the Math post. Yeah, that’s going to leave a mark. Look at the sacrifices I make for you folks!
System Efficiency
So how well does the system perform, after we account for all the nickel-and-dime tolls of inefficient components? To answer this, we need a model for the energy flow in the system.
We’ll start with the solar input. Sure, the PV panels convert about 16% of incident radiant energy into useful electrical power, and I lose something like 2% in the delivery wires. But let’s start our accounting where the wires meet the charge controller. We denote efficiencies by the Greek letter, eta (η). The power delivered by the MPPT charge controller is PMPPT = ηMPPTPsun, where Psun is the input solar power at the end of the delivery wire. So the MPPT (muppet) takes a little off the top.
The positive output terminal of the charge controller is common to the entire system: the battery, inverter, and any auxiliary devices are connected to this node. So power flows to the inverter, to the system components, and alternately to and from the battery from this point. The battery is not 100% efficient at storing energy, so more energy is put in than extracted, on balance. We can therefore imagine a net flow of power from the charge controller to all components.
What we care about at the end of the day is how much energy (or average power) is delivered to AC devices within the house. All of this must channel through the inverter (I use no DC appliances in my house).
The inverter takes some power in, and delivers less out. In practice, it looks like Pdeliv = ηinvPinv, where ηinv ˜ 0.885 for my system (measured numerous ways using Kill-A-Watt and Pentametric in tandem), and Pinv is the input power destined for delivery to an appliance. But that’s not the whole inverter story. The inverter takes an additional constant power draw, even to sit idle—another special “feature” of off-grid systems. For my inverter, this is a maddening 20 W! We’ll call this Pbase.
To round things out, we have net power going into the battery, Pbat (on a long time average, the battery is a net drain). And we have various devices, like the monitor, the display, the communication hub, the “Mate” display, and the terminal server for internet connectivity. These are DC devices that pull power directly from the DC system, bypassing the inverter. We’ll call power going to this amalgam Psys.
So are you ready? We end up with a power available for conversion at the inverter:
Pinv = PMPPT - Pbat - Psys - Pbase.
You with me? This just says that the charge controller is nice enough to provide energy to the system, but lots of hungry mouths just take and take, reducing the amount available for conversion to AC power. At least the battery regurgitates some of its intake when needed—but always keeping a little for itself.
So we can form an end-to-end expression by sticking in the efficiencies, ηMPPT and ηinv:
Pdeliv = (PsunηMPPT - Pbat - Psys - Pbase)ηinv.
Okay, so this is the master efficiency equation. Once we compute Pdeliv, we can compare this to Psun to get a total system efficiency: ηtot = Pdeliv/Psun.
Direct measurements from the Pentametric tell me PMPPT = ICVA and Pbatt = IDVA. I know that when the inverter determines that the batteries are low and switches to utility input, all that’s left loading the system is Psys, which I measure to be 9 W. I also know that when I unplug all devices from the AC delivery system, all that’s left is Psys + Pbase, from which I learn that Pbase = 20 W. In performing the computation, I must also be cognizant of when the inverter is on or off, so that Pbase is not always counted.
So we’re almost there. The last piece is ηMPPT, which I am not outfitted to measure directly (would need the Septametric, not yet marketed). Fortunately, the Outback company provides excellent data on their products, and they have a set of graphs for different configurations of their MX60 charge controller. For my setup, the curve they provide is reasonably fit by ηMPPT ˜ 0.991 - 13.5/PMPPT. This means that if I’m pulling 500 W through the charge controller, it’s expected to be 96.4% efficient, losing something like 18 W in the conversion.
Right. When we put it all together, my system over the last 30 months averages—you guessed it—ηtot = 62.2% efficient. Over this time, my system received an average of 4.3 kWh of input per day, and delivered an average 2.7 kWh into the house. Over the last 20 months (for which I have TED data), our average utility energy use is 1.8 kWh per day. That makes for a total daily electricity use of 4.5 kWh, 60% of which is from the PV system. The inverter was on 94% of the time, the other 6% spent rerouting utility power while waiting for the Sun’s return.
A Step Backward
Hold on. I have 8×130 W panels on the roof, for a total of 1040 W. According to the NREL database (see my exposition of this), San Diego should be getting about 5.7 kWh per day for each 1000 W of panel. I should be receiving 5.9 kWh per day, not 4.3 kWh. The implied mystery efficiency is around 75%.
Two things are happening here. The lesser evil is that my panels are not free of shading influences, especially in winter afternoons. But more important is that I have batteries. If the system is designed appropriately, batteries are periodically fully charged, and refuse some potential power. This is a practical inevitability with battery-based systems: if you want the batteries to properly charge, occasionally equalize, and thus live longer, you must be prepared to reject excess power sometimes.
Conveniently, some friends of mine have a ~2.6 kW grid-tied PV system (12×216 W panels) on a roof only a few miles (km) from my house. The system has excellent exposure, and an online database I can access. If I select sunny days when my batteries never reached absorb state (digging their way out of a deficit from days prior), and thus never rejected any incoming power, I can compare our systems and see that my friends reap about 2.65 times the energy that I do on these days. Armed with this conversion factor, I can now look at any and all days to learn how much energy I would expect to collect if my stupid batteries didn’t refuse extra juice. I find that on average my system accepts 87% of the energy that would nominally be available. Not terribly bad. On a monthly basis, the worst case is 72%. I’m not entirely accounting for my 25% shortfall of the NREL expectation, but I’ve closed the gap.
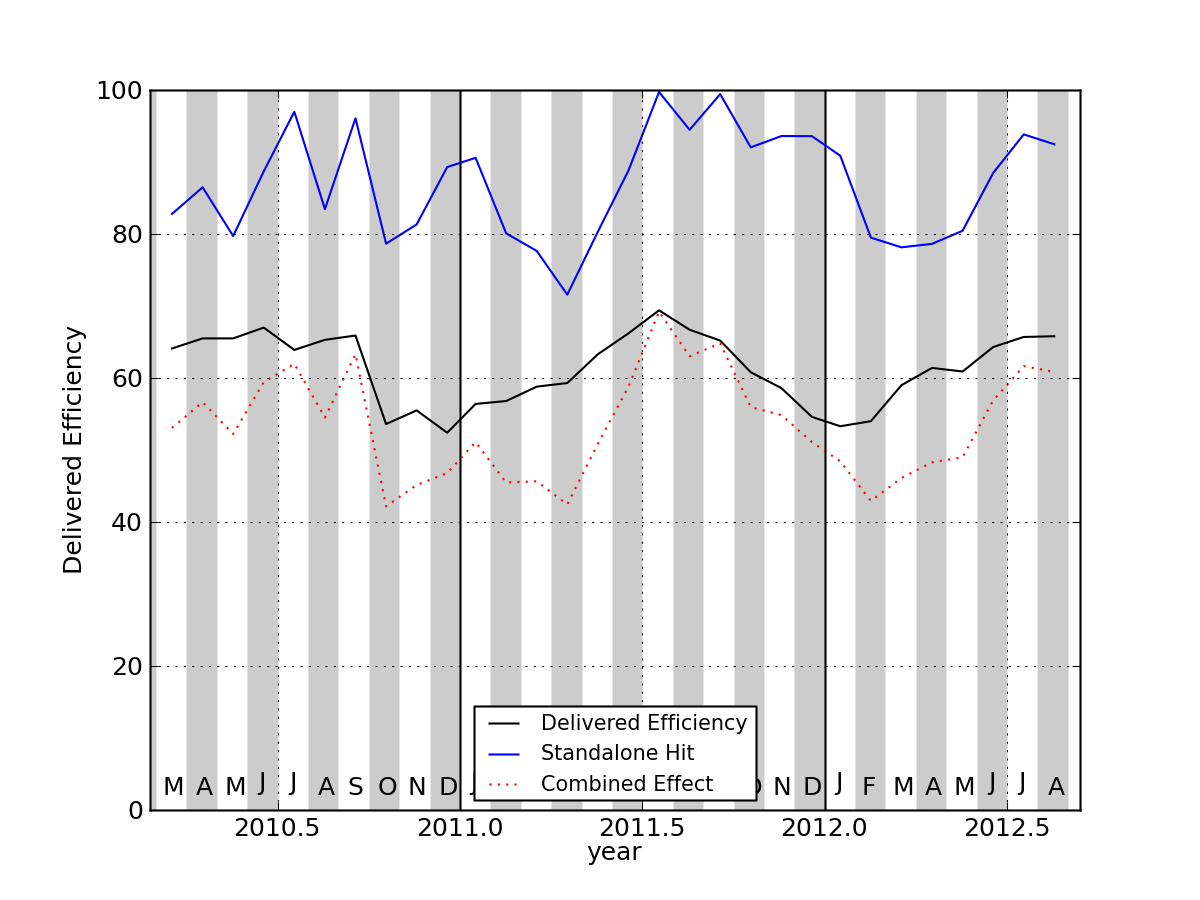
Above is a plot of the monthly system efficiency (the one that averages to 62%, weighted by energy, not by month), in black. Also plotted (in blue) is the fraction I capture relative to what I would expect from scaling my friends’ PV performance. The red dotted line is the combined effect. Incorporating this, I get a net performance compared to a grid-tied system of 55%.
One oddity of the plot above is a few months when my system appears to be getting nearly 100% of the available energy. This tends to happen in months plagued by a marine layer of clouds. The ragged clouds dissipate sooner the farther one lives from the ocean. My house is a bit farther from the ocean than my friends’ house, so I could easily believe that I’m receiving more direct sun on a number of these days, boosting my figures a bit. It is also true that the attic fan taxes the system in the summer, so I spend less time in absorb state rejecting power. I more efficiently grab solar energy, but at the expense of not fully satisfying the fussy batteries.
Component Efficiency
From before, we saw that my off-grid system converts 62% of the solar energy it accepts into energy we use in the house. Where does the other 38% go? We can reframe the problem into additive (subtractive) component contributions, fcomp, such that:
ηtot = (1 - fMPPT - finv - fbat - fsys - fbase).
We additionally stipulate that
(1 - fMPPT - finv) = ηMPPT/ηinv,
and that the ratio (1 - fMPPT)/(1 - finv) is equal to ηMPPT/ηinv.
Doing this, I get that fMPPT = 0.048; finv = 0.112; fbat = 0.080; fsys = 0.044; and fbase = 0.093. In other words, out of the missing 38%, inverter inefficiency takes the largest, 11.2% bite. The DC components in the system take a 4.4% bite, and so on. They add to 38%. A plot shows trends over time.
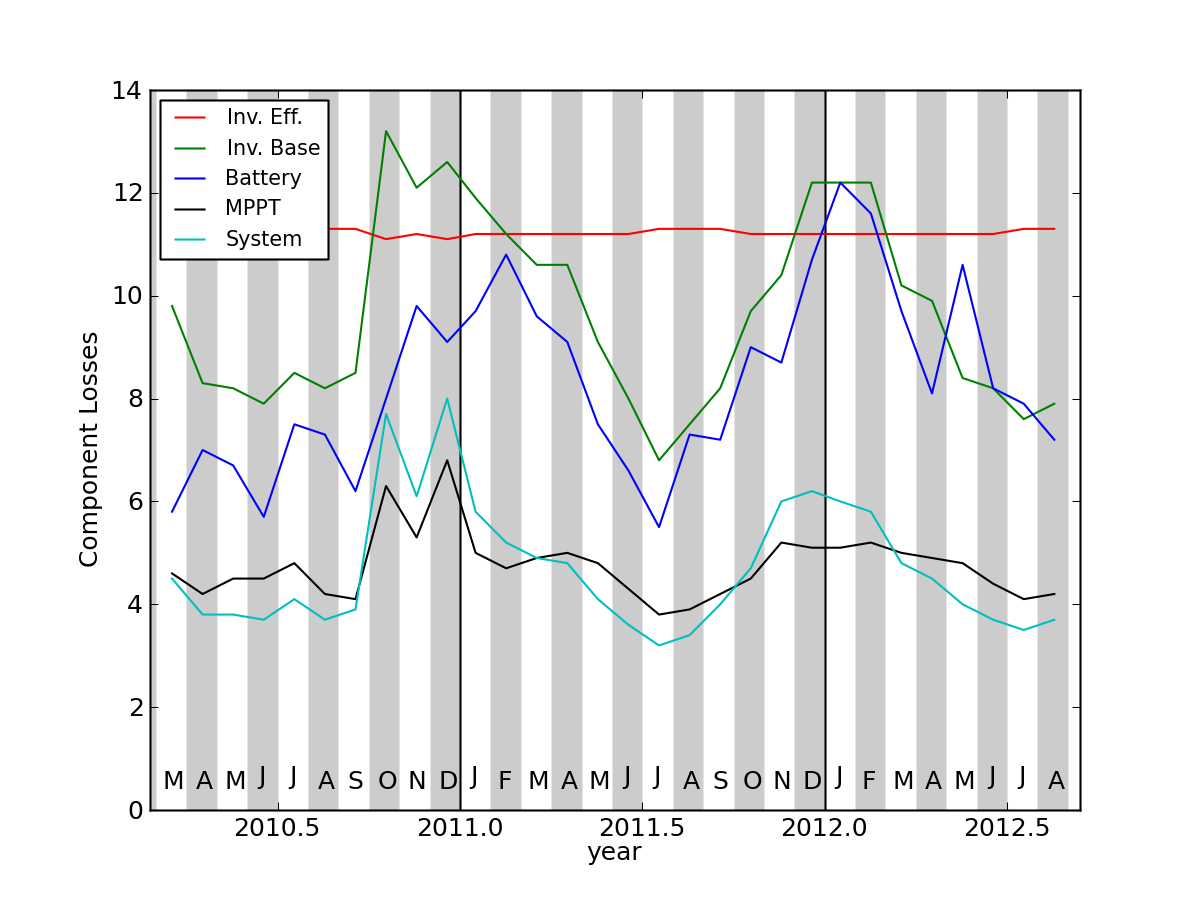
In the winter, when the attic fan does not blow, and the refrigerator cycles less frequently, the inverter baseload becomes a more prominent fractional draw. Long winter nights and winter storms also mean that the batteries spend more time contributing power, and at a lower average state of charge. More of the system energy goes into charging batteries during this time of year, increasing their contribution to inefficiency.
A Look at the Batteries
It’s a lot for one post, I know. But the battery part probably doesn’t justify a post of its own, and we’ve come this far. So one more bit of exploration…
We can monitor how much current runs into and out of the batteries. The current times voltage is the power in or out. If we just count current, the relevant metric is current times time, or amp-hours (Ah). A battery is rated for how many amp-hours it can provide. For my system, I see a 92% charge efficiency, meaning if I put 100 Ah into the battery, I’ll get 92 Ah back. Energy efficiency is not quite this good, because the battery is at a higher voltage when putting charge in (look at battery charge curve in the first graph). Putting 1 Ah into a battery at 27 V will cost 27 Wh. But pulling that same 1 Ah back out at 24 V will only deliver 24 Wh of energy. So it goes. I get 83% energy efficiency on the average. Not terrible, all things considered.
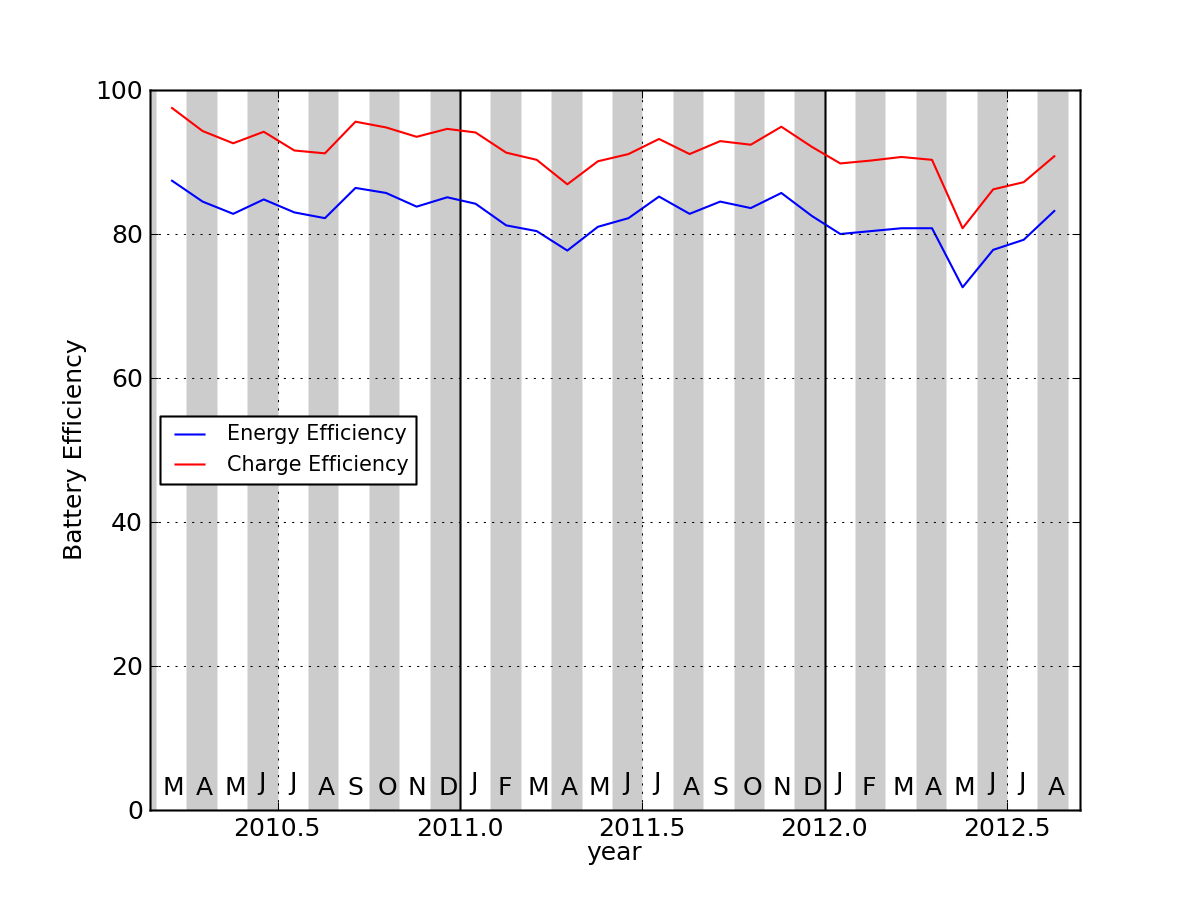
Above is a month-by month plot of the charge efficiency (red) and the energy efficiency (blue). Looks like perhaps a bit of decline with time.
If your wits have not been overly dulled by this long post, you might have caught yourself wondering how I can tell you that the batteries are 83% energy efficient, yet earlier computed fbat = 0.080, or an 8% effect. Why not 17%? What am I hiding?
The key is that the batteries do not supply all the energy to the inverter/system. Generally speaking, this happens at night. And generally nights comprise half the time. Also relevant is when the big loads are demanded. Our use of an attic fan shifts load demand to the daytime, so much of the energy input from the sun goes to directly driving appliances while the batteries are being charged in parallel. It so happens that over the last 30 months, I compute that 50.2% of the total system load has been sourced from the battery. If we had no night-time loads, this number would drop, and if we had only night-time loads, it would approach 100%. It’s almost coincidental that I land so close to 50%. But 50% of the 17% energy deficit is pretty close to our 8% decomposition.
Battery Health
I can also look at battery health in one other way. The Pentametric knows my battery amp-hour rating (though I lied to it and said they were 125 Ah, not 150 Ah batteries). As it watches current flow in and out, it keeps track of the state of charge, accounting for a nominal charge efficiency. When it senses a successful absorb condition (high voltage, low current demand), it resets to 100%. In practice, this dead-reckoning comes out pretty close to the mark, so that the 100% recalibration is hardly needed.
But as the battery wears down, its capacity diminishes, so the same energy withdrawal will leave the system more depleted, showing a lower voltage. The manufacturer of my batteries (Trojan T-1275) provided a table of numbers for state of charge (%) and associated voltage at zero current draw. It’s that last bit that really catches. An active PV system never has the batteries disconnected and seeing zero current (especially not for the recommended few hours before the voltage settles to a reliable value). What to do?
Well, if we can develop a relationship between voltage, state of charge, and power output of the battery, we can “correct” to zero power, yes? Looking only at times when it’s dark (so the battery is only in discharge), we can try to fit the observed voltage with a simple function like V = V0 + a×SOC + b×P, where V0 is the (unknown) voltage of a dead battery at zero load, SOC is the state of charge (%), and P is the load (negative), in Watts; a and b are coefficients to be discovered. The ideal fully charged voltage at zero load becomes Vfull = V0 + 100a.

Above is an example fit for one “day” of data. Only nighttime points are used. The red fit line is not perfect, but does an okay job for such a simple, linear model. Note the defrost cycle just after midnight. For this example, we deduce the full-state voltage to be 25.51 V. The value a = 0.03095 means I drop 0.03 V for every percent reduction in SOC. We interpret b = 0.001 to mean that a 400 W load (like refrigerator defrost) will drop us 0.4 V.
Now what happens if we run this on a boatload of data, deriving individual fit parameters for each night? We get the following plot:
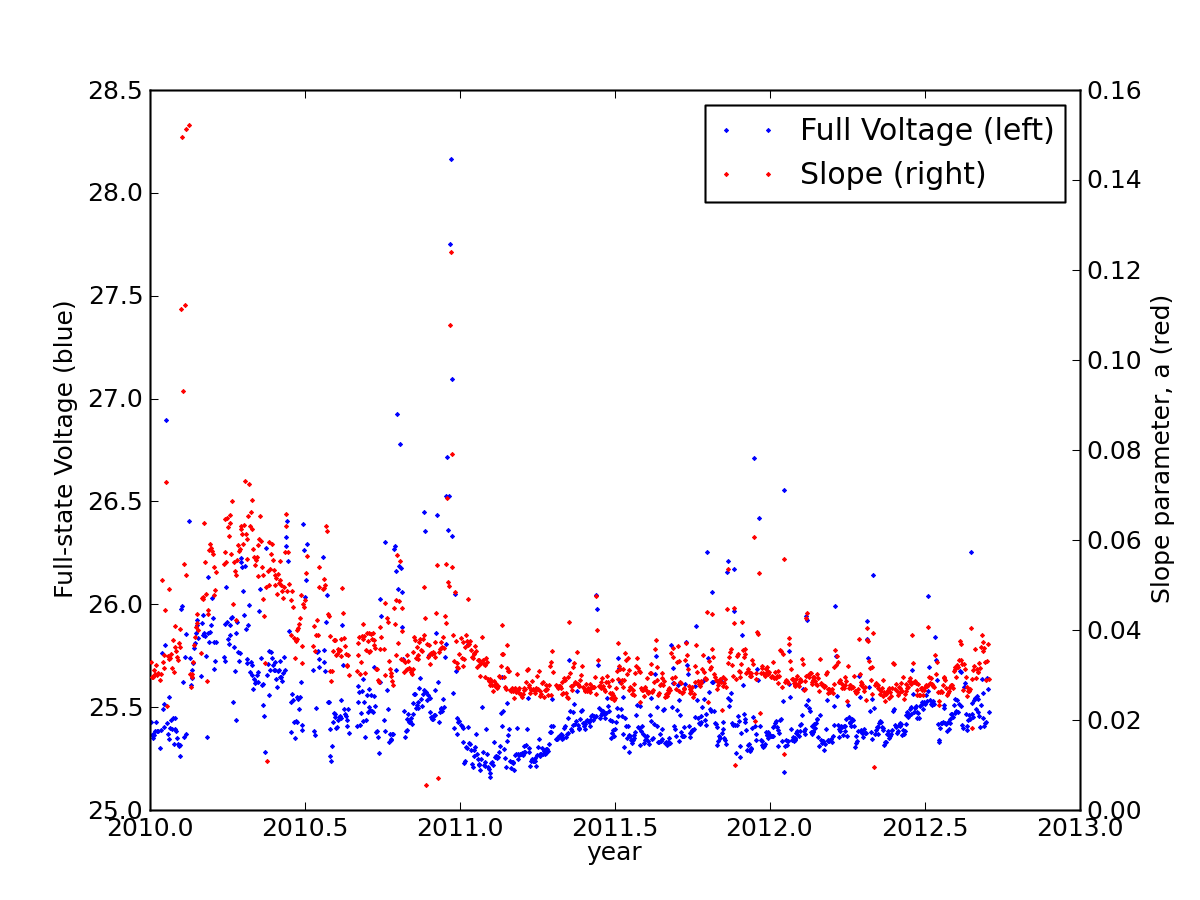
The thing that jumps out at me is the trend toward stability: the battery behaved a bit more erratically early on. The curves are tightening up of late, and pretty stable. But what do these parameters mean? I care most about the slope, representing parameter a in the fit. I care about it because I don’t want to see the battery lose voltage very fast. The SOC value is based on dead-reckoning of how much current has been drawn out. For a given withdrawal amount, the smaller the impact on voltage, the larger the effective capacity. So the fact that the slope is decreasing over time seems like great news!
The two measures are correlated by virtue of the fact that the “full-state” voltage is extrapolated to 100% SOC using—yup—the slope.
And one last trick. If I collect SOC values from the Pentametric and corresponding load-adjusted voltages based on the fits for each night, I can plot one against the other and make a best-fit line. The raw data are rather scattered, so I only plot the fit line for each of three years.
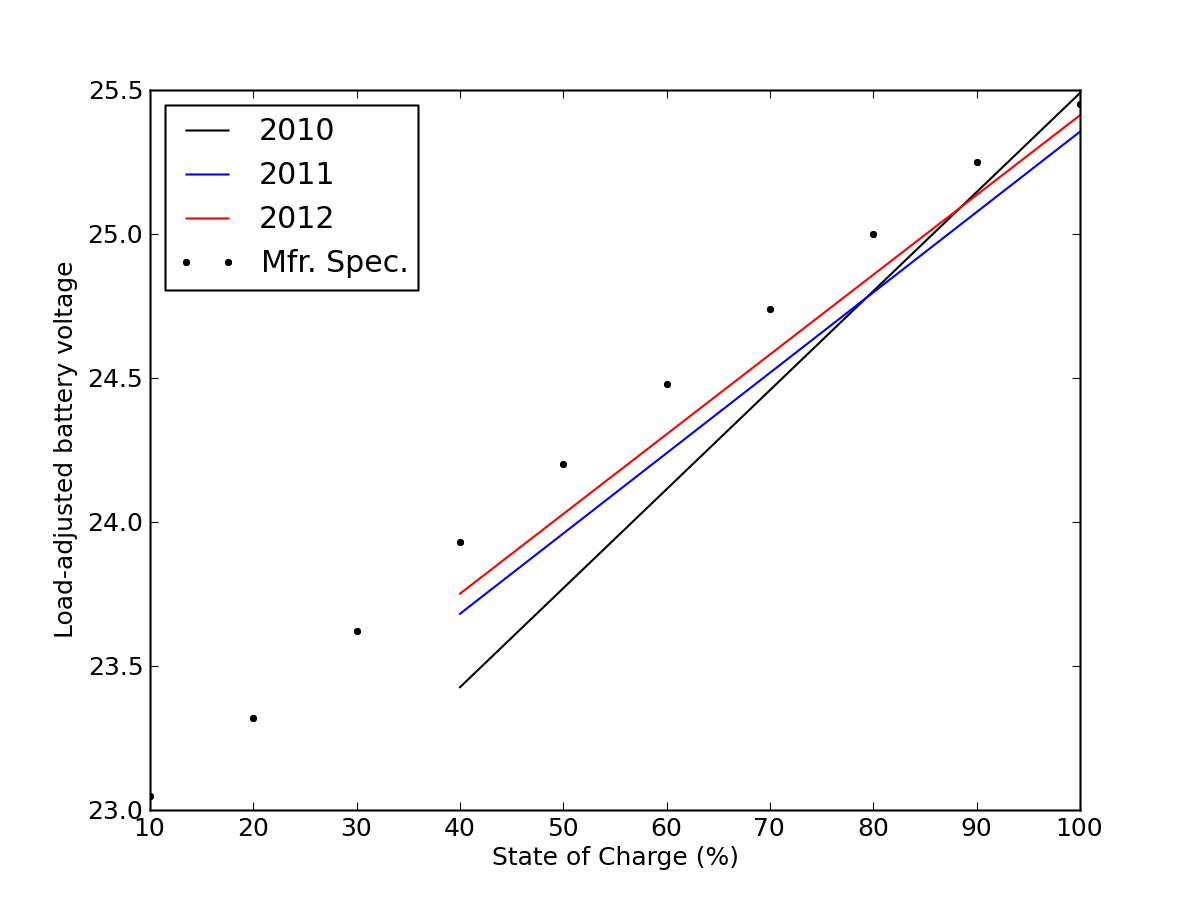
We see a similar pattern emerge here: the slope is softening (improving) over time. The manufacturer’s tabular values for this battery (the Trojan T-1275) are plotted as black points. Gee—the 2012 data comes the closest. Note that the SOC value is based on my de-rated battery capacity of 125 Ah: 83% of the advertised capacity. And it approximates the discharge curve pretty well from day one. I conclude that these batteries have never lived up to their 150 Ah promise. Batteries disappoint.
Do I think these batteries will continue to get better with age? Ha! Just this weekend I saw disappointing performance during equalization (required more current than I expected). And I haven’t seen absorb state settle down to sipping just 50 W for some time. My first set of batteries took a rapid nosedive after less than two years. This set appears to be doing better, but I’m not driving them quite as hard (safety in numbers: 4 is better than 2; new refrigerator is less jarring when it turns on and the defrost is half the power, so the batteries are not slammed as hard as a result).
Oh Battery: How Gently Must We Treat Thee?
Incidentally, it is well known that batteries will survive more cycles at lower depth of discharge. A useful graph from here shows this clearly:
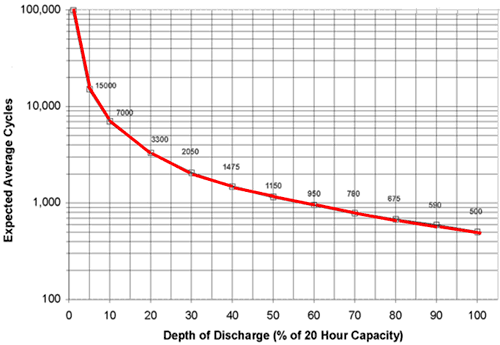
Based on the graph, we might expect a whopping 15,000 cycles at 5% depth of discharge, dropping to 1000 cycles at about 55% depth. But notice that if we multiply the number of cycles by depth of discharge—effectively a total lifetime energy—the effect is far less dramatic. 15,000 times 0.05 is 750, while 1000 times 0.55 is 550. So only a 25% decrease in lifetime energy by driving eleven times harder.
I could double the size of my battery bank, doubling the up-front investment at the same time, and slightly more than doubling the time before I have to replace them. But if I plan on doing monthly maintenance (equalizing, cleaning, etc.), then I have twice the work! So I’m not terribly timid about hitting the batteries a little hard. 50% depth of discharge is not unusual for my system. Perhaps I’m being foolish and will wise up one of these years. For now, I look at the graph above and say: meh…
On the economic side, taking the advertised capacity for a lead-acid battery at face value, I can get a Trojan T-1275 for $235, and if treated gently it will provide an energy outlay of 750 full-cycle-equivalent discharges. Each full discharge has 12 V times 150 Ah, or 1.8 kWh. This works out to $0.17 per kWh. If I instead cycle at 50% and get 575 full-cycle equivalent outlay at a de-rated 1.5 kWh/cycle, the cost is about $0.28/kWh. Since my system uses the battery for half its energy needs, the effective cost of electricity for battery replacement alone is about $0.14/kWh, which is pretty close to the utility rate in San Diego.
At this point, I have sourced 1686 kWh from my four batteries in 30 months, or 422 kWh each. At a de-rated 1.5 kWh per battery, I have gone through 281 full-depth equivalent cycles. In about 915 days, this means my average cycle depth is 31% and I might expect 2000 such cycles (5.5 years; 620 full-depth equivalent cycles) at this level. So judging by this, I’m almost halfway done. Luckily for you, we’re much more than halfway done with this post. Here’s the wrap-up…
So is 62% Good or Bad? Waffle time…
The primary result is that I only get to use 62% of the energy delivered by my panels. The comparable number for a grid-tied system is something like 87–90% (inverter efficiency). My system suffers an additional 87% efficiency factor due to its full-tummy effect. This is close to the grid-tied inverter efficiency, so we can say that a panel in a small-scale off-grid system will likely deliver only something like 60–65% as much total energy as a grid-tied panel.
Doesn’t seem so good. On top of this, batteries are costly, as demonstrated before. So why would anybody go this route?
In remote locations, the cost of running utility power lines can be prohibitively expensive, quickly tipping the scales in favor of off-grid PV (the sunk investment in panels, etc. can be less than that in utility installation, in which case the cost of batteries offsets the steady utility bill). And I must say I enjoyed having power during the San Diego blackout of 2011. Moreover, I get pleasure out of having my own power generation capability. It’s part hobby, part independence, part practical. All cool.
My experiences have certainly impacted my views on large-scale solar ambitions. Like many, I am wowed by the incredible scale solar power offers: it’s a super-abundant resource. But grid-tied systems are deceiving. The grid acts like a giant, always-hungry battery by virtue of the fact that the stored energy in the form of coal and gas can be released at any time to balance power. This only works seamlessly when solar (and/or wind) input is a small fraction of the total. I often see numbers like 10–20% renewable penetration before big problems arise, but I have not studied this personally. The bottom line is that we’re discharging the Earth’s natural energy storage battery (the fossil fuels) and must replace storage with storage, if we want to continue our journey.
In any case, storage is costly—in energy, resources, and economically speaking. I pointed out in one of the first Do the Math posts the daunting scale for building a lead-acid battery big enough to satisfy the whole nation (not enough lead in the world, and a total budget-breaker even if lead were available).
My waffling here reflects the mixed bag nature of the problem. Storage is what it is: not great, but at least it can work, at a cost. The main lesson is that we shouldn’t be flippant about the degree to which storage difficulties limit our future energy ambitions. I see it every day in my imperfect personal PV microcosm.
Contact
- Content: editors at theoildrum dot com
- Tech support: support at theoildrum dot com
License

This work is licensed under a Creative Commons Attribution-Share Alike 3.0 United States License.
Hi Tom;
Yes, it is a long and detailed post, so with thanks for the great effort, I am commenting only on the early portion to which I was able to spend my limited TOD-time..
This said, my initial reaction to the efficiency hits on this 'full tummy' issue and the concordant challenge of storage in general seems to be essentially answerable from right there within your system (if you didn't already point it out yourself).. and that would be to adapt your fridge somehow.. with 1) more insulation (ie, storage efficiency), 2) a timer so that it compresses only during the daytime hours when the PV supply is not being fully utilized, and if necessary 3) a colder setting, in order to extend the ability to get through the night and make best use of the power source when it's 'live'.
Of course, other issues come into play when this is considered.. some fridges can overdo it and freeze contents if set too cold.. not good for salads.. it might also become a matter of local climate and where in a house the fridge is located. There are many inconveniences given the Set-it-and-forget-it nature of our appliances today that make using a fridge or a hot water heater into forms of renewable energy storage as much as Salad and Shower Storage Devices demand even more thought and work for us to implement.. but I'm pretty sure that we can find very useful improvements in the performance of "Green Power" if we are willing to subvert the current expectations of Fuss-Free Convenience around such ubiquitous tools.
Like the way we store our income in more than just the Savings Account, we have to store our energy sources in diversified portfolios, too.. and not just in batteries, which have their benefits and their liabilities.
Best,
Bob
Yes, Tom should adapt his refrigerator/freezer to run in the day and not at night. A fourth point should be added: add thermal mass to the refrigerator/freezer in the form of water and brine bottles. His batteries will reward him with a longer life.
If Tom mounted another 130 W PV panel with a westward azimuth, he could reduce the battery discharge by more than 50% in the late afternoon caused by the attic fan. Maybe an azimuth tracker with a manually adjustable altitude would be more suitable for the efficiency conscious.
I would be interested to see similar information on a bank of Edison batteries. Also, does anyone know anything about this company? They turned up in a web search, and must be a new outfit, since there was almost nothing on this type of battery a few years ago.
They are said to have a much much longer useful life, with some environmental advantages regarding their chemistry. But they are also said to have lower efficiency out of the gate.
And a note on the old Pb-H2SO4 batteries: as an old fart, I can remember when these things would be tested with a sight glass or hydrometer with a series of little colored beads to show the cell's charge state. In theory, you could also measure the refractive index of the electolyte. You can't do that with Edison batteries because the electolyte does not change with charge state, but does anyone even look at the electolyte for this information any more?
[edit] Oh, and thanks for the detailed analysis, Tom. Most of the solar installations I have seen are not equipped to report in such detail. You can't tell by looking at them whether they are doing anything at all.
I have a hydrometer, and have checked my forklift battery.
It never told me anything good so I quit doing it.
After a little thought, it seems likely that the electrolyte in a lead-acid cell is probably not a uniform solution of H2SO4.
Acid is created/destroyed on the plates, and the hydrometer or sight glass is sampling clear electrolyte away from the plates, so it probably isn't very reliable as an indication of charge.
That is why you suck and blow the acid several times before taking the reading so as to get some degree of mixing.
NAOM
But they are also said to have lower efficiency out of the gate.
Ever heard "Don't place the batteries on the ground or the concrete floor - they will discharge faster"?
It seems if you have a nickel-iron battery in a metal case and the case is in contact with ground they do discharge faster.
The 'propaganda' of zappworks claim the Ni-Fe batteries self discharge 'bout the same as Pb-acid.
But only after the batteries are "broken in".
Not having the batteries be junk after a few years, to me, sounds good. Even if they leak.
Self discharge matters more to me than 'less efficient' in terms of mass or money. If the people working on things like EEStor ever shipped solid state caps with the same cost/storage as lead acid buying such devices look to me to be a no-brainer.
Edison batteries because the electolyte does not change with charge state,
Yes it does change - otherwise it would not be a battery. You'd have to add an pH color changing chemical and look to do an acid reaction with the metals out of solution then watch for a color change.
And once again - http://opensourceecology.org/wiki/Nickel-Iron_Battery
Well let's start by subverting the incessant and absurd attempts by TPTB to take away individual responsibility and self sufficiency by imposing rules, regulations and codes such as these mentioned in Tom's original post on his system specs!
Let's get F'n real, this ain't brain surgery for crimminey's sake. NEC can take take their frigging codes and stuff them where the sun don't shine as far as I'm concerned!!!! What they should be doing is holding free seminars where just about anyone can learn how to do their own installations safely. But NO we get this Sh!t instead >:-(
Edit: Forget 'Occupy Wall Street' occupy your own damn roof and your own destiny! And a big middle finger salute to the bastards who want evermore control over us!
Not going to bother apologizing for this rant! New Hampshire has it right, 'Live Free or Die'!
Well you go tell those Spiders, Fred! Tell em how you really feel!
Anyway, I'm off to go get up on my roof and build some stuff.. but it will all comply to the code of the playground, if not to any other set of standards. I'm about to be spending enough time up there soon that I'll be sewing up my own Safety Harness out of questionable nylon webbing that I got surplus, to top it all off! (Not kidding.. you should see the safeties I used to use.. it's like SUV's.. if you're really not so sure it'll handle the crash, then you drive really safely to avoid the whole mess!.. Don't tell my wife.)
I know you're not the prayin' type, FM, but wish me a soft landing, in any case!
I also need to draft up a homespun legal pleading that amounts to 'asking forgiveness, particularly over my failure to ask permission'..
Good on yer, Jokuhl. Have a home made harness myself, that I've used for high tree work, topping and lopping to get more sun into the garden and on to the collectors. My harness involved a piece of garden hose, so I'm sure yours is safer! But do be careful. And I won't tell your wife, as long as you don't tell anyone that some of those trees I lopped were not mine, but on the adjacent public land...shhh.)
Let's step back a bit...
The "few readers" who wrote to Tom are simply wrong. The 2011 NEC does not prohibit DIY installations, and in any case does not have the force of law unless officially adopted by states or localities. Your local municipality or county may or may not require you to use a licensed contractor. Most don't, or at least don't enforce such requirements, or have an alternative process for DIYers.
DIYers should still generally try to follow the code simply because their installations will be safer that way. That is not to say that the code isn't too stringent in places, but understand why the requirements are there and what risk you're taking if you don't follow them.
If we were talking about getting government incentives for grid-tie systems that get net-metering or SRECs, some states have some (ridiculous) requirements about who installs those systems. But not in California, where Tom lives, or in most other states.
Heheheh. Use the power of the Powerful to your own ends.
Look at the code. Note how "low power DC" has certain exemptions? Then remember your BELLCORE documents - how The Phone Company used to run itsself on -48VDC NiFe batteries.
Ask yourself this: Would the Phone Company want local building inspectors showing up and not only having the power of inspection with their rats nest of wire but also have the power to CHANGE what Mother Bell was doing?
Or would the powerful public utility - Ma Bell - work to have the rules exempt her?
Good post. A couple of comments: 1) NEC 2011 is not the code in most communities... usually we lag considerably, some as far back as NEC 2005. 2) Even with NEC 2011 DIY is not banned, it might simply prevent your accessing most incentives, but the Fed credit is still available to you. 3) NABCEP is a PITA to qualify for... involves two levels of testing as well as having a few installs under your belt to get to the point where you qualify... and it is absolutely ridiculous. I'm an electrical engineer in a 1.2 GW power plant, and me and others here are trying to get this... the complexity of the PV installs in DC terms is nothing compared to stuff like our DC control systems, battery and its charging elements (I compare it to the difficulty of doing a dishwasher), not to mention any of the protective schemes we do here. Nevertheless, NY state will no recognize even people who have a PE (Professional Engineer) in electrical engineering... which is absolutely hilarious since this qualification is all I need to design protection relaying in a bulk power system plant. I've actually installed several off-grid systems and am still being held up by this. I've talked to NYSERDA folks about this - it is a major barrier to entry meant to protect PV installers from electricians, and I've worked with PV installers who didn't know the functional difference between neutral and ground in 240V AC who are licensed.
Anyway, YMMV in your municipality, but the system I built last year at my father's farm just required an electrical inspector to check for safety afterward. If you're paying for the equipment fully then safety is the only outside criteria.
There are some aspects of solar installation that you don't learn in the process of becoming a PE, basically those about maximizing solar harvest, that are relevant to government incentives. But these are easily learned, and there's software to handle it, and that stuff shouldn't require additional certifications. In California the state takes care of this stuff by requiring data on the system and inspecting a certain percentage of systems. There's probably a more efficient way, but at least it's not suppressing competent would-be solar installers.
I totally %110 percent agree with you that NABCEP is ridiculous and should not be used by governments as a qualification for anything. What does NY prevent you from doing if you don't have it? Qualifying for incentives? Or do they even prevent you from contracting?
Sure, you're right about that, but the idea behind the PE license is that you're only supposed to sign off on designs that you have good technical competence for. In my case I've had a couple of actual 6 month engineering classes, not a couple of day training class that also talks about roof loading. Also, NY requires a shading analysis and a "3 line diagram" (for DC... ah bureaucrats doing engineering) which effectively covers the "will this be correctly oriented and productive" part of the equation. The funny part is that I can sign off on the power electronics and changes to them - say disabling the inverter shutoff in the event of a blackout, which has actual safety implications - but I can't sign off on the simple end of mounting the damn panels on ground mounted poles.
In NY State, you can't get access to the $1.50/watt incentive without a) becoming NABCEP certified and then b) jumping through some additional business licensing hoops. If they made it so that engineers, electricians and roofers could easily move into the field it'd probably help with the install cost, which is now about 2/3 of the total cost of a system... I worked on installs in NYC in 2008 and the cost was $8/watt with panels at say $3.50-3.75/watt (with another $1-1.50 in hardware and electronics), and now the panels are available to installers at $1.25 or less, and it's still $8/watt. And this is why. If I could get together as designer with an electrician and a roofer from my plant we could all install our own houses and have a complete payoff inside of ONE YEAR if we could do the work ourselves and get the rebates the certified installers get along with the Fed and state tax credits. I actually wanted to do "solar raisings" this way, but NYSERDA forbids this... almost like they don't really want to get it done.
Thanks for the great data analysis and presentation!
Tom,
I recently helped friends install a similar system in the north of San Francisco Bay.
They were using three forklift truck batteries for storage and a 48V system, with Outback MX60 MPPT and inverter.
I wonder whether you could make the attic fan a dc device - and use this as a dump load in the late afternoon when you are having to jettison power from your batteries?
Better still an air source heat pump that dumps all of your attic heat into hot water.
Congratulations on your energy-frugal lifestyle.
Ken
Storage is highly overrated: If Germany had 80% renewable power and would not invest in storage, it would only lose 7% of renewable power (This means that the renewable costs are only increased by 7%. Thus, it is simply far cheaper to overbuild than to store. At $0.58/W for PV-modules you can even forgo 50% of their production: http://www.sunelec.com/) according to VDE: http://www.vde.com/de/Verband/Pressecenter/Pressemappen/documents/2012-0... (At 40% renewable power storage would increase CO2-emissions, since lignite power plants would mainly benefit from this storage capacity!)
PV and wind complement each other very well: http://www.q-cells.com/uploads/tx_abdownloads/files/6CV.1.32_Gerlach2011... and interconnected windfarms provide baseload and meanhwile there are windturbines which can reach capacity factors of over 50% (big rotor small generator): http://www.gamesacorp.com/recursos/doc/productos-servicios/aerogenerador...
In addition, fossil fuels are currently wasted for heating and hot water:

And heat energy (hot or cold) can be stored cheaply.
When the heating, hot water and part of the transportation sector is electrified, lots of fossil fuels are not wasted but stored and a portion of those fossil fuels can be utilized in flexible gas power plants, which are simply far cheaper than electrical storage (apart from pumped storage which already exists) and having a gas power plant running at only 5% capacity factor per year (for your cloudy December days - btw, was that also a dead calm period and was it also cloudy in Palm Springs at the same time?) has very little relevance as far as fossil fuel consumption and the electricity price (since this costlier power is only needed 5% of the time) is concerned.
Keep in mind: A heat pump with a COP of 4 essentially saves/stores 4 kWh of fossil fuels with 1 kWh of renewable electrical power.
Cost of the backup fossil/nuclear?
Those aren't backup.. they're simply 'Other sources' to make a complete utility basket. It would be just as unfounded to suggest that Fossil and Nuclear should have to count the Wind/Solar as part of their costs, for when the wind and solar back up these ones' inability to be the Silver Bullets of utility sourcing that they would love to promise themselves as.
Flexible power plants already exist because demand varies and conventional power plants require maintenance or fail unexpectedly, like for instance this nuclear power plant near San Diego: http://articles.latimes.com/2012/jun/08/local/la-me-0608-san-onofre-2012...
The US already has over 500 GW flexible capacity and this existing capacity does not need to purchased again: http://www.eia.gov/electricity/capacity/
But lets say New York and LA would have no power and be currently run on candles and all the existing hydro power plants and gas turbines to cope with varying demand and to back-up conventional power plants would need to be build first:
A new gas turbine costs $0.3 /W. If this peaker power plant is run only at 5% capacity factor (for those rare cloudy days in December even though there's probably wind also), its amortization costs are 8 cents/kWh (amortization in 10 years at 7% (!) interest rate).
But since it's not run 95% of the time the amortization costs of this peaker power plant would only add 0.4 cents/kWh to the electricity bill.
NEXT.
This is a thread about the capacity factor of an individual home solar set up, not renewable grids.
However your costings do not take account of the impact on the grid if the solar input is enough to make much difference anyway.
The cost of the generating equipment is in the range $300-1,000 kw, with the lower figure perhaps being more appropriate to less efficient units than combined cycle, which seems a pity if the name of the game is to burn as little fossil fuels as possible:
http://www.epa.gov/ttn/ecas/regdata/EIAs/combusturbinenspsfinaleia.pdf
If any substantial part of power is provided by home solar though, you then have the grid being hit by a wave of extra demand from solar homes when it is stretched anyway.
You can't just ramp up the supply of gas from zero, gas has to flow through the pipelines to keep them running, and the wells can't just be switched on and off.
In addition to that the gas pipelines have to be paid for, and the electricity grid into the home.
So if a home is generating 95% of it's power from solar, but needs the grid for the other 5% of supply, then the charge if properly laid at their door is 20 times the present element for infrastructure costs.
It is simply that the costs of that are charged to other users at the moment.
Ignoring how right that is at the moment, it wouldn't work if a lot of people were doing that.
So your costings do not take proper account of infrastructure costs, or the difficulty of having hugely variable load landed on the grid.
The true costs are way higher than you have given.
So your costings do not take proper account of infrastructure costs, or the difficulty of having hugely variable load landed on the grid.
You keep on ignoring that infrastructure has already been existing for decades:

and so have gas turbines and hydro power plants to deal with flexible demand. Why would anybody in their right mind purposely omit existing infrastructure?
And besides the existing grid and existing flexible power plants, you ignore the fact, that a gas turbine can go from 0% to 100% in less than 10 minutes, but the sun doesn't go up and down within 10 minutes and even it did:
Roof power can easily be used by hot water systems and air-conditioners and these systems can also reduce their power demand when roof power is reduced. (A building with a PV systems would obviously not purposely increase demand as soon as the roof stops producing power).
And you ignore the fact, that natural gas storage has been existing for decades and so have valves and just because PV is increased, natural gas consumption doesn't come to an immediate halt anyway.
Germany is already above 30 GW of PV and PV actually stabilized the grid since its power production is decentralized and power demand at noon is reduced:
www.bundestag.de/bundestag/ausschuesse17/a16/Oeffentliche_Anhoerungen/ar...
And Germany is hardly even using electricity to produce hot water at this point nor has Germany established a flexible electricity price system (such that cooling power would be increased during day time instead of night time, when electricity is currently sold at a lower price).
The German grid downtime in 2011 was 15.31 minutes:
http://www.bundesnetzagentur.de/DE/Sachgebiete/ElektrizitaetGas/Sonderth...
While France with far less PV and wind energy was at 90 - 100 minutes:
http://www.elcom.admin.ch/themen/00006/00119/index.html?lang=de&download...
And the US was even at 118 - 498 minutes:
http://www.smartgrid.gov/sites/default/files/doc/files/eto%20oct%202008.pdf
"The German grid downtime in 2011 was 15.31 minutes:
http://www.bundesnetzagentur.de/DE/Sachgebiete/ElektrizitaetGas/Sonderth...
While France with far less PV and wind energy was at 90 - 100 minutes:
http://www.elcom.admin.ch/themen/00006/00119/index.html?lang=de&download..."
Man!... this one on France's grid downtime looks pretty much like a stunt from German PV's public relation office... are you working for them?
How can you POSSIBLY cite a 2009 Swiss paper which cites a 2008 EDF report to derive the 2011 grid downtime?
Please, do your homework again, and come back to tell us the result of your search... France lost much less than the 90-100 minutes you report in 2011, due to grid downtime, and it has NOTHING to do with the way electricity has been produced, it would have happened anyway.
Roberto
P.S.: you link to Germany's federal agency is not working, please fix it. Thanks.
P.S.2: the correct link to find out about the electric grid's cuts/availability to French users in 2011 can be found in this publication
http://whttp://www.rte-france.com/uploads/Mediatheque_docs/vie_systeme/a...
as you can see on the graph on page 28, the average RTE client (RTE is the organization, partly owned by EDF which runs the French electricity grid) has been 2 minutes and 4 seconds ALL ACCIDENTS INCLUDED, and 1 minute 44 seconds omitting the ONLY 2 grid accidents involving more than 100 MW of power (i.e. many customers/whole area at the same time).
Incidentally on the same document, page 25, you can see a plot of one week of Germany's PV and wind production overlapped with the import/export of electricity to/from France... and not surprisingly it can immediately be seen that PV DOES NOT displace many watts of fossil fuel power generation, it simply changes from import from France to export to France. Please note that the plot refers to one week in May, which historically is the month with the highest PV production in Germany.
This simple document I have linked shatters one of the (unfortunately) many myths concerning Germany's renewable energy "miracle"... i.e. the reduction of GHG emissions, which in fact went up in 2011 as long as electricity production is concerned.
Despite the fact that Germany shut down 8 nuclear power plants and increased renewable power in 2011, Germany had far less grid downtime than France in 2008 with very little renewable power.
That's the point.
And the link is working fine.
due to grid downtime, and it has NOTHING to do with the way electricity has been produced, it would have happened anyway
Good then remember what you just said, since according to the fossil fuel and nuclear PR, any grid downtime is always because of 'evil wind' or 'evil PV'...
PV DOES NOT displace a single Watt of fossil fuel power generation
According to the facts even fossil fuel power plants in the Netherlands had to shut down because of German PV power:
http://www.z24.nl/economie/artikel_374604.z24/Duitse_zonnestroom_legt_Ne...
Do you lie, because you do PR work for the fossil fuel industry?
And CO2-emissions in Germany went down by 4% in 2011 despite the fact that Germany took 8 nuclear power plants off the grid:
http://tinyurl.com/d8gbk4t
(People always ignore the fact, that heating systems are not electrified.)
"And CO2-emissions in Germany went down by 4% in 2011 despite the fact that Germany took 8 nuclear power plants off the grid:
http://tinyurl.com/d8gbk4t
(People always ignore the fact, that heating systems are not electrified.)"
No, my friend. ELECTRICITY-related CO2 emissions have gone UP by 1%, in 2011. Overall CO2 emissions went down because of increased efficiency of industry and, most of all, transportation, nothing to do with PV... unless you point out to me a Mercedes/BMW/VW/Opel car model with PV panels on the roof...
Try again.
Roberto
P.S.: I don't reply to the remainder of your nonsense message for lack of time, not because I agree with it, let it be clear... other than P.S.2 here below...
P.S.2: you said "According to the facts even fossil fuel power plants in the Netherlands had to shut down because of German PV power:"... that's exactly my point!... and thanks for pointing it out with a link!... Germany DOES NOT utilize it's PV energy by shutting down its extremely polluting coal and lignite plants!... it keeps on running them full power and exports the electricity to neighbour countries... i.e. the latter pay 100 Euros/MWh electricity that the German customers pay on average MORE than 300 Euros/MWh... so it is simply a very good deal for the Dutch (otherwise they wouldn't simply do it!). Try again... again, my friend.
1.[edit]
2. You confirm my point that the electricity sector in Germany is only to a smaller part responsible for CO2-emissions, which is why German CO2-emissions overall went down by 4%.
3. CO2-emissions in the electricity sector went only up by 1%, because nuclear power was obviously not mainly replaced with lignite power but with renewable power.
4. The coal and gas power plants in Germany had reduce their output just as the gas power plants in the Netherlands had to, because their production costs were higher than the whole sale electricity price (which primarily dropped due to German PV-power).
5. Because of low whole sale electricity prices in Germany, Norsk is actually trippling its aluminium production in Germany: http://www.welt.de/newsticker/news3/article108969709/Norsk-Hydro-erhoeht...
1. Whatever... it was just a "conversational tool", apologies for trying to be on a light side.
2. No, I DO NOT confirm that at all! It simply means that the electricity sector is not the biggest polluter, of course transportation is bigger, like everywhere else!... but we are talking about a country which consumes...what?... 650TWh/year?... 1/2 of it or so burning coal/lignite, at ~ 1 kg/kWh!... do the math and you'll see that we are talkingabout millions and millions of tons of CO2, and the "ancillary" particulates, arsenic, heavy metals, etc... which kill people at the rate of 5~20 deaths/TWhe (and ~10x as many chronic illnesses, etc...).
3. Wrong on this one too: the 8 reactors which have been stopped by Mrs Merkel decision would have generated more electricity that PV and wind have generated in 2011. Simple math based on simple published data.
4. The peak-rate cost of the MWh on the market has gone down, simply because each of them has already been paid by someone else!... the average kWh produced by German PV panels costs more than 30 cEuros... while the cost of the average kWh on the electricity market, even around noon, is usually cheaper than that... This is another fact, easily verifiable, by the way.
5. Wrong on that too!... 4 out of 4!... congrats!... but you do not win anything,I'msorry!... Norsk, being in the power-hungry businessof aluminum production is simply EXEMPTED from the EEG surcharge, which in Germany has been designed to LEAVE OUT the biggest companies. This is also A FACT, by the way.
Next!
Roberto
[edit]
2. You confirm my point that the electricity sector in Germany is only to a smaller part responsible for CO2-emissions (heating and transportation is bigger), which is why German CO2-emissions overall went down by 4%. http://tinyurl.com/d8gbk4t
3. CO2-emissions in the electricity sector went only up by 1%, because nuclear power was obviously not mainly replaced with lignite power but with renewable power.
4. The coal and gas power plants in Germany had reduce their output just as the gas power plants in the Netherlands had to, because their production costs were higher than the whole sale electricity price (which primarily dropped due to German PV-power).
The feed-in tariffs for PV are actually between 12.8 and 18.5 cents/kWh: http://de.wikipedia.org/wiki/Erneuerbare-Energien-Gesetz
This means that the PV-power production costs are lower than between 12.8 and 18.5 cents/kWh otherwise they wouldn't be built.
5. Because of low whole sale electricity prices in Germany, Norsk is indeed trippling its aluminium production in Germany:
http://www.welt.de/newsticker/news3/article108969709/Norsk-Hydro-erhoeht...
They do only pay part of the 0.035 cents/kWh for the EEG. All big companies get perks, for instance, the nuclear power plant operators even get the tax payers to pay for the decommissioning of their plants.
" All big companies get perks, for instance, the nuclear power plant operators even get the tax payers to pay for the decommissioning of their plants."
No, my dear... this is wrong, again!
Germany's nuclear decommissioning fees are INCLUDED in the cost of the kWh delivered to the German customers, at the incredibly high rate of.... 0.1 cEuro/kWh... yes, you read it right!... 1/10th of 1/100th Euro, i.e. 300 times less than the average feed-in tariff for 1 kWh generated by PV!
Ask someone to read and explain to you this recent announcement by the German company EnBW owning 2 of the 8 reactors which have been stopped in March 2011...
http://www.world-nuclear-news.org/WR_Quick_decommissioning_in_Germany_03...
"Two of the German reactors ordered to shut after Fukushima will be dismantled as soon as possible. EnBW has applied for permission to do the work and said it has more than enough funds set aside.
...
Despite this loss of income and corresponding payments to its decommissioning fund, EnBW said it still has more than enough money for decommissioning and waste disposal."
Will you ever be capable of getting one thing right? I start thinking not...
Roberto
Actually the German tax payer paid already over €200 billion to the nuclear power industry:
http://www.focus.de/politik/weitere-meldungen/greenpeace-atomstrom-koste...
And this will continue to increase since the nuclear power industry is unfortuantely only paying partially for decommissioning costs. Not just in Germany but also in many other places such as Britain or Japan:
http://www.guardian.co.uk/world/2008/jul/10/nuclear.nuclearpower
http://www.bloomberg.com/news/2011-03-23/nuclear-cleanup-cost-goes-to-ja...
"The feed-in tariffs for PV are actually between 12.8 and 18.5 cents/kWh:"
NO! That is the feed-in tariff for NEW PV, the tens of GWp of PV installations in place since several years, part of which have initially been subsidized at more than 50 cEuro/kWh, by the way, will keep the average well above the 12.8 cEuro/KWh you mention!
"This means that the PV-power production costs are lower than between 12.8 and 18.5 cents/kWh otherwise they wouldn't be built. "
Pure, absolute, 100%, certified NONSENSE! Can't believe you are writing this one down!
One day your teacher will explain to you what "average" means, I give up with you.
Let's do this, in order to finally solve this dispute about the average cost, OK? Do us all a favor, since you are so good to write down link after link to Germany's web sites talking about PV: why don't you look and find how much has been paid in PV feed-in tariff in 2011 and divide this number, in Euros, by the amount of kWh generated by German PV in 2011?
It's a simple division, even you should be able to do it!
Take it easy, and do not panic.
Roberto
Over 10 times more PV power was installed in Germany this year at low FIT than 2004 when the FIT were above 50 cents/kWh.
Apart from your limited comprehension English language you also don't seem to understand the rule of proportion.
Btw, the solar industry in Germany pay more taxes than what they indirectly receive in feed-in tariffs - not to mention that they reduced the German costly unemployment rate, reduce fossil fuel imports and reduce emissions:
http://www.forium.de/redaktion/steuereinnahmen-der-solarindustrie-ist-ho...
"(People always ignore the fact, that heating systems are not electrified.)"
You are wrong on this one too!
In France most home heating systems are electric ones, they work fine, do not pollute, are cheap, etc...
Try again, but a bit harder, please.
Roberto
We are talking about Germany and CO2-emissions in Germany not France.
Understood, and as I said the emissions from the German electricity sector have gone UP by 1% in 2011... the comment on France was made just to show that there are other countries in this world, we are not all berliner, like JFK famously said... take it easy, if you have no valid argument to back up your point of view you can simply abstain from posting, non need to tell the other what the subject of the discussion is... plus it is not about Germany alone, it is about PV systems... read it again!
Roberto
Forgot to comment this, sorry:
"Germany is already above 30 GW of PV and PV actually stabilized the grid since its power production is decentralized and power demand at noon is reduced:"
This statement of yours is not valid in general, in particular it is almost NEVER valid for the entire 4 months of november, december, january and february... hard to run a heavily industrialized country like Germany with almost NO electricity at all 24/24 7/7, don't you think?
Roberto
1. Germany has over 30 GW PV installed capacity:
http://www.solarserver.de/solar-magazin/nachrichten/aktuelles/2012/kw39/...
(And most people are aware of the fact that PV-modules don't produce power night...)
2. In the winter Germany has always more wind power.
3. Thanks to PV, Germany could take lignite power plants off the grid in the summer and reduce CO2-emissions correspondingly. Unfortunately, Germany has still a very powerful coal lobby.
Your no.3 is simply not true! Not a single coal power station has been taken off-line because of PV... that would make sense, since coal-based electricity is almost a factor of 10 cheaper than the amount paid by German consumers for PV-based electricity.
What it does, PV puts out of market NATURAL GAS-based electricity, i.e. the least polluting version of the fossil fuels!... just read the text of the Dutch newspaper you have linked above (I have translated it with Google Translate, it is pretty clear).
Dutch gas-based power plants are put out of the market at peak hours because "cheap" (hyphens in the original) electricity from German PV take their place (with the difference in price being paid by German customers!), the NET EFFECT being that GERMAN COAL/LIGNITE IS BURNED IN PLACE OF NATURAL GAS for lighting Dutch bulbs, with the pollution falling on German soil. Where's the logic???? Utter nonsense!!!!
R.
Actually, stone coal power plants in Germany cover mid-load and just like the gas power plants they also reduce their output because of PV to some level:
![]()
In addition, you seem to have a limited comprehension of the English language.
I said:
3. Thanks to PV, Germany COULD take lignite power plants off the grid in the summer and reduce CO2-emissions correspondingly. Unfortunately, Germany has still a very powerful coal lobby.
This could easily be solved by reducing the payroll-tax and introducing a tax on CO2. This would automatically favor power plants which emit less CO2. But as I said: Unfortunately, Germany has still a very powerful coal lobby.
"This could easily be solved by reducing the payroll-tax and introducing a tax on CO2."
It seems that my (according to you) little knowledge of the English language is certainly better than your knowledge of European social affairs!... a reduction in payroll tax is impossible on this side of the Atlantic Ocean... Mrs Thatcher tried it 30 years ago and just look at the sorry state of British economy...
Roberto
They power of coal plants esp. lignite was of course reduced by more than 3 GW due to PV and wind on some days in the last two weeks, that is well documented with official data:
See PV-Forum under the thread "Die Delle in der Grundlast" (Dent in the baseload) , e.g. 14.th September 2012, more than 30 GW PV and wind caused a reduction of lignite of more than 3 GW.
"1. Germany has over 30 GW PV installed capacity:
http://www.solarserver.de/solar-magazin/nachrichten/aktuelles/2012/kw39/...
(And most people are aware of the fact that PV-modules don't produce power night...)"
Exact, and today, ~September, with day and night practically splitting 12h and 12h of daytime, this wonderful 30+ GWp have generated A PEAK of... 7.1 GW! Depressing, isn't it?
http://www.sma.de/en/company/pv-electricity-produced-in-germany.html
... with an integrated production of ~45 GWh... like a 1.9 GWe thermal power station.
'nuff said.
You made my point, once again... try to see things the right way, please, and not upside down. PV is a failure, in Germany, a Ponzi Scheme that can survive only as long as more PV enthusiasts enter the game (because they are paid by feed-in tariffs, that is), at the expense of the majority of German households and small businesses who cannot avoid bearing the cost of the scheme. That's a documented fact, not an opinion, OK?
Roberto
Depressing, isn't it?
No, PV-power is predictable on a month per month basis and it's actually a well known fact that the PV power plants in Germany overall never produce their combined nameplate capacity. Not just because of wheather, but also because not all PV-modules are arranged at the same angle.
PV is a failure, in Germany
Actually, it's a huge success: Despite fact that feed in tariffs for PV were at 50 cents/kWh 8 years ago and are nowadays only at 16 cents/kWh, over 1000% more PV has already been installed in 2012 than in 2004.
http://de.wikipedia.org/wiki/Erneuerbare-Energien-Gesetz
German households and small businesses who cannot avoid bearing the cost of the scheme
Actually, even if Germany would keep on installing 7.5 GW of PV per year and the average feed-in tariff for PV amounts to 15 cents/kWh the electricity cost increase is only 0.1 cents/kWh.
In addition, for these 0.1 cents/kWh Germany keeps thousands of jobs, gets billions of tax-income, reduces its dependence on fossil fuel imports and reduces its CO2-emissions.
"Actually, even if Germany would keep on installing 7.5 GW of PV per year and the average feed-in tariff for PV amounts to 15 cents/kWh the electricity cost increase is only 0.1 cents/kWh."
Yes; you are right on this (miracle!)... but what you miss is the fact that this is due to 2 main factors:
1) Germany's electricity consumption is the biggest on the Old Continent (~650 TWh/year);
2) PV production is veeeeeery small, and therefore the surcharge on 650 BILLION kWh/year is negligible.
1) + 2) has, as an obvious, logical, consequence the conclusion that PV in Germany is useless, it is an interesting experiment in the field of social economy titled... "how long can it be carried on until the toy breaks"?
Social scientist will discuss it for centuries to come, energy scientist will try to forget it as quickly as possible. Just wait and see, when the mythological "grid parity" will be reached and the feed-in tariffs will be brought to zero, the social game will naturally end.
Roberto
When that occurs, Germany will have about 60 GW of installed PV and perhaps a similar amount of installed wind power providing about 1/3 of their annual electrical power.
[Math for estimate:
60 GW PV with capacity factor 11%
60 GW wind with capacity factor 30%
(60 GW * .11 + 60 GW * .3) 8760 hours/year = 215 TWh/year]
1) The German federal agency, or the minister in charge of this, has recently announced that they will stop at 52 GWp.
2) Even 52 GWp will keep on generating poweer at an average of 10% capacity factor, with high generation in May and a sorry, long, neverending minimum between November and February, 4 long, cold, sun-less months...
3) Wind will take up some of the slack, but it will keep on producing less than 10% of NATIONALLY-AVERAGED nameplate capacity for a sizeable amount of time...
3) Germany's wind capacity factor is about 20%, not 30!... who told you that? High CFs are expected in the future, when the very delayed "several GW" of extremely expensive and hard to install off-shore will finally materialize, for the time being less, much less, than 1 GW has been connected to the network! The datum of 20% CF for on-shore German wind installation is taken from a paper on a peer-reviewed journal, Energy Policy, written by N; Boccard of Girona UNiversity, Spain, reprinted here...
http://www.rocks.org.hk/activity2009/Capacity_factor%5B1%5D.pdf
... as you can see the CF of Germany over 5 full years has been less than 19%, close to 18% actually... read the paper, it is an eye opener!
4) In light of 1), 2), and 3) above, your estimate of 215 TWh/y is changed to a more factual one of
(52E+6*0.1 + 60E+6*0.2) (kW) * 8760 (h)= 150.7 TWh/y.
5) 151/650 = 23.2% of the total, which DOES NOT change the overall picture, a picture darkened by the THICK layer of black dust spewed daily, 24h/24, by the chimneys of the hundreds of coal/lignite power stations... they have just inaugurated one of 2200 MWe in August, just north of Frankfurt... the Environmental Minister was there for celebrating the event!
R.
The FIT will stop at 52 GW PV (2014/2015), what is your problem? We see the first projects that already work without FIT, investors with long term strategy and medium size companies with high own consumption will still build PV, we do not expect 7 GW p.a. but 2-3 GW p.a. should be possible.
Wind turbines (on-shore!), which were installed during the last years in northern Germany have up-to 3000 FLH, usually more than 2500, 2100 FLH are quite common even in Austria. Off-shore wind turbines have up to 4400 FLH. The low FLH come from many old small turbines, which will be replaced in the next years.
Wind provided more than 10% of net-consumption in first half of 2012, renewables more than 24%.
Your lack of understanding when it comes to lignite is funny, the new plant is replacing 14 older ones which have a much lower efficiency, ->gain. But this was told you a few times in the past. Why do you start agains with your lies?
= 215 TWh/year]
Yes the math works. However:
1) Germany demand is more than double that, ~525TWh
2) Given an average demand of ~60GW, in the summer or peak wind times Germany will end up spilling some (10%?) of the excess PV or wind with no place to put it; they won't be able sell off 90GW at noon some day when the wind is blowing hard.
3) Germany will have spent a great deal of money with the current FIT to end up supplying much less than half of the national electric demand
4) Some, but not much of the current fossil & nuclear power will be able to be retired given the problems of winter PV there and the lack of sufficient transmission to the south for the wind, especially from offshore in the Baltic.
If only the hot water part is covered with 4 hours of surplus renewable power at noon, that already corresponds to 87 GW - to cover the hot water needs only.
The FIT currently amounts to about €3 per person and month. How much does a pack of cigarettes cost?
The two southern states in Germany can produce 125 TWh with wind alone according to Fraunhofer:
http://www.eeg-aktuell.de/wp-content/uploads/2011/04/IWES_Potenzial_onsh...
It's not a surprise that VDE came to the conclusion that storage doesn't make sense below 40% of renewable power share.
http://www.vde.com/de/Verband/Pressecenter/Pressemappen/documents/2012-0...
The FIT currently amounts to about €3 per person and month.
Using the entire Germany population? Then unless infants, the disabled, retired seniors and the like have discovered incomes from late night TV infomercials the go-without for the average two income family is likely $300-400/year.
What are you talking about?
The FIT costs per kWh are 0.0359 cents/kWh.
In my efficient household that is €0.90 per month and person! I would need to wait almost a year to buy one single pack of cigarettes.
And for infomercials you can buy 32" TV-sets which consume 30 W:
http://www.topten.ch/deutsch/buro/fernseher/70-90-cm.html
If you need 3 hours of infomercials per day including weekends and holidays that corresponds to €1.17 of FIT per year. You need to wait years to buy one single pack of cigarettes.
The US already has over 500 GW flexible capacity
Agreed, in total, though the 100% over supply does not exist everywhere.
and this existing capacity does not need to purchased again: http://www.eia.gov/electricity/capacity/
Either i) plants retire and new ones need to be built, or ii) there is an owner operator out there of that fossil plant who fronted the capital and built it with the expectation of selling power from it ~70% of the time. Later, if somebody suddenly wants the plant idled 95% of the time the owner/operator still expects to be paid. No free lunch.
A new gas turbine costs $0.3 /W.
Lowest cost one cycle gas turbine plant is $0.7/W which I grant is still cheap for power capital. Also gas turbines are compatible with solar and wind because, like them, they don't necessarily require water for heat transfer.
If this peaker power plant is run only at 5% capacity factor (for those rare cloudy days in December even though there's probably wind also), its amortization costs are 8 cents/kWh (amortization in 10 years at 7% (!) interest rate).
More like 20 cents/kWh with a realistic capital cost and that still doesn't include cost of fuel to operate, even for the 5%, and maintenance. Consider: the lowest price of gas fired electricity on the market now is 2 cents / kWh per EIA. The idea here for moving it to backup would be to cut the electricity sold (and fuel used) by ~15X (say 70% down to 5%). Still, that's in the range of plausible if the low price of gas holds.
In addition to the costs you give, you have to cost out running the infrastructure for the low and occasional use implied here.
Distribution cost on top of plant gate costs come to something like 2 cents/kwh, so naively if you are utilising the grid but at 5% then the cost per kwh come to something like 40 cents/
Further support for at least this kind of figure can be found by the fact that this would not be a constant draw of one twentieth of current load enabling downrating of equipment, but massively peaking load.
That means that you need the kit rated at least as well as today.
So allowing for infrastructure and the generating costs you give we might think in terms of peaking power at 60 cents/kwh.
And since it is impractical to store massive amounts of gas, it is a lot easier to use coal, which can be stockpiled.
So carbon emissions would remain significant, unless of course you have carbon capture, but if you have then installing all the panels and batteries etc is of dubious economic and ecological benefit as you could generate a larger proportion of electricity cheaper by using coal and pay for the grid more economically.
Under those circumstances spending the money on better insulation is like to be a better use of resources than solar panels and batteries for use on a large scale.
No problem about using solar for peaking power in Arizona, but using is as baseload quickly becomes problematic.
An alternative is that the grid no longer guarantees it will meet demand. I've lived in a house where the A/C, water heater and/or pool pump could be disabled by the power company when demand was threatening capacity. I'm no expert, but I suspect an affordable system could be implemented for controlling how much power a customer draws from the grid based on how much is available. That would reduce the need for rarely used standby power sources. It would require changes in appliances and lifestyles, but we can't keep going the way we have been. A down side is that many people could not afford the adaptions that would make such a change livable.
Around here there are weekly power outs that last 2-6 hours. I think that it's related to load-shedding. The adaptations necessary? A non-plugin light source, non-refrigerated snacks in the cupboard, mosquito repellent and hand-fan, a ups for the computer and voltage protectors for everything else. Oh and you have to learn to never leave computer work till the last minute. For short (less than 8 hours) power-outs everyone but those on life support, the highest buildings or worst environments can get by.
I'm not talking about regular power outages, but rather about running grids based on available supply rather than on demand. That would mean things like refrigerators that would keep foods at safe temperatures without running their compressors every 30 minutes, maybe on-site backup storage for whatever the customer considered essential during low power availability. The elderly, very young, infirm and sick need more than a hand-fan in hot or cold weather. And the people who will be least able to afford modification to their homes and appliances won't have to worry about losing work on the computers that they don't have.
things like refrigerators that would keep foods at safe temperatures without running their compressors every 30 minutes
Or more often and longer when the sun shines. Interestingly what might be better is a refrigerator with a "solar power mode" which would use solar electricity to advantage to lower the temperature during the day, so that it displaces electric use at night when the temperature would be allowed to rise to the highest safe level. Though thermal losses increase w/ greater temperature differential so ...
In those circumstances UPS batteries do not live long, regular long cuts eats battery life. If a UPS is rated for 30 mins at the load you are using then don't push it past 5 or 10 minutes. I typically set a shut down program, such as NUT, to shut the computer down after 5 minutes, then turn off the UPS. Interruptions typically last less than a couple of minutes but if the power is off for more than 5 it ain't coming back in a hurry. Another way to extend the life of the batteries is to move them outside of the UPS case to allow more air cooling, the batteries like this.
NAOM
EDIT: May I add to that, putting a CVT to condition the line before the UPS is a big help. If the line power jitters a lot the UPS may frequently switch to battery, for a few seconds, taking bites out of the battery. Even a regular switched voltage regulator may trip the UPS when switching from one level to another.
Distribution cost on top of plant gate costs come to something like 2 cents/kwh,
Yes, I forgot to tag the above as busbar costs.
so naively if you are utilising the grid but at 5% then the cost per kwh come to something like 40 cents/
Very good point, neglected above. In the scenario where solar/wind provide most of the energy w/ fossil in reserve there would still be a large fraction of the grid delivering solar/wind power so a fraction of delivery costs would be justifiably laid on solar and wind. But as you suggest transmission to/from backup plants would be quite expensive if in use only ~5%.
So allowing for infrastructure and the generating costs you give we might think in terms of peaking power at 60 cents/kwh
Or 3 cents charges added and apportioned over all kWh delivered year round (1/20 use of backup).
And since it is impractical to store massive amounts of gas, it is a lot easier to use coal, which can be stockpiled.
US storage gas capacity is ~8 TCF and rising, and generally speaking can be transferred to most places in the US as demand should appear. Gas, especially turbines, are a much better backup source than coal as their spin up time can be on the order of minutes versus hours or days with coal fired boilers.
So carbon emissions would remain significant,
Is 5% of current emissions 'significant'? Even granting all the issues you cite above are true for a moment, I don't follow the logic of large emissions remaining from electric power generation in such a scenario: a large backup fossil fleet running at 5% capacity, along with hydro, nuclear and demand response, to firm solar and wind, i.e. a ~twenty fold reduction.
...using is as baseload quickly becomes problematic.
Yes, hence the backup proposals above and investigation into costs thereof.
My main concern in this part of the somewhat OT discussion was simply to correct egregiously incorrect figures for the cost of solar back up from the grid.
But in passing I would remark the following to the points you make:
Although there may be a fair amount of gas backup, that is for a system which uses far more natural gas, since we are here talking about displacing it.
To keep a system running you have to have throughput on the pipes - for instance questions have been raised here on the practicality of carrying on pumping oil when the North slope slow decreases.
You don't have those issues with solid fuels.
I think that is about as far as I wish to go in this thread, as we are getting too far into the much broader issue of running a grid on renewables rather than capacity factors of home solar.
The bottom line is that even supplying a small amount of grid power for balancing would not be trivial in cost or engineering.
"Is 5% of current emissions 'significant'? Even granting all the issues you cite above are true for a moment, I don't follow the logic of large emissions remaining from electric power generation in such a scenario: a large backup fossil fleet running at 5% capacity, along with hydro, nuclear and demand response, to firm solar and wind, i.e. a ~twenty fold reduction."
Well, hope I am not misunderstanding what you are saying... but...
...no way this sentence is correct... in order to "run" 5% of the time (i.e. produce electricity 1.2 hours/day, thermal power plants have to stay off-grid on stand-by, ready to go, and therefore burning coal/gas/oil for a lot more than 1.2 hours/day.
In addition to that, emissions during such off-grid periods would be, on a per MWh basis, much higher than during on-grid periods, simply because they are designed to run as much as possible on a steady cycle, close to maximum production.
This, in the end, is found in the "capacity credit" of PV/wind being much smaller than what nameplate capacity would suggest, for large penetrations. Your 5% capacity left to fossil fuel based power plants will simply NEVER materialize, that' becoming quite clear already now that PV/wind are much below the 5:1 nominal ratio that you've mentioned.
All this is very well documented, I am not stating anything new.
Roberto
(i.e. produce electricity 1.2 hours/day, thermal power plants have to stay off-grid on stand-by, ready to go, and therefore burning coal/gas/oil for a lot more than 1.2 hours/day.
Ready to go, spinning standby is not what's imagined to firm up a theoretical solar/wind/hydro future. In such a future batteries/pumped hydro take care of the short term, hours long outages. The problem is the 3-4 weeks around the winter solstice for solar along with some possible storms, or the several weeks of wind lull that happens every year at the same time. Those kind of events are very predictable, and even if they are not response is not needed for many hours.
In addition to that, emissions during such off-grid periods would be, on a per MWh basis, much higher than during on-grid periods, simply because they are designed to run as much as possible on a steady cycle, close to maximum production.
Yes, but so what at 5% of current operation? Also the efficiency hit is less true for gas turbines than boilers which have grown much cheaper to run recently.
The problem of dedicating fossil fuel electric power backup to a highly intermittent source has been that the capital cost of all but gas plants made that proposition prohibitive, and gas plants were out because of the cost of gas. With gas at $2.50/mmbtu feeding 50%+ efficient combined cycle plants the proposition is becoming much less prohibitive.
http://www.hamiltonproject.org/files/downloads_and_links/06_energy_green...
Hi: no time to reply on your entire message, but on this one part...
" In such a future batteries/pumped hydro take care of the short term, hours long outages. The problem is the 3-4 weeks around the winter solstice for solar along with some possible storms, or the several weeks of wind lull that happens every year at the same time. Those kind of events are very predictable, and even if they are not response is not needed for many hours. "
... I can only say that "in such a future..." is not compatible with the PRESENT!... Germany alone has tens of GW of PV and wind... which have only one good use... pumping water in Norway's, Sweden's, Switzerland's lakes when there is a surplus, and getting a fraction of the original energy back later (paying some good "royalties" to those countries...).
Also, your wild (very wild) estimate of "3-4 weeks around the winter solstice... etc..." is COMPLETELY WRONG, as you can easily check by yourself looking at recorded DATA (not simulations or models) on SMA.de web site (and or tennett's web site for PV... don't have the web site address here on this computer).
You are also WRONG on the predictability of those events... in fact just by looking at Tennett's web pages for wind and PV production, you can easily see that they may be good for the long term averages, but on a day-long or hour-long time frame they are almost always wrong, sometimes by orders of magnitude... same for Irish wind (on www.eirgrid.com), or british wind on BMreports...
The only way out is thermal power stations... if it's gonna be coal, gas, nuclear, oil, etc... is a different matter, but that is the only solution, globally... then if few million austrian or nowegians can live 100% off hydro is a different matter, isn't it?
Roberto
Switzerland's lakes when there is a surplus, and getting a fraction of the original energy back later (paying some good "royalties" to those countries...)
Actually, the opposite is the case: The Swiss hydro power plant operators are currently complaining about German solar power, since they produce exactly during peak demand and peak price and they can sell less electricity and at a lower price during peak demand: http://www.drs.ch/www/de/drs/nachrichten/wirtschaft/301909.schattenseite...
They are also upset because they invested a lot in new pumped-storage, hoping that peak power will always primarily be produced with oil.
http://bazonline.ch/schweiz/standard/Haben-Schweizer-Stromkonzerne-Milli...
Also, in Europe there's enough hydro storage capacity for over 20 days:
http://www.claverton-energy.com/european-hydro-capacity-compared-to-the-...
And hydro power can easily be increased as the examples in Switzerland show.
There are simply no nights and dead calm periods which last that long.
Wind and PV complement each other very well: http://www.q-cells.com/uploads/tx_abdownloads/files/6CV.1.32_Gerlach2011...
Interconnected wind farms provide baseload. German and Spanish wind production hardly correlates:
https://demanda.ree.es/generacion_acumulada.html
http://www.transparency.eex.com/de/daten_uebertragungsnetzbetreiber/stro...
Modern wind turbines have very high capacity factors:
http://www.gamesacorp.com/recursos/doc/productos-servicios/aerogenerador...
Replacing fossil fuel heating and hot water systems with flexible heat pumps saves fossil fuels and increases the grid flexibility.
It's simply cheaper to overbuild than to store every single kWh. If the inverter reaches maximum production at 70% of the installed PV-capacity you only lose 3% to 6% energy yield.
Most importantly: According to VDE storage is only needed above 80% renewable power: http://www.vde.com/de/Verband/Pressecenter/Pressemappen/documents/2012-0...
"Interconnected wind farms provide baseload. German and Spanish wind production hardly correlates:"
Not even close to it! Baseload, by definition means 24h/24 365/365, wind power generates less than 10% of the nameplate capacity for more than 1/3 of the time!... and this is not only true for the single farm (which on average generates power only 20-25% of the time, on shore), but to entire countries like Spain , Denmark, Germany, UK, Ireland, you can check that on-line very easily by yourself, if you only wanted to see the light...
The fact that wind in Spain and Germany "hardly" (define hardly, please... 10% of the time?... 30?...) correlate their wind production means simply that in an ipothetical future where the continent is run on 100% electric renewables, hundreds of GW have to be generated in one corner of the Continent just to be transported around it for thousands of miles to pump-storage in Norway, and the day after the other way around. This is the most inefficient, stupid, useless way of doing it, plus it will never happen, because there will never be enough support for it.
Roberto
"Also, in Europe there's enough hydro storage capacity for over 20 days:
http://www.claverton-energy.com/european-hydro-capacity-compared-to-the-..."
Sorry but your link states ...
177 TWh the storage capacity, put another way. That’s the same as 0.604 quads, 22MTCe, 15 MTOe, 152Pcal, 637PJ, or 465kWh per person across the 381 million people in the EU15+Norway.
147 GW the peak capacity of hydro across Western Europe."
... and I don't understand (have limited capacities in maths, not only English)... 22 days is 528 hours, and 177TWh are 177,000 GWhours, so I would guess that 177,000 GWh divided by 528 hours should give the deliverable constant power of EUropean hydro storage... but 177,000/528 equals 335 GW, not 147!... so, it is 147 or 335?
"And hydro power can easily be increased as the examples in Switzerland show."
Ahahaaha... excuses me???? "easily" in Switzerland? I live on the Swiss border and work in Switzerland, so I am very familiar with that country... around here, no matter which "canton" is concerned, German, Italian or French speaking... nothing gets done without a local or national referendum being held (and often rejected)!... in the last year alone Swiss citizens have voted for literally TENS of referendums, most of them local ones, rejecting, for instance, the installation of what would have been the biggest wind farm of Switzerland.
Try again, with another country, please, this was only a good joke.
"easily"!!!!
Roberto
I have given a quick look at your interesting links... and I have seen that they don't agree with one another!... for instance at one point you said...
"Also, in Europe there's enough hydro storage capacity for over 20 days:
http://www.claverton-energy.com/european-hydro-capacity-compared-to-the-..."
... but the previous link http://www.drs.ch/www/de/drs/nachrichten/wirtschaft/301909.schattenseite... you have given says this, on his last sentence (translated from German):
"The "Europe's battery" is thus still too small for the impressive list of solar and wind energy, which is produced according to the weather in Europe,..."
So, is it hydro storage enough or not? The estimate in the Claverton's document is nonsense, they list the available capacity as if all pumped hydro reservoirs of the continent could be emptied down to the last water droplet, which would be insane to do, and also impossible to do (some of them could collapse for lack of water pressure).
Please try to be consistent with what you or the document you link say, it is not trying to impress people posting many links that you'lll hide the many illogical statements you make.
Just look at this plot about percentage of water available in all of Norway's hydro reservoirs vs the month of the year, for the past 3 years...
http://wwwdynamic.nordpoolspot.com/marketinfo/rescontent/area/rescontent...
... it is taken from Statnett's web site, the official Norwegian grid operator... as you can see hydro's capacity is highly volatile and variable from one year to the next or previous... and depending on the month of the year it can go from a minimum of well below 20% of maximum capacity to almost 100%... for example during the 4 weeks (28 days) between week no.12 and week no.16 of 2011 the level of ALL of Norways reservoirs have reached a HIGH of 20% capacity... hard to believe it could have supported the remainder of Europe had it been needed.
Disproving this one statement of yours was easy, wasn't it? :-)
Roberto
"Modern wind turbines have very high capacity factors:
http://www.gamesacorp.com/recursos/doc/productos-servicios/aerogenerador..."
This sentence makes no sense, technologically speaking!
A wind turbine's capacity factor depends not only on the quality of the turbine itself (that is what you probably wanted to say, its efficiency?) but first and foremost on the wind distribution at the site where it is installed!
Take a 30% CF turbine placed along the northern coast of Germany and place it in "PV land" Bavaria, in southern Germany, and its CF will drop to 15% at the most!
A suggestion: try to stick to subjects you know a bit, at least... otherwise it is useless waste of time.
Roberto
Also, in Europe there's enough hydro storage capacity for over 20 days:
Yes you've posted that previously, and previously I've pointed out the statement is misleading. That there may be 20 demand day equivalents of energy stored in European hydro does not also mean those hydro facilities have enough power capacity to supply 100% of European demand for even one second, which they do not.
As I said many times:
Hydro power can easily be increased as the examples in Switzerland show.
Since hydro power in Europe is currently at 170 GW and wind energy and PV is still below hydro power it simply doesn't make sense to increase hydro power at this point - especially given the fact that the conventional power plant operators are not interested at all in reducing their output anyway.
(Btw, average demand in Europe is at 420 GW.)
Then when quoting prices of solar and wind, start including the price of all the new hydro required to back it up, because as of now that hydro does not exist.
The idea that it would be 'easy' to, say, double European hydro power capacity because of some low hanging fruit found in Switzerland is nonsense.
Yes it does.
Europe has still more hydro capacity than wind and PV and gas power capacity is almost double the installed wind and PV capacity.
And the probability that Wind and PV combined produce more than 50% of their combined installed nameplate capacity is typically less than 3 to 4% in the same region: http://www.q-cells.com/uploads/tx_abdownloads/files/6CV.1.32_Gerlach2011...
This means wind and PV need to have at least double the capacity of hydro (not just the same) to even be able to generate the same power hydro can currently generate. But then again there is still gas power and gas power operators won't shut down just because you want them to.
And again there are simply no days where there is no wind and no sun at the same time (nights are not relevant because night demand is lower anyway even though a lot of flexible loads are currently operated at night). They don't need 100% back-up anyway, even if they could ever produce 100% of their combined installed capacity.
Hydro capacity is mostly installed in mountainous regions (dams). The conditions to increase this hydro capacity are the same in all of Europe (you don't need to build new dams, you need to increase turbine capacity).
Why not back off on argument by upper case font and explain yourself instead? The stream of assertions, "only has one good use", "completely wrong" is only so much hand waiving.
The winter solstice is not predictable? Is German solar PV production at 50 deg N latitude typical of what might be done in the US? We do not know that in Texas, year after year after year, wind production falls to 60% of average in July - August?
Germany alone has tens of GW of PV and wind.
The US has 50 GW of peak wind installed as of 2012, by far the highest in the world.
on a day-long or hour-long time frame they are almost always wrong
No, hourly predictions for wind are accurate most of the time but occasionally very, very wrong. Even so, in the scenario I drew backed up by gas fired electric power what does it matter?
The only way out is thermal power stations.
Then make your case *why* you think its the only way out by ruling others out. In a future with cheap battery technology and continued cheap gas, please explain why a solar/wind/hydro system can not be backed up with batteries and hydro, and then gas electric for periods longer than a couple days?
Well, I am sorry, I didn't realize that the whole post and discussion was centered on the US only... in particular Texas...
Anyway, your statement...
"on a day-long or hour-long time frame they are almost always wrong
No, hourly predictions for wind are accurate most of the time but occasionally very, very wrong. Even so, in the scenario I drew backed up by gas fired electric power what does it matter?"
... about the accuracy of hourly predictions for wind power is not true/correct IN GENERAL, unless you explain how much in advance they are made! Day-ahead? Pretty good. Two days ahead?... mmmh... easily wrong... want an example? Look at this, UK's official web site from the national transmission system operator NETA...
http://www.bmreports.com/bsp/bsp_home.htm
... scroll down the page until your reach the graph titled "Wind Forecast Out-Turn"... as you can see there are 3 days on a 1/2 hour interval... note the difference, at times astonishingly large, between what is labeled "Initial forecast value" (2-day ahead), "Latest Forecast Value (day-ahead), and "Out-turn Value" (whqat has been actually delivered by Mother Nature)... the differnce is 934 to 4000!... a factor of more than 4!
Want another example? Here it is...
http://www.eirgrid.com/operations/systemperformancedata/windgeneration/
... it is about Ireland's wind installations (all of them, not just one farm).
Play around with dates as much as you like, you'll EASILY, and OFTEn find days when what has been predicted and what has been measured in terms of wind power are two completely different things.
As I said in a previous post, it is TRUE that ON A LONG TERM AVERAGE (several days to weeks) what is forecast and what is generated are close to each other... unfortunately nations, industries, even household need an instantaneous match between what they need and what is delivered, power-wise... and wind, being highly intermittent will have, globally speaking, a very hard time delivering it... if Texas is the heaven of wind that you portray it doesn't mean that you can speak of it as a general example..., just to stay with the examples I have made, there are way more British and Irish citizens than Texans!
Cheers,
Roberto (who lived and worked 2 years in Texas, back then).
P.S.: you also said:
"In a future with cheap battery technology and continued cheap gas..."
again!... your statement is valid only in a US-centric world!... around here in Europe, no matter which country you look at, NOBODY wants natural gas obtained via fracking techniques, nobody... and gas is not cheap at all!... being linked to the price of oil, which as you may have heard is not the cheapest thing around these days. Please try to see the world around you, do not limit yourself to USA (a great country, let me add).
Well, I am sorry, I didn't realize that the whole post and discussion was centered on the US only... in particular Texas...
Please don't put words in my mouth. I think I was clear that I mentioned Germany v. US only because Germany should not be be necessarily taken as illustrative of the problems with solar PV given its latitude. Texas was just one example, that I had handy, showing how wind speed is seasonal. I think it very likely this is more or less the case world wide.
again!... your statement is valid only in a US-centric world!... around here in Europe, no matter which country you look at, NOBODY wants natural gas obtained via fracking techniques, nobody... and gas is not cheap at all!.
In Europe only France and Bulgaria have banned hydro fracking as of this summer. As for the rest of the NOBODY countries:
Shale-Gas Boom Hits Eastern Europe
Fracking Pioneers Pierce Europe
Shale Minister
and so that I'm not overly EU centric:
Tech Talk - Chinese Gas Shale Development
USA ((a great country, let me add).
Thanks Roberto. I agree.
"In Europe only France and Bulgaria have banned hydro fracking as of this summer."
Germany is next, don't worry...
http://www.spiegel.de/international/germany/germany-rejects-fracking-to-...
... and Italy will never allow fracking, they can't even start drilling out regular oil, on-shore or off-shore... so you have the 3 biggest economies of the continent, totalling ~ 200+ million people, who won't use frack-gas... in fact there are too many competing factors, like the TWO gasducts being built in the north and south of the continent, to allow imports of russian/caucasian natural gas to the Continent.
Also, there's a lot of lobbying, especially in Italy, for a third competing gas project, setting up a liquid-to-gas hub in the Mediterranean, using liquified gas imported from the middle east.
Fracking in Western Europe is a non-starter, believe me.
Roberto
Those countries may not *drill* frack wells, of course they'll use cheap fracked gas from, say, Poland.
Fracking in Western Europe is a non-starter, believe me.
I grant you believe that but little more. The UK is part of Western Europe. Perhaps the news link I provided above (Shale Minister) will change your belief.
"The UK is part of Western Europe."
Geographically yes, they are part.
In many other ways they are apart. :-)
Anyway, time will tell, who's right and who's wrong, what is sure is that neither France nor Italy will move to fracking, even if the latter would profit from it, since it's electricity and most home heating comes from natural gas... Germany is next, the "greens" are too strong, politically, they hold the keys to winning elections.
R.
What I see there is, worse case, a drop in output of 25%, i.e. 250MW below a 1000MW forecast for a period of ~five hours. The forecast total output for the 24hr day versus the actual power generated over the 24 hour day is, I think, amazingly accurate. It appears to be within 5-10% of forecast for the day, as is almost every day I review, over the entire day.
As I've said a couple times about hourly outages: use batteries, or overbuild the wind, or run the hydro harder, or pay for some demand reduction, or insert any similarly capital expensive but cheap to operate source you like because you won't need much of it before falling back to a thermal source that is then used infrequently. Today 250 MW of utility grade battery 7-hours deep runs ~$750 million, or ~12% of the likely $6000 million invested in Ireland's 2000MWpk of wind turbines. And I'm not making a proposal for today, but for the future.
From you excellent link to ERCOT's wind forecast studies...
"...From a system operation standpoint, under-forecasting is a more serious issue.
Considering wind generation in isolation, as penetration increases, the number and size of extreme wind forecast errors also increase. The distribution of forecast errors becomes more skewed to the left with additional capacity, which indicates that there is a clear
tendency for wind generation to be under-forecasted. However, wind generation underforecast errors show up in net load as over-forecast errors, which may lead to overcommitment (rather than under-commitment) problems."
Fig.4-13... "wind error"'s curve is not flat and close to zero, it can reach -4000 GW easily over periods of several hours...
I am not sure that this short excerpt can be taken as a minor issue/problem... under-forecasting, even if not very often, can lead companies into bankruptcy, not to mention grid distress.
Roberto
I agree wind forecast errors are a problem currently, hence the in depth attention from that ERCOT study. I contend those forecast problems would theoretically not be an issue if i) that wind/solar resource had immediately dispatch-able, cheap to operate, and dedicated backup like batteries, ii) the errors are on the order of hours so that the fast backup can be small, and iii) longer outages or depressed output is backed up by slower to dispatch sources like gas that are also cheap to build.
The graph above doesn't make sense.
New wind and new solar somehow need additional natural gas back up even though according the EIA the US already has 430 GW of natural gas and 80 GW of hydro: http://www.eia.gov/electricity/capacity/
In addition, natural gas still dominate new capacity additions and together with coal additions outweigh PV and wind additions by far: http://www.eia.gov/todayinenergy/detail.cfm?id=7610
Even if you claim natural gas and hydro doesn't exist:
Coal and especially nuclear don't do load following and they still need power plants to deal with varying demand.
In addition, they also need maintenance and neither can deliver power all the time.
Yet, new coal and new nuclear somehow don't need any natural gas back-up.
"Coal and ESPECIALLY NUCLEAR don't do load following and they still need power plants to deal with varying demand."
I see that the old myth of nuclear not being capable or willing to do load-following is coming up again!...
This one is easy to dismiss, as I have already done here on TOD a few months ago:
http://www.rte-france.com/fr/developpement-durable/maitriser-sa-consomma...
... it's the web site of RTE, the French transmission system operator, if you look at the second, multi-colored graph, moving the mouse pointer over it allows reading the power generated at 15 minute intervals by the different technologies, hydro, nuclear, coal, gas, etc... you will notice, no matter which day you choose, that nuclear production goes down in the wee hours of the day, with a minimum typically around 4-5 am.... today it was ~40,000 MW around 3:00am, and between 5:00am and 7:30am it has gone from 40,3 GW to 44,1 GW, at a ramping rate of 1,5 GW/hour, following the peak demand of the early morning. Also note that wind ("eolien") has gone AGAINST the rise in demand between 5:00am and 7:30am, decreasing from 3392 MW to 2813 MW... meaning that nuclear and coal had not only to fill in the raising demand but also to make up for the missing wind...
Note also the lowest curve on this plot, which lays on the negative side of the vertical axis... negative power means EXPORTED power, going from a minimum of about 4 GW to a maximum of more than 10 GW... now go to this link...
www.entsoe.net
... you need to register on it, it's free, choose a username and password... and you'll have access to all of Europe's export/import flows in (almost) real-time... most of today's French export has gone towards which country?... give it a try, say which one of the 6 neighboring electrically connected countries France has exported in prevalence?... it starts with "G", ISO code "DE"... and today, during the first 21 hours FR has exported to DE a total of 54.346 GWh... i.e. more or less what the 30+ GWp of PV have generated today...
http://www.sma.de/en/company/pv-electricity-produced-in-germany.html
... that is a peak of 10.6 GW at 12:15 with a ~triangularly shaped generation pattern, yielding, judging by the eye... 10.6x12/2=64 GWh (which have cost of the order of 19 million Euros to German customers in terms of "incentives").
Roberto
Increasing power by 4% per hour can hardly be called flexible power plant, given the fact that a gasturbine can go from 0 to 100% in 10 minutes and a hydro power plant can do the same in just 3 minutes.
It does it by only 4% per hour because that's what's asked by demand!... in winter times it varies by more than that, although it almost never goes much higher, because it doesn't make sense to try to follow the (often) rapid variations of wind or PV by using a 4000 MWth reactor... hydro can do much better than that... listen, if France, which averages 3/4 of it's production from nuclear can do it without a zilch, I don't really see how you can claim otherwise... plus... I NEVER said it was "flexible", I simply contended your comment that nuclear DOESN'T load-follow... as a matter of fact German NPP DO load-follow ALL THE TIME!... see below.
This is a rather complete overview of load-following with nuclear, from a knowledgeable source (real data, not simulations):
http://www.oecd-nea.org/ndd/reports/2011/load-following-npp.pdf
The fallacy of your argument ("4% per hour") lays in the fact that that value of ramp rate is for all of the 58 French reactors, but not all of them do the load-follow exercise, only a few... if you look on page 8 of the NEA report I have linked above you will see that even the old-design German reactors can load-follow much more than "4% per hour"... (fig. E.2)... the one labeled "KKU" goes from less than 700 MW to 1300 MW in 3h20' (8:05 - 11:25)... i.e. a 25%/hour, or 180 MW/hour...I wouldn't call that peanuts!
For reactors of new design, like the French EPR,... "It will be able to maintain its output at 25% and then ramp up to full output at a rate of 2.5% of rated power PER MINUTE up to 60% output and at 5% of rated output PER MINUTE up to full rated power. This means that potentially the unit can change its output from 25% to 100% in less than 30 minutes, though this may be at some expense of wear and tear."
Roberto
P.S.: one curiosity: what's the ramp rate of PV and wind, in terms of load-following?
New wind and new solar somehow need additional natural gas back up even though according the EIA the US already has 430 GW of natural gas and 80 GW of hydro:
Yes I agree. As explained earlier, that gas capacity is not mine or other third party's to take and have sit idle 90% of the time while waiting to backup a winter storm or wind lull. Someone invested the capital in the plant and now expects to collect on the kilowatt-hrs sold, probably 80-90% of the time with the current gas price.
So the graph above is a one model of the *full* cost for a solar/wind project that pays for the solar/wind infrastructure and *also* builds the backup required, or buys it since as you point out the capacity already exists under other ownership.
So it is cheap gas that makes solar/wind with backup viable in combination as base load against, say, nuclear. The economic irony is that cheap gas also competes directly with solar/wind plus gas.
Most of those gas power plants are already amortized or definitely will be amortized by the time wind and PV play a role in the electric grid in North America.
That's not at all necessarily true, paid off capital investments are often refinanced to generate cash for yet some other operation. Even in cases where it is true, what is the possible relevance?
Out there somewhere right now is, say, a 500 MW gas plant rolling along on cheap gas at 80% CF and producing 3.5 billion kWh per year. Along with the distribution fees, the plant is bringing in gross revenue of ~$350 million year, which in turn pays for $70-80 million worth of gas (~25 million mmbtu) among other things. Whether the plant is paid off or is under finance is beside the point. The plant belongs to the owner, not you or me. The owner will not give up that revenue, without compensation, to go idle except when needed for wind and solar.
in order to "run" 5% of the time (i.e. produce electricity 1.2 hours/day, thermal power plants have to stay off-grid on stand-by, ready to go, and therefore burning coal/gas/oil for a lot more than 1.2 hours/day.
No they don't. Thanks to weather forecasts they know exactly when their power is needed and can plan accordingly (no one in their right mind turns on a gas turbine hours or even days ahead before it is actually needed). On the other hand, they actually do need spinning reserves for large conventional power plants because they simply don't know when they might fail.
"Thanks to weather forecasts they know exactly when their power is needed and can plan accordingly (no one in their right mind turns on a gas turbine hours or even days ahead before it is actually needed)."
Not even close to reality, this time!
You fail to understand that weather forecasts are far from being reliable, just go on Tennett's webb page (do not have link on this computer) and you'll see what I mean, both PV and wind forecasts for the day are most of the time off, far from real production.
Companies must be VERY, EXTREMELY careful at what they forecast and PROMISE to deliver on the market the day after, because failing to provide what they promised would mean having to find and buy at a very high price on the same-day market the missing energy.
They are therefore obliged to be very pessimistic about what they will deliver... this is evident from a quick look to the data on their web site!
Second thing you do not understand at all is how big a thermal power plant is!... you cannot start it "on demand" when clouds come unforecasted or wind doesn't blow enough... a 500 MWe gas or coal power plant is a monster of thousands of steel pipes and high pressure vessels; which cannot be brought to working temperature, pressure, etc... conditions in 5 minutes, it is not your car's engine idling in January for warming up... they need to be kept at power levels equivalent to 10-15% of full_power, and all this WITHOUT selling a single W on the market (having been pushed out of it by the unfair competition of subsidized PV and wind... they clearly state it on one of the documents you have linked, the Swiss site!... do you read what you link before linking?
C'mon!
Roberto
They have no problems forecasting wind and PV.
http://www.transparency.eex.com/en/Statutory%20Publication%20Requirement...
http://www.transparency.eex.com/en/Statutory%20Publication%20Requirement...
In addition, wind turbines and large PV power plants are controlled remotely and can reduce their output immediately if their power cannot be consumed. And small PV systems reduce their output or turn off if frequency or voltage goes above a certain limit.
They have problems forecasting the actual consumption, since they have little knowledge of the consumers and usually no control over the consumers.
wind turbines and large PV power plants are controlled remotely and can reduce their output immediately if their power cannot be consumed.
To the extent they do, curtail potential power, makes them more expensive per kWh. The curtailment needs to be factored in when calculating the usual energy per year = peak power x 365 x 24 x capacity factor.
As if they don't.. but they can also be credited with the flexibility of being able to. Harder perhaps to put a concrete value on, but flexibility is highly valuable, and many legacy sources are a bit more rigid and brittle than this.
Distribution cost on top of plant gate costs come to something like 2 cents/kwh, so naively if you are utilising the grid but at 5% then the cost per kwh come to something like 40 cents/
Even if this was the case:
95% at 6 cents/kWh
5% at 40 cents/kWh
Total costs: 7.7 cents/kWh.
Besides the grid does obviously already exist and does not need to be built again nor do its costs somehow magically increase just because less electrons flow in one direction. (Most buildings with roofs already have electricity.)
"(Most buildings with roofs already have electricity.)"
Yes, true... agreed... but for the case of Europe (Germany, ITaly, Spain, etc...) self-consumption of the electricity generated by PV on one's roof is MINIMAL... 10% in the case of Germany, just to mention the most celebrated case... so the grid will need IMMENSE expenses and changes/upgrades just to move electricity around the respective countries.
Surely more than 3/4 of the electricity produced by PV comes from big systems, certainly not from roofs of households, it's very easy to check on internet.
Note that this is not my opinion, it's a very well documented FACT.
Roberto
self-consumption of the electricity generated by PV on one's roof is MINIMAL... 10%
That's just crazy talk.
Electricity demand is always higher during daytime and by far most electricity is consumed within buildings.
Also, hot water heaters which run on electricity are currently only run at night, because electricity demand at night is lower. They can obviously easily shift their electricity consumption into the day and directly consume the power from the roof without having to distribute it in the first place.
NO, it's not crazy talk at all!... if you only read the documents that you link!... the 10% datum is taken from one of the links you've given above, from the german federal agency... anyway, not limiting ourself to Germany, if we look at the second country on the planet in terms of PV installations, Italy, the 10% is a close call.
The fact that electricity demand is higher at noon is a fallacy!... we are talking about self-consumption, mainly households who have the typical 3~5 kWp system on the roof of the house... the peak consumption simply happens during hours when nobody is home,kids are in school, parents at work, low consumption friges/TV/etc...can't take 3-5 kW of power,can they?
The vast majority of the power/energy, certainly more than 2/3,is generated by big installations on the ground, and that is no "self-consumption"...it is injected into the grid and consumed sometimes hundreds of km away from the place of production (bottleneck of PV in Italy is exactly this, how to transport almost 3 GW of PV power from the region on Puglia to the industries in the north, 6-800 km away).
What you seem to fail to see is that, staying with Germany's example, PV production in winter is simply an "also ran" case... peanuts in the sea of TWhs... and the same holds for solar thermal... it can only help pre-heat the water, at least for 4 full months of the year (Nov-Feb)... during summer I have seen houses equipped with solar heaters on the roof discharging hot water because the sunshine was too strong and there was no demand for hot water (everybody was at work/school).
I am not saying that PV or thermal solar are useless, they can certainly help and they must be expanded, if nothing just because they represent a formidable pedagogical way of teaching people on the subject of energy production,consumption and conservation...but they are USELESS, especially for central-European countries like Germany, as tools for GLOBAL production of energy.
It is clear, the data you yourself mention are there to testify this.... 30+ GWp of PV, tens of GW of wind, and they can't stop their coal/lignite power stations, coal consumption goes up, emissions go up, etc... what more proof do you want? C'mon!
Roberto
Very few people use electricity heaters for water, except in countries where electricity is cheap... like Norway (hydro) or France (nuclear)...in Germany I am sure that the vast majority uses gas or oil central home heaters.... in Italy simply NOBODY uses electricity, at 25 cEUro/kWh it would be crazy to do it.
Of course, it's pure crazy talk.
Where do you think electricity is consumed if not in buildings?
Switzerland has more electrified public transport than probably any other country in the world and public transport only uses 5% of all electricity.
And public transport also primarily runs during day time and not at night.
Some homes without electric water heater may need less electricity during day time, because their inhabitants are obviously at work (electrified office or factory) or at school (school with electricity not candles), but the store, the factory, the school, the office, the restaurant, the hospital, the university, the trolley bus next door does consume that electricity and all buildings have roofs.
And peak demand is in fact at noon despite the fact that all electric water heaters are running at night and NOT at noon:

And as far as your crazy talk about not being able to use PV and transport electricity in Italy is concerned:
Switzerland alone (without France, Austria and Slovenia) is exporting 2.5 GW to Italy on average and over 5 GW peak!
http://www.bfe.admin.ch/themen/00526/00541/00542/00630/index.html?lang=de
"Where do you think electricity is consumed if not in buildings? "
... duh????... so if this statement of yours is true, what is exactly the use of the massive amount of Germany's PV in summer, at high noon, when there's lot of sunlight?... what are they running, in buildings?... in a country with average very good thermal insulation?
"if not in buildings", you say, like BMW, Mercedes, KRUPP buildings?... normally called "power-hungry factories" with electric machineries, in the country in second place for industrial export? :-)
Can you possibly state ONE thing which makes a bit of sense?
Holy canoly!
Roberto
Cars are indeed manufactured in buildings and some of these buildings and parking lots have meanwhile also PV-systems installed and wind turbines nearby:


"And as far as your crazy talk about not being able to use PV and transport electricity in Italy is concerned:
Switzerland alone (without France, Austria and Slovenia) is exporting 2.5 GW to Italy on average and over 5 GW peak!"
Listen, man!... I have lived in Italy for more than 30 years... so, please, don't try to teach me ANYTHING about a country you have no clue about, OK?
Your example of Italy importing from Switzerland goes exactly in the OPPOSITE direction you have been making in tens of posts... ITaly is the SECOND country on the planet in terms of installed PV capacity, second only to Germany... and yet they do import 24h/24 from Switzerland and France, 365days/year.
Most of what Switzerland exports to Italy is NOT Swiss-made, but French-made... you simply need to go on entsoe.net web site I have linked above and see with your very eyes... today FR has exported towards CH 21 hours out of 21... same thing yesterday 24/24... with average values of 1500-2000 MWh on 1/2 hour intervals... it is due to a lack of interconnecting power directly from France to Italy, the one existing through the Alps is saturated all the time, so what EDF does is to send electricity to Switzerland which then resells it to Italy, with a margin.
Go back to school!
Roberto
Anyone, it's your call, of course, but this is getting painful (and unproductive) to watch.
Would you consider not encouraging him any more?
Ok thanks, good point.
Painful. Right. Unproductive. Right right right., I think of my own situation. I bought some PV for a dollar a watt, I put it up myself over a weekend, I stuck all the boxes of this and that together out in my shop, I got off the grid. I feel good about maybe cutting the burden I put on the world, and most of all, I had fun. fun that didn't cost anywhere near the fun my neighbors had buying those obese pickup trucks and monster TV screens. Or anywhere near the time they spend being stupified by them.
Just do it.
More like 20 cents/kWh with a realistic capital cost and that still doesn't include cost of fuel to operate, even for the 5%, and maintenance.
7% is a realistic capital cost.
But even if you calculate with 20 cents/kWh it would still only add 1 cent/kWh to the electricity bill, because the power plant is not being used 95% of time.
Btw, did they stop teaching rule of proportion in favor of creationism?
Another article posted by you that simply is outstandingly done. Well thought out, detailed, clear and as scattered as this one seemed, right to the point in all the ways needed for the topic. Bravo again!
I came to the same conclusions about lead acid storage that you have now confirmed in the real world. That when you look at efficiencies, storage capacity and utility costs, the cost of replacing the batteries is usually right around the cost of just buying that much electricity. So it can become a bother for no economic benefit. There is the satisfaction of having power in a utility black out of course. :)
I really think we will in the end need to become a mostly daytime culture again. In other words no more BAU even at home.
I can imagine factories that only run when the sun shines with simplicity and lower costs than having storage. Even more so at home. Maybe limited battery storage for some emergency purposes overnight or for extended cloudy days. It seems even when PV is worth doing adding very much storage makes it not worth doing in the dollars and sense manner.
Living without AC at night, or having enough insulation you need pretty much no heat in winter, and other adaptive behavior on our part can make PV more worth doing and cheaper right now.
I think the battery issue applies to electric cars too. They would be so simple, long lasting, reliable and even cheap.....except for the darned battery weight and cost. Imagine a Leaf or even a Tesla without the weight of the batteries to carry around.
I think electrified roads of some sort, trolly systems or some such will be much better in the end. If roads cannot be electrified in some manner more mass transit might be the only good option for any, but the shortest trips. Again, the culture will need to adapt a bit.
One of my favorite articles of all time was yours on building a nation-sized storage battery for all our needs. I don't see the results being any different if lots of people have their own little batteries caches in their own home. If even 25% of the homes took this approach, well there simply isn't that many batteries or the lead to make them to allow that happen. Just one more reason I think battery storage of anything other than a small scale is a dead end street.
I agree with directly using the PV output whenever possible, making ice, running fans, irrigating, cooking. And for storage, grid tie is the method of choice. However lithium batteries are becoming a viable storage option as well, http://www.energymatters.com.au/index.php?main_page=news_article&article...
Lead-acid batteries http://en.wikipedia.org/wiki/Lead-acid_battery have the problems mentioned. Long life dictates the daily full charge with long absorption period that wastes much of the afternoon PV output. A larger battery bank requires correspondingly high PV capacity, with increasing losses to self-discharge. The charge efficiency drops as low as 50% if they are called on to provide high current bursts. Frequent discharge depth below 50% greatly reduces the cycle life.
On the other hand, Lithium batteries do not need the daily full charge or absorption, and in fact last longer if they are never fully charged. So a large battery can be used to store all PV production. Low self-discharge means little loss overnight or during extended cloudy spells. The charge efficiency is above 90%, and there is no penalty for high current bursts.
Typical 36 volt electric bicycle batteries store around a kilowatt-hour and are easily portable; one can be charging while the other is on the bike or power tool (and they can be swapped at any time, no need to wait for a full charge).
A word about MPPT controllers for battery charging: Since the current determines the charge rate, as long as the PV output is a few volts above the battery, a simple buck converter with feedback to maximize current will automatically extract the maximum power. No need for expensive multipoint power circuitry to just charge batteries. The older charge controllers used simple pulse-width modulation with no bucking coil, and did indeed waste the excess voltage.
[Edit: fix link]
Hi interesting article. could you explain how you arrived at:
(1 - fMPPT - finv) = ηMPPT/ηinv
thanks in advance.
Eek! A mistake. Transcribing code to prose, I put / instead of ×. I have corrected in the original DtM source, and will see about correcting it in TOD (and Energy Bulletin...).
Hopefully that switch settles your question, but otherwise I will say this is a hack of sorts to frame the combined (multiplicative) inefficiency of two sources in a subtractive fashion. You can then think of this as a definition of what fMPPT and finv mean.
Looks like most of your usage goes to cooling and refrigeration. Maybe you could dump your excess power into thermal storage in a big freezer plate or radiator.
http://techon.nikkeibp.co.jp/english/NEWS_EN/20120912/239576/
http://en.wikipedia.org/wiki/Lithium%E2%80%93titanate_battery#Toshiba
With the rising costs of electricity and falling costs of PV these may start to become economically viable in some countries/locations - particularly if battery costs also fall over time (which the EV manufacturers believe will happen) and if consumers learn/adapt to reducing/managing their energy demands.
I've seen suggestions that aged lithium batteries from PHEVs could be refurbished for home storage. That could be a 10 kwh battery the size of a suitcase. I don't recall what cycle life was expected. If true such batteries could be housed in a wall mounted cupboard not a standalone shed.
The problem I have with home batteries is the complementary effort needed to lighten the load at night and during winter. Now an all-electric grid connected home typically has aircon, water heating, space heating and energy guzzling appliances like rotisserie ovens. In a home battery system most of that would have to be 'contracted out' with solar HWS, gas or wood heating/cooking and perhaps giving up the aircon in summer. Healthy active people can live like that maybe not frail seniors.
I think the battery should cope with a cold dark week in midwinter when recharging is minimal. Call it 5 days X 10 kwh or 50 kwh ignoring inefficiency. If the aim is no more than a 10% draw down that means the battery needs 500 kwh to start the week. Now the battery bank is half the size of the house. My conclusion is that realtime centralised generation (ie the grid) should be made as reliable and affordable as possible.
Boof, it is not economical to size the battery array for a 10% draw down for infrequent events. Sizing it for less than a 10% draw down overnight would be more reasonable. If one lives in a cloudy location and refuse to shift load to sunny days, an off-grid PV system will be incredibly expensive. If the house uses 10 kWh/day and the location sometimes has 5 consecutive days of overcast, then the PV system will need to be at least 5000 rated watts which would output about 4 kWh on each of those cloudy days. Because the batteries cost more than the PV panels, you could vastly reduce the size of the 500 kWh battery array by installing 10,000 rated watts of PV.
The problem with overbuilding realtime capacity must be overloading the grid if there is no export curtailment mechanism
http://www.smartpowergeneration.com/spg/files/library/A_case_of_sunstrok...
Presumably advanced smart meters can switch off panels. With big household PV arrays of 10kw nameplate or more it's getting to be a case of 'use it or lose it'. In Australia some States had solar feed-in tariffs up to 44c per kwh. These have been largely reduced to 6c or 8c. In other words there is little incentive to build a large system thinking it will earn money through electricity export.
There is no problem with the rate of change of power output from a 10 kW PV array in an off-grid system. Maybe you were thinking about the number of batteries per house needed to balance a grid-tied system with only PV as the power source.
The document at your link is written by Bloomberg New Energy Finance. When Sun rises at 8 am, fixed PV panels with an azimuth of south start at 0 W power output and at noon they reach maximum power output. If Germany has 60 GW of PV in 2020, then the average linear ramp rate over this 4 hour period would be 250 MW/minute. For a cosine curve the maximum ramp rate would be about their stated number of 290 MW/minute. Nowhere in the document do they state that a ramp rate of 290 MW/minute for PV is a problem for the grid. They simply state that it is about 50% than the maximum historical ramp rate for demand. These financial people are proposing to shut down some grid-tied PV inverters to reduce this ramp rate for no good reason as far as I can determine.
Attaching an overbuilt PV array to the grid has nothing to do with this. The inverter simply needs to be sized properly to handle the power from the PV panels.
No sane person would ever construct Tom's nation sized battery. That was a rough calculation which demonstrated that the scale of the concept is impractical.
As for residential feed-in rates (selling PV power to the utility) they are even worse here: 1 or 2 cents / kWh.
From what I understand in Germany there is resentment by gas fired generators that they have to step aside to give grid tied solar priority. Mandates means solar is a 'must take' and the feed-in tariff means solar power is artificially cheap on sunny days. Gas generators want a 'capacity market' whereby they are paid fees to remain on standby
http://gastopowerjournal.com/index.php/regulationapolicy/item/507-capaci...
Oh great...double subsidies.
Most power in Germany is still produced by lignite, nuclear and coal:
http://www.transparency.eex.com/en/Voluntary%20Commitment%20of%20the%20M...
and not by PV - even at noon:
http://www.transparency.eex.com/en/Statutory%20Publication%20Requirement...
So, natural gas is mainly displaced by conventional power plants. This could easily be fixed by replacing part of the payroll-tax with a serious CO2-tax and this would automatically substitute some of the lignite and coal power with natural gas power.
Btw, renewable energy has increased German's grid stability:
http://cleantechnica.com/2012/09/12/german-grid-reaches-record-reliabili...
If Germany has 60 GW of PV in 2020, then the average linear ramp rate over this 4 hour period would be 250 MW/minute.
More like half that. Even at high noon Germany's solar production almost never exceeds 50% of peak installed capacity, with 60% being the most I've ever seen in the recorded data.
"More like half that. Even at high noon Germany's solar production almost never exceeds 50% of peak installed capacity, with 60% being the most I've ever seen in the recorded data."
Look at this
http://www.sma.de/en/company/pv-electricity-produced-in-germany.html
choose the date of 25/5/2012 and you'll see that on the best day of the year the 27 GWp which were monitored by SMA on that date have reached a peak of 21 GW at 1:30pm... i.e. a CF of 78%.
I think I had seen an 80% prior to that, probably in 2011... no time to look for the date now.
Anyway, 78% or 60% for a very short time doesn't change anything, a marginal technology it is, and a marginal technology will remain forever.
R.
Since I assume peak oil and global warming as a given, I always look for thinking on what to do next, so Tom Murphy stands high on my list of who to look for.
On PV. I love it. And I agree that we could design our widgets and our life so as to live on the sun when the sun shines. I think, for example, of fridges and freezers with phase change fluids storing coolth when there is lots of power, and then coasting thru to the next sunny time.
And around here, in winter most days are below fridge temp anyhow, so all it needs then is a little circulating fan grabbing outside air.
Batteries? How about wood? Wood is stored solar energy, and you can get that out- some of it- with a heat engine, my favorite being the stirling, which I now at last have running in my shop. It runs happily at 600 watts, with an expected life of many tens of thousands of hours, far more than me.
The last time I measured one, about 15 years ago, it made about one kw-hr per kg of wood. This one seems at the moment to be about the same. It is a reject engine, and obsolete anyhow, so we could do a lot better than that.
Since we use about 5-6kW-hr/day, the 2kwp PV and the wood generator do well together to keep us happy. Hot water also, of course.
Wimbi,
For years I was in favour of the Stirling engine - that was until I discovered wood gasification.
All Power Labs in Berkeley California are turning wood chips and nut shells into electricity in their 10kW and 20kW PowerPallets using a regular spark ignition IC engine - with an efficiency of around 25%. That's about 1kWh of power for 1.3kg of woodchips.
Wife will tolerate a stirling, Won't tolerate an IC. Neither would I.
Gasifier. Love'em. Problem, still can't make it work every day of week instead of just on monday and thursday, with time off for religious holidays-or something.
Problem, still can't make it work every day of week
So use someone else's design. http://gekgasifier.com/
And perhaps you can make something useful from the effort?
http://gekgasifier.com/gek-imbert-gasifier/reactor-options/pyrolysis-bio...
Stirlings can get similar efficiencies, are easier to operate, and aren't as picky about fuel. Gasifiers scale up better but for the small power user, I'm not sure they are the best way to go.
Nonconformist
I agree that Stirlings can get similar efficiencies, but just try going out and buying a commercial engine.
I have been following progress of Stirling's since 1990, and there have only been a handful of products that have even appeared commercially - most of them have gone bust. There is still an offering by Sunpower, and another by Whispertech - but are <1kWe - not deemed large enough for the typical US household.
2016 is the bicentennial anniversary of Stirling's patent. Let's hope that there will be a resurgence in Stirling interest, a concerted push to commercialisation, and finally get the Stirling out of the lab.
Biomass gasification offers one solution to clean heat generation from assorted biomass - and you can always fire a Stirling from burning woodgas in a high temperature burner.
2020- glad to see somebody has clear vision on stirlings (haha).
http://www.microgen-engine.com/index.php?option=com_content&view=article...
Microgen sells CHP stirlings, made for them in china. They think that 1kW is about right for that app. , at least in europe. that engine is thermodynamically good, but has a non recuperative nat gas burner which knocks its efficiency down to less than 20%. Maybe that makes no difference when you need the heat anyhow. It is also totally unnecessarily heavy at 50kg.
The one I have in my shop weighs about a third of that, but has a congenital defect preventing me from getting its full power. Ah well, nobody would ever produce that design anyhow. That's why I could get it. I have a mere direct chip burner that puts out a 1200C flame, good enough.
Actually, it prefers propane- sinful!
That link doesn't go to "take your money in the amount of X and in 2-4 weeks you'll have it arrive" - at least with $10,000 in my hands I can get a Whispergen.
Not so much for the proposed $5000 Microgen or the hope to get to $2500 proposed CHP designs.
The one I have in my shop weighs about a third of that,
And for the "rest of us" I'll suggest http://volodesigns-sterlingproject.blogspot.com/ all one has to do is take their design and build it ;-)
Or it seems they will eventually sell 'em.
2020,
It will be interesting to see if the price of stirlings can be brought down to a competitive level with gasifiers paired with an ICE. There are other heat engine designs that may end up being cheaper than stirlings so maybe the technology will end up moving past stirlings in the end.
The thing that I like about stirlings is that they lend themselves very well to CHP applications as there is only one high temperature waste heat source and a secondary low level heat source if the heat from the cold end of the stirling is utilized. A lot easier to combine with a boiler than a gasifier with 3 heat sources none of which are particularly high quality. They are also simple and compact and lend themselves to more passive use.
Gasification is definitely the key with heat engines. I suspect that part of the problem with stirlings is that in a wood heat situation they are mounted in a fire box that doesn't achieve high temperatures. A wood gasifing furnace is needed to generate high temperatures in the secondary burn. This can be done with a wood gasifier but is easier in a gasifiing furnace.
OK, just for fun, here is what I am doing to heat the stirling I dug out of the dumpster. I use a stainless steel tube about 60 cm high and 20 in diameter, fill it with wood chips ( free from the line clearing crews who like to dump here with us instead of going miles thataway), and put a big weight on top of the pile to force it down. The incoming primary air comes up thru the bottom of the pile, burns the carbon remaining after the gas has cooked off, and then picks up the cooked wood gas, about a third of the way up the tube this gas (smoke) goes to a central downgoing tube, past the grate where the carbon is burning, and into a venturi where it mixes with secondary air, and then directly into the ceramic burner around the stirling heater head, where it burns at about 1200-1300C, which is plenty hot to drive the stirling to its metal limit temp of 600C.
The exhaust is still about 750C or more and I use some of it to heat the incoming combustion air and dump the rest of the heat into the shop. There is a 50 watt exhaust blower up on top pulling everything thru all the pipes.
this sounds all just hotsy-totsy written down like this, but in reality those chips like to stick in the tube and not drop like I told them to, even with that big weight on top of them. So I keep fiddling around changing this and that, and in the meanwhile keep poking that pile of chips (koff-koff). Meliora.
PS. Sure, I can just go buy a gasifier, and/or I can use pellets instead of chips, but what's the fun of that? Besides, $$$$$.
Sounds like a great updraft gasifier setup! Bridging is definitely an issue with chips, even in a chip bin some type of stirring is required to keep the chips from hanging up. I suspect some of the commercial gasifiers recommend graded hardwood chunks in part to help avoid the bridging issue. Given the chose between free chips which might require a poke occasionally and buying fuel the free chips are a great deal.
Update. My uneducated but very smart appalachian backwoods helper person made a mistake yesterday when following my ideas to try to get rid of the bridging chip problem. The mistake made the whole problem go away, and so now we load up the thing, strike a match to it, and walk away knowing that a while later it will have done its duty of charging up the batteries and gone back to sleep like a good little stirling system should.
We are both very pleased with ourselves.
So Danny there made the obvious remark- "Let's just make more of them mistakes faster so we can get a move on around here". Onward!
This article might be a good candidate for submission to Homepower magazine, too.
The thing that jumps out to me is that San Diego is about as far south as you can go in the US.
So how robust are the conclusions to increasing latitude?
I would suggest that since the summer/winter variability would be much larger at higher latitudes, the overall 62% is going to sink fast.
In addition to that, the further north you go the higher the proportion of power draw needed in the winter.
What is 'not too bad' in San Diego may be a waste of time and resources in Seattle
There's lots of wind and hydro in Washington and there's usually more wind when there's less sun.
And then there is this power line transporting hydro power from the Columbia River in Washington to Southern California, which was already completed 42 years ago (!):

http://en.wikipedia.org/wiki/Pacific_DC_Intertie
So, why not transporting solar power from California to Washington?
Well, assuming California would ever seriously build out solar power, which is probably only a matter of time.
This PV-installer (modila) in Germany claims that he's already below €1/W for large rooftop PV-systems:
http://www.photovoltaikforum.com/pv-news-f25/fallende-preise-t75998-s740...
This means that production costs for large rooftop PV-systems would be about 6 US-cents/kWh at 5.7kWh /day (including 7% profit).
Maybe stupid questions:
What percentage of energy goes to cooling, what to heating in California? Is a simple AC with heating function for winter acceptable, i.e. PV is able to deliver enough energy?
Even if you pay 1500 USD per kW(p) as consumer (5-10 kWp) you get electricity for less than 8 cent. Is this too expensive, what do you pay for elctricity?
I don't live there, but the rates can be found here: http://www.sce.com/AboutSCE/Regulatory/tariffbooks/ratespricing/historic...
And as far as I know at least people in Southern California use little heating or don't use electricity to heat, so electricity demand in the summer is probably higher.
What is being considered here is the capacity factor of a set up in an individual house, not grid systems.
This house is connected to the grid.
Btw, if someone talks about electric cars do you also mention the costs of building roads - completely ignoring the fact that roads already exist?
And if so, do you think it would make sense to build separate roads for electric cars?
San Diego is not as good as you might think, due to the frequency of marine layer clouds. Another statement is that the best location in the lower-48 U.S. (the Mojave Desert) only reaps twice as much sun as the worst place (the Olympic peninsula). St. Louis, MO wins the prize as the most typical U.S. city in terms of solar yield. It gets 84% as much annual solar as does San Diego for a fixed panel tilted at latitude.
For a great deal more analysis on solar potential across the U.S., see my post dissecting the NREL 30-year solar database: http://physics.ucsd.edu/do-the-math/2012/08/solar-data-treasure-trove/.
It is not the total annual incidence, but the annual variability and load pattern which in my view seem likely to drastically worsen the 62% capacity figure you give for your set-up in San Diego if used further north.
You may have more cloud than the Mohave, but in general load and supply fit pretty well, with only daily variation to be coped with by the battery system.
Right—I agree that one must go well beyond the annual figures, into monthly minima/maxima, etc. I did indeed explore this level of the NREL database in the link above to look at what it means for system/storage sizing, but did not go sub-monthly, or consider load variability.
Fair enough.
My point is that the figures you give here should in no way be considered representative of the US, as San Diego is significantly further south than the average, and has significantly warmer winters and shorter winter nights than the average.
As a first guess it seems likely that the average figure would be significantly lower than those you get, but without detailed calculation it is impossible to be sure.
Thinking about it a little more, it is perhaps possible to be a bit more definitive on the effects of latitude on capacity figures.
I did not spot in your analysis where you show what percentage of your total use you get from your system, or how much excess you feed back to the grid.
But in general, assuming that you have sized your system to match peak summer demand, plus a bit as you are storing overnight, then you are pretty favourably placed since in the winter load in San Diego is relatively low, so as far as demand is concerned you can use all the power your system supplies.
The case is very different further north with harsher winters.
For the same percentage of your power supplied in summer you would get way less of your in any case much higher demand in the winter.
The only way to avoid that would be to increase the size of your system, and ship more surplus power in the summer off to the grid.
That is fine as long as not too many people are doing it, but highly detrimental to the grid if a lot of their summer load is covered that way.
IOW not everyone can be in surplus in the summer.
So for a system in general use, any oversizing of the arrays would lead to throwing power away.
So, if you want to keep the percentage of the power you use supplied by your system constant, you have to uneconomically oversize your array or get a lower percentage of your power from your system as you won't get much in winter.
This means that at a constant percentage of power needed supplied on an annual basis your capacity factor is going to nosedive at higher latitudes with colder winters.
So it appears that living in San Diego makes the figures you have supplied a special case, far more favourable to capacity factors than the average for the US.
"Thinking about it a little more, it is perhaps possible to be a bit more definitive on the effects of latitude on capacity figures."
Lots of data on solar insolation for locations in the US: http://www.solarpanelsplus.com/workspace/uploads/solar-insolation-chart-...
I'm in the green area, like most of the US, and doing nicely on solar (off-grid), winter and summer. Just sayin'.
"The case is very different further north with harsher winters.
For the same percentage of your power supplied in summer you would get way less of your in any case much higher demand in the winter.
The only way to avoid that would be to increase the size of your system, and ship more surplus power in the summer off to the grid."
..."off to the grid" As usual, Dave, you've redefined the discussion to your own terms. In the opening paragraph, Tom : "I described my standalone (off-grid) urban photovoltaic (PV) energy system."
"Off-grid". I rarely get involved in these discussions anymore because the seriously grid invested always quickly dismiss any viability of being off-grid and not dependent upon a complex external (and deteriorating) electrical grid.
Also, you make assumptions that most people who adopt solar as their primary electrical source will continue their current patterns of use rather than adapt to weather and seasonal variations. Further, your assumptions regarding seasonal demands don't hold up, at least in our case. Our winter/summer demands are fairly well balanced, and as I've mentioned, some of our record daily production has been on winter days, this despite that we also get much of our rain/snowfall during these same periods.
It's easy to spot a total lack of familiarity with living on a solar budget; the gridweenie mentality of those who feel entitled to as much energy as they want, when they want it. It's the kind of thinking that got us where we are.
Been wondering when you'd pitch in to this.
I was starting to doubt everything again!
Yeah, Bob, besides that I've been busy doing some projects, I get weary challenging 20th century thinking and the comfortable world views that come with it. The inevitable nuke vs. PV arguments, etc., get to be tedious, and it doesn't matter what my PV capacity is, as we've always made do with whatever the sun sends us. Some folks realize that most of us will need to be relatively energy self-sufficient in the future, others expect to keep writing that check every month, taking little responsibility for where their energy comes from. Just because humanity needs a different energy mindset doesn't mean they'll adopt one, at least until folks are forced into it (too late to matter?).
Anyway, I have another consult tomorrow with a couple who plan to build a super-efficient, passive solar, earth-bermed home; Republicans to boot. Who'd have thunk? Until we start building structures that make sense for their climate (again)...
Good to hear GH!
For my part, I just scored about 800' of 3/4" PEX for my nascent Solar Preheater and Storage System, for $200. So I've got that going for me.
Now that I'm back from the foothills of Maine's Lakes Region, I've got to order a Standalone Heat Pump, and figure out who I'm getting my @($#% #2 Oil from this winter, and start to piece together my Diff Controller.
Bob
...Further, your assumptions regarding seasonal demands don't hold up, at least in our case. Our winter/summer demands are fairly well balanced,
Nor would they be expected to hold for your case, which is little different in day/night hours from Murphy's. DaveW's condition was
...further north with harsher winters.
where winter nights can go 15.5 hours (N. Dakota) and snowfall can be 9ft per season (115in Syracuse NY, 100in Flagstaff Az), as opposed to your Carolina location which likely has winter nights only ~20 minutes shorter than Murphy's in San Diego.
Flagstaff, AZ is a great place for PV. It is very rare to have more than 3 consecutive days of full overcast, and when a snow storm passes, crystalline PV panels output unusually high power due to clean sky, cold and sunlight reflecting off the snow. My record power output of 90% higher than the rated short circuit current occurred after a snow storm while the sky was partly cloudy.
Yes I understand PV efficiency improves with lower temperatures and total collection improves with snow reflection - from the ground. The point was what do you do with the nine feet per season of snow and ice *covering* the panels, as then the output falls, not low, but to zero. Are you up on the roof, johnny on the spot, sweeping them clean after every storm?
At higher latitudes you need a higher Panel Angle, and anyone who is going to be building in snow country knows to build them so they self-clear.
It would also be a no-brainer to put some heat tape up under the right edges and induce the avalanche if you must, which you can also do with a hose and warm water, or even come up with a rope-driven rig to get the thing started..
My stuff is generally clear enough to work a few hours after the precip stops.
It's not that hard a problem to work out any number of ways.
(I think I'd see if I could get MOLFLOW to huff and puff on mine.. they would just shake off the snow laughing!)
This is Flagstaff, Arizona, 35 deg N. Annual snow fall 9ft.
Alternatively, you could adopt a pet "mountain ape" that climbs and clears your PV panels in exchange of a few mountain bananas...
Roberto
As ever, a deft and cutting rejoinder. Touche'! /snark
But it does bring to mind the job-creating possibilities of hiring a local teenager to do it. It's also easy enough to set up a simple catwalk to access one's rooftop system. Reaching the panels would be as easy as going up to the attic. You might want to be equipped with a Sunhat and Shades, but no other radiation gear or dosimetric equipment would be required.
It's hardly a great problem.
"It's hardly a great problem"... I agree 100%... the greater problem is that PV panels do not generate electricity on demand, they do it very inefficiently, cost a fortune, etc... even for educated people living in very sunny areas like our host!... how about trying in Hamburg, north Germany? Milan, Italy? Paris?... "sunny" Paris??? How about London?... isn't it a great place for PV?
Roberto
P.S.: concerning the radiation gear &/or dosimetric equipment, no need to have it even in nuclear nations, so I take your comment as a joke.... or were you serious?
Roberto (worked for several years 1/2 mile away from the biggest plutonium repository in Europe, within 19 nuclear installations, spent past 20 years at sites with at least one operating nuclear reactor, and more...)...my health is certainly better than that of the several hundred million chinese who live in the shadow of power stations burning the main alternative to nuclear, coal.
do not generate electricity on demand, they do it very inefficiently, cost a fortune,
1. They only produce power during day time when demand is higher.
2. They do it without fuel and cooling water and can even produce more energy than the building underneath demands on average.

This building in the Swiss Rhine-valley produces 448% more energy than the entire building including heat pump requires, despite the fact that this valley has more fog than other regions:
http://www.solaragentur.ch/images/content/PDF/G-11-09-12%20Solarpreispub...
3. PV-modules start meanwhile at $0.49/W: http://www.sunelec.com/
While new nuclear power plants at $8 /W even before Fukushima:
www.thestar.com/comment/columnists/article/665644
www.time.com/time/printout/0,8816,1869203,00.html
www.npr.org/templates/story/story.php?storyId=89169837
www.ocala.com/article/20101026/ARTICLES/101029758?p=2&tc=pg
how about trying in Hamburg, north Germany? Milan, Italy? Paris?
Hamburg has lots PV systems on its roofs and they don't get a single penny more than those in Bavaria:

But why don't the major cities have nuclear power plants in their centers?
my health is certainly better
Well, maybe your physical health...
Wow... $0.49/watt. Now I've got to figure out how to frame and mount these things. Thanks for the link. (8mm of glass with no frame sounds like a shipping nightmare.)
Granted these are not the same thinfilm modules, but are also mounted without a frame:
http://www.schueco.com/web/ch/partner/solarstrom_und_waerme/produkte/pho...
http://www.singleply.co.uk/pdf/schuco-datasheet.pdf
A collegue once ordered frameless thinfilm modules from China and they were well packaged and didn't brake and he simply fixed them to the railing of his balcony. Sort of like this but with railing bars (the bars can even be in front of the module as long as the shaded cells are not serially connected to the unshaded cells).

PV-modules start meanwhile at $0.49/W: http://www.sunelec.com/
Note that ad is for thin film, so that 70 of those panels would be required for the typical 5KW installation: large roof and install cost required.
Also I think you'll agree that nuclear cost per unit power, though expensive, at least includes installation and delivery, unlike those thin film panel prices.
These panels are roughly 2 feet by 4 feet (600mm x 1200mm) so 100 panels (7 KW) would fit a roof of 16 feet by 50 feet. This is one system where mounting and BOS costs would likely exceed PV costs.
"But why don't the major cities have nuclear power plants in their centers?"
Actually you are wrong on this too!... un-be-lie-va-ble... you do not miss a single one... try these coordinates on Google Earth:
45°12'22.093N 5°41'34.54"E
... the city around it and the metropolitan area are home to more than 500k citizen.... welcome to Grenoble.
Also, just to give another example, the hot water coming out of the tertiary circuit of the 2 Beznau nuclear reactors in Switzerland (a country you have cited many times in your posts), running since 1970 is used to heat homes in the villages around it, district heating... can you believe it?... scaaary... radioactive water must be, right?
By the way, we are talking about two reactors, totalling only 730 MWe, which generate about 5.8 TWh/year, i.e. the equivalent of 6.6 GWp of German PV!... but 24h/24, not only around noon in summer!
http://en.wikipedia.org/wiki/Beznau_Nuclear_Power_Plant
Relax, and breath slowly, you have a long way to go before graduation.
Roberto
P.S.: coming back to your silly statement...
""But why don't the major cities have nuclear power plants in their centers?"
... for that matters major cities do not have 150 m tall windmills either, nor 50 MWp PV power stations... so next time try and think harder about something really intelligent to say, OK?... this one was really lame, to say the least.
"3. PV-modules start meanwhile at $0.49/W: http://www.sunelec.com/
While new nuclear power plants at $8 /W even before Fukushima:"
One day someone will teach you the difference between capital cost and levelized cost of the electricity... for the time being try this
http://www.nrel.gov/analysis/tech_lcoe.html
and play around with numbers... try for instance to plug in the values of capital you have written above and the following values for the capacity factor... let's try Germany's values, OK?
CF(PV)= 10%
CF(nuclear)=90%
Come back and tell us what you got interms of LCOE, please.
Roberto
PV panels ... they do it very inefficiently, cost a fortune, ...
Why not cite the cost, or at least what you think it costs? What does a PV panel cost? Cost to install? What does a new nuclear plant cost in, say, the US? When the energy source is free and can not be depleted in the case of solar, why does the 'efficiency' alone matter?
Btw, Solarbuzz doesn't seem to be accurate as far as module pricing is concerned.
I would refer to this site:
http://pvinsights.com/
or this
http://pv.energytrend.com/
Thanks. What is the evidence that Sb is not accurate? Hopefully not simply the odd panel sale on the likes of E-Bay.
Peakprice for modules at Solarbuzz is almost double what completely installed PV systems in Germany cost:
http://www.photovoltaikforum.com/angebote-f41/50827-32kwp-1169eur-byd-t8...
http://www.photovoltaikforum.com/angebote-f41/98527-7kwp-1297eur-yingli-...
http://www.photovoltaikforum.com/angebote-f41/94036-16kwp-1360eur-yingli...
http://www.photovoltaikforum.com/angebote-f41/09496-3kwp-1330eur-sharp-t...
http://www.photovoltaikforum.com/angebote-f41/97209-11kwp-1370eur-yingli...
This PV-installer (modila) in Germany claims that he's already below €1/W for large rooftop PV-systems - so that is less than half of what peakprices for modules at Solarbuzz are: http://www.photovoltaikforum.com/pv-news-f25/fallende-preise-t75998-s740...
I am serious. I can bring a panel on my porch indoors and let my daughter sleep on it for a cot, if I wished. I could break it in pieces and still serve spaghetti on the shards as my dinner dishes. Maybe I'd want to tape up the edges a little..
You were a 1/2 mile away with security systems, barriers and expensive personnel keeping all those systems secure. With PV, I don't have to be a 1/2 millimeter away and remain safe. Except maybe for snow sliding off of them at certain times on winter mornings.
For a small snow storm I do not clean off the PV panels because the snow melts quickly when Sun shines. For larger storms I climb up on the horizontal shed roof and remove the snow. I use my hand to wipe it off the PV panels and a rake to push it off the roof. I have to shovel snow all around my house and clearing off the PV panels is part of the chore. There is no period of winter in which there is constant snow on the ground in Flagstaff. At 35 degrees north latitude it snows and melts in sunny places at the elevation of Flagstaff. It does not accumulate except on the shady ground under a thick canopy of Ponderosa pines or where a snow plow has pushed it into a pile. There is never 9 feet of snow on the ground.
When it snows in the daytime, the snowflakes usually melt upon contacting the PV panels. When it snows at night, it accumulates and needs to be cleaned off the next morning. Some of my PV panels are manually adjustable in altitude. In the winter they are pointing close to the horizontal meaning the glass surface is close to vertical. When the snow gets thick, it slides off from gravity. APS's solar energy plant in Flagstaff uses a single axis tracking system that tracks in altitude. The snow slides off twice a day when the panels rotate near the horizontal pointing direction and any residual melts quickly under sunlight.
"The snow slides off twice a day when the panels rotate near the horizontal pointing direction and any residual melts quickly under sunlight."
Our trackers rotate east to near vertical at night, so little snow accumulates. Any snow that does accumulate is easily removed with a squeegee on a long telescoping pole, or melts quickly.. Snow also does a nice job of cleaning the panels. The point is that we always have what we need, and if my wife wants to watch TV or run the dishwasher, one of us may need to go out and clean the panels. It takes less time than going out for a pizza ;-/
Interesting; nice work. I'm curious as to what extent residential installations have attitude adjustment. I see most of the road side single panel PV supplies for signs and metering are tilted steeply for winter sun in over to maximize minimum sun, and they also thereby shed snow quickly.
My concern in this discussion was solely to determine whether the 62% capacity figure Tom gives is a general one, likely to be attainable on average in the US.
My conclusion is that it is not, and average capacity figures will be lower, since San Diego is rather far south with relatively mild winters.
It's not clear where the extra lost efficiency you imagine will originate. If you look at the ingredients, you'll see that all the same players will be in the system whether installed in the Mojave or on the Olympic Peninsula. The MPPT efficiency won't care where it's installed, and the same goes for the inverter, the system components, and to a large extent, the battery. It's in the battery that one might see the largest deviation. But even here, how bad can it get?
My system uses the battery for about half its power, reducing fbat to 0.08 from the 0.17 that it would be if I were really idiotic and only used my off-grid power at night (the other direction from numerous suggestions on this thread that I use more daytime energy). So in this whacked situation, the 62% may become something like 54%. But that's about as bad as I see it getting, and what a silly system design that would be.
The latitude has little to do with the 62% number. This is more about load scheduling and system size. Extremes in scheduling would let my system range from 54–70%, no matter where I installed it. The numbers would also change if I moved to a differently-sized system, so that the fixed tolls of system and inverter baseload would constitute a different share of the total: larger systems will achieve higher net efficiency.
What latitude does impact is the size of the PV array needed, and the overbuild factor (see other post) to make up for shorter winter days. The battery bank size also is sensitive to latitude, but more so to the weather patterns and the number of socked-in days one might expect.
Tom, you are not using high power loads, such as a microwave oven or power tools, with your PV system. In my PV system such loads are greater than the maximum power output of my PV array and thus always extract power from the batteries when used. Cooking dinner using electric appliances would mostly extract power from the batteries because it is done in the evening when there is little or no power from the PV panels.
On the other hand, my inverter uses 6 W when idle and .5 W in stand-by which greatly improves the efficiency of that term in my system.
I do not discharge my batteries as much as you. The energy consumed during the previous night is usually restored between 9 am and 10 am leading to a greater reduction in capacity factor due to unused power.
It is very difficult to estimate whether your capacity factor is typical.
Same as you, Blue. Except my heavy hits are near noon when the sun can be blasting away at higher power than my house is using even with the microwave and the grinder going.
And with all this chatter about grid backup, why not some more talk about CHP? A house based combustion power plant, which also bestows hot water and some space heating? These things exist and are getting better fast. Perfect supplement for PV.
or how about designs that take photons to power a Stirling and the cold side of the Stirling is used for building heat/drive a ammonia cycle cooling?
We started off at the beginning of the year with the intent of living up to our preaching- no more fossil fuels. We got off ff hot water with the greatest of ease, just using the wood stove and a cheap swimming pool solar heater for the summer. We then got 1kW of PV, put it in ourselves in a week, and got somewhat off the grid with it, then went slowly to all LED lights and far more efficient water pumps, lived thru 11 days no grid after the great end of June storm, doubled the PV and learned some more little tricks, and now, winter coming on, fired up that old but serviceable stirling engine and are going into the cloudy days confidently with wood heat/hot water and wood/solar electricity.
It was no problem adjusting to using solar electricity at times when it was sitting around begging to be used.
Next, off propane with a biogas generator.
Last week we used 0.5 kw-hrs from the grid, by mistake. (I still am connected and can switch each circuit independently)
Fun! Easy ( if you are a DIY and have a little disposable money) Lots of bragging rights! Highly recommended! And think of all those new meters you can look at instead of getting your brain fried by a TV ad.
We live in a spot with mighty close to the average USA insolation, and about 40 north.
Thank you Tom for posting this. It's a very clear illustration of what goes on in domestic PV circuits.
Tom
Like this post very much (as usual). I have tried to gather similar data 'by eye' on my sailboat. Xantrex battery monitor keeps track of sum current and battery state of charge. My refrigerator is the major load and I use a whole boat fan for cooling (via inverter) similar to your house fan. As some have commented, 'making hay while the sun shines' is a viable approach for the refrigerator using thermal mass and/or phase change salts. The holding plate type refrig works very well with this approach. Have you looked at modern boat systems? We face the same issues of limited time phased power availability and there are some creative solutions available. You might enjoy www.frigoboat.com for 12/24 volt refrigerator systems, they are my current favorite and I hope to get one before too long (and water cooling instead of fan/air for the condensor).
I enjoy your posts, much appriciated.
Eric