| ASPO-USA Conference, November 30-December 1, Austin, Texas | The Oil Drum | Tech Talk - Global Crude Oil and Iran |
Shale Oil: The Latest Insights
Posted by Rembrandt on October 24, 2012 - 12:25pm
The impact of unconventional fuels like shale oil on the global energy system is still an issue of great uncertainty. Not so much because of the size of the tank (the resource base), but due to the large physical effort necessary to obtain a sizeable supply of this type of fossil fuel. For instance, to exploit tight shale oil formations we need large capital expenditures to obtain relatively low flow rates from many horizontally drilled wells.
The developments of all things shale oil were discussed at a seminar organized by Allen & Overy and their Future Energy Strategies Group in London on 16 October, of which a summary and key take-away points can be found below the fold. With many thanks to both Allen & Overy and the speakers at this event for sharing their knowledge on these important developments in a public setting.
Key take-away points from speakers at Allen & Overy meeting:
- There is a large existing shale oil (and shale gas) resource base but whether the resources can be developed economically at sufficient scale in many countries is still an issue of uncertainty.
- Two promising shale oil plays outside of the US are the Vaca Muerta in Argentina and Bazhenov Shale which both have double digit figures of potentially recoverable resources, with large players like Chevron, Statoil etc. engaging in their development.
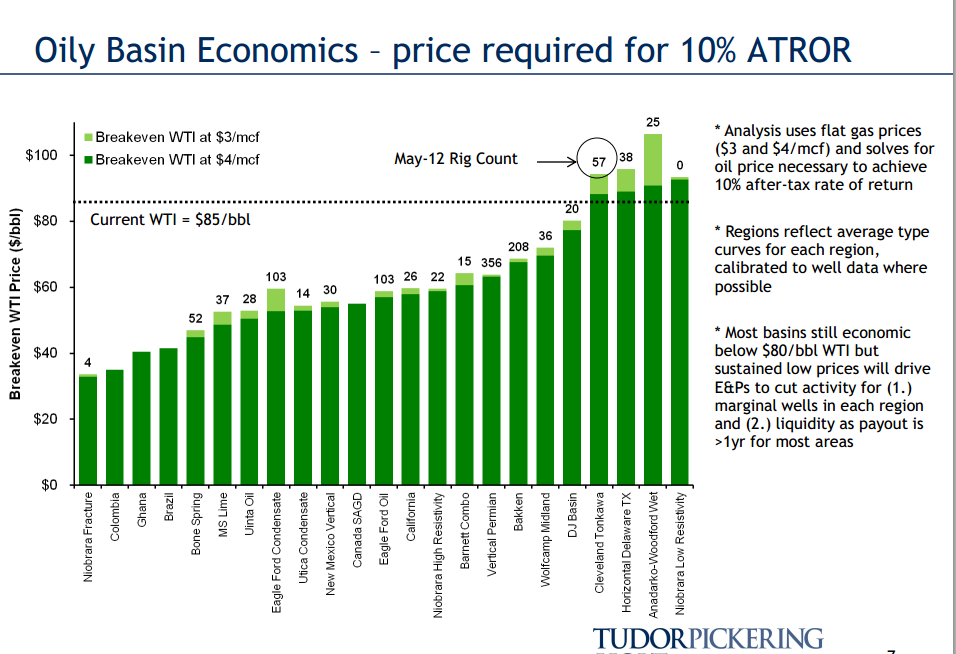
- The marginal cost to develop shale oil in the US is around 90 USD per barrel with average cost of most plays around 60 USD per barrel.
- The effects of the abundance of shale gas in the US, which sent natural gas prices plunging, is unlikely to be replicated in the oil market because of its different market structure (globally connected oil market versus fairly closed domestic gas market).
- The US may not produce as much natural gas as currently anticipated in the future, because the industry will be more motivated to drill for shale oil then shale gas, given the availability of drilling rigs, because it is more profitable.
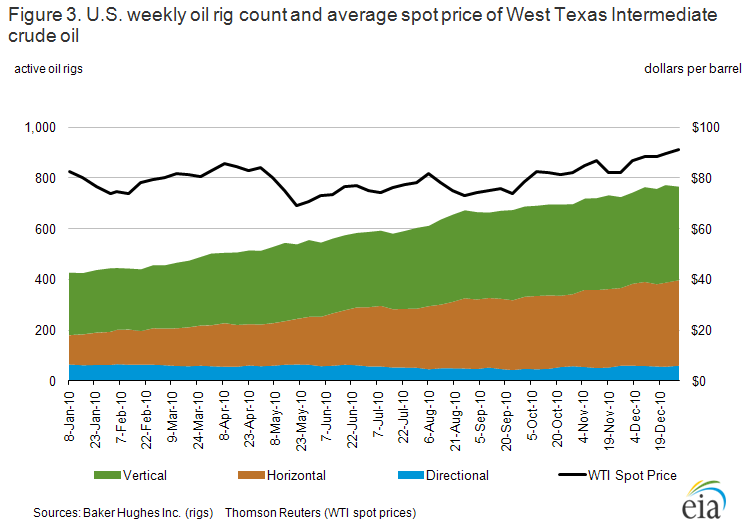
- We already see a shift today from dry shale gas basins being drilled to shale oil basins being drilled, including those with associated gas.
- In the UK a report is about to be released by the British Geological Survey on shale gas resources and reserves. Of the studied basins, the most promising one is expected to be the Lancashire shale basin because geological studies indicate the reservoir to be more than a 1000 feet thick, as opposed to US based shale plays which are in exceptional cases up to a hundred feet in thickness.
- There is a wide spectrum of views on the potential for shale oil production in the United States, with the pessimistic end being a maximum of 1.8 million b/d (of which 0.9 million is already in production) from Corelabs, and the optimistic spectrum expecting 3 to 4 million b/d from shale oil in the longer run (2020s).
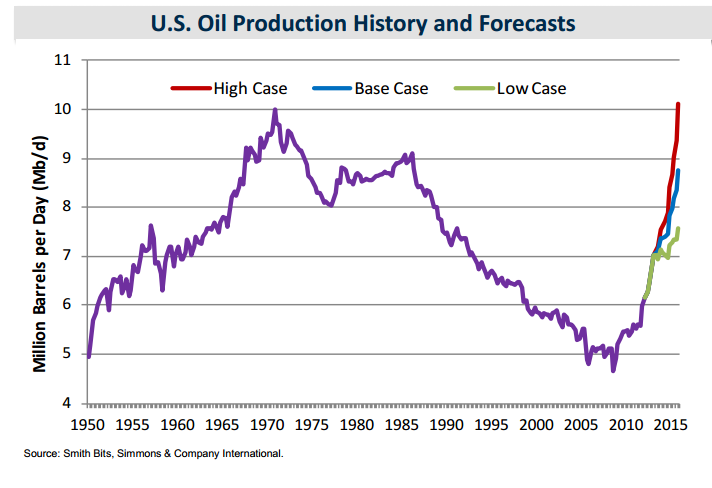
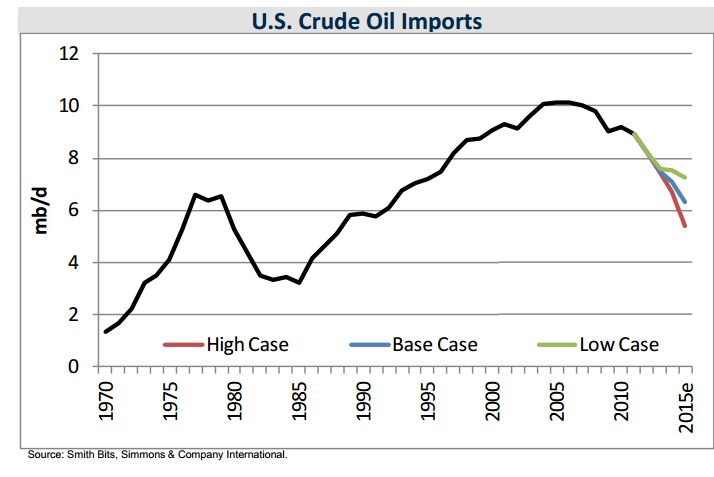
- If the more optimistic scenarios become reality the consequence would be a substantial decline in US oil imports, falling from 10 million b/d to 6 or 7 million b/d from 2008 to 2015.
Presentation (1) Justin Jacobs, Journalist or the Petroleum Economist
The first presentation about the big picture on shale oil was given by Justin Jacobs, journalist at the Petroleum Economist. He highlighted the importance of the US Eagle Ford & Bakken plays (approx. 27% and 63% of total shale oil supply), and emphasized large production expectations in the short term, with the EIA forecasting 1.5 million b/d shale oil production in 2013.

The Petroleum Economist recently made a first map of oil & gas unconventional resources across the world, to be found here, which Jacobs used to demonstrate the large number of unconventional resource plays in the world. He picked two of the most important shale oil plays to keep an eye on for the future:
- Vaca Muerta in Argentina, one of the largest discovered outside of the US. Its development cost is 250 billion USD over 10 years (with production potentially amounting to 200,000 b/d by 2020). The Repsol YPF section of the basin holds 22 billion barrels of oil equivalent of recoverable resources according to a Repsol YPF initiatied Ryder Scott assessment.
At present development has been slowed by the nationalisation of Repsol YPF by the Argentinian government who took a majority share. Because the investment required is at minimum several billions YPF is trying to find big players who are willing to invest, including Chinese firms and Chevron.
- The Bazhenov Shale in Russia, has drawn interest from ExxonMobil and Statoil who have agreements in place for exploration and geological studies with Rosneft. The first exploratory drilling is to take place in 2013, and the licenses under investigation are expected to contain 15-20 billion barrels of resources. Total resources of the play have been estimated by BofA Merril Lynch at 60 to 140 billion, whereas Jacobs noted that these are wild early stage estimates, but that the shale play’s large size is beyond doubt. He cited Statoil estimating 2014 as an earliest possible production date, however, in his view attractive fiscal terms then currently offered by the Russian government would be necessary for development to take place. The play has also attracted attention from Lukoil, Ruspetro and TNK-BP.
The key issue according to Jacobs is whether the large existing resources can be developed economically at sufficient scale. The development requires thousands of wells due to the steep decline rate, which necessitates the on-going development of a new services sector in the majority of countries with plays. Similar to calculations by Rune Likvern as well as Arthur Berman and Lynn Pittinger published at the Oil Drum, he cited shale oil development to require high oil prices at 80-90+ USD per barrel.
Another relevant point brought forward was that the abundance of shale gas in the US sent natural gas prices plunging. The effect is unlikely to be replicated in the oil market. The reason is the difference in market structure. The oil market is fungible in its imports and exports and requires a high oil price to meet demand. In contrast the US gas market is fairly closed with production being sufficient to meet domestic demand.
Presentation (2) Richard Sarsfield-Hall, Pöyry Management Consulting
The second presentation was given by Richard Sarsfield-Hall from Pöyry Management Consulting, who posed the question "Is shale oil the brave new hydrocarbon frontier?" He reiterated important common points on the US gas market:
- The current low price level of 3 USD per MMBtu.
- The much higher marginal cost as opposed to current price levels.
- The oversupply of gas caused by a over-drilling given the cost-price imbalance.
- The growth of shale oil and shale gas requires more and more wells to be drilled to maintain and grow production (see Rune Likvern and Arthur Berman’s articles linked to above for more details).
The key issue presented by Sarsfield-Hall was about internal dynamics in the US market, as he sees a drilling competition occurring between the developments of dry shale gas reservoirs (Haynesville, Fayetteville) as opposed to shale oil reservoirs with associated natural gas (Eagle Ford) and shale gas reservoirs with associated liquids (Utica). This occurs because of more favourable economics for one versus the other in today’s market conditions (high oil price, low natural gas price in US). This is also possible because exactly the same type of rig is used for shale gas well drilling and shale oil well drilling. According to Sarsfield-Hall we already see this happening in today’s market, a point quantitatively further emphasised by the third speaker Tim Guiness, Founder Guinness Asset Management. He showed that well drilling has been overtly dropping in dry shale gas plays, while it has been constant or increasing in shale oil and shale oil with associated gas plays.
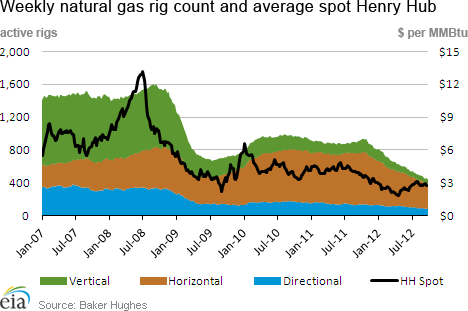
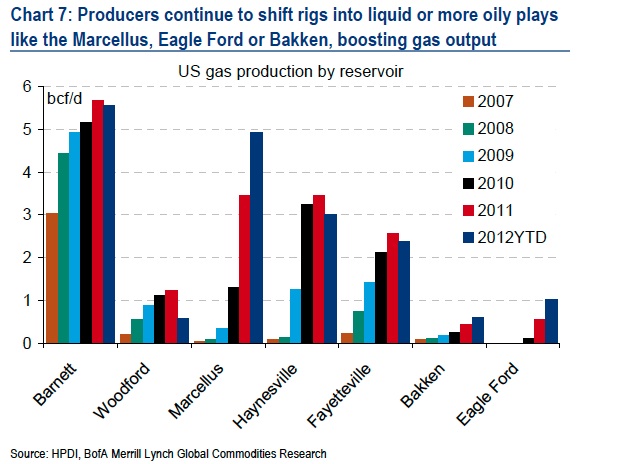
The implications of this competition are primarily affecting the expectations of institutes and market players, as the US may not produce as much natural gas as currently anticipated in the future, because the industry will be more motivated to drill for shale oil than shale gas. As Sarsfield-Hall puts it “There is a definite move of drilling from dry shale gas into shale oil with associated gas, the rush to shale oil potentially means insufficient shale gas delivered, which may result in higher gas prices and/or insufficient volumes to feed potential US LNG exports”. In addition Sarsfield-Hall showed EIA estimates which are primarily dry gas based increases, with little increase in associated gas from the expansion in shale oil. In terms of shale oil we are talking about a 10%-25% production share of total oil production in the coming decades according to EIA projections.
There were some numbers displayed. One key projection was for dry shale gas production, from a firm called ARC Financial, which showed decline expectation of 0.6 bcf/d up to 2013 from a current level of 23 bcf/d for dry shale gas production. Also some US associated gas production numbers were presented as per table 1, which is gas produced from oil fields (either free gas or dissolved in oil as a solution).

In the last part of his presentation he highlighted work POYPRY has been conducting for Cuadrilla, one of the major players in the EU which is trying to get shale gas production off the ground in multiple countries. The study was conducted to calculate the impact of shale gas development in Lancashire in the United Kingdom, the results of which will be published in a couple of weeks. The Lancashire shale basin is interesting according to Sarsfield-Hall because geological studies indicate the reservoir to be more than a 1000 feet thick, as opposed to US based shale plays which are in exceptional cases up to a hundred feet in thickness. This would in theory make UK shale gas in Lancashire much cheaper to develop. The information provided is preliminary, with full details about to be released by the British Geological Survey (BGS) in a report on UK shale gas resources and reserves.
In using Cuadrilla’s scenario for production POYPRY found that UK natural gas imports could be reduced by 21% by 2020-2025 through shale gas developments. Their conclusions were that this could drive natural gas prices in the UK 4-6% lower which would save consumers 810 million pounds per annum. It would not in his view impact the UK achieving its 2020 renewable targets and alter its power generation at the volumes discussed.
Presentation (3) Tim Guinness, Founder Guinness Asset Management.
The last presentation was from an investors' perspective, with Tim Guinness, chairman and founder of Guiness Asset management, and lead manager of their Global Energy Fund, presenting his views. He began by reiterating the reasons why the US has been able to develop their shale plays as:
- Improvement in ability to steer the drill bit.
- Development of ability to drill horizontally.
- Discovery of how to use hydraulic fracturing.
- US land and mineral rights.
- Relatively low population density.
- Adequate access to water.
- Existence of large successful oil & gas service industry and independent exploration & production sector.
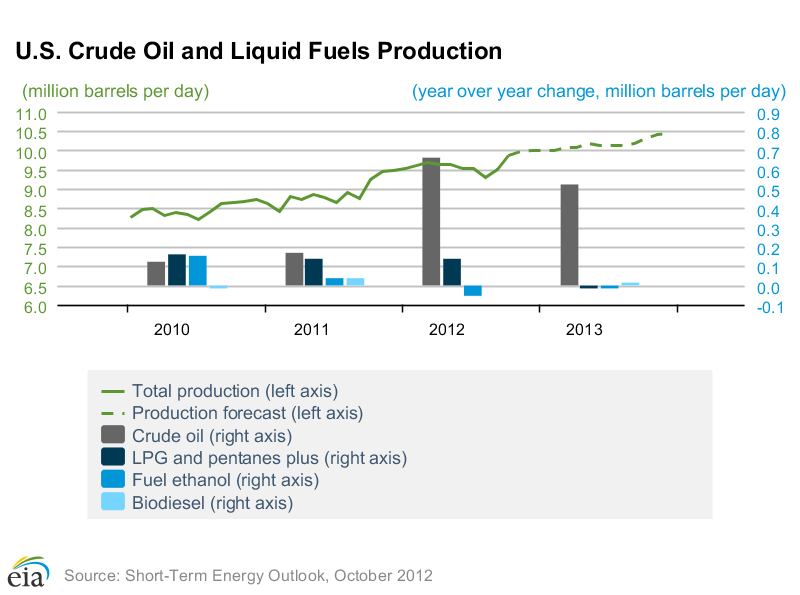
He confirmed the switch from dry gas to shale oil/liquid rich shales with associated gas that is occurring, displaying rig figures per type of shale basin (predominantly shale oil, shale gas, and liquid rich with oil + associated gas). In addition he noted that the growth in gas supply has stopped in the US and is on a plateau, whereas oil production is growing substantially due to shale oil. He cited an onshore production estimate for December 2012 at 4.8 million barrels per day, which has been growing since 2008 after 38 years of decline since the peak in the 1970s, of which about 1.2 million b/d is from shale oil.
In his synthesis he compared three different estimates for shale oil production:
Table 2 – US oil production forecast for 2015 from Simmons & Co. Expectation based on 85 USD per barrel of oil and 3.50 USD per McF of natural gas.

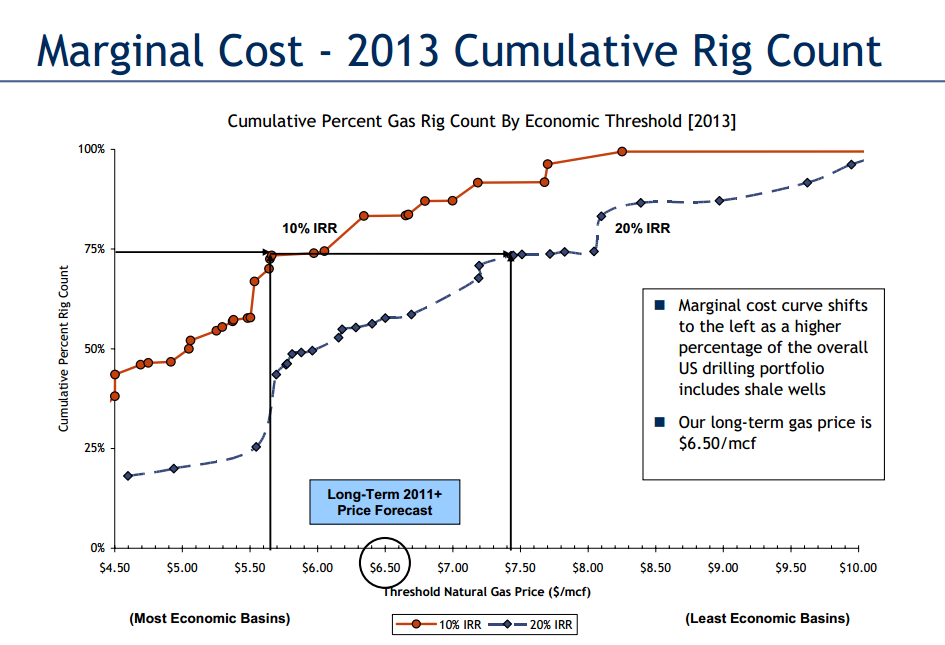
The final point Tim Guinness discussed was marginal cost, which according to Tudor Pickering for the majority of shale oil plays requires 60 USD, with the highest costing ones amounting to 85-90 USD (see figure 9 for details). He also cited Bernstein Energy research which shows cumulative resources of 30 billion barrels of US shale oil to be available at a cost below 150 USD per barrel. Some of the plays have a very low cost range, such as the Eagle Ford, where a figure of 40 USD per barrel was cited (Tudor Pickering shows this play around 60 USD).
Finally in his conclusion, as per recent Bernstein Energy research, Tim Guinness stated that shale oil is not a game changer for these specific reasons:
- Quality drilling locations are finite.
- Shale oil cost structure is high.
- Drilling efficiency gains harder to obtain than in gas shales.
- The industry structure (OPEC) is better for oil.
- Scale of US shale oil find relative to the oil market is small.
In Tim Guinness' words: “It is akin to something like the discovery of the North Sea, Alaska or GOM. A useful addition but not a game changer, as the world needs 5 new North Seas every 20 years to provide enough oil to meet growing demand.”
Previous articles on Shale Oil and Shale Gas at The Oil Drum
- September 25, 2012, Rune Likvern, Is Shale Oil Production from Bakken Headed for a Run with “The Red Queen”?
- August 15, 2012, Ruud Weijermans & Matthew Hulbert, Shale Gas Assets - Overpriced Or a Liquid Turn for Mining Giant BHP?
- January 26, 2012, David Hughes, With Gas So Cheap and Well Drilling Down, Why Is Gas Production So High?.
- August 15, 2011, Arthur Berman, U.S. Shale Gas: Less Abundance, Higher Cost.
- July 24, 2011, Heading Out, Tech Talk: natural gas production, as shale gas arrives.
- April 17, 2011, Heading out, Tech Talk - the new EIA Shale gas report.
- December 19,2011, Heading Out, Tech Talk: When oil isn’t crude and gas isn’t gas, the Eagle Ford Shale play.
- October 28, 2010, Arthur Berman, Shale Gas—Abundance or Mirage? Why The Marcellus Shale Will Disappoint Expectations.
- July 28, 2010, Gail the Actuary, Arthur Berman talks about Shale Gas.
- December 13, 2009, Heading Out, Shale gas and water.
- November 15, 2009, Heading Out, Horizontal wells and gas shales.
- November 8, 2009, Heading Out, Shales and the gas within them.
Contact
- Content: editors at theoildrum dot com
- Tech support: support at theoildrum dot com
License

This work is licensed under a Creative Commons Attribution-Share Alike 3.0 United States License.
Some questions:
1. Won't the $90 price requirement for shale production go upwards as the costs of inputs (water, steel, chemicals, drilling and cooking energy, etc.) goes upwards?
2. Won't shale producers still sell their product to foreigners if these buyers outbid US consumers? In other words, how can the US become energy independent unless oil is also nationalized in some form?
3. Are foreign producers developing shale plays in the US?
4. Could the costs of shale production go down as economies of scale lower prices for shale equipment and chemicals if bought in bulk due to a large ramping up of orders for these components? Or has prduction already increased enough that we have squeezed most of the overhead costs out and probably won't see more savings in this area?
5. Are there any new technological discoveries in shale production that will make it cheaper?
6. If the US makes more of its own inland oil- won't that reduce oil tanker use and hurt the shipping industry, coastal refineries, etc?
7. Could this increase earthquakes? Around nuke plants?
8. Won't all this just speed up the destruction of the agricultural system due to more CO2 and higher temps stunting plant germination?
C8 - Most of your questions are too hypothetic for me to give a reasonable answer. But:
"Could the costs of shale production go down as economies of scale lower prices...?" Not by very much. Other than drilling multiple wells from the same drill pad there really nothing to scale up. Each well is a world unto itsel. And drill pads themselves are not very expensive compared to the cost of the well.
"Are there any new technological discoveries in shale production that will make it cheaper?" Some frac water cycling equipment may help some but in general no.
"Could this increase earthquakes?" nearly all the man made seismic activity has been attributed to waste water disposal wells and not from frac'ng or the producing wells.
@C8:
1. Not necessarily. The costs of water, steel, chemicals, etc. are determined by more than just drilling activity. In fact, drilling activity is just a teeny-tiny fraction of the total consumption of each of those inputs, particularly if you look at a worldwide scale. For example, highrise construction in China and auto assemblies in the US each alone probably consume many, many times more steel than the US oil & gas industry will ever consume even if the High Case scenario above comes to fruition. Not sure what you mean by "cooking energy." The oil from shales like the Bakken is thermally mature, light sweet crude. No cooking needed.
2. I could be wrong, but my understanding is that there is some kind of federal law which prohibits US exports of crude oil (though certainly not of refined products).
3. Yes, US companies have many joint ventures with companies from China to Norway for oil/gas shale development.
4. That's a complicated question, unknown. Could be an unimportant issue considering #5 below.
5. Potentially, yes
6. It could definitely hurt oil tanker businesses, but some of this new oil is already being shipped to coastal refineries (particularly Eagle Ford shale oil in Texas, which is making its way to coastal Texas refineries). So the answer to the latter half of your question is "no." As another example, they're already shipping North Dakota oil to a refinery in Anacortes, Washingon via railroad.
7. See ROCKMAN above. As for the nuke plants, needless to say that only would be a concern if there's any drilling *around* a nuke plant.
8. Unknown. CO2 generation depends on consumption, not production (since only consumption actually burns the fuel). If we continue to decrease our consumption even while increasing domestic production, CO2 generation would go down anyway.
Let me refine question 8: does shale mining/fracking create significantly more CO2 than conventional drilling? In other words- does all that energy intensive fracking produce lots of CO2 as a by product? Much more than conventional? I am not referring to consumption of the product. Thanks.
It probably does create more CO2 than conventional production, but since it's also more expensive oil than conventional oil, it will encourage thriftier usage at the consumer's end of the process. And since the consumer's end of the process consumes considerably more oil than the production end will ever consume, that is the more important metric.
abundance
a quick question on your linked article
Sliding sleeves, which all three service companies offer, can cut costs in the Bakken from as much as $2.5 million per well to $750,000, according to a Sept. 19 investor note from JPMorgan Chase & Co.
It appears they are talking a cost reduction of $750,000-$2.5 million per well. But since they reversed the order of those two numbers it looks more like the total cost of the a well will go from $2.5 million down to $750,000. Journalist ignorance or deliberate attempt at misdirection?? Last I heard the individual Bakken well cost was in the $8 million range give or take a million. Maybe ROCKMAN, Rocky or someone else who has been it for a while can tell us the last time they saw an oil well come in for $750,000 in the USA or Canada.
C8 - IMHO just a marginal increase if any at all. But not from drilling. Drill rigs are powered by diesel fueled generators. They produce the same amount of CO2 whether they are drilling a 12,000 straight hole in a conventional play as a horizontal shale well with a total drill length of 12,000'. The frac trucks do create a lot of CO2 when at full power but that time lasts for a few hours to a day or so. Normal drilling ops can run for many weeks or months. In fact I suspect if one did the calculation, often more CO2 is produced moving the rig and equipment from one drill site to another than the frac'ng process itself.
besides CO2 exhausts from the drilling/operation I would be interested to know more about the methane slip from the fractured soil. This might be a considerable contribution to the entire CO2 footprint of this operation?
Methane slip from the fractured soil? There ain't no such thing. The fracturing process takes place a mile or so underground, below impermeable layers of rock.. And methane (CH4) is not carbon dioxide (CO2).
Methane is natural gas, a product you normally want to produce and take to market. Unfortunately in the Bakken they are flaring much of it, which is a waste because it is a valuable fuel if it can be collected and delivered to market.
I think the point was that methane is a greenhouse gas. In fact it is 50 times more potent as a greenhouse gas than CO2 although it does not stay in the atmosphere as long. Since methane can be a useful energy source in itself besides a potent greenhouse gas it seems important for the government to ban flaring and require recapture of the methane in some fashion. Others on TOD probably know more about the technical details of recapturing methane instead of flaring it off, its costs and the technical aspects of it.
One of the laudable things Rocky Anderson, Justice Party Presidential candidate and former Mayor of Salt Lake City did to cut greenhouse emissions over 30% was investing in capturing the methane from sewage treatment plants. Not only did this lower greenhouse emissions but provided some minimal profits.
rolf - As Rocky mentions that's not possible. You might be confusing methane pollution from production operations vs. the hz drilling and frac'ng process. Everywhere along the entire transport chain, from the well head to your kitchen stove, there is some relatively small amount of methane leakage. And as you seem to understand it's a more effective GHG than CO2. No such system can be made 100% leak proof. You just hope to keep it to the minimum possible.
thx for the info - good to know there is little risk for methane to escape to the atmosphere. This data source http://www.epa.gov/methane/sources.html shows that natural gas systems are the biggest methane GHG contributers in the USA. I wonder how this figure might change with widespread fracturing and the necessary systems covering large areas?
rolf - I doubt it will cause a huge increase. But I mean that in relative terms. I can't make a guess but there's probably already a very large amount of methane leakage around the world. Manmade but also a lot of natural sources. Adding any producing NG well, whether it's a frac'd Marcellus well or a DW GOM well, there's going to be some leakage. From leaky stoves to frac'd wells to farting New Zealand sheep there's a minor individual amount emitted. But collectively I suspect the actual number would shock folks. That's why I say the amount of methane leakage from oil patch operations is small but only in comparison to how much is leaked to the atmosphere from all other sources. Again, just my WAG.
I just recalled a story from long ago. The EPA had to give the city of Atlanta an exception to the Clean Air regs at that time. There were so many deciduous trees in the region that it pushed airborne hydrocarbon concentrations above the fed regs.
I saw that DOE conducted an early evaluation of the impacts of natural gas fracking on climate change and it estimated that, because of the high emissions of methane, that natural gas from fracking had a similar impact to burning coal. Sure the CO2 emissions are lower, but the methane emissions are a significant contributor because methane is over 10 times more efficient than CO2 as a greenhouse gas. Of course over time, the methane reacts in the atmosphere to form CO2, but it is the initial high emissions of methane which are of concern.
I believe that the greatest source of methane leaks is from the casings, therefore, if the industry were to either be more responsible or if it were to be regulated appropriately, those emissions would decrease.
If foreigners can outbid US consumers for US produced oil, then they will also be able to outbid US consumers for foreign produced oil, leaving nothing to import. That sounds like energy independence to me, albeit at a much lower consumption level than at present. Now, it may be that costs of transporting oil to markets may mean it would be more economical to export some oil and import oil from other sources. In that case, becoming more energy independent would likely raise domestic energy prices.
7. Could this increase earthquakes? Around nuke plants?
It seems shale oil production is unlikely to produce earthquakes around nuke plants--as it is very unlikely liquid disposal wells will ever be allowed anywhere near them but
shale gas certainly has shaken up at least one nuke plant.
and this plant's license is good until 2033
I remember watching the construction progress on that one back around the end of my college days. That didn't go as well as planned either. It had to have its construction permits extended in 1972
on the grounds of shortage of skilled tradesmen and technical personnel, delays in completion of the piping system restraints caused by extensive seismic analysis requirements, the addition of a makeup water pretreatment system to insure a constant quality demineralized water supply, and under-estimation of the original schedule requirements.
Little facts on the ground like these do make it very difficult to buy into the rosy build up scenario nuke proponents love to toss around.
I must say, it is quite odd to see such claims and graphs from "Simmons & Co". Time marches on I guess.
We seem to have hit an oil plateau and it may last for a few years. I hope we use this time wisely.
Remember funny little graphs like this one?
2006
Just 6 years later, we're talking about this. If myself or anyone else had showed even the low case back in 2006, we would have been laughed at.
Actually, the old (ASPO?) US projection was too optimistic for 2010, showing production slightly above 6.0 mbpd, versus the actual rate of 5.4 mbpd, but of course the question is what will we see in 2020, and it looks the old chart shows a prediction for about 2 mbpd in 2020, which does now seem too pessimistic, but I think that we need to consider the effect of rising decline rates from existing wellbores. My guess is that at least 90% of the shale oil wells now producing will be plugged and abandoned, or down to 10 bpd or less, 10 years from now.
If memory serves, ExxonMobil put the overall global decline rate from existing wellbores at 4% to 6% per year. Given the high decline rate wells we have been adding in the US, an 8% to 10% per year overall decline rate in existing US wellbores is probably a pretty good estimate. So, in round numbers we would need about 500,000 to 600,000 bpd of new production (and from enhanced recovery efforts) per year to offset the annual decline from a crude oil production base of 6 mbpd.
And given the growing reliance on shale oil plays, the overall US decline rate is no doubt increasing with time. In other words, the "Red Queen" effect, i.e., the industry will have to run faster and faster, just to stay in place.
Of course, note that a 10%/year decline rate would not bring production to zero in 10 years. From a production base of 6 mbpd, with a 10%/year decline rate, production would be down to 2.2 mbpd in 10 years. However, as noted, the overall US decline rate from existing wellbores is probably accelerating.
Does the Simmons chart already account for decline rates? On page 15 of their presentation it says their assumptions about decline rates are a point of uncertainty.
The EIA's compilation of forecasts of total US oil production for the year 2025 range from 4.26 - 7.1 mbpd. Any idea what sort of decline rates those forecasts are assuming, and how they compare to yours?
I just wish Matt Simmons was still alive .
Here is another opinion about the crude output/cost relationship from Goldman-Sachs (FT):
(click on for big.)
Higher prices are needed to bring petroleum to market, the market cannot afford the higher price or the associated credit costs.
Maybe we could ask Matt Simmons about this:
HE Naimi leads tour of mega projects
http://www.saudiaramco.com/content/www/en/home.html#news%257C%252Fen%252...
This begs the question where an additional 3.5 - 4 million barrels/day over the next 2 to 3 years will come from? I am laughing at this graph.
The article explained where that additional 3.5 - 4 million barrels/day over the next 2 to 3 years will come from.
One possibility that has crossed my mind is that the projections of increasing production of tight oil could come true, but in ways that undermine the case of the cornucopians.
As has been mentioned several times on TOD, there is a very steep decline rate in production from wells of tight oil. Consequently, constant drilling is needed in order to keep production up, let alone increase it. This much has been discussed.
What happens, though, if the price of oil drops? Drilling stops! In past production cycles, it has been the case that the initial development cost of a field is vastly more than the operating cost once it's up. Thus, when the price drops, the company or country that owns the field has to keep pumping for cash flow reasons, despite losing money on an accounting basis. Yes, they stop drilling, but they're stuck with wells that will produce for ages, so the oil production overhang continues and the price drops even further.
With tight oil, however, the massive decline rate makes a big difference. If you stop drilling, production starts dropping in no time at all. Excess production is swiftly taken off the market by the simple expedient of the cessation of drilling new wells. Therefore, if tight oil production is of a meaningful size in relation to the world market (as it seems to be at the moment), the economic cost of tight oil acts as a price floor.
Now let's look at the optimistic projections for tight oil production, as well as the report on the cost necessary for the industry to break even. I can make sense of them by predicting that prices will continue to increase. If the average cost of an extra 3.5 MBD of tight oil comes in at $US115/b, then that's the minimum price that will apply.
The cornucopian argument has retreated. No longer are they predicting a "wall of oil" that will crush OPEC and bring back the halcyon days of the 1980s. Instead, their message seems to be "Yes, there is a lot more oil down there, but you'll have to pay a lot more for it".
Is there a report available to provide the basis for estimate for this graphic?
if so, please post the link
Cheers
The link to the Simmons report was already given above. It is here.
The two graphs superimposed. I wonder if this is not another case of irrational exuberance.
Or how about this. Let's assume Tim Guinness is correct when he says "It is akin to something like the discovery of the North Sea, Alaska or GOM."
I copied the Alaska curve and placed it so that the marginal area under the new curve is approximately equal to the marginal area under the Alaska curve.
The problem with that graph is that it is already outdated. U.S. crude production is October was 6.5 mb/d. You could get 6.7 mb/d before the end of the year. Next year has a lot of added production already baked in. American will go beyond 7.5 mb/d in crude oil production within 2 years from now.
The question is, how much further? I think above 8 mb/d is a realistic target. 9 mb/d is stretching it a lot.
Westexas has a very good point about decline rates. Bakken decline rates are very steep, accelerating the oil wells' descent into a spent spot.
Still, The graph above is a sobering reminder that pessimism on TOD and the PO community in general can become groupthink at its worst. And that, obviously, leads to flawed analysis.
Or, in the alternative, most of the people on TOD and in the PO community tend to be irrational wild eyed optimists, when one considers "Net Export Math," in the context of (so far) rising demand from developing countries.
My GNE/CNI comments:
Some per capita consumption numbers for 2011 (BP, Total Petroleum Liquids):
US: 22 BO per person/year, and falling
Japan: 12.6, and falling
China: 2.7, and rising
Economic commentators have been noticing recently that the Chinese economy is reaching a turning point and is about to become a lot less resource intensive. Basically, they have built the bulk of the cities they will need, as well as the bulk of economic infrastructure. This is likely to have consequences for the amount of oil consumed per head of population.
The implication of this for the Export Land thesis is that we cannot simply assume that past trends will continue. Chinese economic statistics will have to be watched very closely to see whether trends have changed and, if so, in what manner.
Strictly speaking, rising consumption in China is what I called ELM 2.0, i.e., the observed tendency for developing countries, e.g., China, to increase their oil consumption, even given an average double digit rate of increase in annual global crude oil prices since 2002. So far, it looks like what we are seeing in China is a slow down in their rate of increase in oil consumption, but another factor is domestic Chinese production, which appears to have stopped increasing. US net oil imports increased at 11%/year from 1949 to 1970, when production peaked, and then US net imports increased at 14%/year from 1970 to 1977 (in the late Seventies, Alaskan North Slope production came on line, and US consumption fell).
From 2005 to 2011, Chinese net oil imports increased at 9.1%/year, which was below the long term 1949 to 1977 (12%/year) rate of increase in US net imports.
Of course, the literally huge difference between the US, in the 1949 to 1977 time frame, and China currently is the vast difference in population. In round numbers, a one barrel per person per year increase in US consumption the 1949 to 1977 time frame would equate to only about a 0.2 barrel per person per year increase in current Chinese per capita consumption, in order to produce a similar volumetric increase in net imports. Or a one barrel per person per year increase in Chinese consumption would be equivalent to a five barrel per person per year increase in US consumption, in the 1949 to 1977 time frame.
Regarding "Net Export Math," it can best be expressed as the following:
I don't see much room for optimism regarding the following two charts:
Global Net Exports, 18 mbpd Gap:
(2002-2005 rate of change: +5.3%/year; 2005-2011 rate of change: -0.7%year)
Available Net Exports (GNE Less Chindia’s Net Imports), 17 mbpd Gap:
(2002-2005 rate of change: +4.4%/year; 2005-2011 rate of change: -2.2%year)
Something to keep in mind though is that for a number of countries, and especially China, part of oil imports are used to make exports so that component is subject to demand in other countries. When you look at the Chinese balance of trade you see that overall their surplus isn't so enormous but that there is a wide spread between the region/country with whom they have the largest surplus versus deficit. For example, they import huge quantities from Australia but then transform those raw materials to sell them to Europe/US. That part of their demand is really indirect EU/US demand, not "native" China demand.
Rgds
WP
As I said, I copied and pasted the historical Alaska curve. So the fine-scale pattern of spikes and dips won't match the current trend.
My point is that something isn't adding up. Either Simmons & Co is correct with its prediction of an asymptotic production curve shooting up to 9 or 10 mbpd. Or Tim Guinness is correct that shale oil will amount to "something like the discovery of the North Sea, Alaska or GOM. A useful addition but not a game changer..." They can't both be correct. (And maybe neither is correct.)
Also, the EIA has a compilation of forecasts for 2025 that range from 4.26 - 7.1 mbpd. My crude little cut-n-paste exercise shows approximately 4.26 mbpd of production in 2025.
Given either the low, base,or high cases happens as predicted on this graph, the production surge will peak...looking at the last two peaks, they seem to have been ~ 7 and ~ 12 years in duration (bumpy plateaus)...after this surge peaks and plateaus, production will fall off.
it is inevitable, Neo.
How many more time do you think this will occur?
Perhaps the next surge after this will be from Venezuela.
After that.... ?
There are a finite number of rabbits to be pulled from Earth';s hat.
I have guessed for years now that we might be able to keep pulling rabbits from hats until about ~ 2030 our oil production goes into terminal decline. I may be rather optimistic.
Maybe by then we will have engineered microbes to eat coal in-situ and turn it into gas...
That will last as long as it does, then...
...we will have perfected relatively safe nuke power or will be in a 'Power-Down' civilization mode, with some wind and solar...population will likely be commensurate with resources after a fashion.
When you look at cumulative production, I would bet that actual US cumulative crude oil production, through 2011, was actually below what the US projection predicted. Of course, the question is what happens from here, but I wouldn't be surprised if EUR for the US turns out to be only 10% to 20% more than what the model predicted. In other words, thousands of wells quickly headed toward stripper status (10 bpd or less) will make an incremental difference, but not a material difference.
We shall see what happens.
Looking at the base and optimistic forecasts in Simmons' chart, can anyone explain how we get from 6.2Mb/d in 2012 to 10.2Mb/d in just 3 years? That is a 22% increase per year for every of the 3 years. What other word can one use instead of "optimistic"?
What other word can one use instead of "optimistic"?
Fantasy?
It seems that most or all of these types studies are ignoring phase behavior of oil reservoirs. As a gas saturated oil reservoir's pressure is drawn down, gas breaks out of solution, like opening a bottle of soda pop. This can turn oil wells into gas wells, sometimes in a dramatic fashion; as evidenced by this example in Montague County, Texas, center of the Barnett "Combo Play": https://docs.google.com/open?id=0ByzHC8NkwR_gd1I3Tm1sdHk2Smc
Oil and condensate production ran from about 5000 bopd in early 2010, to about 18000 bopd in mid-2011, and now back down to about 7000 bopd by mid-2012. Several hundred wells were drilled in the period, including 150 completions reported this year! Note that EOG is the dominant player, and still calls the play a "growth" area in their investor material published this month (see pages 8 and 27): http://www.eogresources.com/investors/slides/InvPres_1012.pdf
We may be seeing some of this behavior emerging in the Eagleford, as described by Swindell here: http://gswindell.com/sp158207.pdf
I eyeballed the gas-to-oil ratios (GOR) changes on the type wells here: https://docs.google.com/open?id=0ByzHC8NkwR_gWXY5SnV6dFctb2M
The GOR more than doubles in some of the counties in about two years. Some caution on this one though; it is early life, and there could be a sample bias in the normalization process as the gassier wells were likely drilled first.
Do the forecasts noted in the post take phase behavior changes over time into account? If not, are there some out there that do?
Indeed. Because of the Spindletop style development of the Bakken, way too much gas is flared. Flared gas is typically underreported or not reported at all. Forecasts are tricky, especially for the future.
The North Dakota Bakken reservoir temperature is typically in the 200 deg.F plus range. Bakken oil typically contains more than 30 mole percent intermediate components. What will happen to the Bakken oil when pressure is reduced ?
You have made a good point, but for people on here to understand your point, you will need to dumb it down(in my opinion). Facts don't often play well on here(again, in my opinion).
Given the numbers of engineers, geologists and scientifically educated among the TOD readership, I do worry that you think we need that much spoon feeding. We may need a bit more detail about the geology of the Bakken to fully understand the implications, but facts are what we are looking for.
Thanks Guys. I did look at North Dakota statewide production in a similar fashion, and fortunately the GOR seems well behaved to date (<1500:1 cu.ft./bbl); but you make a good point on the possibility of inaccuracies on the flared gas. It would be interesting to dig down to the more mature counties, but that's a bit of a PITA from the state data. Will report back if I find the time.
As for "dumbing down"; I agree with Ralph, but I'll take a stab at it anyway: ...like opening a bottle of
soda popbeer.Can even "dumb up": ...like opening a bottle of
soda popchampagne.;-)
Oui, Monsieur, Jacques Pack de Six Bouteilles de Champagne, les faits s'il vous plaît, rien que les faits! >;-)
Statewide and countywide GOR changes may be seen in the rearview mirror, if at all. New wells will come on at a high rate with a low or underreported or zero(not reported) GOR, older wells will have a higher GOR at a much reduced rate.
Fieldwide data is more robust, but still suffers from the averaged GOR syndrome. Well data or possibly township or otherwise grouped data sharpens up the analysis.
The same applies to forecasting statewide production based on average well productivity. Averaged productivity syndrome.
Not one mention of the principal factor: the high price of crude oil makes the development economic.
Tim Guiness also said that among other limitations
Can anybody unpack that one?
Seems key to how much oil can be accessed at any one time, and access will get worse with every 10,000 new wells added, and at some point, unknowable just now, will limit ultimate recoverable resource?
I assume this limitation also means rising average costs, impacting even more on some fields than others?
Why is Eagle Ford lower cost than others, and will this change?
Good point Blue. I was tempted to respond initially but I think many may be getting tired hearing it. But here we go point by point:
Geosteering improvements: 20 years ago I could geosteer a bit and keep it in a 3' wide window at 10,000'. Windows for a typical Eagle Ford well are tens of feet wide and at shallower depths. US shale laterals are 2,000' to 8,000' long. In the El Shaheen Fld in the Persian Gulf Maersk has been successfully drilling 35,000'+ laterals for years.
Hydraulic frac'ng was "discovered" over 50 years ago.
Privately owned mineral rights: Yep, a positive factor...for over 100 years
Population density: the "population" on every well I've drilled in the last 37 years has been the same: zero. And when the neighborhood gets crowded: over 30 years ago they were drilling wells in S CA from fake buildings in heavily populated areas.
Water access: if you can afford to pay for it. Eagle Ford drillers are paying ag businesses much more for their water than they could make farming. Everything is available if you're willing to pay the price.
Significant oil field service infrastructure is a big plus. A great advantage over other areas in the world. And has been for over 60 years.
Back to your point about oil prices: the production potential of the Bakken, Eagle Ford et al trends has been known for over 50 years. The tech used to exploit these plays today was developed decades ago. While the points made are true to varying degree they are not new developments. Every well drilled in a shale play today could have been drilled in the late 90's...if oil hadn't been selling for 60%+ less than it is today. As has been said many time: follow the money.
Thanks for putting it in a "shot glass" for me, Rockman, as well as most other studious and knowledgeable contributors, many thanks.
Would I be out of line to ask a question?:
Is it true that only 3%-6% of crude is made into vehicle fuel (mainly auto gas)?
Thanks again to you and the many others.
Well where I live, New Zealand, a mere 4.5 million folks on a couple of islands about as far as you can get from anywhere I can answer your question, because we are very good at counting stuff and are almost painfully honest about it:
Go here and you will see pretty charts that show that we, with a US style drive everywhere lifestyle, use 67% of our imported oil for domestic transport and of that 91% is land transport:
http://transportblog.co.nz/2012/08/28/oil-strike/
So 9/10ths of 2/3rds is used for driving around. All that farming, fishing, and forestry takes only 6% ! And to export it on ships is not a big issue energy wise as that is very efficient even before we go back to wind powered ships..... And that's pretty much our whole economy. Add to that that we are drowning in renewable electrons [80% last year and could easily be 100% fairly easily] I figure that this place could work very well if only we really got to grip with the car culture better..... Our wind farms are the most efficient land based ones and are unsubsidised....
But still we drive the SUV to the corner store... for how long i wonder, as we have absolutely zero political power to influence resource flows....?
Duke - Not even close. Right now we use around 16 million bopd and 8.7 million bbls of gasoline. Not sure if that number includes diesel. Just some rough numbers I pulled up quick. Doesn't take into account volume changes from refining. Doesn't take into account biofuels. But it's obvious that your numbers aren't even close. I've read before that it's around 40% to 50% which seems to be supported by the numbers I pulled up.
Which gets to the point others have made: changing our motor fuel consumption habit is critical to dealing with PO.
Of course the primary problem facing the US consumer is the average 17%/year rate of increase in global annual (Brent) crude oil prices from 2002 to 2011, as the ratio of Global Net Exports of oil (GNE*) to Chindia's Net Imports (CNI) fell from 11.0 in 2002 to 5.3 in 2011, and the rate of decline, at least through 2011, was accelerating.
The primary driver behind the US lower 48 renaissance in production is this price signal**, aided by improved technology, but the dominant global trend we are seeing is that the developing countries, led by China, have been, since 2005, consuming an increasing share of a declining volume of GNE.
Chinese per capita consumption of total petroleum liquids increased from 1.5 BO per person/year in 2002 to 2.7 BO per person/year in 2011. By way of comparison, US and Japanese numbers in 2011 were respectively 22 and 12.6 BO per person/year, in both cases declining, as both countries are being outbid for access to global net exports.
For every one BO per person/year increase in Chinese consumption, the volume of Available Net Exports (or ANE, GNE less Chindia's Net Imports) would fall by 3.7 mbpd, assuming flat Chinese production and assuming no increase in India's net imports (ANE in 2011 were 35 mbpd).
Increasing US production is very important, but the Texas natural gas data--and numerous recent shale play reports that support Art Berman's work--are not very encouraging for the longer term. In Texas, which has had the longest recent history of the use of widespread modern drilling and completion efforts in shale gas plays, we have seen a steady year over year increase in Barnett Shale gas production, through 2011, although the rate of increase in Barnett Shale production has slowed considerably. However, total Texas natural gas well production started declining in 2009, as rising shale gas production could no longer offset declines elsewhere (Texas RRC data). The Texas data are not encouraging for the longer term US oil and gas outlook.
*GNE = net exports from top 33 net exporters in 2005, BP + Minor EIA data
**Although the WTI price is of course lower; however, US consumers are paying a product price which is much more closely linked to global prices
I've not made a comment on TOD for a wee while but this talk of shale oil had me going to the BP annual review to check how much conventional stuff is now claimed. Once you subtract the Canadian and Venezuelan heavy oil it comes to about 1270 bn bbls. By my reckoning we have now consumed slightly more than this - about 1300 bn bbls by the end of this year.
This means that we have for the first time (I think?) consumed more conventional oil than is quoted in reserves. Seems like a bit of a milestone.
Note - I make no comment/judgement here about the accuracy or otherwise of claimed reserves.
TW
"The effects of the abundance of shale gas in the US, which sent natural gas prices plunging, is unlikely to be replicated in the oil market because of its different market structure (globally connected oil market versus fairly closed domestic gas market)."
- the abundance of shale gas in the United States has more to do with the by-products of shale OIL production than shale gas, and in itself is dependent on current field geology ie may not be repeated.
The proof is in the pudding.
https://www.dmr.nd.gov/oilgas/stats/Mountrail.pdf
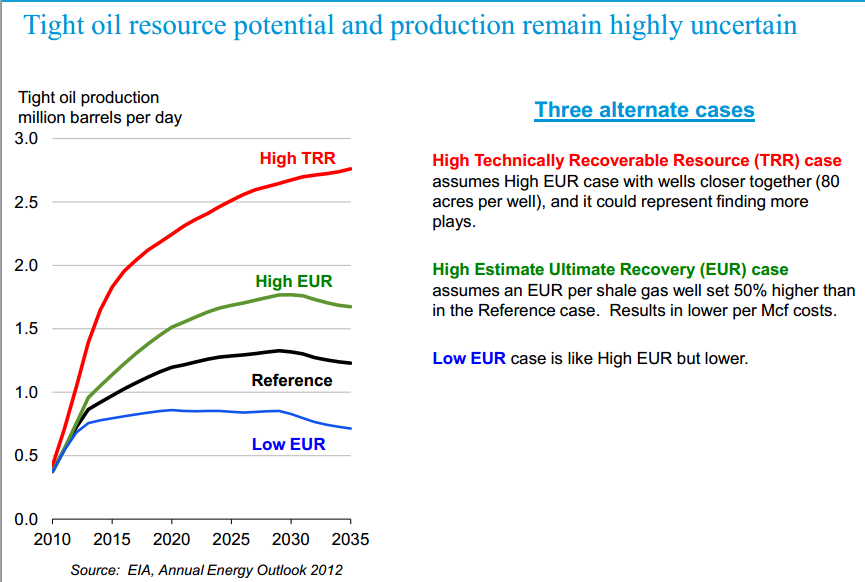
Figure 8 - US oil production forecast from shale oil from EIA.
has me scratching my head a bit
the chart is titled "Tight oil resource potential and production remain highly uncertain"
the units are in millions of barrels per day
but the
"High Estimate Ultimate Recovery (EUR) case
assumes a EUR per shale gase well set 50% higher than in the Reference case Results in lower per Mcf costs.
?????
@Luke
I think that's a quick and dirty error (they are referring to oil and let gas in). The chart shows production forecast for different scenario's, whereas the high estimate ultimate recovery (EUR) case in green, is 50% higher than the reference case in blue. This because of assuming EUR per shale oil well to be 50% higher which results in lower per barrel of oil costs (shale gas and McF likely errors).
So if US imports decline to 6 MBD, and the trucking fleet switches to natgas (as per Boone Pickens)
which saves 3 MBD
and canada cranks up another 3 MBD
then fortress north america may be insulated from the world issues?
poly - "fortress north America may be insulated from the world issues?" You mean an issue like Canada needing additional revenue to pay for their social support system and thus raises the price of oil exports to the US or they export to China instead? Canada may be sitting on a sizable tar sand reserve but they also know nothing lasts forever. And they've already lost $billions thanks to the Cushing choke point. Might not be too long before they start thinking about becoming a member of OPEC. Or maybe OPECC, if you prefer: Organization Of Oil Exporting Canuk Countries. I guess we could call them an O-pecker then. LOL.
Don't mean to take this OT, but it is tiring listening to the denigration of the Canadian single payer insurance system (they call it Medicare). I'm guessing that's what you mean by "their social support system". Anyway, this article and the links therein should put the matter in a better perspective: http://theincidentaleconomist.com/wordpress/in-defense-of-canada/
Statistically, medical outcomes in US and Canada are quite similar. The main reason their wait times for ELECTIVE procedures is somewhat longer is because they pay about 55% of what the US pays per capita for medical care.
The US Medicare system is headed for bankruptcy in about a decade or so; medical costs are the leading cause for family bankruptcies in the US; about 500,000 Americans go abroad (India, Thailand, Colombia, Mexico) every year for medical treatment that their insurance does not (fully) cover. The US is the only advanced country in which private companies are burdened with the cost of providing medical insurance for employees; this has the further effect of reducing mobility for employees - an economic drag.
I could go on, but it should be clear that the Healthcare system of the US is a sorry mess. Yes, if you are wealthy, or work for the govt or a large company, your ass is well covered. If not, you are one major medical emergency away from financial ruin.
I didn't read a jot of denigration into Rockman's comment. You could equally read it as a compliment. Canada is a modern welfare state, meaning a lot of expenditures fall into the Federal or Provincial budgets which would in the US or a third-world country be private-sector expenses. Similarly, in Canada, the Federal and Provincial governments have a slightly firmer grip on mineral resources than governments do in the USA, and therefore more power to raise royalties and lease charges. This means that a Canadian government has the power to unilaterally raise the price of the oil it exports to the USA, for political and for government budgetary reasons, to a price point higher than might otherwise have been expected based on "market forces" alone. As long as the price is not higher than that of the equivalent energy in tanker-borne crude on the high seas, US consumers would have little choice but to pay up.
x - Exactly. My point was that Canadian resources should be deveoped for the benefit of its citizens in the most profitable manner. The Canadian healthcare system is a major cost item. Folks down south might not care for higher Canadian oil prices but it's their resource...not ours despite some politician now speaking of "N. American oil".
Don't be touchy, buddy. If I wanted to slam those Canuks there would be no doubt. I ain't known for being subtle. LOL
My apologies. I'm debating too many Canada denigrators - including my own GP - and was too trigger happy on that subject.
Nonetheless, it doesn't hurt to broadcast the sorry state of the US healthcare system. It's hard to understand why people in the US vote for pols who perpetuate it.
Here's a recent comparison:
http://blogs.reuters.com/david-cay-johnston/2012/09/11/a-tale-of-two-hea...
I don't think a Canadian government can unilaterally raise oil prices. Canada is a price taker rather than a price maker in the international oil market, and in fact for the last couple of years Canadian oil prices have been lower than than the OPEC price, dictated by pipeline restrictions and regional market conditions. If you want to find a price maker you have to look to OPEC.
Canada has a universal health insurance system, as do all other developed countries except the US. In most wealthy countries, universal health insurance is considered an entitlement rather than a personal choice. The US is different, but that is one of the peculiarities of the US political system.
Of course, there are wait lists for medical procedures in Canada, but on the flip side, the costs of the health care system are only 55% of US costs and results in terms of life expectancy are significantly better. This is also typical of other developed countries, all of whom have lower costs than the US. The US has the most expensive health care in the world, but American life expectancies are not much better than some third world countries such as Cuba.
Rocky – Nice try but you ain’t foolin’ me. As soon as yous guys get that pipeline to the west coast you’ll start tightening the screws. Of course, it won’t be personal…just business. LOL.
TransCanada may get an oil pipleline to the eastern Canadian provinces sooner than one to BC or Texas.
http://business.financialpost.com/2012/10/12/converting-part-of-transcan...
I stumbled upon this forecast the other day. Looks like some people think unconventional will be the savior for all future US energy needs.
Link?