| DrumBeat: July 14, 2006 | The Oil Drum | The Course of Our Lives WILL Be Determined by the First Derivative of a Function |
Potential Impact of Cantarell's Decline on Mexico's Oil Production
Posted by Sam Foucher on July 14, 2006 - 11:08am
In 2005, Cantarell produced more than 60% of Mexico's oil production. Therefore, Cantarell can be considered as the "Ghawar" of Mexico. As we can see on Fig. 1, Cantarell's output doubled within a few years thanks to Nitrogen injection. However, the oilfield production has started to decline rapidly since 2004:
Fig. 1- Cantarell Production (source: PEMEX)
Acronyms:
URR= Ultimate Recoverable Ressource
HL= Hubbert Linearization
mbpd= Millions of barrels per day
Gb= Billions of barrels
Cantarell is in fact an oil field complex situated near the Yucatan peninsula (see Fig. 2) which has produced 11.674 Gb since 1979 (Mexico's cumulative production is around 34.0 Gb). The volume of oil in place (3P) is estimated to be around 33.7 Gb according to PEMEX. Click To Enlarge.

Fig. 2- Cantarell complex. EIA. Click To Enlarge.

Fig. 3- Mexican main oilfields (Deutsche Bank). Click To Enlarge.
We estimate the logistic curve parameters on the total Mexican production (Fig. 4). The estimated URR is around 66 Gb which means that cumulative production will reach 52% of the URR in 2006.
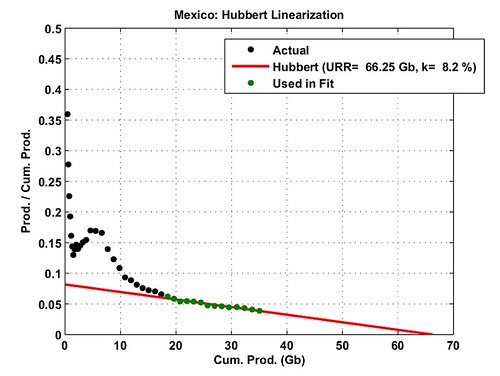
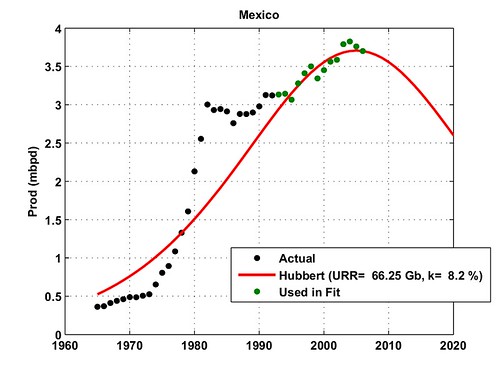
Fig. 4- Hubbert Linearization applied on the Mexican Production (crude oil + NGL, source: BP). Click To Enlarge.
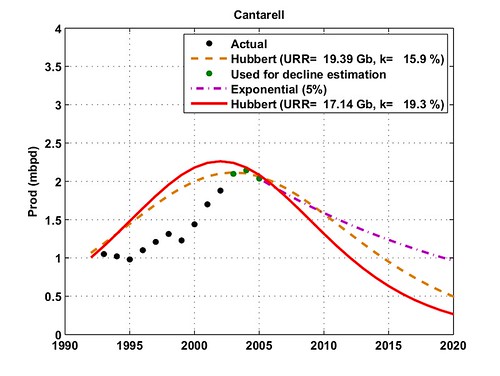
We don't need a complete production profile for Cantarell, we use only the data from 1992 to 2005 available on PEMEX website. The result of the HL technique applied on Cantarell is shown on Fig. 5, only the last two or three points can be used to perform the linear fit. The resulting decline is quite steep (K= 19.3%) and the URR is 17.14 Gb which means that 11.674 / 17.14= 68% of what is recoverable has been produced!
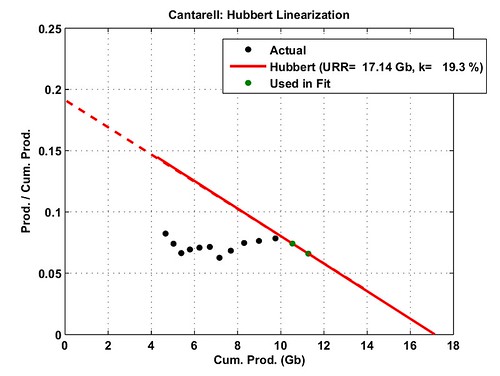
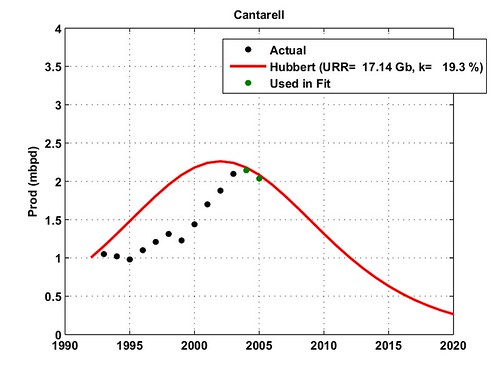
Fig. 5- Hubbert Linearization technique applied on the Cantarell oilfield (crude oil + NGL, data source: PEMEX). Cumulative production has been modified to match 11.674 Gb in 2005. Click To Enlarge.
We apply a second Hubbert Linearization on the rest of the production as shown on Fig. 6. The decline is comparable to the one derived from the total production.
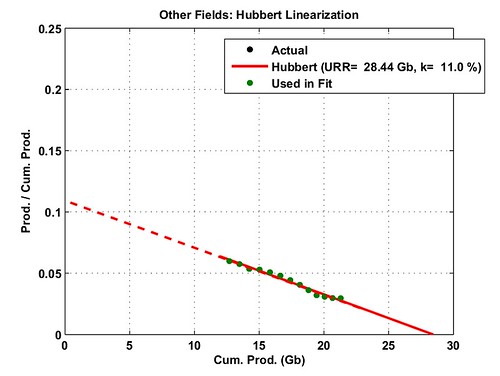
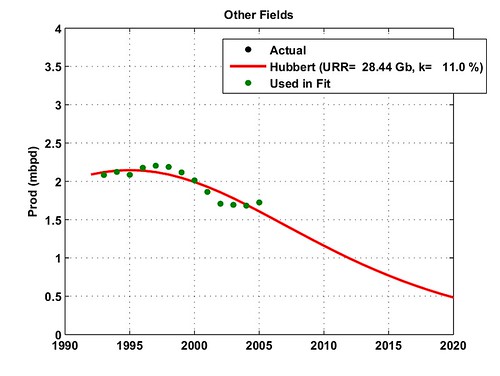
Fig. 6- Hubbert Linearization technique applied on the total production excluding the Cantarell oilfield (crude oil + NGL, data source: BP). Cumulative production has been modified to get 22.0 Gb in 2005. Click To Enlarge.
Finally, we put together the three above results on Fig. 7. The red dotted curve is the sum of the two logistic curves estimated for Cantarell (in blue) and the rest of the production (in green). We can see that the resulting curve is strongly affected by Cantarell decline with a production down by 30% in 2010! The URR corresponding to the new curve is only 28 Gb + 17 Gb= 45 Gb (Close to the ASPO estimate at 50Gb).
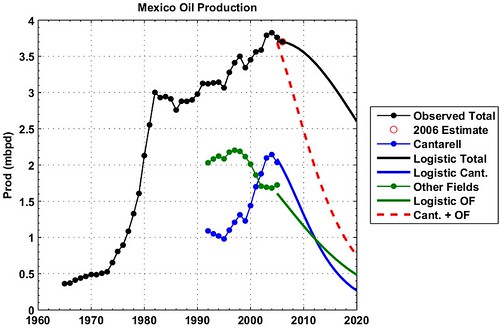
Fig. 7- The three logistic-based forecasts corresponding to the total production (black), Cantarell production (blue) and the rest of the fields (in green). The red dotted line is the sum of the green and blue line. The red circle is an early estimation for 2006 from the IEA (3.7 mbpd). Click To Enlarge.
Note that Cantarell decline rate at 20% is not exceptional and that steeper decline rates (around 25-30%) have been observed on Norway's top fields. 2006 will definitively be a turning point for Mexico oil production (see also Dave's post for the political context). Of course, the red line represents the worst case scenario where no new developments can offset Cantarell decline. The reality will probably be between the black line and the red line. Even the IEA is not very positive, from the last IEA report:


[Update by Khebab on 07/15/06 at 6:30 PM EDT] Following the many comments about the HL using only two points, I added the Fig. 10 below that shows alternative curves for Cantarell's decline. The exponential solution follows the comment made by plucky underdog.
TOD: Trouble South of the Border -- Mexico's Oil Production
ASPO: newsletter #35
PEMEX: Liquid Hydrocarbons Production
PEMEX: Hydrocarbon reserves 2005
BP: Statistical Review of World Energy 2006
GraphOilogy; Mexico's Ability to Export Oil
URR= Ultimate Recoverable Ressource
HL= Hubbert Linearization
mbpd= Millions of barrels per day
Gb= Billions of barrels
Cantarell is in fact an oil field complex situated near the Yucatan peninsula (see Fig. 2) which has produced 11.674 Gb since 1979 (Mexico's cumulative production is around 34.0 Gb). The volume of oil in place (3P) is estimated to be around 33.7 Gb according to PEMEX. Click To Enlarge.
Fig. 2- Cantarell complex. EIA. Click To Enlarge.
Fig. 3- Mexican main oilfields (Deutsche Bank). Click To Enlarge.
We estimate the logistic curve parameters on the total Mexican production (Fig. 4). The estimated URR is around 66 Gb which means that cumulative production will reach 52% of the URR in 2006.
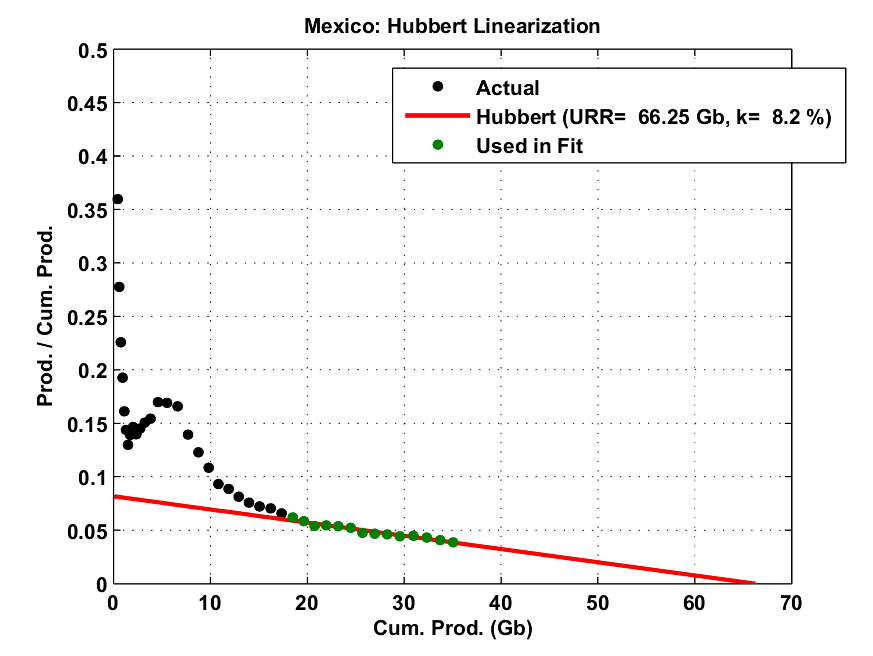

Fig. 4- Hubbert Linearization applied on the Mexican Production (crude oil + NGL, source: BP). Click To Enlarge.
We don't need a complete production profile for Cantarell, we use only the data from 1992 to 2005 available on PEMEX website. The result of the HL technique applied on Cantarell is shown on Fig. 5, only the last two or three points can be used to perform the linear fit. The resulting decline is quite steep (K= 19.3%) and the URR is 17.14 Gb which means that 11.674 / 17.14= 68% of what is recoverable has been produced!


Fig. 5- Hubbert Linearization technique applied on the Cantarell oilfield (crude oil + NGL, data source: PEMEX). Cumulative production has been modified to match 11.674 Gb in 2005. Click To Enlarge.
We apply a second Hubbert Linearization on the rest of the production as shown on Fig. 6. The decline is comparable to the one derived from the total production.
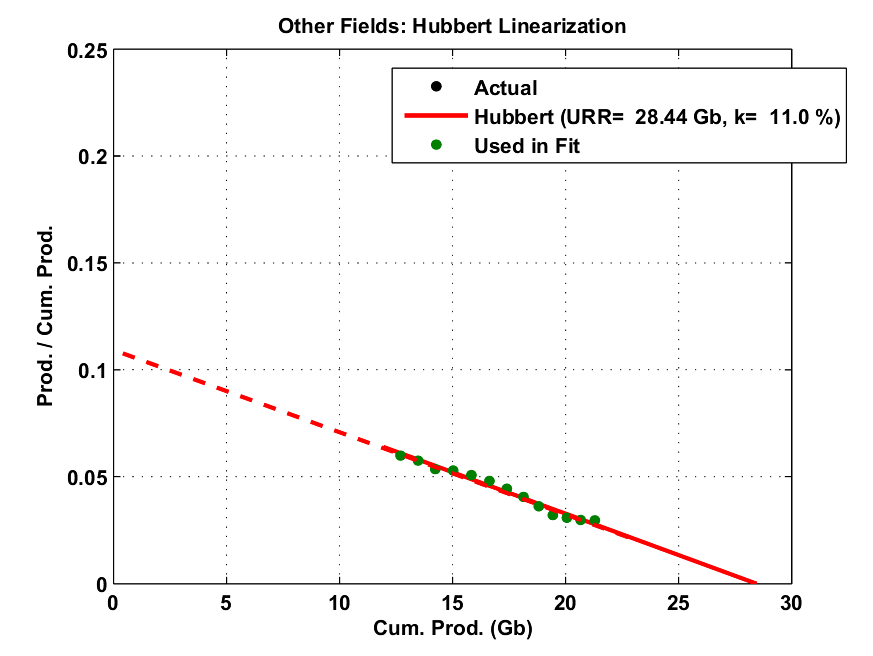

Fig. 6- Hubbert Linearization technique applied on the total production excluding the Cantarell oilfield (crude oil + NGL, data source: BP). Cumulative production has been modified to get 22.0 Gb in 2005. Click To Enlarge.
Finally, we put together the three above results on Fig. 7. The red dotted curve is the sum of the two logistic curves estimated for Cantarell (in blue) and the rest of the production (in green). We can see that the resulting curve is strongly affected by Cantarell decline with a production down by 30% in 2010! The URR corresponding to the new curve is only 28 Gb + 17 Gb= 45 Gb (Close to the ASPO estimate at 50Gb).

Fig. 7- The three logistic-based forecasts corresponding to the total production (black), Cantarell production (blue) and the rest of the fields (in green). The red dotted line is the sum of the green and blue line. The red circle is an early estimation for 2006 from the IEA (3.7 mbpd). Click To Enlarge.
Note that Cantarell decline rate at 20% is not exceptional and that steeper decline rates (around 25-30%) have been observed on Norway's top fields. 2006 will definitively be a turning point for Mexico oil production (see also Dave's post for the political context). Of course, the red line represents the worst case scenario where no new developments can offset Cantarell decline. The reality will probably be between the black line and the red line. Even the IEA is not very positive, from the last IEA report:
Mexico– April actual: Official production data from state company Pemex showed a rise of 20 kb/d for crude and 10 kb/d for NGL versus March, reaching 3.37 mb/d and 440 kb/d respectively. However, this Report has trimmed expectations for crude production in 2006 overall by 30 kb/d, to 3.27 mb/d. It is increasingly difficult to see offsets for declining Cantarell field production before 2007. More immediately, the campaign for the 2 July Presidential election has seen oil sector reform become an issue. The reversal of production decline and falling reserves is expected to require tax reform in order to boost Pemex’s budget, and an opening of the upstream sector to foreign company participation in deepwater hydrocarbon developments.
I give also the official
production forecast from PEMEX and Wood Mackenzie who are seeing growth
in the Ku-Malloop-Zaap (KMZ) field.
Fig. 8- PEMEX production forecast (2004). PeakOil.nl. Click To Enlarge.
Fig. 9- Wood Mackenzie production forecast. OilOnline. Click To Enlarge.
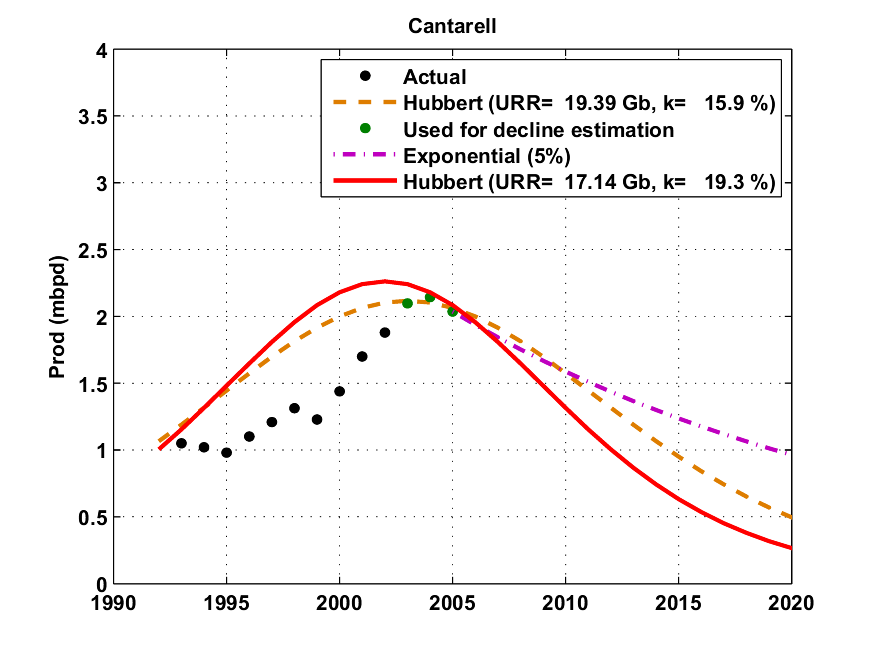
Fig. 10- Various decline estimate for Cantarell: 1) In red: HL result using two points (same result as Fig. 5); 2) In orange: HL result using three points; 3) In purple: exponential decline
References:
TOD: Trouble South of the Border -- Mexico's Oil Production
ASPO: newsletter #35
PEMEX: Liquid Hydrocarbons Production
PEMEX: Hydrocarbon reserves 2005
BP: Statistical Review of World Energy 2006
GraphOilogy; Mexico's Ability to Export Oil
“We have only two modes—complacency and panic.”
—James R. Schlesinger, the first energy secretary, in 1977, on the country's approach to energy
Contact
- Content: editors at theoildrum dot com
- Tech support: support at theoildrum dot com
License

This work is licensed under a Creative Commons Attribution-Share Alike 3.0 United States License.
What I though was impressive was how the Nitrogen used represented a large %age of total Nitrogen gas produced.
2-3 years ago a web page was claiming %40 (or was it 60%) of production was used.
Three Points:
(1) Based on the WSJ article (which was based on leaked internal Pemex reports), the remaining oil column at Cantarell--between the water leg and the gas cap--is about 825'. It is thinning at the rate of about 300' per year. The worst case internal (Pemex) decline rate estimate is about 40% per year.
(2) Virtually all reservoirs are more permeable to gas and water than to oil. Heavier oil is more viscous than light oil. So, one big difference between Ghawar (light oil) and Cantarell (heavy oil) is that it is easier for the gas and water to bypass the oil at Cantarell than it is at Ghawar.
(3) The easy oil is gone at both Cantarell and Ghawar. From this point forward, high production rates are the enemy of high (remaining) recovery rates. So, they can have higher recovery rates, or higher short term production rates--but not both.
Regarding getting more traffic to theoildrum.com, you guys should consider posting your charts, graphs, and diagrams to Flickr.com. Flickr is Web 2.0 for images. For my site something like 20% of my inbounds (exclusive of searches) come from Flickr.
http://www.flickr.com/photos/jacobfoucher/
The old adage that when you hold a hammer every problem looks like a nail seems appropriate here. The logistics curve is sometimes a useful forecasting tool but I think it should be used with discretion. Figure 5 demonstrates how inapropriate the logistic curve can be at times.
But the argument is that Hubbert linearization, in isolation (i.e., no USGS studies, no CERA data) allows to predict the peak in advance, right?
Two years ago would an HL fit have told us that Cantrell was at its peak? From the data shown, I would guess no.
While I like the elegance and simplicity of the method, the shown fits do not convince me of its utility.
- we know that a fast and terminal decline is expected (see the official chart on Fig. 8).
- the predicted URR (17 Gb) is close to the official number (20.5 Gb)
I could have used something else that a logistic curve: a gaussian or a constant R/P ratio used by economist. Any monotonic curve that is delimiting an area close to 9 Gb will have done the job.Links to tutorial material on Hubbert Linearization
http://mobjectivist.blogspot.com/2006/03/mexico-oil-shock-model-part-2.html
Again, I don't think K makes any real physical sense.
This is true, so long as your "million other lines" fit within the constraints of an oil column of 825' thinning at the rate of about 300' per year.
The big fields tend to peak at the same time as overall regional production--Texas & the East Texas Field; Mexico & Cantarell; Saudi Arabia & Ghawar.
Based on Khebab's work, we published an article on Graphoilogy and the Energy Bulletin predicting that Saudi Arabia and the world were on the verge of the same kind of decline that Texas and the Lower 48 showed. Guess what? All of the available data to date show that our prediction was correct?
Instead of hypercritical discussions of how to linearlize the production in a field that is known to be declining, how about an acknowledgment of the success of the HL method, when applied to large producing regions?
HL is used to predict URR after peak.
The following posts tried to assess the predictive power of the logistic curve fitting:
How Reliable is the Hubbert Linearization Method?
Bootstrapping Technique Applied to the Hubbert Linearization
How Reliable is the Hubbert Lin. Method? the world case
The HL fails when there is an abrupt change in the logistic growth (or decline rate) K which is the case for Cantarell, see this post from duncanK:
The Yibal Model - Does it Apply to Ghawar, Burgan, etc.?
FYI--Just to be clear, I was responding to Halfin.
Yeah, Halfin, I guess the market would draw a rising vertical line through those two declining points and declare everything's ok, right?
/end sarcasm alert
Its not that the data don't deserve speculation and discussion, but using linear fit to come up with "hard" numbers, even if speculative, seems a bit disingenuous. Otherwise great post.
-Ptone
src: PEMEX: Hydrocarbon reserves 2005 (Table A5, page 29)
It covers most of the main technical points though it does get a couple of things wrong.
The author attended a symposium in Yellow Springs, Ohio and reports on the people he met, examining the general political trend among attendees, calling his experience in the essay's subtitle: Scenes from a liberal apocalypse. He likens the people of the peak oil scene to the Left Behind series and several other "the end is nigh" movements, except that he does admit that we do live on a sphere and that oil is necessarily limited, which he concedes lends credibility to the peakers.
The info is nothing new, but it is compelling for what it represents in terms of nascent media coverage. Harper's is one of the nation's better, more intellectual magazines and often covers stories before they break into the mainstream media. He does mention the increasing number of cities that are examining their futures post oil.
A nice read, but not a must read for hard core peakers. It would be a good article to recommend to the uninitiated.
Except for peer-reviewed academic journals, you need an agent to get published.
A good agent is hard to find.
Been there.
Done that.
Oy.
Often it is more difficult to get published without an agent (mainly because you have to act as your own agent while also writing, which means big distraction from the fun stuff), but it can be done.
And, if you're agentless, and break through with a novel (and I know several people who have done this), getting an agent is a piece of cake. And, at this stage, an agent is highly recommended, for they'll likely be able to get you a bigger advance, among other things.
-best
A year later, I found a publisher and achieved wealth beyond the dreams of avarice;-)
(Don't I wish . . . .)
Agents are generally no help for textbooks, but for most other kinds of writing an agent is worth twice her weight in 24 karat gold.
The last I heard is that new fields are falling behind schedule due to costs and resources. As for resources, everyone is complaining about lack of people and equipment. This is not going to change at all for the forseable future.
I remember in 2000, Exxon officials were saying just replacing production of declining oil fields will be a challenge and they expected oil prices to firm up because of this.
There was a prior peak in the field just before Nitrogen injection was started. Could that prior peak data be used to predict URR?
From reading prior posts here, discussing why some fields fit the HL method better than others, EOR techniques seemed to skew the data by not showing production declines until the field was much older (had produced a greater % of it's URR). Seeing that first peak, I wonder if that was not the true 50% of the field? And if so, what the predicted URR would be?
Again, please forgive if this has all been discussed elsewhere. Still trying to catch up.
Mexico's Ability to Export Oil
Super Work, big thxs. Scary how much Cantarell resembles DuncanK's Scudia model. Let's hope a Cat 5 hurricane never hits Campeche Bay. Speaking of a potential hurricane....
Mexico's election is far from a done deal. The wildcard, the NUCLEAR OPTION for AMLO to truly energize his poor supporters, is for him to disclose the PEMEX reports, and other research such as our vaunted Khebab's work.
If AMLO goes whole hog on Mexican depletion, and convinces his supporters that now is the ONLY TIME POSSIBLE for oil wealth redistribution if he becomes Presidente', then they can easily start a revolution:
--------------------------------
Mexico's Tiger Stirs
Porfirio Díaz, Mexico's dictator from 1876 to 1910, always feared a popular revolution. "We must not awaken the tiger," Díaz famously declared. The revolution that erupted in 1910 cost more than a million lives. Mexican intellectuals have recently warned that the tiger is stirring once again in the wake of the country's contested July 2 presidential election, the initial results of which granted a razor-thin victory to Felipe Calderón of the conservative National Action Party (PAN).
-------------------
http://www.thenation.com/doc/20060731/editors
What does that one million in 1910 extrapolate to today's Mexico-- 5 million or more? Our 1860s Civil War would look like a friendly neighborhood block party compared to the carnage that could erupt down south. All AMLO has to do is tell the poor that they will never get a chance for a decent life because Cantarell is tanking and Calderon wants to export as much as possible to the US. AMLO can drive the crowd into a frenzy by saying, 'I am your very last chance, the vote tampering was obvious--do you want to be forever screwed by Calderon?
Bob Shaw in Phx,Az Are Humans Smarter than Yeast?
You may want to check out this article by Palast ( I know many here feel he is a dufus for his insane views on peak oil, but, when it comes to political reporting, he is usually accurate.)
http://www.commondreams.org/views06/0714-20.htm
The following quote gives some idea as to the article's content.
Thxs for responding. IMO, the best thing for Mexico to do is have a runoff election between AMLO and Calderon to help prevent violence. For the next two months, they campaign, but are restricted to only debating Mexico's Peakoil. AMLO gets full control of one of the major media sources, Calderon the other to foster the debate equally.
AMLO would emphasize Biosolar Powerup and Detritus Powerdown, and the creation of a Mexican Foundation to help direct this end of entropy planning. The whole gamut of NAFTA withdrawal, curtailing oil exports to the US, vol. pop. cntrls., building mass-transit, education, the shift to alternative energies, economic justice, Earthmarine protection strategies... on and on. AMLO merely has to be honest with his supporters.
Calderon would have to justify business as usual and continued exports to the US in the face of rapidly collapsing depletion. He would have to explain how the detritovores will continue to polarize mexican society, and how privatisation of PEMEX will mean less future oil for Mexicans. He would be confronted with claims that infinite growth is now impossible and to stop spewing false promises. He would have to explain his employment strategy so that millions will not invade the US as they seek to follow the Mexican oil. He would not be able to bullshit anyone with political lies if the debate is constrained to the REAL FACT of Mexican Production Collapse.
The Mexicans could then choose the candidate that offers the most appealing decline path. They have no other choice but to repeat the Mayan decline, but do it much better if they plan ahead.
Failing this hypothetical scenario I proposed--Mexico will eventually become like Nigeria, Zimbabwe, Haiti, Somalia, Iraq, etc. Being a fast-crash doomer, I think the previous sentence is more likely than the paragraphs above because the US always gets involved in Mexican affairs. But one can hope.
Bob Shaw in Phx,AZ Are Humans Smarter than Yeast?
You are probably correct-- Mexico has a long history of assassinations where the winner [the US?] takes all:
http://www.meta-religion.com/Secret_societies/Conspiracies/Assassination/mexicos_fiesta_of_assassins .htm
http://en.wikipedia.org/wiki/Luis_Donaldo_Colosio
http://en.wikipedia.org/wiki/Special:Search?search=mexican+assassinations&fulltext=Search
Ruppert of FTW makes a pretty powerful case of world drug control by the US topdogs, and Afghanistan is expecting a record opium crop under US military control. Gee....
Makes one wonder if AMLO is living on borrowed time?
Bob Shaw in Phx,AZ Are Humans Smarter than Yeast?
Catherine Austin Fitts makes the same pitch.
She's got her 'red button story'
http://www.scoop.co.nz/stories/HL0510/S00173.htm
And one of her sites sent me here:
http://www.larouchepub.com/pr/2001/2839grasso_factor.html
So Ruppert isn't the only voice.
Yep, tax-free income at that super-profit level is a very unstoppable force. I have read Fitts's writings before.
Bob Shaw in Phx,AZ Are Humans Smarter than Yeast?
I've been reading a bit about the Neocon plan for Mexico, which, broadly, is to combine Mexico, the U.S. and Canada into one large "North American Union" with a super-interstate highway connecting all three countries.
A new currency would also be adopted, called the "amero."
I'm sure this idea would be real popular in Arizona.
It's being championed by the Council on Foreign Relations, which, I suppose, is just another name for the Trilateral Commission ...
Yep, I am familiar with that idea too. I have no idea if it will be driven from the topdogs down or if Mexican and Canadian nationalism for hoarding their oil will predominate. We appear to be nearing a 'balanced teeter-totter' with globalized growth on one side and complexity collapse & HELP on the opposite side.
Bob Shaw in Phx,Az Are Humans Smarter than Yeast?
Dave
(Sorry, Dave, I'm an old movie buff ...)
Though in the general public if its not something they can read in about 3 mins it does not get past their need to go do somthing else. Graphs help to catch the eye and pull in a viewer. I know this post was meant for the general readership of TOD which reads for the full length of most posts, so the above comment is not meant as a negative to you. The issues at hand are so important that we really just don't want to be another sound bite news item. The Hired guns like Yergin get longer sessions to shoot us down if we only have 3 mins to tell the story as it is. Though as the peak gets closer and more things change for the worse even Yergin et al. can't still be standing there telling folks pumping gas don't worry, we predict it'll get better honest, just give us one more chance!! As the gas station owner takes the title deed of the car owner's house in payment for the gas.
-- José de la Cruz Porfirio Díaz Mori
[Mexican President 1876 until 1911 (with the exception of a single four-year period)].
I moused around a bit and found an excellent case study paper on the Society of Petroleum Engineers eLibrary website. If you really care about Cantarell (and a lot of folk on ToD seem to), it's well worth the $20 non-member fee to buy an electronic copy. If you are a member of the SPE, you can get it for $6. If you have academic or corporate access, use that. Start at http://www.spe.org/ and mouse around from there. The SPE has several other papers about Cantarell; I didn't get round to checking the AAPG or SEG, but if you spent a hundred bucks on data, you would know an immense amount about the field. And a very strange and wonderful reservoir it is, too.
The paper is SPE97385, "Nitrogen Injection in the Cantarell Complex: Results After Four Years of Operation", by Sanchez et al, 6 pp., 12 fig., presented at the SPE Latin American and Caribbean Petroleum Engineering Conference in Rio, 20-23 June 2005. So it's probably reasonably up to date.
Here's my own abstract of the paper.
GEOLOGY - STRUCTURE, ROCKS AND FLUIDS
Cantarell is a buried reef complex containing multiple oil reservoirs. The largest, Akal, contains 86% of the oil originally in place, and is probably what Khebab's graph refers to. The main productive formations are fractured, vuggy limestones with low porosity (8%), although up to 35% of the pore space is represented by vugs and fractures. The matrix permeability is 1mD but the fracture system permeability is an astonishingly high 3000mD (compare with ~600mD for Ghawar).
The crest of the Akal reef is some 3608 feet subsea, the initial oil water contact was at 10500ft. The maps and sections in the paper are difficult to interpret (no scale bars dammit), but it appears that the aquifer is perched on the southern side of the reservoir, and the oil column extends deeper to the north.
The reservoir fluid is a 22 degree API oil, so would be classed as heavy. Solution GOR is not quoted (there are hints that it might be about 370) but it seems the reservoir was initially just above bubble point i.e. no free gas in the reservoir.
DEVELOPMENT HISTORY AND PRODUCTION PROFILE
Production started in 1979 (see the graph) and ramped up to about a million barrels per day by 1982. Wells were drilled from multiple platforms (looks like about 12-15 on the map - not sure what all those symbols are). Initial oil rates averaged 29 Mb/d per well, and only 40 wells were producing in 1981. The plateau was maintained by drilling additional wells and by installing gas lift to supplement the energy provided by reservoir pressure. Initial pressure was 3840 psi, but by 1995, when the expansion project was conceived, 150 gas-lifted wells were producing an average of 7 Mb/d each.
The expansion project involved the drilling of 205 new producers and 9 injectors - THAT is the reason for the production increase from 1996. That sharp dip in production in late 1995 may represent a brief field shutdown to hook up new platform, manifolds etc. Some of the new wells may have been sidetracks of earlier gassed-out wells.
Nitrogen injection simply protects the reservoir from the collapse in pressure that would result from the increased liquid extraction. Target oil production rate for the new plateau was 2 MMb/d and target gas injection was 1.2 Bscfpd, which would represent approximately 100% voidage replacement and maintain reservoir pressure - as confirmed by the graph. This in turn would keep the flowrate per well approximately constant.
RESERVOIR RESPONSE AND WELL PERFORMANCE
By 1995, pressure had fallen to about 1820 psi and a large secondary gas cap had formed. Because of the very high long-range permeability, the contact was almost flat everywhere in the reservoir i.e. it was a horizontal surface moving down through the structure. One thing that is difficult to estimate from the paper is how much oil remains in the matrix above the contact, and how fast it is draining out. It might be possible to get a handle on this from the graph of gas-oil contact depth vs. time in the paper. In 1995 the GOC was at 5900 feet, an average speed of 140 feet per year since 1979. Nitrogen injection started in May 2000 and reached its maximum programmed rate in December of that year. The contact would accelerate in response to production, not injection, but over the period 2000-2004 the contact has moved at about 230 feet per year. The most recent values for OWC and GOC given in the paper are 8860 ft subsea and 7380 ft subsea respectively, an oil column of 1478 feet at the beginning of 2004.
MY PROGNOSIS
I would not expect the oil water contact to move very much further now that reservoir pressure has stabilized. If injection and production continue at the same rate, the GOC should keep moving at the same speed.
I would see one of two things happening as far as the wells and facilities are concerned:
(1) The GOC starts invading the perforated intervals and gas production starts to increase. This will only become serious when the gas production reaches plant capacity, when it will become necessary to shut in production wells to cut back gas production. At that point the field will enter a regime of exponential or hyperbolic decline (note to non-techies - exponential does NOT mean extremely fast, it means the same percent reduction in flowrate each year). This may be happening already. In this regime, production can be forecast quite easily by fitting an exponential curve to history - NOT by Hubbert Linearization.
(2) So far nitrogen has not broken through in a big way, implying that most of the productive perforations are still submerged in oil. Given the extremely high permeability, the wells could in principle produce at full rate from a very thin shrinking layer of oil between water and gas. If the operator can conduct enough gas and water shut-off operations with the platform rigs and/or cranes (depends on platform layout), the oil production rate could remain very high right up to almost the end, at which point it would fall off a cliff. It wouldn't go to zero, but I would expect an abrupt fall of several tens of percent ("abrupt" means over a year or two).
In either case, decline would eventually switch to a different mode driven by oil drainage out of the matrix above the gas oil contact. It is difficult to estimate what production rate would be sustainable under this regime, but it would probably be several tens to a few hundred thousand barrels per day (wild-ass guess).
Hope this helps.
Following your comment, I've just added a new figure (Fig. 10) that shows your proposed exponential decline. The decline is less abrupt compared to the two logistic curves. The area (i.e. remaining reserves) under the exponential curve is 15.16 Gb instead of 5.46 Gb and 7.43 Gb for the two logistic curves.
The next step change in the physics of the system that I can foresee will occur (is occurring?) when free gas starts to break through into the production wells. At that point the operator can choose to react or not to react. In the former case the reaction itself will become part of the physics of the system. An appropriate reaction would be:
(a) shutting in wells to hold back the gas, in which case some form of steady decline will set in
(b) a lot of well repairs or sidetracks, or even new wells deeper in the structure - which will hold back the tide until the oil layer has almost vanished. This depends on how agile the well service department is and how long it takes to intervene in each well and skid the rig to the next slot.
(c) expanding gas handling capacity, in which case production will decline until the new capacity is on line, at which point it will increase again - and then decrease under the radically different decline regime of falling reservoir pressure
(d) expanding gas INJECTION capacity, to offset the increased pressure decline due to excess gas production
I have listed these in approximately ascending order of difficulty, and PEMEX's response plan doubtless includes elements of all four. But we don't know what, or when, or how much, or whether it will be successful.
The decline we have seen so far is probably a combination of (a) with continued drilling and workover ops i.e. some (b). The field decline regime won't switch neatly overnight - something this size can take months to react.
Bottom line is that you should expect the decline curve to be "roll over" and remain indefinite for the next few years. If you revisit in 2010 then the decline mode should be amazingly obvious - in retrospect. But there are so many physical, economic and human factors interacting at the moment that you really don't have much chance of fitting anything simple to observed production history. I don't want to pour cold water, but unless I was a PEMEX insider, I wouldn't bother trying.
Your comment shows how complex the reservoir dynamic can be! Clearly, the curve fitting approach proposed here can be put in the "wild-ass guess" estimate category but what else can we do considering, as you said, the countless physical, economic and human factors involved.
In other words, it might not work for an individual field like Canterell but you get enough of this data, you better watch out.
The "wouldn't bother trying" remark is what causes everyone to stick their head in the sand. We are certainly not going to get the bottiom-line from the oil companies, are we? Over fifty years of prior marketing says no.
Engineering and curve extrapolation aren't really in competition with each other. PEMEX will make their own decisions, actively or by default. Those decisions will modulate the physical evolution of the reservoir. I don't know what they will decide, and I don't think Khebab does either. Do you?
You're right in asserting that HL often works if you've got a hundred independent reservoirs, whatever the shape of the individual production profiles. HL on "Mexico apart from Akal" might work just fine - the Mexican oil industry goes back to the early years of the last century, and reservoirs are being discovered, developed, produced and abandoned all the time.
As you have also implicitly noted, the problem with HL on a single reservoir is that the laws of physics and the whims of oil companies usually don't conform to Hubbert's curves. Just look at the shape of the Akal profile pre-peak. Some of my decline scenarios could look surprisingly Hubbert-like; others won't.
The best forecast for Mexico would probably be an engineering calculation, updated by reference to the trade press, for Akal, added to a simple functional form (Hubbert, or maybe just hyperbolic decline) for the rest of the country.
Khebab - does your database of country production profiles include anything that you would point to and say "No, OK, Hubbert gets it wrong here"? I'm just wondering about your criteria for goodness of fit. How do you deal with multiple peaks, for instance?
How do you deal with multiple peaks, for instance?
Jean Laherrere has proposed a multi-peak approach:
Multi-Hubbert Modeling