| From sweet on the table to fuel in the tank: the millenary history of Sugar Cane | The Oil Drum: Europe | Peak Oil and Senegal |
Peak Coal - Coming Soon?
Posted by Chris Vernon on April 5, 2007 - 1:15am in The Oil Drum: Europe
The general consensus view on coal supplies has long been that we have hundreds of years of the stuff left, and that oil and gas depletion are the pressing concerns. However, dissenting voices are emerging. Canadian geologist David Hughes recently claimed that "peak coal looks like it's occurred in the Lower 48 (US states)", and the consensus position on coal is also called into serious question by the Coal: Resources and Future Production report soon to be released by the Energy Watch Group in Germany. I present a summary of its findings here.
[Update 04/04/07]
The final version of the Energy Watch Group report was published today and is available at:
http://www.energywatchgroup.org/files/Coalreport.pdf
In particular greater detail has been added regarding future US coal production, noting that the US has now switched from being a net exporter to a net importer of steam coal and arguing that total (volumetric) US coal production will peak between 2020 and 2030.
It is also noted that only 15% of coal produced globally is exported, the rest being consumed domestically, with Australia is responsible for almost 40% of global coal exports.
Finally, certain of the figures in the report have been revised, and so these have been revised (and marked as such with endnotes) in the below summary. These revisions do not change the overall trends.
Reserves
The report highlights that the "proved reserves at year end" published in the most recent BP Statistical Review of World Energy in June 2006 are stated as being for year end 2005, but are actually based on the latest World Energy Council (WEC) assessments, which contain data for the end of 2002.So our best figures on this are actually over four years old. And our worst figures? Well, some haven’t been updated in 15 years (China) and some in up to 40 years (Vietnam, Afghanistan).
But really the key message in the global data lies in the rate at which reserves estimates have been revised downwards. As Peak Oilers well know, conventional wisdom has it that reserves will increase as more exploration takes place and prices rise. Yet, in truth, estimates for global coal resources have been consistently revised down, and by 55% over the past 25 years, from 10 trillion tons hce (hard coal equivalent) in 1980 to around 4.5 trillion tons hce in 2005 [1]. Certain countries (including Germany and the UK) have been revised down by over 90% in this period. The UK reported proved recoverable reserves of 45bn tons in WEC 1980 [2], but these were continually revised downwards to reach only 0.22bn tons by the latest report. Cumulative UK production in this period amounted to only approx 1.8bn tons.
Even Poland, the biggest coal producer in the EU, reports reserves revised down by 50% over the last 10 years. Since production alone cannot explain such revisions, they are deemed likely to be due to improvements in data. The chief exceptions to this rule are India and Australia, both showing significant upward revisions, but as we have seen the global trend is firmly downward. Only South Africa shows continuously shrinking reserves roughly in line with cumulative production. Globally, the report concludes that data quality is very poor and that these downward revisions must be expected to continue.
China
So back to China, the world’s largest producer, with the fourth largest reported reserves globally. The 2006 Statistical Review of World Energy credits China with 55 years of remaining reserves at current production rates (depleting its reserves at almost 2% per annum). But as previously mentioned, the Statistical Review faithfully reproduces proved reserves figures which were last changed in 1992 (note that China’s cumulative production in the 15 years since comes to about 20% of those stated reserves), so we can knock 15 years off that number straight away, reducing the remaining total reserves to 40 years’ worth. The Energy Watch Group report gives projected production profiles showing that China is likely to experience peak coal production in the next 10-15 years, followed by a steep decline. It should also be noted that these production profiles do not take into account uncontrolled coal fires which – according to satellite based estimates – add around 5-10% [3] to regular consumption. Since China’s production dwarfs that of any other country (being almost double that of the second largest producer, the USA) the global coal production peak will be heavily influenced by China’s production profile.Types of Coal
Now, before I outline the situation in the USA, which comfortably holds the world’s largest reserves of coal, it may be instructive to distinguish the different types of coal. There are four basic types, starting with the most energy-rich – anthracite (about 30 MJ/kg), bituminous coal (18.8-29.3 MJ/kg), sub-bituminous coal (8.3-25 MJ/kg) and lignite (5.5-14.3 MJ/kg). Those towards the anthracite end of the scale are often termed ‘hard coal’, and those towards the lignite end of the scale as ‘soft coal’, although the exact definition of these terms varies. The softest coals are sometimes termed ‘brown coal’.USA
The USA, then, as we have all heard, has reported proven coal reserves that would allow continued production at current rates for more than 200 years. Three federal states (Wyoming, Montana, Illinois) hold about 60% [4] of US coal reserves, but the low production rates relative to reported reserves in Montana and Illinois cast some doubt on the reliability or suitability of those reported reserves. As many of these reserves are of low quality, with high sulphur content and/or other drawbacks, it may be considered doubtful that they will ever be produced. Measured in terms of produced tons per miner, US productivity steadily increased until 2000, but has declined since, which also implies that ‘easy coal’ is running short.The USA had passed peak production of anthracite (by far the rarest form) by 1950 and peaked in bituminous coal in 1990, but sub-bituminous coal more than made up for this decline in terms of tonnage. However, due to the lower energy content of softer coals, the total energy content of annual US coal production peaked in 1998.
Global Picture
So, having looked at the world’s biggest coal producer and the holder of the world’s biggest reserves, we may perhaps turn our attention to the global picture.Six countries (USA, Russia, India, China, Australia, South Africa) hold about 85% [5] of world coal reserves, when this is measured in terms of energy content. According to the latest assessment by the WEC, total world reserves at the end of 2002 stood at 479bn tons of anthracite and bituminous coal, 272bn tons of sub-bituminous coal and 158bn tons of lignite.
According to the Energy Watch Group, global coal production can increase for 10-15 years (mainly driven by China), but then production of anthracite and bituminous coal will peak around 2020 at a production rate around 30% higher than at present. Lignite production is predicted to peak somewhere between 2050 and 2060. However, as the quality of coal produced will be declining continuously the world coal energy peak is projected to come around 2025. It is also important to note that ‘peak coal exports’ should come even earlier, as lower-energy-density coals are not worth transporting long distances.
When we compare this with the scenarios (represented by the dashed and the solid line) from the IEA’s 2006 World Energy Outlook (WEO) we get the following graph:

Click to Enlarge
As we can see, according to this report the WEO reference scenario is unrealistic, and only the production in the WEO alternative policy scenario (which assumed political measures constraining coal due to fears over greenhouse gas emissions) is actually feasible. The Energy Watch Group’s report, however, is not considering potential policy constraints, and is describing only what production may be physically possible.
I must stress that one of the key findings of this report is that data quality is very poor globally, and so all of the findings should be taken with that caveat, but the trends do seem clear. Indeed, we sent a copy of this report to Richard Heinberg and he has revealed that a Dutch study-in-progress using different criteria has reached preliminary results confirming this report’s findings. And the poor data quality is itself hardly reassuring for an energy source which is becoming increasingly central to our global future.
This report clearly carries many serious implications, but for now I’ll just share the information and leave these to be discussed on TOD. Further analysis of the report has also recently been released in Heinberg’s March MuseLetter.
---
[1] Revised from 4.2 trillion tons in draft report to 4.5 trillion tons in final version.
[2] Revised from 145bn tonnes to 45bn tonnes. This was my error. WEC 1980 listed 145bn tonnes as the estimated additional resources for the UK. 45bn tonnes was the listed “proved reserves”.
[3] Revised from 10-20% in draft report to 5-10% in final version.
[4] Revised from “over 70%” in draft report to 60% in final version.
[5] Revised from 90% in draft report to 85% in final version.
Personnel
Editors
Contributors
Peak Oil Primers
Archives
- November 2010 (3)
- October 2010 (6)
- September 2010 (4)
- August 2010 (7)
- July 2010 (6)
- June 2010 (7)
- May 2010 (2)
- April 2010 (8)
- March 2010 (4)
- February 2010 (6)
- January 2010 (3)
- December 2009 (5)
- November 2009 (8)
- October 2009 (12)
- September 2009 (6)
- August 2009 (5)
- July 2009 (11)
- June 2009 (8)
- May 2009 (16)
- April 2009 (10)
- March 2009 (7)
- February 2009 (10)
- January 2009 (15)
- December 2008 (9)
- November 2008 (9)
- October 2008 (9)
- September 2008 (13)
- August 2008 (10)
- July 2008 (14)
- June 2008 (23)
- May 2008 (16)
- April 2008 (12)
- March 2008 (16)
- February 2008 (9)
- January 2008 (13)
- December 2007 (13)
- November 2007 (16)
- October 2007 (22)
- September 2007 (8)
- August 2007 (9)
- July 2007 (16)
- June 2007 (8)
- May 2007 (7)
- April 2007 (7)
- March 2007 (10)
- February 2007 (10)
- January 2007 (12)
- December 2006 (9)
- November 2006 (15)
- October 2006 (4)
- September 2006 (5)
- August 2006 (5)
- July 2006 (9)
- June 2006 (5)
- May 2006 (10)
- April 2006 (9)
- March 2006 (13)
Vital Trivia
License

This work is licensed under a Creative Commons Attribution-Share Alike 3.0 United States License.
Thanks for this Shaun.
I’d just like to add that these projections seem to be close to those made by Jean Laherrère. He expects Peak Coal by 2050 in terms of volume; that gives an energy peak not far from that presented here.
My thanks too Shaun - it's a very interesting perspective you've provided.
Three aspects in particular seem to me worth noting in response -
1st, the profiteers of the fossil fuel trade will, very likely,
be delighted to apply this info, along with that on Peaks in Oil & Gas supply,
as disinformation to further deride the dangers of Climate Destabilization. --- C'est la vie . . . .
2nd, we have to cap (intentionally peak) global GHG emissions within a decade
if we are to have an even chance of avoiding the GW feedback loops swamping the planet's carbon sinks -
[aka "the Runaway Greenhouse].
Thus the geological peak of coal production must be pre-empted by a binding legal peak.
3rd, the highly credible notion of Tradeable Energy Quotas, as a means of constraining energy usage within a country,
begs the seminal question of just how such quotas (aka declining emission entitlements)
are to be allocated swiftly and reliably across the nations ?
Plainly, in the absence of that international framework, nothing significant has happened
(or is likely to happen) at national level re cutting fossil fuel usage.
The only credible policy framework I've seen for allocating those national entitlements
is that of "Contraction & Convergence," as advanced by Global Commons Institute. [ www.gci.org.uk ]
If you can spare the time, I should be very interested to to read your views on the potentials of that policy framework.
Regards,
Backstop
There's something fishy about the graph "possible worldwide coal production."
The FSU looks to have dramatically higher future production than the US. Is it possible that the authors switched the headings for US & Russia? If so, that is a fairly major error, eh?
The FSU (Former Soviet Union) is more than just Russia, also including the Ukraine and Kazakhstan. When the full final report is released (Wednesday I believe) the details behind that graph will be made clear in detail.
Great post Shaun
There is much talk about "clean coal technology" that may come on stream in the next ten years or so. This will not be without cost and I suspect that a greater amount of coal will be needed to compensate for the energy input into whatever that technology is.
Does this report take this into account, or is it based on existing usage methods? If not and 120% (say) of current requirements are needed to clean up coal usage, then peak will occur 5-10 years earlier.
The Energy Watch Group report is discussing coal production only, not the uses it will be put to. As you say 'clean coal' has a substantial energy cost, which will only exacerbate any production limitations.
I'm actually preparing a report on 'clean coal' and Coal-to-Liquids technology that should be up on the soon-to-be-relaunched Lean Economy Connection website soon.
Backstop, I basically agree with everything you say! If you read our booklet on TEQs you'll see that the scheme is specifically designed to sit within an international framework like C+C (and yes, C+C is the most sensible international framework I have yet seen suggested).
I had a very productive conversation with Aubrey Meyer a few weeks back, who agrees that C+C will need capped tradable quotas like TEQs at a national level in order to guarantee meeting individual nations' targets under C+C. And as you point out, TEQs also needs C+C.
The third strand of the solution is of course at the individual and local level, where the actual emissions reductions take place, supported by the TEQs framework. In this regard, the rapidly-growing Transition Towns movement is a great example.
Interesting post. Have you looked at the fact that, at least in the US, these 'peaks' are really demand driven? Anthracite is used for steel production isn't it? It would make sense that we use less of it as steel production in the US declined. Hasn't natural gas, at least since the early 90's and wind power over the last few years been the primary sources of newly installed electricity production?
I will have to look at the ideas of these 'dissenting voices' more carefully, but I am very sceptical that any of this is true. Lets not get carried away with these 'peak' claims.
I agree that we should not get carried away with peak claims. They should be dismissed with comprehensive studies and not CERA type claims... Keithster100 are you volunteering to perform such a study? If not, then simply dimissing things out of hand is, say we say, disingenuous.
True, like I said, I would need to do more research.
As far as volunteering, how do you get to post the initial editorial rather than just be a comments-poster? If given a shot, I would love to write one about ethanol.
I think it's time for another major post about ethanol. I believe you would be on the pro ethanol side. Is that correct? I am especially interested in a recent study done by Colorado State University and the USDA concluding that major greenhouse reductions can occur with the use of corn ethanol and even more significant reductions with the use of the grasses.
Of course, if you are on the pro ethaonol side of the issue, you will get a great deal of interest on the rebuttal side, especially regarding the impact on corn prices, food prices in general, soybean production, and the push by farmers to use lands currently set aside for conservation. Frankly, I am still mystified by the allegation that not much concern should be placed on higher food prices, but am interested in hearing a good explanation of same.
Tangentially speaking, our farm policies and subsidy policies favor things like corn and soybeans to the exclusion of products like fresh vegetables. I think this policy just aids poor health, diabetes II, and overweight. As a vegetarian who really doesn't want to indirectly subsidize the beef, pork, and chicken industries, I feel discriminated against.
Anthracite production peaked decades ago. My father-in-law is a retired VP of CONOCO, having been a VP of CONSOL (Consolidated Coal) when they were acquired by CONOCO back in the early 1980s. (They later sold off CONOCO but they may be regretting that now.)
Anyway, he loved to point out that anthracite had peaked and no amount of economic incentives would change that. There just wasn't that much more of the stuff left. He's a mining engineer by training and spent many years working his way up through CONSOL's ranks.
And coal use is still high in the US. We use it as a large fraction of our electrical power generation, which has only increased steadily over time. The fraction used in steel production was tiny anyway by comparison.
Ghawar Is Dying
The greatest shortcoming of the human race is our inability to understand the exponential function. - Dr. Albert Bartlett
Keithster thank you for making the Very Good Point here about the "above ground factors" like politics and economics constraining coal production - especially in the US.
I wonder what will happen to the politics (e.g. glOBaL warMiNg) and econonomics (eg. "use coal ?!?!- oil is cheap and plentifuyl right now") as Energy Desperation grows and we begin Fuel Twitching???
What happens to the PrOjECteD COAL supply, demand, production etc when the Hordes of industries and of consumers try to switch from oil and ngas-based energy to electric or coal gas or whatever???
Watch out for blind, angry Masses-O-Saps flailing about and gibbering madly, "Fuckin' BUSH!" , spittle flying to and fro... I imagine a Stephen King novel is about to come to life ;)
(PS. I'd love to see Keithster do a Ethanol column).
The US hasn't really peaked in coal production. There was a false peak in the late 90's that related in large part to the emphasis on building NG electric plants, decreasing coal demand. 2005 broke the previous coal production record, and 2006 topped the 2005 mark by another 2.5%. The demand just wasn't there until recently with the rise in NG costs.
http://www.commodities-now.com/content/market-news/market-news-200701094...
It should also be noted that in the U.S. the main reasons for downward revisions to coal reserves are 1) the clean air and water act and 2) the very low price coal had been fetching until recently. #2 has already changed stimulating greater production, and it's questionable how strong the U.S.'s resolved will be regarding #1 after oil peaks.
"As many of these reserves are of low quality, with high sulphur content and/or other drawbacks, it may be considered doubtful that they will ever be produced."
New mines are opening in Ohio for the first time in decades and several mines in Ohio have reopened after being closed for over 20 years bc/ with the higher coal prices, it is now economic to mine this coal and spend the money on special scrubbers to remove the sulfur. Certainly a lot of coal will never be economic due to the cost of and energy required for extraction, but the sulfur/ pollutant problems (save CO2) is not an insurmontable hurdle.
"it is now economic to mine this coal and spend the money on special scrubbers to remove the sulfur."
It's even easier with an inattentive CLEAN AIR ACT state/fed. admin. Sometimes, ex post facto, the special scrubbers are prompted by lawsuits from neighboring states
http://www.ct.gov/ag/cwp/view.asp?A=1778&Q=284042
The suggestion was that America had peaked in coal energy. with the more recently mined coal being of lower energy per tonne and even lower net energy tonne.
Exactly. That is the key.
Keithster100, the final version of the Energy Watch Group report will be released online next week, and will contain substantial discussion of the possible reasons for such US peaks. I was just providing a brief summary of their findings, so you should be able to take a more careful look very soon!
Like Keithster 100, I will venture an opinion without doing any research. Anthracite is not used for steel production because there isn't enough of it. The coke for the blast furnaces is produced from bituminous coal.
Phineas Gage and I commented on this story when Leanne cited the link to Heinberg's comment on it on the March 22 Drum Roll. I think that our comments bear repeating.
Jeff and Phineas are you talking of volume or energy? The article doesn't claim a US peak in terms of volume.
I was referring to volume. I can't find the original data referring to the energy peak from coal. Can anyone provide a link?
I am suspicious of claims that coal is near peak in the US bc/ we just really haven't been trying very hard lately. A new coal mine had not opened in Ohio in decades until just now. vtpeatnik notes below that illinois coal production dropped 50% due to high coal. Wyoming Coal is transported all the way to Ohio and WV despite high coal reserves here. The only reason, frankly, is sulfur (and sometimes mercury and other heavy metals). Although not much coal around here (Ohio/ WV) can be open pit mined anymore, it's not that it's too hard or expensive to get it out of the ground, it's the sulfur. As I've noted, it is now economic to mine the dirty coal and remove the sulfur. Coal will likely increase in price, making the exploitation of high sulfur appalachian coal even more enticing.
My fear is that people might get a false sense of security that if there really isn't that much coal after all, we need not worry about the environmental effects. I'll be the one breathing the SO2 and filtering the heavy metals out of my water. Coal resources will once again become important as world oil and US NG peak, and we need to be very judicious in using it.
The quote from my article above is:
"The USA had passed peak production of anthracite (by far the rarest form) by 1950 and peaked in bituminous coal in 1990, but sub-bituminous coal more than made up for this decline in terms of tonnage. However, due to the lower energy content of softer coals, the total energy content of annual US coal production peaked in 1998." (emphasis changed)
The original data will be in the final Energy Watch Group report when it is released next week (I will update my summary with a link to it when this happens). Apologies if my summary has got you keen to get into analysing data which isn't quite yet available, I was just whetting the appetite!
As I mentioned in another reply, the possible reasons behind the US figures will be discussed in more detail there.
And may I echo your fears about a false sense of security. With current practice, a scarcity of high-yield energy resources just means that dirtier lower-yield energy resources will be exploited.
Apparently Illinois coal production fell by 50% becasue it is higher in sulphur than Wyoming coal and difficult to scrub. The hope is that with coal gasification and IGCC, this will not be a problem and will in fact lead to industrial sulphur production.
- I thought that there is already a surplus of sulfur, and it is growing due to the refining of "sour" (high-sulfur) oil. I suppose one can get rid of excess sulfur somehow, but the methods are either environmentally destructive or cost energy. (Same for "scrubbing" and burying the CO2.) EROI anybody?
I'd have to look it up to be sure, but probably any additional sulfur production would be near worthless now. As manufacturing and chemical production is offshored, less and less sulfuric acid is needed.
Aren't there some new battery chemistries based on sulfur, with energy densities high enough to be interesting? High-temp sodium-sulfur for stationary applications, and aluminum-sulfur for portable apps? Seems like an area where one might expect the coal and oil companies to put some research bucks, in hopes of creating a market for that surplus sulfur.
The David Hughes analysis appears superficial. He notes that the US imports coal, but omits that this is a small, regional thing similar (in concept, though not in size) to the eastern canada oil import situation, and that the US exports much more than it imports.
How much do peak coal calculations depend on peoples willingness to let large stretches of countryside be turned into moon landscapes?
Excellent point. Mountain top removal is the ultimate fouling of the nest. Yet it is accelerating, because greed was declared to be good a while back. "Stockholders for the Southern Company or Peabody Energy aren't interested in underwriting efforts to maintain a stable climate [or in preserving the natural world]. They're interested in maximizing the return on their investment."
That is a quote, with my addition in brackets, from the fine book by Jeff Goodell, "Big Coal" (2006). He discusses coal reserves, indicating that the 250 year supply often claimed for the US may be inflated by about 200 years.
I've been doing a lot of focused research on the Chinese coal industry and have been coming to the same conclusion. The growth path they are expecting now (lower than recent growth rates, but not including the additional demand that CTLs would bring) will put them at the half-way point of extraction of their remaining recoverable reserves somewhere around 2017-2019. Though it may not be a production peak, certainly extraction costs will rise significantly. Less than half of China's remaining reserves are bituminous, so to deliver the same energy, production will need to rise even further as they exploit sub-bituminous and lignite reserves.
Chinese data assert remaining reserves in the hundreds of billions of tonnes, but the recovery factor is only about 30%, so must be discounted.
The problem is, China has few options to move away from coal to any degree. Their much-vaunted nuclear expansion to 40 GW will displace only about 100 million tonnes of coal, compared to the 2.3 billion tonnes they consumed in 2006. Natural gas is similarly constrained--to offset 250 million tonnes of coal for power generation, for example, they would need to import an additional 100 bcm of gas beyond the 100 bcm they will need to import by 2020. LNG and pipeline gas from Russia and Central Asia simply can't supply that amount in the next 15 years. So China is going to be in a bind different from the US, where our falling natural gas production is pushing us more to coal, while China is trying to find a way to move away from coal.
A reserve is by definition, Sparaxis, something that can be produced. China's 150 million tonnes of reserves are thus already calculated on the basis of the 30% recovery factor. Considering that the more technically advanced U.S. mining sector averages a 60% recovery factor it would be surprising if the Chinese did not improve this over the long term. Or they could just assess and measure more of their estimated 5 trillion tonne resource base to see how much is economic to mine.
Thanks for that Sparaxis - I've been following your well-informed and insightful posts on TOD for a while. I look forward to hearing your thoughts on the full Energy Watch Group report when it is released next week. One annex of the report deals exclusively with Chinese coal resources and production.
Obviously, there is a huge amount of genuine uncertainty in connection with even the basic issues regarding coal reserves; this is true also (albeit to a lesser extent) regarding natural gas. The contrast with oil is pretty stark here, as I think most who visit here on TOD would concur that the oil situation is by now pretty well understood.
Perhaps what this means is that TOD should consciously shift its focus toward natural gas and coal in the future, in the form of publicising and analyzing every scrap of publically available information so as to develop a systematic, detailed, and relatively certain picture - as has already been done for Peak Oil.
Just my two-cents worth - for what it's worth as a humble poster without any real expertise in any of these matters.
"Perhaps what this means is that TOD should consciously shift its focus toward natural gas and coal in the future,"
Chip in my two-cents worth too... especially on natural gas.
Maybe TOD can "out" two more Mass energy Delusions. Then we can wait to see how long it takes for the Dead Carp on Cablevision to inform the masses.
Predicting a peak of underexplored resource, long before it has experienced any kind of geological constraints is a fools game. Even Hubbert managed to predict US oil peak mere 10-15 years before it actually occured (in 1956 he predicted it for 1965-70) - using data with quality orders of magnitude higher than what we have for coal and even for oil (worldwide) today. And again he was not quite right - he underestimated reserve growth and only the fact that supply growth was higher than what he was expecting helped his prediction of the timing of PO in US to be about right.
The thing is that what we call "coal reserves" now has not been tested against extensive research and development. For all practical purposes coal is "enough" for everyone, and there is harldy an incentative for miners to even try to improve the quality of data. The bottom line is that we can not possibly know about impending coal peak at this point. I expect it will be like oil - we will start recieving signs for this 5 or 10 years prior to the event - only after everyone has been exploring for coal and "digging dry holes" for many years. Given such circumstances predictions for "peak coal", "peak uranium" or "peak whatever" I find highly speculative and, IMHO, absolutely irresponsible. As history shows crying wolf and being wrong over and over again is the best way to ruin your credibility and compromise the whole message at all.
But why is it not at least IN PRINCIPLE possible to obtain thorough and accurate data on this question, and to make reasonable predictions about Peak Coal based on being knowledgeable about what was required to extract it in the past under given conditions?
Well in principle it is possible, but like everything this costs money. And the additional explorations which will allow us to determine the ultimate size of the resource will cost huge money. At this point it is my understanding that coal is simply too cheap and abundant to be worth this effort.
Of course some areas like UK or Germany are relatively well explored but this is hardly the case for the most important coal producers - China, USA, Australia, Russia, South Africa etc. - and these account for over 90% of the world production.
But since coal is the principal "fall-back" source of energy for the entire world, it seems to me that it might not be a bad idea for the world to have some notion of just how much cushion coal can reasonably be expected to provide in coming decades. As far as I can tell, greatly ramped-up usage of coal is the closest thing to a "plan B" that the world has in coming decades as oil and natural gas become short in supply. If this costs hundreds of millions or even a few billion to get a handle on, then I for one would consider this money well-spent.
Wind and solar are "plan B", and rapidly becoming plan A.
Wind is the dominant form of new electrical generation in the US. Solar is at 2GW of new generation per year worldwide, and growing at 40% per year (a doubling time of 2 years).
The principal problem is liquid fuels, and PHEV's and EV's are the best solution. The primary problem is growing them fast enough.
Hybrids are 1.8% of new cars in the US and growing pretty fast. They have a partial electric drivetrain, and are field upgradeable to a PHEV, so they're the path to PHEV's and EV's - we need to accelerate them.
Remember solar has about a 10% load factor and wind a 30% load factor.
Solar grew only 19% last year, just over 1.7GW world wide largely limited by polysilicon availability as it will be this year. This is equivalent to 0.2GW of gas or coal powered generation at 80% load factor.
US wind generation installed in 2006 was about 2.6GW (p6), equivalent to about 1GW of gas or coal powered generation.
At the moment there are 150 coal fired power stations in planning in the the US for the next few years probably with an average rating at least 1GW. China installed about 2GW of coal fired capacity a week last year.
Sadly wind and solar are at the moment bit players in the electrical generation business today, and will continue to be so for several years yet, much as I would like it to be otherwise.
I agree that most solar is based on PV and most of that is based on silicon. However, a recent article described a 500MW solar plant being built in California that is based on reflectors and Sterling engines so there are viable alternatives to polysilicon. Even that should be a temporary shortage as plants are being built to produce silicon specifically for PV use. This is cheaper than making silicon for semiconductor use.
http://www.power-technology.com/projects/victorville/
"wind and solar are at the moment bit players in the electrical generation business today"
That's not true for wind.
"US wind generation installed in 2006 was about 2.6GW (p6), equivalent to about 1GW of gas or coal powered generation."
And yet, it was still 20% of new generation installed in the US in 2006.
Wind is 44% of generation planned for 2007 (adjusted for capacity factor), and this trend is likely to continue. Wind could easily handle all new generation in the US within 5 years.
These come from the Nuclear Energy Institute:
http://www.nei.org/documents/Energy%20Markets%20Report.pdf on page 8, and capacity factors are here http://www.nei.org/documents/U.S._Capacity_Factors_by_Fuel_Type.pdf
Wind at 3-8 cents per kwhr is already cheaper then nat gas, and isn’t that far coal (cheaper if you include even a portion of external costs like pollution, GW, occupational health, etc). Wind will be very easy to expand, as there are a lot of farmers just dying to get a wind farm or expand the one they already have, and manufacturing of wind turbines is a pretty straightforward thing to expand. Not overnight, which is why wind developers are currently limited by the turbines they can lay their hands on, but pretty straightforward.
More later...
Wind is fine as long as you have other power sources (preferably hydro) to balance with. When it comes up to around 20% you need to build energy storage and the price for wind power will go up too.
Denmark has a lot of wind power and they balance with Swedish hydropower and coal of their own. They also dump their excess cheaply to Germany and Sweden.
Yes, around 20% you might see rising marginal costs.
It might start higher than that, with geographical diversity. A recent study found that in a sufficiently large area (specifically, the UK) that wind's variance is much lower than expected, and that periods of very low wind power are extremely rare. It also found that wind output was positively correlated with electricity demand. This is particularly true if you are assuming a significant portion of offshore wind (the wind blows a lot more constantly 10 miles offshore, than it does onshore).
www.npower-renewables.com/pdfs/windpoweruk.pdf
Pumped storage is very cheap at about .6 cents per kwhr., which is no more than a 10% cost premium for 100% storage. You might need 25% storage for low wind market share (under 20%), and maybe 50% for over that.
I would guess that around 15-20% kwh market share that the marginal cost of wind would start rising, and that somewhere between 35% and 50% would be the economic limit. I would project that in the long-term that an optimal grid mix might be 25% wind, 30% solar, 15% hydro, 15% other (wave, geothermal, etc), 15% biomass (for stored power.
The generation cost of pumped storage may be low but the capital costs are very high. When Dinorwig was built between 1976 and 1982 it cost £241/kW. It was the largest civil engineering project ever undertaken in the UK at the time. The resale price index has gone up by a factor of 2.56 since then indicating costs now of £617/kW, about 60% of the capital costs of large wind turbines.
Dinorwic can generate for only 6 hours at full output. If we were to consider taking wind up to 50% of total UK electrical generation we would need an average of about 19GW which with a 30% load factor would need 57GW of rated power and there would be times when the output would be near this rating which exceeds the daily peak of about 48GW and is almost twice the nighttime trough of 30GW. Unless we were prepared to throw away sizable percentages of available power we would need several times more storage than the 6 hours of Dinorwig. Storage costs would then dominate the capital costs. If we did not provide storage on this scale we would need to install even greater rated capacity to reach 50% and for an even greater proportion of the time the output would exceed total demand adding positive feedback to the requires rated capacity.
The UK is better provided than Denmark in both average wind speed and averaging of wind speed by geographical diversity but it is instructive to see how the vast number of turbines over the whole of the west Denmark grid system, including substantial offshore capacity, fails to smooth out the wind intermittency. There are weeks at a time of below 25% of average.
On of the main reasons is that the output of a wind turbine drops so rapidly with falling wind speed. Typically the output at 7.5m/s is half that at 10m/s and at 6m/s it is about a quarter.
There is an excellent review of renewable energy here . The author examines the amount of pumped storage that would be needed (about 100 times Dinorwig at high percentages of wind power) and considers where such sites could be.
Solar is even worse in this regard having about 10% load factor in the UK and a certainty of no output at the time of winter evening peak loads. It also costs, at present, about 30 times as much as wind per kilowatt of average power (rated power times load factor).
I am not trying to stop the installation of renewable energy , I am passionately in favor of it. I just want it to be recognized that the economics get rapidly more difficult as the percentage of total generation climbs.
Something you ignore is that we could engineer our systems so that demand can be scheduled to handle the supply. For instance, your refrigerator could have a couple of gallons of water above the refrigerator compartment and another gallon or so of a salt solution above the freezer compartment. Upon a signal from the utility, it would run the compressor flat-out but with the air circulation doors to the food compartments closed. This would freeze the water and salt solution.
Later, the wind dies down. Instead of starting the compressor up as the food starts getting warm again, the air circulation doors open and a two-watt fan blows air past the ice; until the ice is melted, all you need is the fan. The grid now has hours before it has to meet demand from several million refrigerators again, and it can take its own sweet time getting other powerplants on-line.
This applies just as much if not more so for:
Very interesting... I wonder what the energy loss for heat pumped storage like this is, and how it compares to "water pumped" storage mentioned elsewhere above, and which I assume involves pumping water uphill and running it back through a turbine.
And for that matter, I wonder what the energy losses are associated with compressed air storage in the aircar system http://www.theaircar.com/howitworks.html ? And for that matter, how does that compare to losses associated with the storage of electrical energy in batteries?
It's not "pumped storage" so much as making and storing the "product" rather than the electricity. There could even be gains; Ice Energy claims superior efficiency for the "Ice Bear" storage A/C because it can do its work overnight, when the air temperatures are cooler and the compressor doesn't have to work as hard.
Much better, I'm sure.
Based on the thermodynamic fundamentals of heat rejection temperatures in the compressors and expansion temperatures in the air motors, I would assume less than 50% efficiency. Perhaps much less. On the other hand, if your energy cost goes from $0.75/gallon equivalent up to $2.50, you're still ahead even at today's oil prices.
Dinorwig, the largest of the four pumped storage schemes in the UK achieves a round trip efficiency of 75%
Huntorf the German compressed air scheme achieves 42% round trip efficiency. This is limited because the heat generated in compression is allowed to leak away into the rock of the cavern. There are schemes for extracting the heat in a heat exchanger and storing it above ground in an insulated thermal mass and reheating the air with it as it is expended for use in generation. No large scale plants using this scheme have yet been built.
Batteries can achieve high efficiencies. The best of lithium ion cells have an AC to AC round trip efficiency of 85% but cost at least an order of magnitude more than pumped storage.
"The best of lithium ion cells have an AC to AC round trip efficiency of 85% but cost at least an order of magnitude more than pumped storage."
hmmm. I've seen claims of 90% for EV's, but that doesn't include a 2nd inversion to AC.
Li-ion is certainly more expensive, but you'd get it for free with EV's, where owners pay for the primary purpose of transportation.
81.x% round trip efficiency has been reported from Bath County Virginia Pumped Storage. They improved this from 80.1% and were proud of the effort.
Best Hopes,
Alan
Have you got a link to that that Alan?
They were a poster at the 2006 Hydrovision conference in Portland Oregon. I talked with them for about 15 minutes.
Sorry, I know of nothing on-line.
I have also toured Raccoon Mountain Pumped STorage, also about 80% round trip efficiency.
Best Hopes,
Alan
This is a very informative post.
The link you give for "here" is missing. Could you post it gain please?
Thanks!
Sorry about that. the url is :-
http://www.inference.phy.cam.ac.uk/sustainable/book/tex/cft.pdf
It is the draft of a paper called "sustainable energy - without the hot air" by David J C Mackay of the department of physics at the University of Cambridge. It is 349 pages long with lots of detail about the need for and the types of large scale energy storage.
This author criticizes other people's "codswallop". I hate to say it, but he's written something just about as misleading as anything he critizes.
For instance, he calculates on-shore wind production as 20kwh/day/capita, and compares this to driving consumption. He estimates an average persons's driving consumption as 70 kwh's per day, based on driving 100km/day. This is wrong in so many ways, I don't know where to start.
First, the average UK kwh/day in the form of electricity is only 17. 2nd the UK uses 10 quads/year, 4 of which are used for electricity, and 6 of which is equal to about 25 khw/day. So, total consumption is about 42, or less than 1/3 of of his total energy consumption estimate of 142. His error, apparently, is that he equates the BTU INPUT for heat engines (nuclear & FF power plants & ICE vehicles) with the 3x times smaller electricity OUTPUT needed from wind (and solar).
His driving example is equally misleading: the average UK driver drives about 30 km/day, and only about half of the UK drives, so per capita km is only 15, as opposed to his 100/day.
Further, driving uses about .15 kwh/km, not .7, if you actually use electricity to power your vehicle, instead of incredibly inefficient internal combustion vehicles.
So, the average resident of the UK would only use about 2.25 kwh to drive, not 70. So, he's off by a a factor of 31 times!
He estimates that onshore wind could produce 20 khw/day/capita, shallow offshore 16, and deep offshore 32, and concludes that this is much smaller than total consumption. In fact, the total of 68 is more than 2.5x actual consumption.
Now, looking at his estimates of storage, I see that he hasn't attempted to actually quantify the storage needed, he's just costing it out. He just asks: what if we needed to draw all power out of storage? That's not realistic, and not the way such a thing would be pursued.
As I discussed in another post today on this article, wind doesn't vary that much, and pumped storage would be the last, and most expensive option to address the variance that does exist.
I wouldn't rely on this analysis.
Hmmm. Well, there are several things here to comment on.
You're overestimating the variance of wind. For instance, what can we learn from variance in Denmark?
Not that much. First, West Denmark (where most turbines are) is tiny, and even though wind produces 19% of Denmark’s consumption, the average wind output of 730MW is still very small. Second, the turbines are all in a relatively small geographical area, so that they aren’t very independent weatherwise. In effect, it’s pretty much one very large windfarm. 3rd, Denmark’s wind resource is rather poor, compared to the US or UK - the average load factor is, IIRC, about 15%, or half that of the US, and that increases variation around the mean output (as well as raising costs).
"would need 57GW of rated power and there would be times when the output would be near this rating "
Not that close. Even individual wind farms very rarely exceed 85% of capacity, and in the UK, as you note, geographical diversity would reduce the overal peak quite a bit. I would estimate that you would rarely exceed 50% above mean output, or the nighttime trough of 30GW.
There are much less expensive options from Demand Side Management (DSM) for handling peaks in output, as Engineer-Poet points out. These would be used first, before pumped storage. Please note that PHEV's/EV's would provide invaluable storage through DSM that would help smooth out production variability.
"Solar is even worse in this regard having about 10% load factor in the UK and a certainty of no output at the time of winter evening peak loads."
As I understand it, this is resistance heating, in very, very drafty UK homes. This would be very amenable to DSM: thermostats could vary by a few degrees depending on output. I have to say, the UK has to do something about this very weird form of heating: they have to go togeothermal heat-exchange, and start insulating those homes! As I understand it, there's resistance because it would mean losing living space in what are already very small homes. Still, they've got to bite the bullet, and do something - perhaps more efficient, thinner forms of insulation.
"It also costs, at present, about 30 times as much as wind per kilowatt of average power (rated power times load factor)."
In the US retail electricity costs about ten cents per kwh. Wind probably costs 11 cents, on average (6 cents wholesale, plus 5 cents distribution, transmission & overhead). Solar PV would cost about 60 cents/kwh at 10% load factor, taking all things such as capex & interest costs into account ($7/Wp, 30 year life, 6.5% interest), without subsidies.
That's a stiff premium (of about 5.5 times wind), but not 30x.
It may be tiny to an American sense of scale but the turbines are spread over 340km, the whole of the Jyland peninsula and the Island of Fyn. The islands of Sjaeland and Lolland have a separate grid. The UK is about 1100km from end to end but most of the wind turbines are in Scotland of the Scottish seas. The geographic spread is not that much better.
Danish load factors 1999 to 2003:- 20%,21% 20% 18% 21% (eyeballed from graph)
UK load factors 1999 to 2003:- 28.2% 28.2% 26.4% 29.9% 24.1 % (DTI statistics)
Better but not that much better. The best sites are occupied first so we can expect the UK load factor to drop even closer to the Danish one as newer turbines are forced to occupy less favourable sites.
As the caption to the Danish graph I posted earlier said, nine times in 2003 the Danish wind carpet exceeded 2000MW. This is 84% of rated power and many times when it exceeded 75%. There were also 54 days in 2002 when they supplied less than 1% of Danish demand.
If you do not like me using Danish figures, Graham Sindon of the Environental Change Institute at Oxford University has done a massive simulation exercise taking all the hourly wind speed readings of 66 stations across the UK for 33 years and the corresponding hourly UK electrical demand and modeled how a large, widely distributed, UK wind carpet that would produce an overall average of 20% of UK annual electricity demand would perform. He assumes a rated capacity of 25GW and a 30% load factor. He assumes 60GW peak and 22GW trough in demand. He found the effect of geographical averaging is like this:-
The black line shows how the output of hypothetical wind system would vary with wind speed if the wind were the same all over the UK. Essentially this is the performance curve of one turbine multiplied up. The spattering of dots show what the output would have been at various times when the mean UK wind velocity was as indicated on the x axis for that dot but with the distribution of wind speeds that there was at that time. There is significant smoothing but not as much as some people imply.
With an overall average of 20% of demand he analyzes the distribution in hourly time slots of the percentages of demand that will be net by this system
He finds that:-
* 0.8% of the time the system will supply less than 1% of demand,
* 12% of the time it will supply less than 4% of demand
* 9% of the time it will supply over 40% of demand.
Scaling this up by a factor of 2.5 to give a supposed 50% of total demand we get :-
*0.8% of the time ( 3 days in the year) it will give less than 3% of demand leaving 97% of demand to be met by other means
* 12% of the time (44 days in the year) it will give less than 10% of demand leaving 90% of demand to be met by other means
*9% of the time (33 days in the year) it would be capable exceeding total demand and, without storage to pump up, would have to be wasted lowering the actual total contribution to below 50%
Direct electrical resistance heating is not that common in the UK. Most central heating is by gas in areas where it is piped, which is all towns and quite a lot of fairly rural areas (not mine however). Oil, bottled gas and coal are often used elsewhere. Where electricity is used it is often night thermal storage heaters. Cheap off peak electricity is available at nights at about a third the price of daytime rates. Some night storage heaters are fairly sophisticated but many are little more than a pile of bricks with heating wires threaded between them in a metal box. One of these is put in each room, and fed from a separate meter with a timer on it. They are not very good but they are cheap to buy and install. A small but distressing number of old people have no central heating and rely on an open fire.
Demand side management should certainly be encouraged but it will not gain much from domestic electrical room heating. There may be something to gain from water heating. A peculiarity of UK domestic electrical wiring stands in the way of some of the advantages of remotely switched demand management. Unlike US wiring where every socket has its own spur and fuse or breaker, all wall sockets in UK homes are wired in a ring with a single overall fuse or breaker. That is why those huge UK plugs have fuses in them. Unless you rewire the house you cannot cut current from one socket without cutting it from all sockets in the ring
The insulation in UK homes is, on average, appalling. Houses such as this are very common. The end-on bricks you can see, tell you that is has 9 inch solid brick walls and will just have 15mm of hard plaster on the inside. The windows are single glazed with counterweighted sash windows that slide up and down. To stop them jamming in the side grooves they cannot be too tight a fit and the wood has probably warped over the years to made the fit worse. To increase the window area and hence losses there is a bay window of solid stone. To negate the advantage of it being in a terrace with fewer outside walls there is a tunnel through the terrace open to the wind to give rear access. There will be a chimney flue in each room and although most of these will be boarded up there will be convention in the flue sucking heat out of the rooms. The roof will be thin Welsh slate, and, if it has not been redone will have no felt under it allowing the wind to blow through the passages created by the natural surface irregularities of the slate. Often the wooden floor will be suspended on joists above the earth and air bricks in the walls will allow air to circulate under the floor and through the floor boards if these are original. This was done before the days of damp proof courses to reduce the dangers of wet rot in the timber. Such houses are a thermal disaster.
Such houses are not going away. They are sought after and in some parts of London can fetch £250,000. Although there are hundreds of thousands of such houses they are not the majority of UK houses. Those built after about 1935 have cavity brick walls and these cavities, about 50mm wide, can be filled with foam or fibres and there are grants for doing so. Houses built in the last 15 years have had to meet much higher thermal standards and there is pressure to up the standards even farther. However unlike America there has been no large scale flight from the centre of the cities and old buildings are being refurbished. Because they are largely built of very durable materials, brick stone and slate, the basic shell can and almost certainly will endure for many decades. It will be a long time before all houses meet even today’s standards for new building.
Whether UK homes as very small is a matter of personal judgement. They may seem small to American occupants of McMansions, they seem very spacious to most Japanese. Unsurprisingly they seem normal to the British and it is not the loss of a couple of inches that deters owners of solid brick walled houses from insulating the wall but the cost and the disturbance. Because the walls are so thermally conductive there are some tricky considerations of condensation. Likewise just blocking all draughts is not without problems. Having spent years trying to get a 150 year old cottage into some sort of energy efficiency I understand the reluctance of those with less resources than I am lucky enough to have to start on such a project even if it would be financially beneficial in the long run.
The winter evening peak in the UK is due to the fact that about 4.45 in the afternoon in mid winter high industrial/commercial and domestic use coincide. It is dark and lights are on everywhere, where direct electrical heating is used, this is near its peak. Industry is still in full swing and the shops are open, but children are home from school and a meal is being cooked, water is being heated for baths, showers and tea and televisions and home computers are on. Train travel, main line and London Underground, nearly all electric, is building up to the evening peak. At this point solar systems are putting out zero power after what has probably been a very poor generating day. The weather pattern in the UK greatly accentuates the annual variation due to solar geometry. Each of the three years I have had my 2.7kW system I have had whole weeks near the winter solstice where I have generated less than 4kWhr. Near the summer solstice I have generated 100kWhr.
Solar panels are more expensive in the UK for some reason. At retail, a Sanyo HIT215B panel costs £1035 + 5% Value Added Tax (VAT was recently reduced from 17.5%) At 215W rated output this is £5054.65/kW. Installation generally adds about 50% in the UK. If you want to connect to the grid in the UK you must get the work done by a registered installer. This brings the cost to £7582/kW rated power. This is about the same as the £20,000 before grant for the 2.7kW system I got 3 years ago. This brings the cost depreciated over 30 years and with 6.8% interest (the best I could find for home improvement loans) to £768.29 per rated kilowatt per year. At 10% load factor you get 876kWhr per rated kilowatt per year. This comes out at £0.88/kWhr.
A study by the UK Royal Academy of Engineering gave the cost of onshore wind generation in the UK as £0.035/kWhr without any allowance for the cost of back up. This isn’t quite 30 to 1 and small scale domestic solar to large scale commercial wind is not an apples to apples comparison but it is a lot more than 5.5 to 1 and shows why there are no large scale commercial photovoltaic installations in the UK to make such a comparison.
Ground sourced heat pumps, as they are called over here, are rare and expensive in the UK. I have one but at the time I installed it I think there were only about 150 other domestic systems in the UK. In a very urbanised country there are only a fairly small percentage of houses with the land to lay curly pipes in their garden and the alternative of drilling down several hundred metres in the back yard of city houses is fairly impractical. In London there are all sorts of things you might hit if you were not careful.
My Danish information comes from two articles by Hugh Sharman Why wind power works for Denmark and Why UK wind power should not exceed 10GW There is much that I disagee with him about, especially in the second paper and these papers have been seized on by anti-wind power campaigners and distorted out of all recognition to what he actually says, to oppose nearly all wind energy. In a similar way Graham Sinden's paper has been seized on by the less analytical proponents of wind energy to imply there are no real limit to how much wind power we can employ and diversity solves all problems. Both authors have some very solid things to say about how much wind power we can employ. My conclusion is that the great ease of incorporating 5% of wind generation in the UK and the feasibility of taking this up to 25% of 30% with a fair bit of adjustment and the falsity of the arguments that these levels are not obtainable or of no great benefit if we do achieve them has lulled many into ignoring the huge difficulties of going far past this point. The great missing factor I feel is development of storage on the hundreds of GWhr scale. Using the batteries of electrical vehicles is an interesting idea but we are a very long way from having a sizeable fraction of our vehicles battery driven and the establishment of a vast network of grid connected inverters and metering systems not only at home but at work and in car parks is an enormous undertaking and I have great difficulty in seeing it as more than a fraction of the solution for acouple of decades to come. and we need answers before then.
Nick and Nick
This is a great discussion. Thank you to you both.
One thing I would add on your London Terraced house.
They go for £500K and up, not £250k and up. Anywhere virtually in Zone 1,2,3 that isn't obviously depressed or depraved.
It underlines that all this malarkey about home solar panels and windmills, c/o David Cameron, Ruth Kelly etc, is a waste of money compared to:
- subsidising saving the rainforest
- investing in more home insulation, better home boilers etc.
My own 'gut' is that 10% of UK power from wind is no problem. 20% may be doable.
Above 20% we are in entirely unknown territory. Probably we need some big rethinks re how we use power, and how we store it. I can't see us covering Wales in pumped storage facilities, somehow.
But right now, we are less than 1%. There is lots to go for.
"It may be tiny to an American sense of scale "
Perhaps tiny is the wrong word, but it's small enough that a single weather system can pretty much affect all of the turbines simultaneously.
Ideally we want a grid that connects the whole of the EU, or at least all of the UK and Ireland. Heck, Denmark doesn't even have a single grid for the whole country! The only thing that saves it is the connections to other countries. As you note, the UK doesn't yet have a wide distribution of wind farms.
Your stats indicate about 20% load factor for Denmark, and about 28% for the UK. That's higher than I remembered for Denmark, but it's still 70% of the UK, and 67% of the US. You have to give the Danes credit for pursuing a distinctly poorer wind resource that would be 50% more expensive, and have distinctly higher variability than one that was higher quality.
"The best sites are occupied first so we can expect the UK load factor to drop"
I would want to see data on this. My understanding is that the most fertile wind frontier in the UK (and elsewhere in Europe) is offshore, where load factors are distinctly higher. Also, turbine size, and therefore load factor (due to greater height reaching faster winds), is rising.
"nine times in 2003 the Danish wind carpet exceeded 2000MW. This is 84% "
That's reasonably consistent with my estimate. If it was above 84% for 8 hours for each of those 9 days that's only 1% of the time, which pretty much qualifies as "very rarely".
"There were also 54 days in 2002 when they supplied less than 1% of Danish demand."
That's a fair number of days, but again, a small, low load factor system....
" a massive simulation exercise taking all the hourly wind speed readings of 66 stations across the UK for 33 years "
First, I would expect a pretty strong correlation between overall mean air speed and power output - that doesn't seem to give us much new information. More important is the distribution of overall power output. 2nd, are these all onshore? You'd have to include offshore, where the best wind resource lies. The power distribution analysis does seem to be not that encouraging, but I'd like to know where the 66 stations are. When I have time I'll look at the documentation.
What do you think of this study, which supports the value of geographical diversity in the UK?
www.npower-renewables.com/pdfs/windpoweruk.pdf
Interesting description of demand management and UK electrical demand. Residences get charge night time rates? That's just being introduced in Canada and the US. What are the hours? Couldn't changing those hours help with that winter eveing peak demand?
I agree that we'll face rising marginal costs for wind at somewhere around 25% market share. I think that there is enormous potential to demand management, and that we've barely scratched the surface. PHEV/EV charging is kind of a marriage of demand management and storage.
Please note that the simplest way to take advantage of PHEV's wouldn't require inversion, or even new meters: you could just use timers as is done with thermal storage. I think that PHEV's could grow just about as quickly as wind power, and provide a marvelous synergy. Certainly there could be quite a lot out in 15 years, and they could soak up a disproportionate share of production variance.
There will be a nice synergy with solar, as it has a different pattern than wind, has either an independent distribution or one that is weakly negatively correlated with wind, and is nicely correlated with peak demand. Solar will have to get much cheaper, but it's getting there fairly quickly, though we haven't seen the effect in pricing quite yet because of overwhelming demand, which has kept ahead of supply.
"This brings the cost to £7582/kW rated power. This is about the same as the £20,000 before grant for the 2.7kW system I got 3 years ago. This brings the cost depreciated over 30 years and with 6.8% interest (the best I could find for home improvement loans) to £768.29 per rated kilowatt per year."
If I use a spreadsheet formula, I get £598.78/KW/yr, or £.68/kwh. Any idea why PV is so much more expensive in the UK?
"Ground sourced heat pumps, as they are called over here, are rare and expensive in the UK. "
Too bad. They're relatively common in Canada, which of course has lower density. That doesn't explain all of the difference, though.
Air-sourced heat pumps are being developed which can be efficient at lower temps, but that's fairly new.
Air sourced heat pumps should work fine in the UK-- except in the Scottish Highlands, it's seldom if ever below -5 centigrade. Cost of electricity would be a significant barrier to installation.
Ground sourced heat pumps are rare because of the cost of excavation, and local planning issues. In fact, Matthew Paris, (Times columnist, ex Tory MP), has a column this weekend about installing one in his Derbyshire home (middle-northern England, picturesque national park area, SE of Manchester).
They are not economical competing with mains gas supply. Which leaves about 4.5m homes (1/5th of the UK) which are 'off gas grid' where they would be competitive.
The real win is if you also have domestic air conditioning. this is almost unknown in the UK, but it's currently April, and it's going to be 25 degrees this week. So I would predict there will be more domestic air con in the future!
However they are not common in general, GSHPs (or 'Geo Exchange' as the Americans call them, or 'Geothermal' as some have taken to calling them eg Thomas Homer-Dixon). The installer base is limited. I think there are something like 30,000 in the UK (pace 300,000 in Switzerland and nearly 1 million in Sweden, and I think about 100k in Ontario*).
So the technology is not well understood, and you need local planning consents. And mains electricity is much more expensive, per kwhr, than mains gas. Also most house plots are small, so putting down a long enough 'trench' isn't really feasible.
The ones we use here are imported from Sweden, mostly, I believe.
Where they make the most sense is in small to medium commercial sites, and multi-unit housing. Commercial sites inevitably have air conditioning.
But there you have the usual 'split incentive' problem. The tenant has no incentive to invest in energy efficiency with a big capital cost, and the builder is building to lowest cost. Similarly the energy bill is the tenant's problem, not the landlord's.
This is what economists call 'market failure'. You can show that energy savings with a 2-3 year payback (an IRR of 30-40% ie higher than venture capital, and risk free) are ignored by consumers and commercial users.
If putting in a GSHP might cost you £10k, save you £1k pa in bills, people just aren't going to do it, even on a £750k home (which is nothing special in much of southern England).
There was a grant scheme, but the government 'rations' grants, so only a few million are dispensed (inevitably in the first day of the month). We are quite willing to spend billions on new roads (the M1 expansion is £3.5bn) or airports, but not on efficient energy use.
Scotland I think the position is better. A lot of Scotland is off the gas grid, and the Scottish Executive, I believe, gives more subsidies for GSHP installation. The soil conditions in Scotland are tough, though: you could easily wind up drilling in bedrock.
I have seen air conditioning literature here referring to 'Air Source Heat Pumps' but I don't know if this is the same as the US technology.
I would add that generally British people are incredibly ignorant about heating and insulation options. And boiler men, in my experience, barely understand the technologies they are installing. All this fuss about rooftop solar panels....
* Ontario had a scheme in the early 90s to subsidise their installation. After the electricity industry was broken up (and nearly privatised) under the 'Common Sense Revolution' of the Tory Premier Mike Harris, this programme came to an end. Given Ontario's mounting problems with peak electricity load, I suspect the utility would prefer, now, for people to use gas, bottled gas, etc.
Air sourced heat pumps (which are really only air conditioning units run in reverse mode) are a poor alternative if you can get a good ground source. The reason is that the coefficient of performance (COP), the ratio of the heat output to the electrical input, is critically dependent on the temperature difference between the working fluid at the hot and cold ends. My system is a German Viessmann machine and gives a COP of 4.6 for a working liquid delta T of 32°C but only 2.8 for a delta T of a 55°C. To get the best performance you need to keep the cold end as warm as possible and try and heat your house with as cool a hot end temperature as possible.
An air sourced cold end has three disadvantages.
1) You are in direct with the air temperature with no buffering effect of the ground
2) Air to liquid heat transfer is very much worse than liquid to liquid transfer and so you have a greater delta from the environment to the working liquid
3) The maximum practicable transfer surface than you can have is very much smaller than with buried pipes.
Even when the air temperature reached -3°C at night last December the glycol in my underground pipes was flowing out at 8.5°C and returning at 10.5°C and has never been colder. Such is the thermal inertia of a decent sized back garden 2 metres down. With an air temperature of -3°C it is probable that an air sourced unit would have the transfer liquid flowing out at -9°C and back at -6°C or colder. This would take an enormous hit at the COP.
Any advance in efficiency of air sourced heat pumps will be equally applicable to ground sourced ones and therefore this difference will remain. The best solution if you are near flowing water is a water sourced heat pump. A tiny heat exchanger in a reasonably fast flowing river easily beats ground or air sourced systems.
The other end of the problem is keeping the hot end cool. The radiators used in most UK central heating systems are kept as small as possible and therefore require that the heating water is at about 70°C to provide adequate heating in midwinter. There are no great losses in creating water this hot with a gas fired boiler but such temperatures would kill the performance of a heat pump.
It is possible to reduce the water temperature while maintaining room temperature with very large conventional radiators or fan assisted water radiators (sometimes called convectors) but to get good heating with much lower temperatures you need underfloor water pipes. These are quite a high added cost if put in when the house is built. Retrofitting them is a massive undertaking especially in a 150 year old cottage as I know only too well. For it to be practical to heat the room to 20°C with water at 35°C requires that the house insulation be pushed up a fair bit beyond what is normal in the UK (let alone what was normal in mid Victorian times) but it can be done. The system does however work advertised.
I have a 500 litre highly insulated buffer tank between the heat pump and the underfloor pipes. I can adjust the controls so that this is pumped up to 40°C on cheap off peak electricity which ends at 8pm and not have the heat pump turn on again until the water in the buffer drops to 35°C. At the ends of the heating season this provides me with a couple of hours extra hours of heating at off peak rates. A five degree drop in 500 litres is only about 3kWhr. I am tempted to experiment with phase change materials if is replaced 30% of the water in the buffer with these paraffin wax like materials I could increase the thermal storage to about 9kWhr and shift a lot more of my heating onto the night rate. Since I am paid about 50% more for the power I generate in my Photovoltaic system than I pay for off peak electricity it is very tempting.
Perhaps one of the reasons that heat pumps are less common in the UK is that we have little need of summer cooling (yet! give global warming a chance). In countries where there is a greater summer to winter temperature differential they are used for summer cooling by reversing the flow. The grants in the UK (I got about £1500 for mine) are contingent on them not being capable of operating in reverse mode. The justification being that the grant is to help reduce CO2 emissions and they do not want to encourage the spread of domestic air conditioning increasing the CO2 emissions.
Isn't the biggest reason that the coefficient of performance is about the same as the price difference between a kWh of gas and a kWh of electricity. For people with mains gas (most of the population) there is little point in using electricity to drive a heat pump when gas can deliver the same energy in a more convenient form with lower capital costs.
Yes Chris, there is no financial incentive in the UK to use a heat pumps just for heating if you have gas (I don't have it) but if we needed summer cooling then a heating system that provided winter heating at about the same running cost as a gas boiler but also provided cooling at lower running costs than a air sourced air conditioning unit would look more attractive. The capital cost of the heat pump would also look more attractive if you would be stacking it up against the combined cost of a boiler and an air conditioning system.
However if you are determined to heat your house at zero carbon dioxide load then a heat pump and either generating your own electricity or buying electricity on a 100% green tariff is a reasonable alternative. Building a passive solar house from scratch would be a better alternative in the long run but at a much higher capital cost.
Thank you. Very interesting.
I wish we had more access to heat pumps and heat pump technology in the UK.
It's an institutional issue rather than a technological one.
Thank you. Very informative.
One small quibble:
"Any advance in efficiency of air sourced heat pumps will be equally applicable to ground sourced ones and therefore this difference will remain."
IIRC, air heat pumps currently go to resistance heating at around 0C, so if one hits that temp often you start to draw a lot of power. If the power drawn by both becomes less, power costs become less important, the capital expenditure (capex) becomes more important, and the difference becomes more important.
As an illustration, let's invent some numbers. Let's say the ground source costs $10,000 to install and $1,000/year to run, and air costs $5,000 and $1,500. The $5,000 premium for ground source saves $500 per year, for a 10 year payback. If the power consumption of both were to fall by 33%, the power costs would go to $667 and $1000, and the $5,000 premium would only save $333, for a 15 year payback.
I just don't buy it, not for one nanosecond.
Weather patterns are huge, and can cover entire continents. You aren't going to tell me that the wind in the Eastern US (for example) isn't highly correlated. Sure, if we want to move a whole nation's worth of electricity from Alaska to Florida, then you might have a point, but this is where simple economics starts to rear its ugly head.
Even so, lets assume what you say is true, that a large country like the US is composed of several (lets say half a dozen) "wind regions" that are totally uncorrelated. Well then, if the wind turbines have average capacities around 30%, and each one spends about 1/4 of the time producing (effectively) no power, then on the whole, at any given time, there is about a 1/64 chance that at least half your capacity isn't working. Even if you have enough electrical transmission capacity to move around the remaining electricity, you aren't going to tell me that half the capacity being gone for 7 days out of every year isn't going to be a significant problem.
Demand side handling sounds great, until you go to flip on your lights and nothing happens. Sure, you can shift fridges and such a little bit (maybe 6-20 hours), but you aren't going to move it by a week, and as the denmark graph showed, there were whole weeks of effecitvely no power.
This ONLY works to the extent that you have (for instance) Aluminum smelters that can give everyone a week off of work when the wind doesn't blow. That's probably 10% of capacity, maybe a bit more, but without serious evidence, it's just not plausible that it's 50%.
Also notice that this is a hugely worse problem than the "always on" power generation problem. At least in the always on case you just make sure you have enough for peak loads, and if the load is lower than expected, then perhaps aluminum gets really cheap that year or somebody makes a whole tanker full of hydrogen, or worst case scenario, you just ground out the extra and write it off as a loss. It's far better to have too much than too little, is my point. Also, people's electrical demand is more reliable than the weather, so you're better off wiith one side constant and the variability coming from demand than you are with both sides varying, and the supply side having huge variance.
The wind in the Eastern US (for example) isn't highly correlated
There, I said It !
Fronts move through areas and peak wind at different locations at different times. Newfoundland winds are poorly correlated with Florida winds at any given time.
In addition, in southerly coastal areas, you has the "sea breeze" effect due to differences in solar heating (and radiational cooling) of land and water. Strong in South Texas as one example.
The Northern Hemisphere has a fixed heat differential that varies seasonally but the totality of wind for the Northern Hemisphere for a given week is basically constant.
The North American subset is also fairly steady.
Fortunately, the greatest North American wind resource is from Northern Manitoba to South Texas/NE Mexico. Within reach via HV DC lines of both coasts.
Best Hopes,
Alan
Yes, geographical diversity and DSM would only get you so far. You could also overbuild wind capacity, but you would probably need to have some backup capacity that would be used around 10% of the time. Of course, backup capacity can be pretty cheap when you don't use it a lot.
We could use gasified biomass: the biomass would provide storage. Biomass for liquid fuel is very, very inefficient, but for electrical generation it's very efficient. Right now it provides more generation in the US than wind.
You mean Norwegian hydropower
The nordic grid, page 2 is in english: http://www.svk.se/upload/3756/SVKK030121.pdf
"At the moment there are 150 coal fired power stations in planning in the the US for the next few years probably with an average rating at least 1GW."
The average rating is probably about 300MW. The recent article in the Christian Science Monitor projected 37.7 GW of coal from 2007-11. The Nuclear Energy Institute gives 142 plants, with a total capacity of 43 GW.
http://www.nei.org/documents/Energy%20Markets%20Report.pdf on page 8
Some of these plants could be cancelled, like the 5(?) TXU plants just cancelled a couple of weeks ago due to community & environmental resistance.
"solar has about a 10% load factor"
Where did you get this figure? I see a range of 12-25%, with a most common figure about 16%.
It's easy to get a handle on PV load factors by looking at the peak sun hours for a particular location. For example Dakar in Senegal receives between 5 (Aug) and 7 (Mar) PSH. This translates to 21-39% load factor, however the high temperatures bring that down by some 20% leaving us with a potential load factor of 17-23%. The useful energy will be further reduced by battery cycle efficiency if used, any dust that accumulates on the panels, a few % for cable losses etc. Nick's "most common figure of 16%" sounds reasonable for Senegal at least.
However in France (Lyon) for example with PSH of 1.25 (Dec) and 5.7 (Jul) the load factor will be ~40% lower and be lucky to average 10% over the year.
hhmmm.
First, you need to correct the Senegal range to 17-33, not 23. The midpoint of that range is 25.
My experience is for the US. It's interesting to be reminded of just how much better the solar resource is in the states, compared to Europe.
France is mostly above the 45th parallel, while in the US anything above the 45th parallel is considered one step from the arctic (or Canada....).
In the US, the expectation is that solar will be used first, and most in places like southern California, where 4 hours PSH (16.7% load factor) is common.
I have to say, it makes me admire the determination of Europeans to use solar, given how expensive it is there compared to fossil fuels (without accounting for externalities, of course).
I was talking about the UK where the insolation on 1m² of ideally angled surface varies from 1200kWhr per year in a tiny corner of the south west to 1000kWhr in the midlands to 900kWhr in the north west of England and much of Scotland. See here These correspond to 13.6% 11.4% and 10.2% load factors for panel rated, as they normally are, at 1kW/m². Since most photovoltaic capacity in the UK is, and is likely to remain, on building roofs fixed and not tracking, much of it at less than ideal angles, 10% is fairly optimistic for UK photovoltaic load factor.
My 2.7kW array is angled 40° east of south at an almost ideal inclination, unshadowed near the south coast of Britain and is thus at a better than average site. I have averaged 2385kWhr per year for the last three years which is almost exactly 10% load factor
As far as US planned coal powered plants are concerned, there is a American DOE database here that says there are 159 new coal fired plants planned or being built with a total capacity of 96GW an average of 0.6GW per plant. It gives this graph
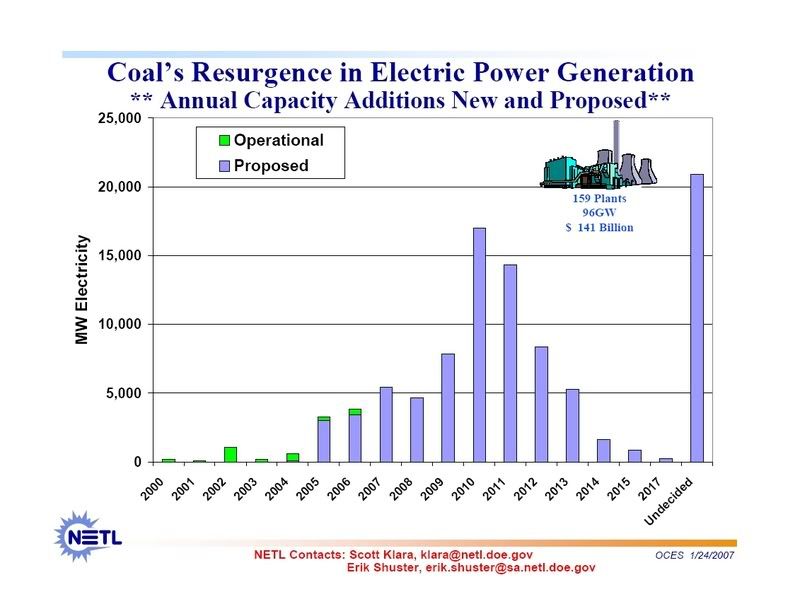
As they state and the data base shows
If Shaun's story is correct, and I talked to him and David Flemming about this when I met them recently and it seemed convincing, then we can hope for even more of this to be canceled.
Sorry the link to the map at the UK Solar Trade Association didn't work her is the map

Alaska has alot of undeveloped coal resources. There is a multi-billion barrel oil field - virgin. There are some TCF's of natural gas, in the ground, untapped, MCF's per day waiting to be had.
At Newcastle in Australia the problem is not that there is not enough coal, the problem is that the rail and port facilities are not large enough to meet demand.
The US coal prices have lowered in time, they are down off their peaks. There are alot of problems with logistics. It is difficult to put in new rail lines due to community complaints about traffic and noise, costs, etc. The Rocky Mountain coal was far from port. It was cheaper to bring Columbian coal by boat to port than western coal to port by rail. The Columbian coal fields were close to the coast.
When the US estimated that it had 250 years of coal left at then current mining rates, they were not at peak coal for sure. It is true many of the harder thicker coal seams are gone. There is alot of sub-bituminous stuff, lignite, and yet some bituminous coal remaining. There is yet coking coal in the world and coking coal contracts were down this year.
I think you are reading too much into this "peak uranium" and "peak coal" Energy Watch Group reports. They are not a prediction like King Hubert's was. They just analyse current reserves, and draw a possible production curve. That way we get at least a view of what current reserves are really worth in terms of quantity and time. Of course reserves (more of uranium than of coal) will grow in the future, but much of it won't be "easy" coal.
So although total coal tonnage peak will most probably be later than the estimate with current reserves, the world coal energy peak will probably be more similar to their 2025 estimate.
I don't see how writing a study that concludes 1: data very unreliable. 2: for current reserve estimates, a peak occurs in year X. is worse than just stating "uranium reserves will last thousands of years" or "world coal reserves will last 600 years" as Wikipedia states. I think that is irresponsible.
I generally agree with your analysis, but must stress that one of the key findings in this report is that coal reserves are not growing as might be expected but are actually dropping very significantly.
As an Australian, I have to agree with LevinK. It's far to early to make any meaningful prediction on a production peak here, because there are huge areas with promising geology which have never been properly surveyed due the existence of plentiful reserves in the current production fields.
Mining companies spend money to find the resources they will mine in 10 years time. They do not waste shareholders funds looking for new fields 100km further inland when the existing fields are projected to last another 50 years.
Take the state of Queensland as an example. Estimated coal resources are about 30 billion tonnes. Most of this in the Bowen Basin, which is 200km inland.
Queensland has an area of 1.8 million square kilometres. Do you think anyone would spend money to prospect for coal 500km inland when we expect the Bowen Basin to meet the industy's need for at least 20, probably 50 years?
So we have no idea how much coal we really have.
If we are to believe in things we cannot see or touch, how do we tell the true belief from the false belief?
Even if we do have enough coal to ramp up production, it is my understanding that we lack railroad capacity to transport the increased coal production. Thus, if we need a huge amount of coal for say, coal to liquid, we will first need to add additional railroad capacity. This adds another impediment to rapidly increasing production.
Also, exports have played only a minor role in coal production. Once there is clearly a worldwide shortage of coal, the export situation will become politically charged, the way it has with oil. Exports will go to favored trading partners, if any are available at all.
"Thus, if we need a huge amount of coal for say, coal to liquid, we will first need to add additional railroad capacity."
These plants would be close to the mines, and only the liquid would be transported any distance. In fact, one of the major recently announced CTL projects was proposed by a railroad for it's own use.
Certainly rail is a bottleneck, but it's a pretty temporary one. It's another classic problem of underinvestment, the kind that characterizes most situations of commodity scarcity.
The situation we have with oil is very unusual. That's part of the problem in getting people to accept peak oil.
Nick says
What I want to know is "Does this mean the railroading of America?" [Reagan's solution to Vietnam was 'Pave it!].
Usually they just add another track on existing right of way.
One thing to appreciate about CTL is that it needs a LOT of water, at best about one-to-one on a weight basis but usually much more. Ergo a coal from a mine in the desert might be profitably shipped to a CTL plant with water and a nearby market.
It is true that the current US rail system is close to capacity but that means more profits for the RR companies which sends a price signal to competitors to lay more track. Of course, new routes are easier said than done.
Gail the Acturary said:
Love your work,Gail.
However as an Australian I must point out that we will happily send our 200 million tonnes p/a of coal exports to the Japanese, or the Chinese, or anyone else with a dollar.
Anyone who really needs our product would be a favoured trading partner by definition. Coal is one of our biggest export earners. And if there is a worldwide shortage, we will probably be exporting 500 tonnes per year. We're building the extra railroads now to cope with increased demand from China for commodities.
If we are to believe in things we cannot see or touch, how do we tell the true belief from the false belief?
I think it is good in a perverse way that Peak Coal could occur within the lifetimes of people alive today. Hopefully we'll back off from frying the planet via CTL and allegedly 'capture ready' dirty coal plants since an end is in sight. I think some coal use for heavy industry will always be needed at a fraction of current levels which could conserve the resource for centuries.
Since coal is both a substitute and a complement for oil and gas its net demand is hard to predict. Taking the example of cement there will be less need to build large structures in a post PO economy. On the other hand more coal could be used in the manufacturing process in lieu of oil or gas firing.
The public might better see the need to replace fossil fuels if there was a Peak Trilogy, say Peak Oil 2010, Peak Gas 2015, Peak Coal 2050.
The longterm isn't the problem. Solar will be the dominant form of new generation in 20 years (or sooner), and be retiring fossil fuel plants in 30(or sooner), just as wind is the the dominant form of new generation in the US right now.
The problem is transportation fuels and GW, in the short term.
Are you retarded?!?!?
Tell me again how solar is going to replace 85 million barrels of oil equiv. in 20 years.
Use your brain moron...
Insults diminish your credibility.
They suggest that you 1)don't really know anything, 2) that you feel part of a group with common beliefs, and that you feel that your group is threatened by someone with different beliefs, and that 3) instead of using credible arguments you feel the need to intimidate your target into going away, to eliminate the threat to your group.
Don't forget: even in the unusual case (at TOD, at least) of interlopers who are trying to disrupt, the most effective response is to keep calm, and use the attack as a teaching opportunity. If you always respond with clearly useful information which fully addresses the criticism of the attacker, visitors to the blog, lurking and reading, will be informed. In some cases, even regulars will learn something.
So, in that vein, let me respond to what I think you may be asking:
1) Can solar supply all we need (is it scalable)?
Yes. The earth receives 100,000 terawatts continously from the sun, and humans use the equivalent of 4.5 terawatts on average.
2) Does it take up too much space?
In the US, rooftop space alone would be sufficient to replace all existing electrical generation, even at current PV efficiency.
3) Solar has been around the corner for decades. Is it really here?
Solar PV grew at a 25% annual rate from 1994 to 2000 (doubling twice), and a 40% annual rate from 2000 to 2006 (doubling three times), and the rate of growth is still accelerating (it’s constrained only by the speed manufacturers can ramp up). In 2005 about 1.7 gigawatts worldwide was installed. Solar is definitely here.
4) How will we afford to build enough solar collectors to run all our transportation?
Our energy economy is awfully large, and we currently invest hundreds of billions of dollars in it. That investment just needs to be redirected. Currently PV is labor intensive, and therefore somewhat more expensive than fossil fuels in most places, but that's changing fast - check out Nanosolar.com.
5)Why is PV expensive?
Solar costs are now around $.25/kwhr (for retail, rooftop PV). Given that solar competes with retail electric rates, this is actually competitive (meaning a payback of roughly 15 years or less) without subsidies in some places: So Cal and Japan in particular (though subsidies are phasing out in Japan, and growing in So Cal). Solar costs are dropping about 10% per year, which puts it at $.125/kwrh in 10 years, and $.06 in 20 (this is a cost-reduction path which is reasonably well accepted among experts in the area - actually, it may be much faster, with things like Nanosolar happening). Solar won’t catch up with wind anytime soon. Instead, in around 7-10 years solar is likely to catch up with where wind is now, which is to say that it will be a clearly up and coming large scale power source.
Demand has really gotten ahead of supply. PV supplies are expanding at about 40% per year, but they can't keep up with demand, especially in Germany. CA has increased subsidies, and France has raised the price they'll pay for PV power, but Germany is gradually reducing theirs. Lately supply seems to be catching up with demand, and prices started to fall in mid 2006.
PV suppliers can still charge a heckuva markup to ration their product, until supplies catch up in a year or two.
6) What about central thermal solar plants?
They are very promising. They're still more expensive than conventional plants, but they produce peak power, so they're competitive, and their cost is likely to fall reasonably quickly with scale.
This is getting awfully long. Have I answered your questions?
Nick, you handled that extremely well. We should all learn from your example!
Thanks!
Excellent Nick! On caveat.
This will work great as a grid replacement until it gets to be a sizable fraction of the grid (say 10%) , then it will need storage. (See Nick Rouse above.)
You should add that to your list of common concerns about solar.
That % would be much higher. See my post above about wind, except that solar is much better behaved than wind: it's very nicely correlated with demand, with rather less variance.
Winter is a problem in higher latitudes, no question. Solar will have to get pretty cheap up there. Those of us in lower latitudes should maximize it, and free up other resources for others.
Hello Nick. Good reply.
I am for increase in solar power, but my current understanding is not as optimistic as your (or conversely, mine is more pessimistic).
My further questions & comments would be:
I believe worldwide energy consumption is roughly on the scale of 15TW, of which c. 13TW comes from hydrocarbons and oil's part is c. 5.6TW.
Also, a direct comparison of energy flows (solar) to primary sources (oil) is not valid. Furthermore, one should look the comparison through total system efficiencies, incl. rough EROEI.
BTW, not all of 100 000 TW of solar is directly usable for humans even if we could harness it, at least not without consequences. Solar powers atmospheric cycles, thermohaline circulation, photosynthesis, etc.
Actually, I haven't seen an estimate of how much of 100 000 TW of solar flow could be theoretically usable by humans without impacting major bio-geo-cycles.
Do you think that solar could be a fast and scaling replacement for electricity generation from coal? Are there no constraints (materials availability, install speed, etc)?
That's probably only pv cell space? Not including all the rest of the supporting infrastructure (for real replacement it would also require storage, and storage is volumetrically fairly expensive compared to say, oil).
Coal accounts for roughly 37% of world electricity production, that is an installed capacity of roughly 1 200 GW in 2006 (estimate, EIA). Fortunately it wasn't all used at 100% utilization rate :)
Coal is projected to grow to 2000GW by 2030 (EIA).
That means that if solar grew at a yearly rate of 28% for the next 20 years, it would be able to come to c. 878GW of worldwide installed capacity.
In effect, we would be able to supplant the projected coal use INCREASE with solar, IF (and this is a big if) we could get solar to 1:1 point system efficiency with coal. Coal is a swing producer and the storage is in coal. Solar is a cyclical flow producer and the storage hasn't been solved to the same efficiency that you can get with coal (unfortunately). This means that the GW from solar and GW from coal are not comparable.
Maybe if we combined solar+hydro+biomass to complement each other, but I'm digressing....
We'd still be using more than twice as much coal than we would be solar, even in the best theoretical case (in which solar GW = coal GW).
The question I want to ask:
Do you still think solar can replace coal in the next 20 years?
Do you think we can solve the electricity storage challenge? Have you looked at physical limits of that problem? What is the highest theoretical solar-flow-to-electricity-storage efficiency we could achieve?
Now, don't get me wrong: I'm all for replacing coal with almost anything :)
And even if we can't replace coal and I seriously hope we can, we should build as much solar capacity as possible.
I'm not against solar.
However...
I think it needs to be considered as a tool in the energy mix. I think the current solar hype (not your post) is often out of control and thinks solar will cure all our energy ails.
My understanding is that we will need pretty much everything on the table, including nuclear (and probably also a lot of coal, although I hope not), solar, hydro and even some biomass - not to mention conservation, just to ease our transition off oil and gas. That alone will be a huge transition. It's a step downgrade to other available fuel sources (sans uranium) and even a bigger quality downgrade to various energy flows (hydro, solar).
cheers,
Samu
Statement of position: I'm not for coal. I think it is potentially dirty (think China's new 500-600 new coal plants), GHG output is horrible (CCS does not exist anywhere but on paper and may cut plant productivity 30%) and the reserve question is open (is there enough coal to grow according to all the projections).
"worldwide energy consumption is roughly on the scale of 15TW, "
hmmm. I'll have to rewrite that to clarify it.
"the equivalent of 4.5 terawatts" is accurate. You see, wind & solar put out electricity, which is equivalent to 3x as much BTU's. For instance, in the US 39 quadrillion BTU's are used to produce 13 "quads" of electricity.
"not all of 100 000 TW of solar is directly usable for humans "
I'm sure. I don't think we'll ever need more than .05% of it, at the absolute most.
"Do you think that solar could be a fast and scaling replacement for electricity generation from coal? Are there no constraints (materials availability, install speed, etc)?"
We can't count on it yet. I think wind is better for that. There's a good chance solar will be at that point in 5-10 years.
"for real replacement it would also require storage"
Both wind & solar have variance. That can be handled best by geographic diversity, Demand Side Management, and last by storage. The best storage will be PHEV's and EV's.
"That means that if solar grew at a yearly rate of 28% for the next 20 years, it would be able to come to c. 878GW of worldwide installed capacity."
OTOH, if it continues it's current growth rate of 40% (and there's every indication it will do that well or better), in 20 years it would be at 2TW new installations per year, and have an installed base of about 8TW, enough to handle 75% of current consumption, and 50% if consumption grows by 2% per year (the current rate).
more later...
Do the 3000 billion tonnes of coal off the coast of Norway discussed on TOD in January play the part of oil sands in this analogy with peak oil? That is, a vast resource that could only be extracted slowly in terms of percent of resource per year, even with massive investment, and only at lower EROEI and thus worse carbon dioxide emissions per unit of energy supplied to the end user.
Sunday March 25, 2207 I observed
aluminum coal hopper car parked a siding several hundred feet west of Rio Puerco, NM. Looks like they may to turn it over to unload it!
Something must have failed for the above car to be parked here. I inspected. Nothing obvious. One suspicious bearing.
I've been following coal transporation with more interest, expecially after my trips to the powder river basin.
And in my trips to Austin, TX.
I'm amazed at the amount of coal being converted to electricity [probably with great BTU loss] to cool the Barton Creek Square Mall. Other too.
Senior citizen believe that this use of coal energy maybe a waste. And may not last.
And your computer may not have electricty to run in the not too distant future.
This is senior citizen opinion.
click on the link for the powder river basin for some photos of the coal mines and machinery. those things are huge and the amount of fuel to run them must be huge.
Careful on that senior citizen opinion link above. Speaker and irritating MIDI music warning. Danger will Robinson danger. would be more fun. midi argggggg,
t
Quid Clarius Astris
Ubi Bene ibi patria
The surely use a huge ammount of diesel but the fossil energy they handle is much larger then their own fuel use.
In 1989 I sailed on a ULCC carrying 380,000 tons of crude oil from Kuwait to Rotterdam. It was a one month voyage around the Cape of Good Hope, because the ship drew too much loaded to traverse the Suez. About 1.5% of the energy value of the cargo was used to transport it.
I've often wondered how one mines coal reserves under the ocean bed. I'd love to see that mine.
I suspect that the removal of coal to the surface is the greatest barrier to the extraction of ALL coal deposits. Unlike oil which can be squeezed and pushed through relatively tiny blow holes, coal requires open pits or miners descending to great depths. Especially as we use the most available and easily extracted deposits.
I would be interested in estimates of EROEI of the remaining world reserves of Coal in a chart where X is the EROEI and Y is Tons.
Gary
In England they drove shafts vertically down to the coal at points where it lay under the land near the coast. Then they drove out tunnels, in some cases several miles, and mined out coal on either side of those main drifts, as I have written about in here . There is an article on sub marine mining mainly in Nova Scotia, and the practice has been going on, apparently in the UK since 1729 .
It seems unlikely to me that coal 3000 meters below the ocean surface will ever be economically exploited. However, in situ combustion of the coal may be an option in shallower locations. It might seem incredible, but burning coal underground it not at all hard to do. In fact it happens accidentally all the time:
http://en.wikipedia.org/wiki/Mine_fire
Whether this energy can be capture or not is an unanswered question. It really hasn't been tried yet on any scale. There were several in the 70's and 80's who believed in situ gasification would be cheaper and less environmentally damaging than mining.
http://adsabs.harvard.edu/abs/1975STIN...7625659C
http://www.nature.com/nature/journal/v316/n6025/abs/316244a0.html
Contamination of nearby water tables, however, could be an issue:
http://chemport.cas.org/cgi-bin/sdcgi?APP=ftslink&action=reflink&origin=...
When I first came to Wyoming in the late 70s, the original surface mining plans for Powder River Basin mines stated that the economic limit to digging the coal pits was around 200 feet. Some thirty years later the pits in the largest surface mines are down to near 500 feet with no let up in sight.
The original rail line built into the basin from the BN line running along the North Platte River was double track all the way to Gillette from near Guernsey, WY. Now the BN and Union Pacific have neared completion on a third track due to the increased volume of traffic. A small regional railroad is trying to get in on the act, too, by attempting to build new line from South Dakota and reconstructing lines running through SD and MN to ship more coal to the Midwest. The Feds turned down the company's guaranteed loan application about a month ago, but the project isn't dead yet.
Truck and shovel operations are now largely replaced by monstrous draglines. The amount of coal shipped last year exceeded 400 million tons. There's still a lot of coal in the Powder River Basin but the coal in the basin dips westward toward the Big Horn Mountains and at some point ( pick a depth) it will be uneconomical to mine. It will be interesting to see how EROEI plays out with these enormous beds of coal. Most of the original plans approved by OSM and the state of Wyoming DEQ were for a mine life of around 30 years so by my reckoning, the original mine lives of many of the largest like Black Thunder and Belle Ayre are in the last third of their economic lives. As the companies mine deeper, again, who knows how much longer these mines will continue but my guess is that the mine lives will exceed 30 years.
Don't forget about the natural gas made explosives [orange cloud] required.
regards from senior citizen.
Hmmm......so now we get one of those nifty colorful charts for coal that looks, hey!, pretty much like those nifty colorful charts by ASPO for oil....because we all know that nifty colorful charts can never be wrong....well, not exactly wrong, as we have found out with the ASPO charts, they just kind of need constant "amending"....so that over time, what would have been the picture of the back side depletion and oil production is far different than the world would have looked only a few years ago in say 2030, depending on which version of the chart you go buy....to paraphrase, a few billion barrels here, a few billion barrels there, and pretty soon, you could be talking about some real fuel....
But back to peak coal, or uranium, or natural gas, or bauxite, or copper, or potash, or....??
I am starting to get a bit nervous here folks....this is starting to have a bit of a smell to it....
In the old days it used to be called a panic, or a "bubble" or a "mania". One finally has to kick the old common sense back into gear and ask, "Does it really make sense that almost every commodity would peak, all at once??
Notice this with oil.....just as North Sea and Mexican peaked, well, low and behold, the stories started coming out....Saudi has peaked (!), Kuwait has peaked (!), Oman, Qatar, Bahrain, Africa, the rest of Latin America (!)
We now have a situation where oil known to be in the ground or under the sea is peaked even before it extracted, and coal and gas, in many cases in which the earth has not even been touched above it, all peaked (!)
What no one mentions is that there are many cases in which, due to environmental, economic and geopolitical reasons, the firms doing the actual extracting of commodities are holding off investment and working what they already have until a better price comes along.
We may be getting close to full "capitulation". That is the moment when it will be almost impossible to find anyone, anywhere, who does not believe in peak whatever and everything, and NOW.
And who knows, they may be right. But as for me, I sure as helll don't want all my eggs in the commodity basket on that day.
Roger Conner Jr.
Remember, we are only one cubic mile from freedom
Roger: From your post it sounds like you are only communicating with TOD crowd. Talk to friends, family, neighbours, realtors, financial advisors. I would be surprised if less than 19 in 20 think all this talk of peak ANYTHING is total crap.
BrainT
There is truth in what you say, but folks out there in chase the bubble land are absolutely COMMODITY NUTS! :-O
I talked to a broker the other day, YES! Buy gold, buy silver, buy copper, buy moly bedia whatever, (it's a mineral ain't....that's good enough, buy it!
The Chinese are going to be consuming everything! The Indians, consuming everything! It's a straight line up from here folks! Be at the front of the wave!
Of course, what they don't seem to realize is if they are buying commodities now, they are already at the back of the wave....that train left the station about a third to a half decade ago!
Most people don't understand "peak" anything, but they do think they can make a fast buck by chasing the latest train....they think they can catch it....
Interestingly, their logic never follows through.....they see all these minerals and fuels being consumed, so BUY, but if you ask many of them about the stock markets, they shake their head....I don't know, that's kinda' old hat....the commodities will beat them, stocks are dead, or at least the slow way to go....but wait....what are all these commodities going to be used for then? What is going to get built that requires mountains of steel, aluminium, tin, copper, gas, propane, coal and oil? Does this sound like an economy going to helll in a handbasket?
It has all the markings of the 1970's all over again, the commodities will sell, but the cars, houses, electronics, etc., that they are used to build won't?
We'll see, but again, I am not that hot on many of the commodities being touted as the "newest" hot investment,,,,many of which are at or near all time historic peak price,
Call me a doomer.
RC
Remember, we are only one cubic mile from freedom
Roger,
I've read plenty of commentary saying that commodity prices are displaying bubble behaviour. And I've read other commentary saying that the industrialisation of China represents a historic change to the fundementals.
If you spend a lot of time looking at historic price graphs, you would conclude there is a bubble. However these charts are probably in US dollars - and how has the US dollar done in recent years? What has the real rate of inflation been since 2002?
My take would be that it is all about China. If China falls in a heap, the price of everything they demand will collapse, and those who called it a bubble will be vindicated.
If China successfully makes the economic transition that Japan and South Korea have already made, then all your historic charts are worthless.
Your point about raw materials needing an end market in the form of cars, electronics etc is a crucial one. However, much of the activity in China is not market-driven. They are building a whole string of new cities because the central goverment wants to build them, and that uses a lot of steel and copper.
The key question is, I think, how much of the rise of China depends on selling things to the US (not a business with a bright future) and how much is simply the central commitee building new cities by fiat? Can they sustain development if the US economy falters?
And for readers of the Oil Drum, the big question will be, can China obtain enough energy to keep growing? Can they strongarm enough oil, burn enough coal, build enough CTL plants(which they will certainly do on a big scale, regardless of the enviromental issues)?
It could go either way, but my feeling is that they will do whatever it takes. They are not a democracy, they are not environmentalists, they are not admirers of the free market,and failure is not an option.
If we are to believe in things we cannot see or touch, how do we tell the true belief from the false belief?
It is entirely credible that just about everything is peaking around the same time. We have been living during a period of exponential growth, the rate we are consuming all/any of our resources at can only double so many times.
This of course also applies to environmental sinks too!
People have been talking seriously about coal's problems for a decade but usage keeps climbing, even in Europe the self appointed climate guardian. Therefore I think if anything will partially save us it is the physical fact of declining EROEI. Think of a dog on a chain..we'll run until we are stopped.
Next year Beijing will shut down coal plants to temporarily clear the air. Once the Olympics are over I presume they will be turned back on. Meanwhile Al Gore recites the clean coal myth. I see no coal slowdown for at least another decade.
We saw a big reduction in "proven reserves" over the last few years for the oil and gas production companies just because of tighter financial reporting requirements.
One wonders if coal "proven reserves" have been subjected to the same accounting review and downward pressure? The Securities and Exchange Commission may be a big driver here.
As someone above alluded to, opening and closing of mines is part of a complex decision process where one balances coal end use locations, sulfur removal technology, and transport bottlenecks and costs. The US rail system is close to fully utilized so that moving low sulfur Powder River Basin coal to Texas, for example, may be restrained by rail links.
Using local higher sulfur coal and spending more on flue gas cleanup might make sense. Remember that TXU was going to build 11 coal plants - 8 using Powder River coal and 3 using Texas lignite.
I too am skeptical of "peak coal" being a 21st century problem but I'm willing to see more (and better) research. Let's hope the USGS does a better job on coal then they did on oil and gas estimates.
I'm a geologist in western Canada. I'm puzzled by some of the comments in the original article.
Coal resources have been barely scratched. Western Canada, alone, has reserves that could supply world demand for centuries....as do other huge coal bearng formations around the world. The issue is not potential supply but cost of development (cost in both dollars and in impact on the environment).
One of the negative consequences of more expensive oil is more use of coal. Probably over half of the world's electricity is generated via coal fored plants and this will increase dramatically over the next couple decades.
The discussion of clean coal burning technology is not as trendy as solar, wind power, etc. Unfortunately many concerned environmentalists don't recognize that a billion dollars invested in cleaner coal has multiple times more positive impact as that in alternative energy. Coal is the energy of the future whether it be electrification or liquid conversion. It's happening regardless of anything the western world wants or doesn't want. It's a steam roller that's unstoppable in India, China, etc. and we'd better get into high gear in cleaning up the technology.
Hi Jellyologist. You may well be interested to take a look at Annex 4 of the final report (link now given above), which deals exclusively with Canada's coal position. That's not to say that it will change your mind on anything that you've said, but you may well find it interesting. I certainly agree that cleaning up coal technology is urgent and crucial, but of course the energy cost of doing so will exacerbate any coal supply problems that may exist.
It is interesting the Illinois has one of the most inflated coal reserve estimates. Barak Obama gets money from the coal industry so his Coal-to-Liquids Fuel Promotion Act of 2006 idea seems DOA.
Peak coal by 2025 say researchers
http://www.energybulletin.net/28287.html