| Why wind needs feed-in tariffs (and why it is not the enemy of nuclear) | The Oil Drum: Europe | Cassandra's curse: how "The Limits to Growth" was demonized |
USA Grain Exports - Where to, how much?
Posted by Doug Low on March 5, 2008 - 10:59am in The Oil Drum: Europe
This post looks at the role the USA plays in global grain (wheat, corn, sorghum) and soybean (soya bean) trade, since the USA is to a large extent the world's breadbasket and there are concerns over this role in the light of the current corn-to-ethanol expansion. The article begins by looking, very briefly, at how similar concerns were raised about 20 years ago, due to the potential effects of global warming on US grain production.
In 1990, Martin Parry published the book Climate Change and World Agriculture. Table 1.2 from the book gives an excellent summary of the major role the USA played in cereal exports in 1988:
| USA | 98 | Thailand | 6 |
| France | 27 | Denmark | 2 |
| Canada | 23 | United Kingdom | 1 |
| Australia | 15 | SouthAfrica | 1 |
| Argentina | 10 | New Zealand | - |
The data is best described by Parry:
In 1988 three countries accounted for 80 percent of all traded cereals (USA, Canada and France), with over one-half exported by the USA alone (including well over a half of the world's traded maize and three-quarters of its soya beans).
The main concern back in 1991, and the gist of Parry's book, was that climate change in the long-term could alter global crop-growing patters, potentially with negative consequences. One of the many papers that Parry references is: Smith, J.B., and Tirpak, D., The Potential Effects of Global Climate Change on the United States, Report to Congress (Washington DC: US EPA 1989). A summary is given in Adams, R.M. (and 9 others), "Global climate change and US Agriculture", Nature, vol. 345:219-224 (1990).
It was this paper, rather than Parry's book, that discussed in some detail what climate change might do to the USA's ability to grow, and therefore export, cereals. This paper, plus data from the UN Food and Agricluture Organisation, showed that:
- The USA exported grains to over 100 countries.
- Climate models were suggesting that a few decades from now, the USA grain-growing regions would become hotter and drier.
The implications of a hotter, drier USA were that it might be exporting considerably less grains in future, and in the worst-case scenario, none at all. The USA suffered severe summer droughts in 1987 and 1988, and climate models were indicating that these hot, dry summers that were rare events then (especially two years in a row) would become the norm in the future. Parry described the effects of the two droughts on wheat stocks:
In addition, it should be noted how sensitive world food security remains to variations of weather. In a good year world food production now exceeds demand by about 20 per cent, but a relatively short run of poor years can eliminate this excess supply. To illustrate, in 1987/88 world wheat and coarse grain stocks [maize/corn, sorghum and barley] stood at 353 million tonnes (mt), the equivalent of about 78 days supply, but fell to 248 mt (54 days) in 1988/89 largely as a result of the 1988 drought and heatwave in the US Corn Belt and Great Plains. Stocks of wheat in the USA alone fell from 49 million tonnes in 1986/87 to 34 in 1987/88 and to 17 in 1988/89. What happens to food stocks in North America thus also affects world food stocks and prices.
So 20 years ago, the USA was responsible for over 50% of the global grain trade. The rest of the post concentrates on the here and now, and there will be no more discussion of climate change.
WHEAT
The US Dept of Agriculture provides three useful summaries of the wheat trade. Wheat - Overview and Features
The United States is a major wheat-producing country, with output typically exceeded only by China, the European Union, and, sometimes, India. During the early 2000s, wheat ranked third among U.S. field crops in both planted acreage and gross farm receipts, behind corn and soybeans. Presently, almost half of the U.S. wheat crop is exported.
The U.S. wheat sector enters the 21st century facing many challenges, despite a strong domestic market for wheat products. U.S. wheat harvested area has dropped off 28 million acres, or nearly one-third from its peak in 1981, because of declining returns compared with other crops and alternative options under government programs. Despite rising global wheat trade, U.S. share of the world market has eroded in the past two decades.
Wheat: Background and Wheat: Trade. Some of the introductory in this latter text is quaint/dated, in as much as wheat prices are reaching record prices but the text states: "The diversity of exporting countries provides significant stability to world wheat trade and prices". It did, until a year or so ago.
Since 1975/76 (the international trade year is July-June), U.S. wheat exports have fluctuated sharply, reaching a high of over 48 million metric tons in 1981/82 and dropping to less than 23 million in 2002/03. In 1981, the U.S. share of global exports peaked at about 45 percent. Over the last 10 years, U.S. wheat exports have exceeded 30 million metric tons only twice, and the U.S. share of global exports has fluctuated between 25 and 30 percent since 1990. Increased planting flexibility in U.S. farm legislation and low returns relative to some competing crops has led to a decline in U.S. wheat area, limiting export potential.
... The United States is the world's leading wheat exporter. In most years, the United States, Canada, Australia, the EU-25, and Argentina account for about 80 percent of world wheat exports.
... While wheat exports are dominated by a handful of nations, many countries import large amounts of wheat. While the EU-25, Japan, and South Korea are among the largest wheat importers, most imports are by developing countries with limited production potential. Population growth in Egypt, Brazil, Algeria, Indonesia, Iraq, Nigeria, Mexico, and other developing countries importing smaller amounts of wheat will be crucial to future expansion of world wheat trade.
The USDA table World wheat supply and disappearance shows that the area planted with wheat globally has been relatively static for the last 20 years, in the range 212-231 M hectares.
For USA planted acreage, production, yield per acre and weighted-average farm price, see Summary (2004/5-2007/8) and Full Data (1866/67-2007/8). The full data set shows that the area planted under wheat in the USA is now about two thirds what it was in the early 1980s, but has been stable at about 60 M hectrares for the last seven years.
This USDA table, World and U.S. wheat production, exports, and ending stocks (units - bushels), compares US wheat production, exports, and ending stocks with world totals, 1988-2007. There is no clear long-term trend in wheat production, globally or in the USA. World wheat stocks peaked in 1999 and have been falling gradually since then, to about half their 1999 value in 2007. US wheat stocks peaked in 1998 at 949.751 M bushels, falling to 271.867 M bushels in 2007. This fall in stocks is the number one driver of increasing wheat prices.
In 2007, the USA produced 9.32% of global wheat supplies, was responsible for 30.69% of global wheat exports, but had only 6.74% of global wheat stocks.
A comparison of the world's top 15 producers and consumers of wheat is available from the USDA Foreign Agricultural Service (In the 'Reports' box, select 'Grains and Pulses', then 'World Wheat Production, Consumption, and Stocks'. Units - metric tons). Wheat production for the USA increased from 49.3 M tons in the 2006/07 marketing year to about 56 M tons for 2007/08, and globally from 593.2 M tons in 2006/07 to 604 M tons in 2007/08. The table also shows global wheat consumption climbing to just under 620 M tons for the current marketing year, 2007/08. Note the table at the bottom 'Ending Stocks' (in metric tons) which also shows the big drop in global wheat stocks over the last two years.
Wheat exports for 2007/08 (July - June) can be found at the USDA Foreign Agricultural Service (In the 'Reports' box, select 'Grains and Pulses', then 'World Wheat, Flour, and Products Trade'). Global exports of wheat are expected to fall from 115 M tons last season to about 108 M tons this season (2007/08), but increase in the USA, from 25 M tons last season to 33 M tons this season.
For the last 4 years, the two biggest producers of wheat have been China and India, China a small net exporter, India a net importer. One of the biggest importers is Egypt, which imports almost half its wheat requirements.
This USDA table, U.S. wheat exports by selected destinations, shows the destination for US wheat exports, 2000-2008 (note that the 'market' year is June-May). US wheat exports are dominated by Sub-Saharan Africa, Japan, Mexico, Egypt, the EU and more recently, Iraq. A full list of US wheat export destination countries, 1989-2008 available here. The list is extensive.
Updates on global wheat production are available from the USDA monthly publication Grain: World Markets and Trade (Note: PDF, about 1.6 Mb). The February issue shows where global wheat stocks are currently headed:
Related articles
Wheat prices in biggest one-day rise (Financial Times, Mon 25 Feb)
Demand for wheat puts India at risk (Financial Times, Sun 24 Feb)
In Price and Supply, Wheat Is the Unstable Staple (NY Times, Wed 13 Feb)
Wheat soars as stocks decline (Financial Times, Sat 09 Feb)
CORN
Although many countries produce corn (maize), two are way ahead of all the others, the USA and China, with the USA producing twice as much as China during 2005/6. But in terms of global exports, the USA is THE leader, being responsible for about two thirds of global corn exports. An excellent summary is available at the US Grains Council website.
Corn is the United States' largest crop, in terms of both volume and value... The United States grew 42 percent of the world's corn in during 2005/6, producing 282.3 million metric tons (11.1 billion bushels). Other major corn producing countries in 2006 included:
- China -139.4 million metric tons (5.5 billion bushels)
- Brazil - 41.7 million metric tons (1.64 billion bushels)
- European Union - 48.3 million metric tons (1.9 billion bushels)
- Mexico - 19.5 million metric tons (767 million bushels)
- Argentina - 15.8 million metric tons (622 million bushels)
- India - 15 million metric tons (590.5 million bushels)
The United States is not only the world's top corn producer, but also the top exporter. On average, about 20 percent of U.S. corn is exported. During fiscal year 2006 (October-September), the United States exported 56 million metric tons (2.2 billion bushels) - accounting for 68 percent of world corn exports. During the same period, other major corn exporters included Argentina (10.7 million metric tons, or 421 million bushels) and China (3.7 million metric tons, or 145 million bushels).
Japan is the largest and most consistent importer of corn in the world. The United States satisfies nearly all of Japan's demand. During fiscal year 2006, Japan imported 16.5 million metric tons (649 million bushels) of U.S. corn.
Mexico, Taiwan, Canada, Egypt and Colombia are also major corn importers and important markets for the United States.
The US Dept of Agriculture also has a good summary, reviewing global imports and exports of corn 1960-present, Corn: Trade
For detailed information on planted acreage, production, yield per acre and weighted-average farm price in the US, 2000-2007, see USDA. Feed Grains Database: Yearbook Tables. This shows a massive growth in acreage planted with corn in 2007.
A complete list of the main consumers and producers of corn at the country level can be found at USDA Foreign Agricultural Service (Select 'Grains and Pulses', then 'World Corn Production, Consumption, and Stocks'). Global corn production was 704 M tons for the 2006/07 marketing year, and 766 M tons for 2007/08. The massive growth in global corn production for the current marketing year came from just one country -the USA. Note that US corn production jumps by about 64 M tons for 2007/08, but US consumption rises by only 35 M tons (corn-to-ethanol). Exports increase by about 8 M tons (USDA Foreign Agricultural Service (Select 'Grains and Pulses', then 'World Corn Trade'), from 54.1 M tons to about 62 M tons.
This USDA table, U.S. corn and sorghum exports by selected destinations, shows the destination for US corn exports, 2000-2006. US corn exports are dominated by Japan, Mexico, Taiwan, South Korea, Egypt, Columbia, Canada, Syria and Dominican Republic (all over 1 M metric tons in 2006).
SOYBEAN (SOYA BEAN)
The US Dept of Agriculture provides three useful summaries of the soybean trade. Soybeans and Oil Crops
Processed soybeans are the largest source of protein feed and vegetable oil in the world. The United States is the world's leading soybean producer and exporter. Farm value of U.S. soybean production in 2003/04 was $18.0 billion, the second-highest value among U.S.-produced crops, trailing only corn. Soybean and soybean product exports accounted for 43 percent of U.S. soybean production in 2003. Soybeans equal about 90 percent of U.S. total oilseed production, while other oilseeds—such as cottonseed, sunflowerseed, and peanuts—account for the remainder.
Soybeans and Oil Crops: Background and Soybeans and Oil Crops: Trade.
Despite substantial growth in oilseed and oilseed product output in the past 25 years and recent gains in export volume, the U.S. share of global exports has steadily diminished. In the mid- to late 1970s, the United States dominated world trade in unprocessed oilseeds, with a global market share of more than 70 percent. Recently, this figure has fallen below 50 percent. From a smaller percentage base, the United States has seen its share of oilseed meal and vegetable oil exports decline even more sharply, particularly before 1990.
Why the decline in the U.S. share of global exports? A key development has been the phenomenal growth of foreign soybean output and exports, particularly by Brazil and Argentina. Foreign soybean output now exceeds that of the United States, and Brazil and Argentina currently share approximately half of the soybean export market, up from less than 15 percent before 1980. With increased foreign production, and more rapid expansion of trade in soy products than whole beans, Brazil and Argentina have each surpassed the United States in soy meal and soy oil exports. Another factor is the recent expansion of U.S. meat exports, which stimulates domestic meal use rather than contributing to exports of soybeans or soybean meal. Brazilian and Argentine soybean and meal exports are projected to continue capturing market share from the United States in the next decade.
For detailed information on planted acreage, production and yield per acre, 1960-2006, see US Dept of Agriculture datasets (Excel file).
A complete list of the main consumers, producers and exporters of soybean at the country level can be found at USDA Foreign Agricultural Service (Select 'Oilseeds', then 'Table 07: Soybeans: World Supply and Distribution'). This shows that although the USA was still the number one producer of soybeen for 2007/08, production fell considerably, from 86.8 M tons over 2006/07 to 70.4 M tons for 2007/08. Global production fell correspondingly by 15.2 M tons. US exports fell by only 3.3 M tons (the difference made up by stocks) while global exports increased by about 4.6 M tons, the increase coming mainly from Brazil. The report USDA Foreign Agricultural Service, Select 'Oilseeds', then "Table 21: United States Soybeans and Products Supply and Distribution Local Marketing Years", shows that the fall in US soybean production was mainly due to a big fall in the area harvested between 2006/07 and 2007/08. In other words, there was a big switch from growing soybean to corn in 2007.
A more detailed summary of soybean exports and imports is available from USDA Foreign Agricultural Service (Select 'Oilseeds', then 'Table 10: Soybeans and Products: World Trade').
SORGHUM
Sorghum is a grain that most of us are probably not very familiar with, and may therefore seem like a strange addition to this post, except that, as the US Grains Council points out, the USA is THE global supplier of sorghum, providing 89% of exports 2005/6:
The United States is currently positioned as the number two producer and number one exporter of sorghum on the world market. The United States' share of world trade in sorghum has not dropped below 70 percent in more than a decade. World trade in sorghum is dominated by U.S. exports to Mexico. Other importing countries and regions include Japan, Israel, South Africa, Spain, Morocco, Eritrea and Others.
For detailed information on planted acreage, production, yield per acre and weighted-average farm price in the US, 2000-2007, see US Dept of Agriculture datasets.
A complete list of the main consumers and producers of sorghum at the country level can be found at USDA Foreign Agricultural Service (Select 'Grains and Pulses', then 'World Sorghum Production, Consumption, and Stocks'). Global sorghum production was 57.8 M tons for the 2006/07 marketing year, and 64.6 M tons for 2007/08. The massive growth in global sorghum production for the current marketing year came from just one country -the USA. US sorghum production jumped from 7.1 M tons in 2006/07 to 12.8 M tons in 2007/08. In the 2007/08 trade year, US exports were / will be 7.0 M tons, versus a world total of about 8.2 M tons (See USDA Foreign Agricultural Service (Select 'Grains and Pulses', then 'World Sorghum Trade').
This USDA table, U.S. corn and sorghum exports by selected destinations, shows the destination for US sorghum exports, 2000-2006. US sorghum exports are dominated by Mexico, the EU, Japan and Sub-Saharan Africa.
RELATED ARTICLES - GENERAL
Accessing FT articles. The Financial Times allows non-registered users of their website to access 5 articles per month free of charge, registered users 30 articles per month, and fee-paying subscribers unlimited access to general articles.
Feed the world? We are fighting a losing battle, UN admits (The Guardian, Tue 26 Feb)
Food and the spectre of Malthus (Financial Times, Tue 26 Feb)
Manila Rice Plea a Wake-Up Call for a Hungry World (Planet Ark [Reuters], Mon 25 Feb)
US Farmers Rush To Grains, Avoid Sugar, Cotton (Planet Ark [Reuters], Mon 25 Feb)
Demand for biodiesel fuels palm oil price (Financial Times, Mon 25 Feb)
High food prices may force aid rationing (Financial Times, Sun 24 Feb)
Cost of a cuppa and beer to soar (The Telegraph, Wed 20 Feb)
Why the price of 'peak oil' is famine (The Telegraph, Thu 07 Feb)
Wheat and soyabeans [and rice] hit record levels (Financial Times, Wed 06 Feb)
Europe rule change fails to lift harvest (Financial Times, Mon 14 Jan)
Apocalyptic vision of a post-fossil fuel world (The Telegraph, 22 Nov 2007).
Why are food prices rising? (Financial Times, 20 Nov 2007). "Our multimedia feature explores the factors that contribute to food price inflation."
The Future of Biofuels: A Global Perspective (Amber Waves (USDA), Nov 2007)
U.S. Ethanol Expansion Driving Changes Throughout the Agricultural Sector (Amber Waves (USDA), Sept 2007)
The End of Cheap Food? (Oil Depletion Analysis Centre, 28 June 2007)
USEFUL DATASETS
US Dept of Agriculture. Production, Supply and Distribution Online This webpage contains the most complete and easy-to-read set of data available on production, exports, imports and stocks, for grains and other agricultural products, for the USA, globally and individual countries. But you can only access the tables from this page, not directly, as the data tabelsd are built up dynamically. See the 'Reports' box.
US Dept of Agriculture. Feed Grains Database: Yearbook Tables
US Dept of Agriculture. Feed Grains Database: Standard Tables - Frequently Requested Data
US Dept of Agriculture. Wheat Data : Yearbook Tables
Top 10 U.S. export markets for wheat, corn, soybeans, and cotton, by volume (2006-2007) (Excel spreadsheet)
USEFUL PUBLICATIONS
US Dept of Agriculture. World Agricultural Production (PDF, about 1.0 Mb. Updated monthly.)
US Dept of Agriculture. Grain: World Markets and Trade (PDF, about 1.6 Mb. Updated monthly.)
US Dept of Agriculture. Grains: World Markets and Trade Archives
US Dept of Agriculture. Oilseeds: World Market and Trade Archives
Personnel
Editors
Contributors
Peak Oil Primers
Archives
- November 2010 (3)
- October 2010 (6)
- September 2010 (4)
- August 2010 (7)
- July 2010 (6)
- June 2010 (7)
- May 2010 (2)
- April 2010 (8)
- March 2010 (4)
- February 2010 (6)
- January 2010 (3)
- December 2009 (5)
- November 2009 (8)
- October 2009 (12)
- September 2009 (6)
- August 2009 (5)
- July 2009 (11)
- June 2009 (8)
- May 2009 (16)
- April 2009 (10)
- March 2009 (7)
- February 2009 (10)
- January 2009 (15)
- December 2008 (9)
- November 2008 (9)
- October 2008 (9)
- September 2008 (13)
- August 2008 (10)
- July 2008 (14)
- June 2008 (23)
- May 2008 (16)
- April 2008 (12)
- March 2008 (16)
- February 2008 (9)
- January 2008 (13)
- December 2007 (13)
- November 2007 (16)
- October 2007 (22)
- September 2007 (8)
- August 2007 (9)
- July 2007 (16)
- June 2007 (8)
- May 2007 (7)
- April 2007 (7)
- March 2007 (10)
- February 2007 (10)
- January 2007 (12)
- December 2006 (9)
- November 2006 (15)
- October 2006 (4)
- September 2006 (5)
- August 2006 (5)
- July 2006 (9)
- June 2006 (5)
- May 2006 (10)
- April 2006 (9)
- March 2006 (13)
Vital Trivia
License

This work is licensed under a Creative Commons Attribution-Share Alike 3.0 United States License.
I wonder how much our food exports play into our political power. For example Egypt seems pretty much at the mercy of the US.
Also for people worried about the US running out of basic grains. Certainly you could have shortages because of transport issues and problems. But considering how wasteful the US diet is and how much we produce and for that matter Canada I can't see basic food supplies becoming a issue in the US anytime soon. Expensive probably but supply is more than adequate from this report.
However if you consider the Export Land model with the US in this case being in the drivers seat if we do start having problems from global warming I think we will see food exports follow the same export land model that has been developed for oil. Especially of course if you throw in biofuel production.
Thus Export Land coupled with global warming and biofuel growth does not bode well for the future of grain exports.
This is more bad news for the US. OPEC assholes don't care about feeding billions of poor people, 'Let kind-hearted Americans feed them, they are ridiculously fat and have too much money!'.
Price of oil, and therefore food will stay sky-high. The US will get the blame no matter what.
This is how the world works.
Let Saudi Arabia, Russia and China feed them.
(Now imagine Putin, Hu Jintao, and King Abdullah :D)
"If they would ..die, they had better do it, and decrease the surplus population. ... It's enough for a man to understand his own business, and not to interfere with other people's. Mine occupies me constantly. Good afternoon, gentlemen!"
Stop the cycles of dependency.
But why worry?
History has shown that the people America has kept from starving seem to have such short memories!
Well, aren't you Americans just the saviours of the world...
Ne'er do wrong...
Hans, it's a post that can best be ignored. There's an old story about an exchange between a KGB and a CIA guy. The KGB guy says to the CIA guy: you know, you Americans are much better at propaganda than we are -- the problem is, you believe your own propaganda. No one believes ours, including us.
Wow - this is a lot to digest - thanks.
The effect of exporting grain at low prices over the last couple of decades has had a devastating effect on the the rural economy of much of Africa. Higher world grain prices could have a beneficial effect on some of the world's poorest people.
But only if they can rebuild links to markets. This involves transportation drying and storing grain etc.
Also the large cities are not a good target for small farmers trying to sell produce.
Hello Doug Low,
Well done keypost--kudos! Any country exporting grains is basically exporting their natural resources of heavily energy-embedded water [think aquifer pumping], topsoil, and NPK far in excess of the natural renewable rate, plus getting the sediment and anoxic pollution of their rivers, deltas, and harbors, which degrades fish stocks.
In the olden days: guano and human bones were shipped trans-oceanic distances to replenish soil nutrition, plus wars fought for these resources. Today, industrial NPK fills this need, but prices track FF increases-- reducing P & K boulders to powder will never be energetically cheap or easy; same with Haber-Bosch N from natgas inputs. Now add both FF and P & K depletion to this climate change scenario--> it should be abundantly clear to all that we need Peak Outreach to drive drastic mitigative change, but instead, we get BAU. This does not bode well because the default choice then becomes a Malthusian future and grinding catabolic collapse.
Bob Shaw in Phx,Az Are Humans Smarter than Yeast?
Current World Fertilizer Trends and Outlook to 2011/2012
ftp://ftp.fao.org/agl/agll/docs/cwfto11.pdf
57 page PDF news report from FAO's "World Food Situation". This seems like a good report considering your interest in fertilizers.
http://www.fao.org/newsroom/en/news/2008/1000792/index.html
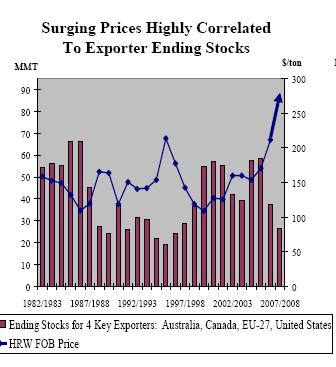
Doug - a fantastic reference resource on US and global food supplies. I have a couple of questions about the one chart you plot:
1. The 1977 to 1998 cycle of stocks and price are clearly inversely correlated. Do you know what caused the mid 90s stock low and price high?
2. There is no correlation since 1998 - prices started rising since around 1998 whilst stocks were also rising, before starting to fall these last 3 years - and prices continued to rise.
There seems to be other forces at work here. Rising FF energy prices may be one, which have risen steadily since 1998, and now we are seeing supply demand imbalance.
What is this chart plotting - wheat ending stocks?
Do you know what caused the mid 90s stock low and price high?
China was buying a lot of grain during 1995-96. It was mentioned quite often on the farm report of the local news.
Hello Euan,
The post avoids any serious analysis because I do not have that level of expertise, so I cannot answer your very good question.
However, last night the BBC 10 pm news repeated its mantra that there are three main reasons why wheat prices have gone thro the roof. Cereals-to-biofuels in the USA, demand from China and the weather. From what I can tell the first two are myths, the latter is correct.
The USA does not use wheat for biofuels, and last year, in the USA, the total area planted with wheat, total wheat production and total wheat exportsd all increased compared to 2006. Europe does use, or in the case of the UK, plans to use, wheat for biofuels but I think this is still in its infancy.
China's population and wheat production/consumption have been increasing for a long time, but they play no role in last year's explosive increase in wheat prices. China's production has increased by 20 M tons / year 2003-2007 inclusive, while consumption has dropped slightly. I am not sure why it has remained a minor exporter all this time (not a major importer in 2003 for example), maybe it was withdrawing from stocks?
THE major reason (I suspect) for the rapid increase in wheat prices last and this year was the failure of the wheat crop in Australia due to drought. Here are the production stats, for 2003/4 - 2007/8 (1000 metric tons):
2003/4 26,132
2004/5 21,905
2005/6 25,173
2006/7 10,641
2007/8 13,000 (looks like an approximation)
So global wheat trade has lost about 25 M tons of wheat from Australia over the last two years, compared to annual exports of just over 100 M / year. A big loss. There have been losses and gains elsewhere, the EU-27 and Ukraine's production also went down the last two years for example. The rains are back in Australia and they are forecasting a bumper crop eventually, but presumably it will take a while for global stocks to rebuild.
When the U.S. exports corn it is losing energy since corn is inappropriately priced for it's energy content. Being an energy importer, it must then replace the lost corn energy with higher priced energy in the form of oil or natural gas. Either the price of corn should go to about $9.00/bushel or the price of oil/LPG/natural gas should fall. The markets can not have a long term situation where the price of a commodity is so far below it's energy content. If this continues, the U.S. should stop exporting corn and turn it into ethanol. Higher grain prices benefit the world's poor since so many of them are engaged in subsistence farming. Those that are not should be. Packing them in cities with government subsidies for food can not continue where this is practiced. It is a recipe for disaster in a post Peak Oil world with rising energy prices.
Real busy keep me that will. Thanks
Much of the drop in U.S. wheat acreage is a function of the Conservation Reserve Program, instituted in the late 80s. This set aside highly erodable land and put it into permanent cover, mostly perennial grasses. USDA provides an annual payment to farmers based on the value per acre they bid to enter the program, that is, payments to farmers are variable, based to a large degree on the value of the land itself.
The U.S. corn and wheat belts overlap very little. More wheat land went into CRP than corn, since wheat has lower profitability. Grain sorghum, or milo, as it is more commonly known in the U.S., is a rotation crop for wheat in the southern wheat belt. It is a C4 photosynthesis pathway grass, like corn, but has higher drought resistance.
It would have been helpful to include in this posting the role the Commodity Credit Corporation (CCC) plays in U.S. grain stocks. The CCC loan rate is the federally set value of grain as collateral for a loan. U.S. agriculture is a highly capitalized industry and is very dependent on operating loans, most of which are based on grain stocks in storage as collateral. If grain prices do not go above the CCC loan rate, farmers default on those loans and the ownership of the grain passes to the U.S. government.
During the Nixon administration, U.S. agriculture was largely re-oriented toward feeding an export market. Production controls were dropped, CCC loan rates were dropped and a deficiency payment subsidy was instituted to make up part of the income loss to farmers. Over time, CCC loan rates have continued to drop, as measured in constant dollars, and for a long time the U.S. CCC loan rate effectively set the bottom of the world market for grain. As grain prices rose, less grain ended up in the U.S. strategic reserve because farmers were paying off the loans instead of defaulting.
The US west (mountain states and far west plains) has experienced rather dry conditions for the last several years. This means less rainfall and snowfall than average, sometimes being only 60 or 70% of average. Perhaps this also has affected wheat production.
If climate change progresses will the US ever return to exporting over 40 million tons of wheat as in the early 1980's? I see this as a continuing problem since so many parts of the world, especially Africa, have had drought conditions that inhibit grain production.
The northern Rockies and plains have ample snow this year and have experienced a more traditional winter for the first time in about 10 years. Would not be surprised to see banner wheat and barley production if moisture continues through the spring.
Report: World must act on climate change now
"In 20 years, the reports says that unchecked environmental damage could leave half the world's population without adequate drinking water."
http://www.usatoday.com/weather/climate/globalwarming/2008-03-05-oced-re...
Each year a little less water ... if feels like drought here in Cal.
I got this link from FAO:
http://www.fao.org/worldfoodsituation/
This is a newspage for the global crops situation.
Thanks for a fine post!
A useful addition would be the percent of grains going to feed ruminant animals (which is unhealthy to do for both the animals and the people who eat them).
I believe about 3/4 of U.S. grains are used for animal feed, mostly beef. This includes our exported grain also, such as to Japan. Don't have time to check this statistic right now and it may have changed in the past year with more going to ethanol.
What this implies is that the world grain situation isn't all that bad currently AS LONG AS much less meat is produced. One possibility is for feedlot meat to get more and more uneconomical, for meat prices to rise dramatically, then fall as herds are culled.
"A useful addition would be the percent of grains going to feed ruminant animals"
This is probably another post at some other time. Whilst in theory yes, a lot more grain could be provided for export if Americans ate less meat, I cannot see President Bush, or any other politican, asking the American people to eat less meat so that others might not starve. A bit like asking Americans to drive less so that others might have more / cheaper petrol. On the other hand, if the US economy tanks, as in a large number of people unemployed, who knows?
With respect to the effect of meat production on the planet, I came across this article the other day. Don't know whether its biased or not.
http://www.greenworld.org.uk/page74/page80/page80.html
Not only will you not stop the Americans consuming meat, China is moving rapidly to a meat consuming nation also, as its wealth increases.
For our purpose one should not only have a look at grain based animal feed (ethanol interference) but also pulses, in partcular soy. Biodiesel can be based on soy. Soy is a major food source for european farm animals -about 15% in pork, 20% in poultry, for example- and it is mostly imported from South America as soy is one of the few agricultural markets which is not rigidly controlled or subsidized by the US, EU and Japan (through Dillan round of the GATT 1962).
The effects of large scale soy cultivation can be fairly dramatic, see
for example http://www.lasojamata.org/.
Very complete post, thanks. ... It is a detail, but let’s nor forget that the US imports about 8% of its grains, e.g. durum, for specialized uses (eg. couscous, semolina, pasta - see details of that ex. in the usda table below.) The number 8 is off the top of my inky cuff, calculated from usda tables a few months ago.
The US imports grain in the form of manufactured products. For ex. the US exports huge amounts of poultry to China, they treat it and send it back. Grains are often a ‘filler’ or a ‘padder’ - think chicken nuggets. That can’t be tracked on google, usda, etc. Who knows?
One journalistic article on chicken:
Denatured and deracinated, the chicken nugget is a symbol of the way we eat now. It is the epitome of our 21st-century system of globalised, industrial food production.
http://www.guardian.co.uk/uk/2002/jul/08/bse.foodanddrink
http://www.ers.usda.gov/Data/Wheat/YBtable24.asp
Great article very interesting.
i know the article is intended to focus on the US export role in world agriculture. i think if you want to talk about "the world's breadbasket" it would be helpful to bring rice production in somehow, even though the US is not a major player there.
All Grain Summary Comparison
http://www.fas.usda.gov/psdonline/psdgetreport.aspx?hidReportRetrievalNa...
The category ‘grains’ includes rice. The top post addressed some branches below, the most important from a US pov.
Wiki has a short article that points to rampant confusion, particularly in labelling.
http://en.wikipedia.org/wiki/Whole_grain
"...even though the US is not a major player there."
I was curious about this because I know some rice is grown here in California. I found the USDA report below that says the US used to be the world's largest exporter but domestic consumption has increased to the point that we are now the fourth largest rice exporter. Interesting.
http://usda.mannlib.cornell.edu/usda/current/RCS-yearbook/RCS-yearbook-0...
Has anyone calculated the energy requirements of US agricultural infrastructure? I think I've read that, overall, the US is consuming 35 barrels of oil per person per year (correct me if I'm wrong on this fact). What percentage of our per capita consumption goes into our agricultural infrastructure? -- this would include the energy costs of fertilizer and pesticide production, food processing plants, agricultural equipment manufacture, equipment operations, transport infrastructure, and irrigation (have I missed anything?). And how much of our total food production (as measured by energy consumed) is exported back to the rest of the world?
--Beo
Yes... Beo. Import raw materials -- oil. To produce others -- grains. To export them in turn.
Controlling food, wielding the ‘food weapon’ is the ultimate control.
4 links, all short, the general to some specifics:
http://www.enotes.com/food-encyclopedia/food-weapon-war
http://www.voltairenet.org/article30056.html
http://www.netnomad.com/foodweapon.html
http://www.counterpunch.org/jacobs09092005.html
Just a few links
This of 1st Nov. 2006 highlights Australian drought which kick started the current uninterrupted rise in global wheat prices http://tinyurl.com/3dmb6x
This http://tinyurl.com/2zt4fj follows up September 16th 2007 - Australian drought - poor spring rains - higher world wheat prices in prospect - low stocks and heavy demand
This http://tinyurl.com/2omkc7 discusses the US fertiliser requirements / cost this season and effect on the things driving US costs.- In the fertiliser.
PS : There is a big joint Indian / Oz owned gas fed plant in NW Australia just fired up. Presumed India and Oz will be their market.
And http://tinyurl.com/2o73ro Wednesday, June 20, 2007 - US swapping oil security for fertiliser insecurity and higher farm and food costs ....
"The major Saudi plant is the Sabic complex at Al Jubail which uses BASF / Uhde technology who have recently installed a 4th plant and their total urea output will rise to 2.6 million tonnes per annum while ammonia capacity will reach 2.3 million tpa. This increase in production has neatly coincided with an increased international demand.
QAFCO founded in 1969 and owned by the State of Qatar, now has 4 plants in operation and after recent completion of QAFCO-4 plant, QAFCO has emerged as the world’s largest single site producer of urea and ammonia with an annual production capacity of 2 Mn tons of ammonia and 2 Mn tons of urea.
So US reliance on foreign oil, through a huge switch to ethanol now relies heavily on the Middle East for nitrogen fertiliser, a low cost commodity which costs a great deal to ship and haul - to feed the nation."
the other principal supplier is US owned by the very secretive Koch Bros and is based in venezuela.
"The world's larger urea fertiliser plants is the Fertinitro petrochemical complex at Jose Anzoategui in Venezuela - Koch Industries the huge privately owned US oil products company has a large interest in the plant. Costing US $1.1 billion, the plant was completed in November 2000 and is the largest nitrogen-based fertiliser unit in the world to date."
Interesting. thx.