| The 2008 IEA WEO - The Oil Drum Initial Review (#1 in a Series) | The Oil Drum | Breaking News: EPA Ruling - Coal Plants Must Limit CO2? |
The 2008 IEA WEO - The World Energy Model and Energy Demand
Posted by Rembrandt on November 13, 2008 - 10:13am
The purpose of the World Energy Outlook demand forecast is to show future energy market trends assuming no new government intervention takes place. This is a useful exercise because it tells governments what they need to do now to prevent the realization of an undesired scenario presented by IEA. Such an exercise is useful only if the underlying assumptions sufficiently resemble reality. If not, politicians can be lulled into complacency and/or issue the wrong type of policy response, resulting in disastrous consequences.
In this post I review the demand model of the World Energy Model (WEM) used in IEA's World Energy Outlook (WEO) 2008. My analysis indicates that the model has major deficiencies of a number of types. These include treating economic growth as an exogenous variable, when it is really depends on other variables, including the amount of fossil fuels available; inadequate analysis of the speed and price at which low grade fuels can be produced; and inadequate review of model outcomes compared to real-world data. Because of these and other issues, in my view, the model is not serving its intended purpose.
Introduction
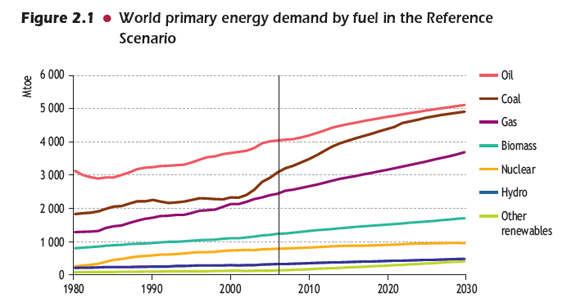
“In our Reference Scenario, world primary energy demand grows by 1.6% per year on average in 2006-2030, from 11 730 Mtoe to just over 17 010 Mtoe — an increase of 45%.” (World Energy Outlook 2008, International Energy Agency, page 38)
The outcome of the demand scenario from the International Energy Agency is an increase in energy consumption of 45% by 2030--a growth outcome that is extrapolated from present investment trends and governmental policies to the year 2030, far in the future. To state this explicitly in the IEA’s own words:
“The core projections, the Reference scenario, indicates what would happen if, among other things, there were to be no new energy-policy interventions by governments beyond those already adopted by mid-2008. This will not happen and the Reference scenario is not a forecast: it is a baseline picture of how global energy markets would evolve if the underlying trends in energy demand and supply are not changed.” (World Energy Outlook 2008, International Energy Agency, page 52)
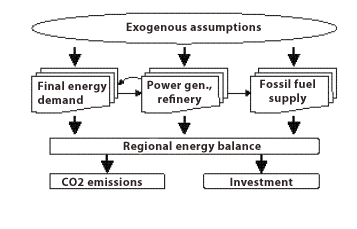
The demand trend is thus constructed from assumptions based upon current policies and extrapolating these assumptions to 2030. The assumptions are inserted into formulas used in the IEA’s mathematical World Energy Model (WEM) which is comprised of the following six models: final energy demand; power generation; refinery and other transformation; fossil fuel supply; CO2 emissions, and investment. These six models have direct as well as feedback connections between each other. The simplified structure is shown in Figure 2 below, taken in adapted version from the IEA explanation paper of the WEM to make it more readable (the original version of this graph is of very poor quality). A detailed description of the WEM can be found here in PDF format.
How are demand trends projected in the IEA’s World Energy Model?
The IEA uses several main variables to project demand of which demographics, economic growth, international fossil fuel prices and technological development measured by means of energy intensity (energy usage per unit of output of the economy) are the most important. All these variables are taken as exogenous assumptions and are thus not derived from the World Energy Model (WEM) itself.
For the World Energy Outlook 2008 the following assumptions were taken for these four main variables:
• Demographic developments, population is projected to grow from 6.5 billion in 2006 to around 8.2 billion in 2030 in the WEO 2008. The proportion of people over 60 years old are projected to rise from 11% now to about 15% by 2030. These figures used by the IEA are drawn from the most recent United Nations projections from 2007.
• Economic growth, the IEA assumes that the current economic crisis is of a short lived nature. By the turn of the decade, world Gross Domestic Product (GDP) growth is expected to recover to around 4.5% per year. After around 2015 it is expected that GDP growth will progressively slow until 2030. World Gross Domestic Product (GDP) is assumed to grow by an average of 4.2% per year in 2006-2015 and 2.8% per year in 2015-2030. Combined this leads to an average of 3.3% per year over the period of 2006-2030. GDP growth is weighed by using purchasing power parity (ppp) and the input numbers are based largely on projections prepared by the OECD, IMF and World Bank for the short to medium term. In the longer term, growth in each region is assumed to converge to an annual rate dependent on demographic developments, productivity, macroeconomic conditions and the pace of technological change.
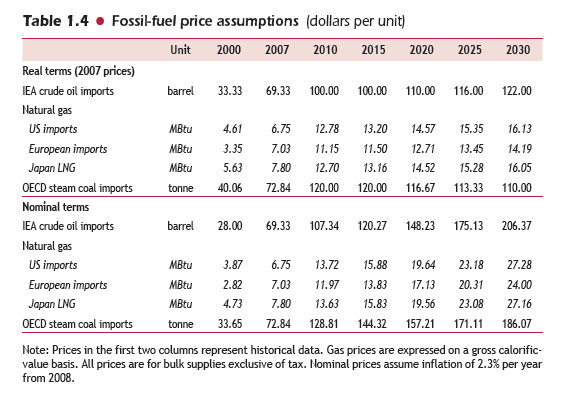
• Energy prices, the trajectories for international energy prices are derived from a new iterative model of supply and demand that has been introduced in the WEO 2008. An iterative model calculates the costs of energy based upon interactions between supply and demand. It means that the costs of energy increase up to the point that it makes economic sense to invest sufficiently in energy production as to meet the necessary demand growth. However, as prices rise, demand decreases since consumers can pay less and shift their consumption to other goods. A new equilibrium is thus reached in iterative steps at which demand equals supply. This year the IEA has assumed much higher costs to produce fossil fuel in general, and in particularly for oil as shown in Figure 3 below.
• Energy intensity or the amount of fuel used per unit of economic output of the economy measured in terms of Gross Domestic Product (GDP). In the model energy intensity is taken per different unit of fuel (coal, oil, gas etc.) in each sub sector in the model (Industry, Residential, Services, Transport etc.). Overall, the energy intensity decline used is 1.7% per year. That means that primary energy demand per unit of real GDP is expected to decline by 1.7% a year, which is 0.6% faster than the average in the past three decades. The underlying assumption of this faster decrease in energy intensity is a continued transition to a service economy in many Non-OECD countries, as well as more rapid efficiency improvements in the power and end-use sectors in the OECD.
There are three main issues I have with the IEA demand side approach. First, it does not make sense to use the factors above as exogenous variables. Economic growth, for example, will be heavily influenced by energy supply which in turn impacts energy demand. We are currently experiencing an economic crisis for a number of reasons, among them being a lack of growth in oil production in the past three years. By taking economic growth for granted, the outcome of the model will always show growing energy demand for decades into the future. This scenario does not resemble the reality of a world in which fossil fuel supplies are limited.
The second issue lies in the lack of communication on the IEA’s part to the external world (including policy makers and media) that these variables are taken for granted as exogenous variables. If one understands that growth is simply an assumption, it tremendously changes one's understanding of the IEA’s World Energy Outlook 2008. If one clearly states one's assumptions, it becomes possible to challenge them. Otherwise, discussing the matter continues to be a black box of misunderstanding, and leads the media and politicians to take the IEA's scenarios for granted as likely developments, instead of scenarios that could happen under stated assumptions. I make this observation mainly from my personal experience with the media, civil servants, and politicians in their interpretation of the IEA's message in the past four years in the Netherlands.
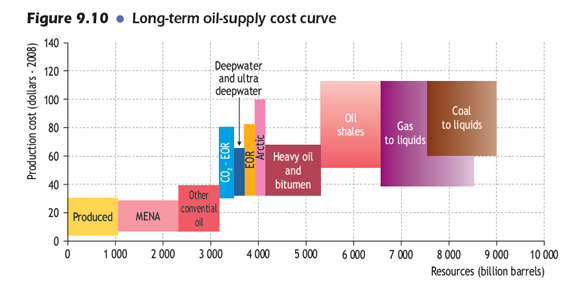
The third issue lies in the iterative model used to determine energy prices. The cost of increasing supply to meet increasing demand is highly dependent on the underlying assumptions. The IEA uses long term oil supply cost curves as shown in Figure 4 below as a basis for determining its estimates of supply. This involves plotting the total amount of resources available versus the estimated production costs of these resources. This shows, given the assumptions used by the IEA, that there are plenty of resources available at a relatively low costs below $100 per barrel, in a normal market environment. Normal means a market environment in which there is no OPEC cartel, there are no upcoming personnel shortages in the oil industry, and there are no external environmental issues that increase prices such as CO2 emissions. In previous editions of the World Energy Outlook, the IEA did not take into account any of such issues that change the "normal market environment". This was a limitation of the model that led to the very low price expectation of $20 to $30 per barrel in projection to 2030.
In the 2008 WEO edition, such issues are taken into account to a limited degree, leading to higher price expectations of around $100 per barrel in the next decades. It is doubtful whether the assumptions go far enough, however. There are several reasons why I think this is the case: First, the speed at which lower grade fuels can be produced is much slower than the speed at which conventional oil can be produced. In fact, the speed is so slow that it will be impossible to meet a large increase in demand through unconventional sources of fossil fuels in the next two decades. Second, it is doubtful whether conventional oil exists in the quantities shown in the oil supply cost curves chart. Third, this calculation does not take into account quality differences between these resources in a useful manner. One of the most important variables in determining costs is the increasing energy inputs required to produce progressively lower grades of oil.
The energy demand outcomes of the WEM model
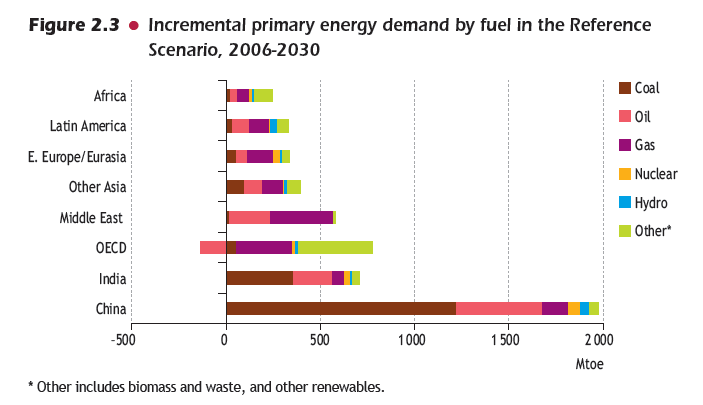
With an exogenous economic growth assumption of 3.3% per year to 2030, and an energy intensity decline of 1.7% per year, it is not surprising that the WEM calculations lead to an energy demand increase of 45% by 2030, as shown in Figure 5 for different types of fuels. Most growth comes from coal, which will almost overtake oil as the biggest energy source by 2030. The reason for this shift is because energy consumption is expected to increase in China and India, as a result of demand growth in the next two decades, and these countries are expected to meet most of their incremental demand through coal. Although it is not explicitly stated in the WEO 2008, the gradual change to greater coal consumption is likely an effect of a combination of the WEM's relative price assumption of coal to that of oil and gas, plus the expected coal availability in China and India.
Nearly all of the energy consumption growth of the world (87%) is expected to come from non-OECD countries in the future. Energy consumption in the OECD hardly grows, even as GDP increases at 2% per annum, due to an assumed continuous efficiency improvement in the power and end-use sectors. The biggest contributor to non-OECD growth is China. The country is expected to nearly double its energy consumption between 2006 and 2030 to a level of 3.8 million tonnes of oil equivalent, as shown in Figure 6 below.
If we take the assumed model structure with exogenous variables for granted, what can it tell us? Does the scenario provide a plausible enough outcome to show that the current energy path will lead to an energy consumption growth of 45% in the time period of 2006-2030? Even in the case that we do not take significant supply constraints into account?
Unfortunately, time has been too short between the publication of the World Energy Outlook and publishing this post in the next day to analyze the internal validity of the model's outcome myself. Fortunately, a recent article written by Nel and Cooper (2008) gives great insights in this issue. The article is called "A critical review of IEA’s oil demand forecast for China" and was published in the January edition of the Energy Policy journal (PDF is downloadable here for those with access to Energy Policy). Although the article is based upon the oil demand projections from the IEA’s WEO 2006 for China, its conclusions are still valid as the oil demand projection from the WEO 2006 hardly differs from that of the WEO 2008. China’s oil consumption is expected to grow to 15 million barrels per day in 2030 in the WEO 2006 compared to 16.6 million barrels per day in 2030 in the WEO 2008.
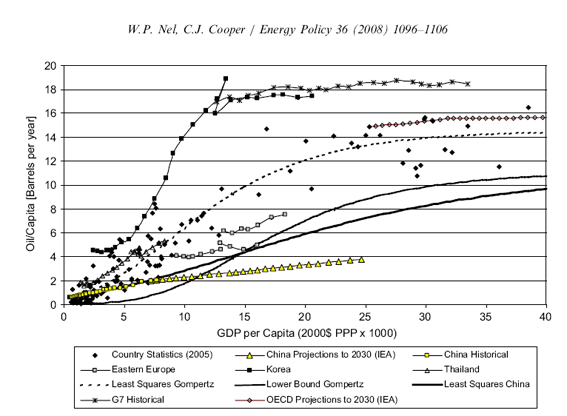
In the article, Nel and Cooper look at the historical relationship between economic growth and oil consumption for several hundred countries in the world. The report concludes that in the most efficient historical cases, oil consumptions grows to 11 barrels per capita as GDP per capita grows to $20,000 (measured in purchase power parity terms). When comparing this value with the IEA’s projections for Chinese GDP and oil consumption, they surprisingly find that China can do something which no nation on earth has done in history, growing to a level of wealth of $20,000 of GDP per capita as oil consumption per capita only increases to 3 barrels per capita, as shown in Figure 7 below. The authors conclude their paper by stating that:
“The application of logistic curves to the lower-bound global historical data of GDP per capita in comparison to oil consumption per capita emphasizes the fact that the IEA forecasts for China diverge significantly from historical trends. Although potential contributing factors associated with the unique attributes of China could contribute to such divergence, the IEA projections are unprecedented in history.” (Nel and Cooper, Energy Policy 36, page 1104)
While this is hardly a comprehensive analysis of the entire energy demand model of the IEA, it raises significant doubts on the validity of the assumptions used in the demand part of the IEA’s WEM used for the World Energy Outlook 2008.
Conclusions
I began this post by indicating that it is the IEA’s intent to show how global energy markets will evolve if underlying trends in energy demand and supply are not changed by political intervention. I think that this goal has not been reached, as the assumptions in the energy demand part of the model do not sufficiently resemble the dynamics of reality. More directly stated: the world energy model in my opinion does not sufficiently resemble reality to answer any question or provide insight into the evolution of global energy markets without new political intervention.
In order to improve future versions of the WEM and World Energy Outlook, I suggest that it would be worthwhile for the IEA to examine the following key variables/issues more closely:
• Feedbacks between supply, demand, economic growth and energy prices
• Identification of the increase in the energy cost of fossil fuel production in the future that is expected to occur because of a decrease in the quality of the remaining fossil fuels over time
• Review of the empirical relationship between economic growth and energy consumption
• Explicit identification of assumptions and limitations regarding the WEM in the management summary of the World Energy Outlook
References
Nel and Cooper 2008, A critical review of IEA’s oil demand forecast for China, Energy Policy, number 36, pages 1096-1106
Contact
- Content: editors at theoildrum dot com
- Tech support: support at theoildrum dot com
License

This work is licensed under a Creative Commons Attribution-Share Alike 3.0 United States License.
Good comments.
Why does the IEA assume that an assumed shift to more of a service economy in OECD countries would decrease energy intensity by such an inflated amount, to 2030? Do they think that the world, as a whole, will not produce as much, or use as much, goods, proportionally, as it does now?
Because in a service economy you get some other country to build your stuff. The West would use rather more energy if it had to make all its own t-shirts, CDs, cars and so on.
The IEA is probably forgetting that it still costs energy to make the stuff, where on the globe that barrel of oil is being burned or turned into plastic wishbones doesn't matter to resource depletion or climate change.
You can not explain the much higher GDP/oil barrel of Japan versus US because Japan manufactures less than US. Nor can you explain the declining oil intensity of OECD countries because they are importing manufactured goods from China. Even if all of China's oil consumption was included in G7 countries, they would still would have decreased oil intensity in last 30 years.
A lot of manufacturing doesn't use much oil, think of steel( coal), cement(coal) plastics( natural gas) aluminium( electricity). What uses oil? ; transportation especially cars and trucks, air transportation. Rail and ocean transport only uses a very small portion, and in most countries almost no oil is used for electricity production. Some oil is still used for heating homes and offices, but this use is being replaced by electricity or NG.
If oil prices continue to increase, its reasonable to assume continued improvements in GDP/oil barrel, in fact improvements in GDP/energy unit, although there is no reason to think that energy use will decline as oil use declines.
China doesn't have to reach the 12 barrels/capita, because they are building high density cities with mass-transit infrastructure.
Japan uses 5,2 mb/d and its GDP is one third of the US. So if it had the GDP of the US, Japan would've used 15mb/d, while the US uses 20,5 mb/d. It is a difference but not a whole lot, given the population density of Japan compared to US (which is advantagous for public transportation).
Japan consumes 14 barrels/capita. South Korea 17 barrels/capita. These countries are high density countries with high density cities.
Because in a service economy you get some other country to build your stuff. The West would use rather more energy if it had to make all its own t-shirts, CDs, cars and so on.
The IEA is probably forgetting that it still costs energy to make the stuff, where on the globe that barrel of oil is being burned or turned into plastic wishbones doesn't matter to resource depletion or climate change.
At some point the West has to start making things again. The job exportation to China and other parts of the world is not a sustainable situation. I don't see how you could borrow goods forever or how you can trade services internationally equivalent to goods. So any IEA analysis that anticipates the current international manufacturing distortion continuing or even increasing would be based on a false premise in my opinion.
@Sofistek
I assume you refer to my statement that the IEA assumed a shift in most non-OECD countries (not OECD) to a service economy hence leading to a faster decrease in energy intensity in the future versus the past.
I cannot tell what the underlying assumption is of that as it is not explained in any detail in the report. Unfortunately this holds true for many things. Withouthaving the explicit formulas and input figures used it becomes difficult to comprehend how and why the IEA is doing the things they do. I base my statements on the provided IEA texts and my interpretation of it.
It does seem difficult to understand. Assuming this is true, who, precisely, will be actually building stuff? I presume that even in countries with increasingly service-based economies, people still need actual physical stuff built by somebody. Is the assumption that economic growth is going to maintain (or increase) existing manufacturing capacity and, at the same time, increase the percentage of these economies that are service related? I am the furthest thing from an expert on this, but to any out there who are, does that pass the sniff test?
Brian
Yeah, that's what I was referring to. It seems a bizarre statement to make, to me. It implies that the world, as a whole, would be shifting to a more service based economy, which I'm not sure is likely (but they don't explain that, as you say) and I'm not sure would have the effect they claim (but they don't explain that, either).
In any case, a report that uses the completely useless phrase, "at current levels of consumption" (or some variant), is suspect, to my mind. It tries to give the impression that there is no shortage of oil (though a 40 year plateau would not be good, in itself, in terms of growth), when it is a completely meaningless phrase. There should be a world-wide ban on using that phrase on any resource that is finite.
Excellent point sofi. Over the last 40 years the US has shifted to a much more service oriented economy. Doesn't seem to have decreased our demand.
True. Nor worldwide demand. Nor has it reduced oil intensity by 1.7% per year. It seems as though the 1.7% figure was pulled out of someone's ass in order to get the calculations right.
Not only that, isn't it also true that new fields tend to be smaller than in the past and this will tend to increase costs to extract the same amount of oil, at the same rate, even if that was possible?
@sofistek
A very valid point that you raise here on costs increasing as fiels are smaller. I will send your comment to the others oildrum contributors that are working on posts about supply and costs.
sofi,
In some cases it may be true that a smaller field could have a larger per bbl developemt cost than a mega field. But improved recovery technology has helped to lower costs significnatly also. IMO the bigger cost factor is where these "new" fields are found. Just consider the Deep Water exploration going on in the Gulf of Mexico and offshore Brazil.
I just yesterday I attending a meeting presenting a Deep Water GOM well I’ll be working on next Feb. The estimated cost is just shy of $200 million. And that doesn’t included completion or infrastructure costs. It truly took my breath away when it flashed up on the screen. Just last Sept I worked on a similar well with a cost estimate of $100 million but lots of trouble ran it up to $148 million. And the new $200 million price tag doesn’t include trouble time. On the good side, it's suppose to have nearly a 100% probability of success since it’s going to confirm a successful wild cat drilled a couple of years ago. On the other hand, this is the third “sure shot…can’t miss” well I’ve seen drilled in my career. And the first two missed.
These huge and long term projects require a good estimate of future oil prices to make the economic analysis viable. With the volatility we’ve seen in the last 10 months it’s easy to imagine how little confidence companies can have in their economic analysis these days. Finding oil is not enough…the numbers have to work out too. Today that analysis is pretty much down to a wing and a prayer.
I wasn't referring to the production costs of just one field, though. If five fields, say, are needed to produce what one large field has done in the past, then that would tend to increase the costs of producing at that rate, especially if the fields are geographically dispersed and with different geology. They would just mean more manpower and more resources than developing a single field to the same capacity.
Location is clearly a bigger factor in per barrel cost than field size. Extreme costs such as you quote will increase the minimum size of the deposit which can be economically recovered. This will result in a lot of oil from smaller reservoirs left in place because it is uneconomical to recover it.
I think it's a combination. A large field in the Arctic might not be as expensive as a small field in the Arctic (in terms of overall field life costs, at least) but if there are only small fields dotted around the Arctic and in widely dispersed locations, developed by different countries and companies, then the cost of producing, say 100,000 bpd from those fields will likely be much higher than from a single large field in the Arctic, developed by one country/company/consortium.
So, you're right, location will be an important factor but the small field sizes will compound the costs.
Also, the IEA report seems to acknowledge that future discoveries will likely be smaller fields and reports that decline rates are much higher in smaller fields. This should also be a concern to them, but, somehow, they still see output rising by 70% by 2030 (if everything goes right, of course). Very strange.
I find it puzzling that the cost of production given in fig 9.10 for remaining conventional oil is about the same as the cost of that already produced. Doesn't production cost go up significantly for the second half of the oil as it is harder to pull/push/suck out? Maybe a small point but one that casts a shadow over the whole cost structure IMO.
TW
not if we suffer deflation... ;-)
the problem with costings and viewing everything in dollar terms is the "relativity of money" is disabling in forming readily usable overviews
the whole works is so corrupt, you really have to scratch around to find a valid yardstick.
if you graph oil against the dollar index and gold, well... what?
the gold market is manipulated, the dollar seems to be the main tool used to manipulate the global economy... in the long run, i'd bet on gold, but i'm too old to buy green bananas.
if the dollar continues to appreciate, one of these days we'll be able to buy russia, china and europe outright... at which point we'll be able to settle down and enjoy an everlasting "benevolent global hegemony", reinforced by periodic slaughter of a few million malcontents, here or there... which puts a kink in the "benevolence", but it's one of those "eggs and omelettes" things, i spose.
the omelette song
awesome! thank you...
"in the long run, i'd bet on gold,"
It would be a lousy bet in the long run. There were lots of people betting on gold in the 80's and it worth less today then it was in 1980.
http://66.38.218.33/charts/historicalgold.html
Take a look at 1975 to today. Speculate in gold, fine, invest, I think not. Hell take a look a gold a couple of months ago and tell me about how that would be a good bet.
there's so much shit floating around in gold derivatives, nobody has the slightest idea what gold is worth.
The Chinese saying -- what goes up like a rocket comes down like a rocket -- applies to gold. Two of the main uses for gold will decline precipitously in the growing global depression: electronics and jewelry. Gold prices will drop like a stone, and then folks will see that it is a shaky investment and dump it, thus flooding the market with gold as the value decreases. The more people dump it, the less value it will have.
If someday years from now someone wants to buy my macadamia nuts, I won't accept gold, as I will have no idea what value it will have in the future. Not so with some seeds, medicinal herbs, tortillas, or a visit to the dentist. Of course, the dentist will need some gold for fillings, but there will be an abundance of the cheap stuff floating around. Even many poor people around the globe own some gold.
It's time for a new name. Which do you like better?
The International Energy Assumptions?
OR
The International Error Agency?
International Enticement Agency -- enticing fools to come on in, cause the investment waters are fine!
Keep investing in the corporations that have given you the good life, and will continue to. And don't listen to those doomers types who say look out, quicksand ahead.
The schizo on the corner with the sign that says "the end is near" is the real prophet nowadays.
What are the growth assumptions for China? They mention 2.8% global growth from 2015-2030, is that weighted for China and other developing countries much larger share in the global economy? Do they assume that the global economy will grow by 2.8% in 2020 even though China might consitute an equal share of the global economy as the US by that time? If a much larger share of the global economy is fast developing asian countries, it would be natural that the growth rate of the global economy will increase, not decrease.
Their assumption of primary energy demand only doubling in China by 2030 is extremely conservative. Primary energy is mostly power generation and oil consumption no? Power generation could easily be closer to 2000 GW than 1500 GW by 2020, from 500 GW in 2005, and by 2030, it is bound to be larger, perhaps 2500 GW. Oil demand of about 10 barrels per person annually looks like a reasonable assumption by 2030, that is a five-fold increase from today's level, and taking into consideration 150m more people in China by 2030 (which is a small relative increase), it translate into about 40m barrels/day, twice the US consumption, but 4 times the population after all.
So power generation at 2500 GW and oil consumption at 40 mb/d is a much more reasonable assumption for China IMO. That would translate into a much higher increase in primary energy demand than 2m tons of oil equivalent.
@Brachio
- World growth is weighed for China and other developing countries share in the global economy on a purchasing power parity basis.
- China is assumed to grow with 9.2% per annum between 2006 and 2015 on average and 6.1% per annum between 2006 and 2030 on average.
- Primary energy demand is all energy demand before conversion losses (I.E. before fuel goes into the power plant etc.).
for me this one nails the main problem for economic forcasting in general...
no one seems to understand how this works.. clearly the feedback issue is greatly influenced by the markets inability to think long or cope well with the reality of depletion.
if you think about it the problem is largley one of perception
God created economic forecasters to make weather forecasters look good by comparison. Because of feedbacks and because of complexity, forecasting models can never reliably identify when trends reverse. Thus the tendency in predicting economic outcomes is to make more or less naive projections of past trends--which works until it does not work, at which point the model becomes worse than useless.
To the extent that I make economic forecasts (e.g. that the Fed and the Treasury will successfully prevent a deflationary depression) I rely on my brain to "informally" handle the data, because I think the human brain can do better with complexity than current econometric models can.
You are correct about the importance of perceptions. We act on the basis of our expectations of the future--not on the basis of some objective reality. Expectations can reverse on a dime and change abruptly and greatly. Any model that fails to take account of the important role of expectations in economic behaviors is useless for forecasting. In my opinion, econometric models can be much improved by including social psychology as part of the model.
the thing is in a world of functional infinities in the medium term this doesn't matter.. the boom bust cycle thing just wobbles about with a care in the world..
the real head mangling problem is when units of exchange have to address fundamental realities in a more specific and realistic manner... it matters now how money works because of this "limits energy growth deal"
and no body understands how it works... then we have this black swan guy telling us big (random or non random?) stuff happens and forecasting is an illusion of historical myopia
too me thats points to a prime cause of the "new normal" .... volatility
is it the case no one really knows what to do anymore .... these recessions are characterized as corrections...
what are we correcting this time round?
is it syncing money to basic physical realities with a unto never seen before accuracy? when people shift the money around in the markets are they essentially creating a new priority of value?
I'm close to internally screaming "peak!" and I have been holding off that doomer part of psyche with a vengence
are we watching the decimation of the world economy as it adjusts to EROEI effects?
In my opinion we have not yet begun to see the decimation (and worse than "decimation" which means killing one in ten) that is to come because of declining net exports of oil and declining EROEI. 2008 was not good for economies around the world. 2009 will probably be worse than this year. The full bite of declining oil production will probably not be felt until 2011 or 2012. After that, economic conditions will get much worse--the Greater Depression or the Great Decline, whatever you want to call it.
Recessions do correct speculative lending mistakes and mistakes of investment such as building too many houses. The famous economist Joseph Schumpeter thought even the Great Depression was a good thing--a cold shower for market economies that corrected excesses and errors. Most economists think that economic fluctuations are built into market economies, but that the trick is to keep these fluctuations from getting out of hand.
Don
Nice to see someone who uses the term "decimation" with precision.
Speaking of language, I notice that a number of otherwise quite literate TODers use "then" as a substitute for "than". Is this becoming accepted usage in the US?
I used to be a teaching assistant in something called The Prose Improvement Program at U.C. Berkeley, way back in the 1960s. The quality of American prose (The students were juniors and seniors in Business Administration.) was appalingly bad then and it is much worse now.
I think the use of "then" for "than" is most likely a typographical error; it is easy to type phonetically when in a hurry and then fail to spot the typo when proofreading. I shudder to think that some people may not know that "then" and "than" are two different words. Neither spelling nor grammar are taken seriously by many people. I think the use of e-mail and texting has contributed to neglect of spelling and punctuation, not to mention capitalization.
Deterioration in the use of language both reflects and causes sloppy thinking.
I've noticed that engineers, who think clearly with mathematics, often have trouble with the English language, and I know a number of scientists in various disciplines who are scornful of spelling conventions.
In my opinion we are going to need rigorously clear thinking and good prose to deal effectively with the consequences of Peak Oil.
Production is flat rig count is up..
http://www.theoildrum.com/node/4755#comment-433096
Is that an indication of declining EROEI?
The price and rig count shot up while production stood still.
These statements arguably are two of the most important in the whole analysis, and ones that the IEA continues to miss the boat on; Overstated Reserves and EROEI
Could I ask that further discussion of these points be wrapped into one of the next articles in the series?
Hi,
You have been very gracious citing the deficiencies you felt were not addressed.
I read parts of this report a few days ago from another source.
My only thought was if this is the best the INTERNATIONAL E A can do we are in deep trouble. They are locked into political correctness.
Graham
Just want to say to Rembrandt and anyone who may have assisted, "Extremely valuable work. Kudos." Very thought-full and thoughtprovoking.
In case no one noticed this, the chart in Figure 7 uses the Gompertz equation to fit their curves to. This is significant because the Gompertz is a very aggressive growth law that assumes a relentlessly accelerating extraction term. This is not the benign Logistic growth law that simply shows an exponential growth, the Gompertz accelerates on the acceleration! Practically speaking this means that the "productivity" growth is not just proportional to the current per capita via a constant K, but that the constant K is exponentially growing -- which means that they are implying that growth will just skyrocket.
Just what the heck else is in this report?
---
The math behind the Gompertz is here:
http://mobjectivist.blogspot.com/2008/10/why-we-cant-pump-faster.html
Gompertz is not seen in many places. I believe it may appear in extinction of species, and heavy harvesting of isolated easily accessible resources such as surface phosphate deposits. In my opinion it is very hard to apply it to things like oil extraction because there are limits to how fast one can extract, where the proportionality to reserves plus perturbations works much better (see the Oil Shock Model).
That must have been put in with some jerk ;-)
Chris
Nice, a little linear controls theory humour :)
@WebHubbleTelescope
>which means that they are implying that growth will just skyrocket. <
Who is implying what? Nel & Cooper have fitted a gompertz curve model to the empirical economic growth versus barrels per capita consumption, shown in chart 7.
Implication being that blindly fitting to heuristics is OK unless those heuristics have some deeper meaning. In this case, since they chose a Gompertz, they (Nel & Cooper) are implying that growth is beyond exponential.
OTOH, they (Nel & Cooper) may not know what they are doing and they chose the Gompertz because it is a curve.
A Gompertz curve would be meaningful to fit oil extraction rate vs. time, assuming faster-than-exponential growth. Since Nel & Cooper are using such a curve to fit oil extraction rate vs. GDP (not time), it is clear that WHT's hunch is right: They don't know what they are doing and chose Gompertz just because it is a curve (and makes them look so smart).
Unless they have some implicit relationship buried in the GDP with time according to a Gompertz, then it is indeed puzzling. I don't think we will ever get a clarification without the full text.
These two excerpts are the only statements in the text of the paper on the gompertz curve:
"The relationship between oil consumption and economic growth is essential to an understanding of future trends in
demand if existing patterns continue into the future. Logistic curves have been widely applied to model per capita energy consumption patterns (Ausubel et al., 1988; Seifritz and Hodgkin, 1991; Mohamed and Bodger, 2005) as well as to vehicle ownership patterns (Dargay and
Gately, 1999). A Gompertz relationship, expressed in Eq. (1), is used in this paper to model logistic relationships."
"The data in Fig. 1 exhibit logistic behaviour if the outlying points (based on the criteria above) are excluded. A numerical iteration procedure was used to do a leastsquares fit of a Gompertz curve on the data points considered in the assessment (solid diamonds in Fig. 1).
The labels used in Fig. 1 are listed in Table 1 for the countries considered. Parameters for the least-squares Gompertz curve are listed in Table 2."
The author (Nel) can be reached through willemp.nel at eskom.co.za
Thanks. I think they use the term 'logistic' to indicate a relationship that has an s-shaped curve. The gompertz also has an s-shape but the top-end tail is very short. Reading how imprecise they are with the terminology, it seems we should not read that much into their curve-fitting approach.
Rembrandt - Nice Analysis.
I have a post coming soon regarding the implications of EROI for the WEO report. What is most baffling to me is the lack of attention to energy quality. As quality declines, total consumption must increase to get the same btu output. In other words, greater proportions of total available energy will be spent in getting more energy in the future, thus limiting the energy available for economic production - however, since as you point out, energy is exogenous to economic growth in this model, maybe it doesn't matter? HA.
I think Figure 4 is very useful. It says that there remain about 2000 billion barrels of conventional oil: about twice as much as has been produced already. And, more than half of this costs less than $20/barrel to produce. So, we have as much oil available at this low cost of production to get off of oil as we've already used getting on to oil. Now the fossil fuel alternatives outside of conventional oil are all much more expensive than this, and they are more expensive than the renewable alternatives, wind now and solar by 2015. So, it would seem that the prudent course is to restrict oil production to that which costs less than $15/barrel to produce with a possible rise up to $20/barrel if absolutely needed. As we make our transition, we can keep the price of oil down to 25% above the cost of production by assuring that our transition accounts for the likely production profile of the low cost oil by keeping demand below that profile.
The best way I know to get that going right away is for the US to cut consumption another 10 or 15% ASAP to boost the world surplus production capacity to 5 million barrels per day so that the price of oil returns to $20/barrel. That will discourage investment in the rather foolish proposed sources for oil that are not conventional that show up in the high cost range in Figure 4. If that investment is nixed, we'll only see the low cost oil on the market in the future and it will be possible to control the price to keep it low as we transition off of oil in a comfortable and elegant manner.
Chris
@ Rembrandt, et al.,
Well done. As in any model...the keys are the assumptions and methodologies used which you outline (I only read executive summary) regarding demand. Agree w/r/t your main points in conclusion. Add a couple things. 1.) IEA should develop a vigorous process to analyze...learn and improve on the complexity and do scale analysis of input variables used in projections with correlation coefficients. Second, circa 2012-2015...efforts should include how alternate energies could be used to mitigate problems. History shows this will happen.
Lots of work for IEA? Yes...but the consequences are too grave to not put in the effort from this perspective.
--Nichoman
Rembrandt, Nate Hagens and all other TOD contributors,
You folks are simply amazing! Thanks so much for continuing to keep the discussion alive and sharing the absolutely brilliant analysis. I am continually in awe of the intellectual horsepower you all share with us, (and sometime a little jealous of your brillance). Do you folks have a special diet to get so smart? But seriously, please keep up the great work!
@Estamos jodidos
Thanks for your enthousiasm. Regarding the diet of the TOD team. The demand article above was written on a diet of beer and 200 grams of chocolate consumption between 11 PM and 4 AM in the morning. It has not yet been scientifically proven, but I think the combination of these three does the trick ;-).
Lower quality sources lead to higher costs. One of the reasons for this, I assume, is the increased energy required for extraction, processing, etc. This increased energy has to come from somewhere. What are the demand implications of increased energy requirements for production itself? Wouldn't this have the tendency of shifting the demand curve higher, driving up price, and, in turn, further increasing costs of production? Are these feedbacks considered? Are they even material?
Brian
IEA's Coal to Liquids shows $60 to $115/bbl.
However, China is ALREADY producing methanol for fuel at $28 to $40/bbl gasoline equivalent (for $0.66 to $1.00/gal gasoline equivalent). China prudently recognizes that economic survival and providing jobs mandate providing adequate fuel at low cost. This sensibly trumps all efforts to reduce economic growth by appealing to unvalidated climate change models. Some models of China's rapid economic growth by 2015 will result in increased CO2 emissions that are many times larger than the Kyoto proposed reductions of which the EU has only achieved 25%. In China at least, pragmatism now rules politics.
See:
China Mobilizes Methanol While the U.S. Remains Mired in Oil Greg Dolan November 3rd 2008, The Cutting Edge
Maximilian Auffhammer, and Richard T. Carson, Forecasting the path of China's CO2 emissions using province-level information , Journal of Environmental Economics and Management, Volume 55, Issue 3, May 2008, Pages 229-247 PDF online
Folks, that prediction for "Biomass" use (which, obviously, includes ethanol/biodiesel, as well as biomass for electrical generation, and heat) is just ridiculously low.
Nice work y'all on the responses to the IEA report. I look forward to seeing the remaining parts of the TOD coverage!
Here's my take on the report: IEA Oil Report: "Time is Running Out" - Nothing Short of an Energy Revolution
Hello ChrisN,
First, big thxs to Rembrandt, Nate, Ace, and all other TODers for their analysis of the IEA's latest and greatest brainfart.
Gotta say I just love Yhprum's Law! Murphy's Law ass-backwards--LOL!
Your Quote: "The only way I can see the IEA scenario coming to pass is under the opposite of Murphy's Law, which Wikipedia tells me is "Yhprum's Law." That is, everything that can possibly go right, will."
A Key Quote by You about the IEA: "See a pattern here? They're slowly backing into the truth."
This reminds me of an old Johnny Carson,'Carnac the Magnificent' joke:
----------------
"Nictophobia"
Carnac tears open the envelope, then reads from the card, "The fear of backing up naked into the doorknob".
----------------
The IEA should adopt an easier analysis method to open the door to find the crude truth.
I took a stab at analyzing The changing nature of EIA forecasts, which I'm certain has been done here before with much more savvy. They lower the bar with each passing year; might be amusing to set a prediction on when they'll forecast a plateau - or decline. Well, a plateau anyway. Predicting a decline would be classified as Thoughtcrime I guessthink.
Rembrandt, thanks for the thorough story!
I think that the IEA should just record and report on historical data. If they must do forecasts, then they should be restricted to perhaps a two year time horizon. Other organisations, subject to much less political manipulation, can do forecasting, for example, the forecasts by ASPO's Colin Campbell and Jean Laherrere.
Nov 2008 Campbell oil and gas forecast to 2050
http://www.aspo-ireland.org/contentFiles/newsletterPDFs/newsletter95_200...
Oct 2008 Laherrere & Wingert total liquids to 2100
http://aspofrance.viabloga.com/files/ASPO7_2008_Laherrere_Wingert.pdf
The IEA has just released the highlights of the Oil Market Report for Nov 13, 2008.
http://omrpublic.iea.org/
The forecast below has been updated for the historical IEA data on supply and demand. In addition, the 2009 IEA forecast demand data has been included.
Demand destruction continues to occur and consequently, the demand supply gap until Sep 2009 is forecast to be a reduced 0.8 mbd.
I remain stubborn in my forecast of the oil price and believe that it will continue its long term upward trend. By the end Dec 2008, the oil price could be back up to $100.
OPEC made a 1.5 mbd cut effective 1 Nov 2008, which hasn't increased prices yet. I believe that this cut wasn't really a cut but a return to normal production rates, since OPEC probably overproduced from their fields prior to US election.
OPEC probably meets again in two weeks, on Nov 28. If the oil price does not rise to at least $70 then OPEC is likely to cut production by at least a further 0.5 mbd.
http://www.presstv.ir/detail.aspx?id=75276§ionid=3510213
Supply, Demand and Price to Dec 2012 - click to enlarge
Rembrandt,
Thanks for the link to the ASPO Ireland Newsletter. Colin Campbell makes an interesting point:
If Wall St and the rest of the world's financial system is in such a mess, what is the point of Saudi Arabia rushing to turn lots of oil into (possibly worthless) money?
He ponders the King's dilemma:
Just because there are zillions of alleged barrels of reserves doesn't mean that they will actually get produced.
BobE
That is why the world's most powerful army is sitting on his doorstep.
To 'assist' him in not making that 'mistake'.
So true Dave. Even P-E Obama is signing on to our "helping hand" approach. We'll be out of Iraq in a few years but we'll restage in Afghanistan. Even before taken the oath the P-E has pledged to increase our forces there. IMOH it won't matter who controls the Congress or the White House: the US military will be massed in significant numbers close to the Persian Gulf for many decades to come.
Overproduced. Right. And: 80% of a supply surge of 1 mb/d between May and July went to China, just when prices spiked. These were the most expensive Olympic games we ever had.
Saudi Arabia lost swing role in 2006-2007 and must now rest its fields like in 73/74 as mentioned in Simmons' twilight book (Appendix C). It is not quite clear if and when and to which extent the workover in Khursaniyah started to produce. In fact what we see is exactly the "coming Saudi oil shock and the world economy"
Iraq is now back on pre-war level. Cost: US$ 1.5 trillion so far
http://www.washingtonpost.com/wp-dyn/content/article/2008/03/07/AR200803...
Full post of updated incremental crude oil graphs up to August 2008 was here:
http://www.theoildrum.com/node/4752/433057
"Feedbacks..."
Concerning the earlier reports the IEA obviously had a serious problem with feedback cybernetics. But meanwhile they seem to have learned (from their errors?) and to consider somehow that prices do make a difference etc. They even seem to do quite a bit of complex computer modelling ("World Energy Model", "Oil Supply Model"), but I don't know how and where they apply it.
There is more information at http://www.worldenergyoutlook.org/ - World Energy Model. Maybe someone can have a closer look.
Of course also a model cannot be better than the assumptions it is based on.
May I venture one such beast ...
Recently I overheard the Russian Prime Minister reconsider the Baltic Sea pipeline construction upon worries of lacking demand. Which as a sidenode was up one fifth for the year running according to the IEA.
Nonetheless this seems like a big (aka not so new) deal, not only to Poles, but could even help save the world if replaced with a north to south link across Western China that would both cross over with the one from east to west and feed into India.
Now remembrance of earlier drums on natural gas pipe projects and my geography education tell me this comes with a few minor challenges, but from a feedback point of view ... we might even kickstart European economies just by helping out with the construction.
Leonid
nope, just kidding.
Serge.
More seriously, here's backup with home made cybernetics on EU-27 energy demand added to inclusions from various sources. It predates the present downtime, but I still feel good about it:
The methodology is from the the BP statistical energy review plus an efficieny factor of 50% for solar and earthbound thermal. Accordingly it uses MTOE units.
Err sorry, that should have been 260 for 2010, and 486 for 2020 renewables. But then again, maybe it was a subconscious runaway that had already somewhat factored in the consequences of current economic events.
Redoing the numbers also told me 445 for 2006 natgas.
Serge
Oops, I realized that my remark was a bit redundant. Sorry.
The IEA indicates that oil shale will produce significant volumes of oil.
But the World Energy Council concludes:
1998 article on shale oil, with an appropriate quote
http://www.hubbertpeak.com/youngquist/geotimes.htm
rembrandt,
I wonder if there is some text in the report describing your Figure 4? What does MENA mean? I'm sure that ME means Middle East but I'm not sure about the NA. Also, do you think that the overlap of GTL and CTL is intentional or a mistake? It looks to be as though the CTL block would fit just about exactly in the remaining space of the plot. Every other block in the plot has no overlap. But, there could be some physical tie between GTL and CTL that they are trying to represent.
Thanks,
Chris
MENA Middle East and North Africa
Thanks!
Chris
As a reminder, this is the late Dr. Bakhtiari's oil production model:
http://www.sfu.ca/~asamsamb/conference/WOCAP.htm
It produced these production curves:
Dr. Bakhtiari defined transition periods T1-T4 up to 2020. We are now in T2. In T1, a growing economy bumped into peaking crude oil production as shown above. In T2, limited availability of credit and hence purchasing power are a constraint for both demand and supply.
Matt,
Dr. Bakhtiari's forecast is proving to be very accurate!
Non OPEC-13 production, crude and condensate which excludes NGLs, appears to be ending its short peak plateau from 2004 to 2007. Bakhtiari's Non OPEC production was higher than the production in the chart below which excludes NGLs and is in relation to OPEC-13 not OPEC-11 from Bakhtiari's Dec 2003 forecast.
click to enlarge