| How Close will the U.K. Come to Running Out of Natural Gas in Storage this Spring? | The Oil Drum: Europe | Peak asphalt: the return of gravel roads |
Copper Peak
Posted by Luis de Sousa on March 31, 2010 - 10:21am in The Oil Drum: Europe
This is a guest post by Jean Laherrère.
|
As is his nature, Jean speaks more with graphs than words. This posts contains over 40 images amounting to 2 Mbytes of data; keep this in mind when proceeding.
Copper has been an important mineral in the world growth, in use for at least 10 000 years. The Bronze Age is well known for having replaced the Stone Age, and bronze is the alloy of copper and tin. Copper has the second highest electrical conductivity after silver. Its price went so high that copper cables are now often stolen, disturbing telephone and Internet communications. Copper is used in piping (water supply, refrigeration and air conditioning). Measured by weight, it is the third most important metal used by man after iron and aluminium (Radetzki 2009). Its use is challenged by new substitutes, but copper production will peak because it is a limited resource amounting to around 1400 Mt. Unlike oil, copper can be recycled, but developing countries’ needs are huge.
What follows is an evaluation of world copper production, then an analysis country by country--there are many charts and graphs so that we may try to understand where we are with regard to future copper production.
I found it fairly easy to model gold production both for the world and the main producers in my 2009 post The gold peak, easier to model than the oil peak (part II). In this post, I have tried to do the same for copper production.
The best source of data is the USGS which provides complete time-series since 1900 for the US and the world. For other countries unfortunately, I had to turn to individual annual reports (from 1932) where the scanned data is hard to read in old reports. The USGS should compile the country by country copper production data from the annual reports in one document like Porter and Edelstein did for the world and for the US: U.S. Geological Survey, in Kelly, T.D., and Matos, G.R. Historical statistics for mineral and material commodities in the United States: U.S. Geological Survey Data Series 140.
Since 1995, the USGS reports its annual remaining reserve estimate as USGS reserves and USGS reserve base. The cumulative production from 6000 years ago to 1900 is estimated at 17 Mt. The world copper cumulative production can be easily modelled with a logistic curve for ultimates of 1200 Mt and 1600 Mt fitting the USGS estimates.
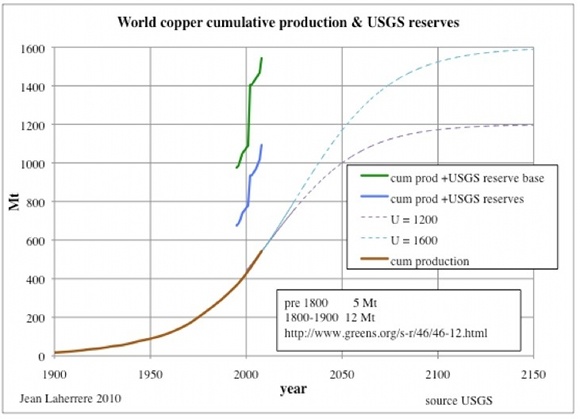 Figure 1: world copper cumulative production, USGS reserves and forecast for ultimates of 1200 Mt and 1600 Mt. |
For these two ultimates the annual production can also be easily modelled and the peak seems to occur soon, despite (or because) the high price increase since 2000. Yet the copper price today is cheaper than in 1900 when reported in 1998 dollars per kg (USGS data). The secondary production is small and decreasing to almost nothing!
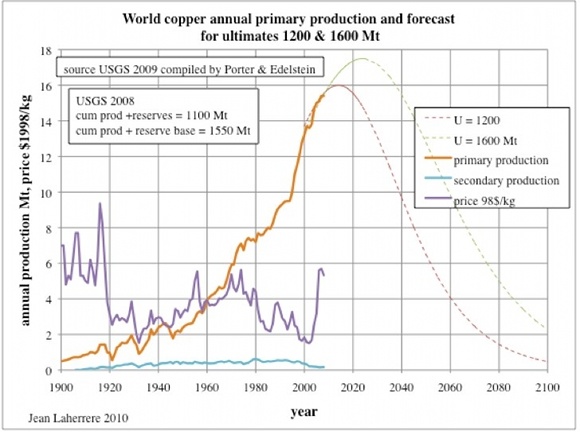 Figure 2: world copper annual production and forecasts for ultimates of 1200 Mt and 1600 Mt and price. |
The eight main copper producers (Chile, US, Peru, Indonesia, China, Australia, Canada and Russia) have been studied and the synthesis is plotted on a single graph. These eight producers have an ultimate of 820 Mt that is about 60% of the world's ultimate.
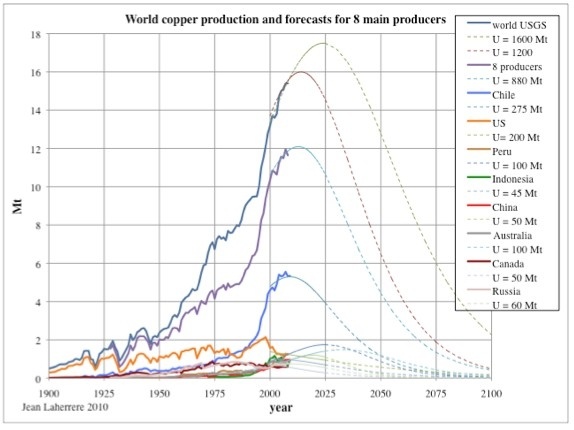 Figure 3: world copper annual production and forecasts for the eight main producers 1900-2100. |
Gavin Mudd in Historical trends in base metal mining: back casting to understand the sustainability of mining[pdf!], a publication from 2009, shows annual copper production starting in 1840.
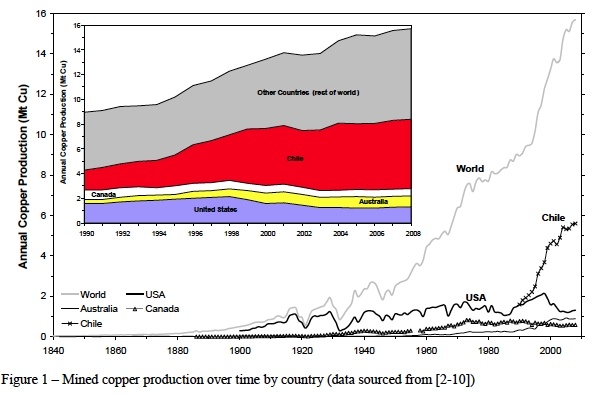 Figure 4: world copper annual production from G.Mudd 1840-2008. |
The details for the eight main copper producers are presented below.
World
The world primary production is less than the secondary production and both added less than the refined reported by the ICSG.
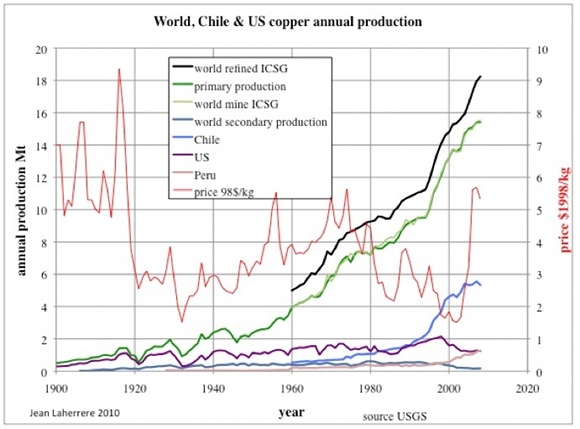 Figure 5: world, Chile, Peru and US annual copper production and copper price. |
The Hubbert linearisation of production data - being the growth of production (or annual/cumulative in %) versus cumulative production - is extrapolated with a linear trend with the aim of estimating the ultimate, but it works only if the cumulative production fits a logistic curve, when in reality there are often several cycles. The present plot for the world shows only a recent trend from 2000 onwards, which can be extrapolated towards 1600 Mt (present cumulative production plus USGS reserve base) but the previous declining trend (1975-1995) was pointing towards 1000 Mt.
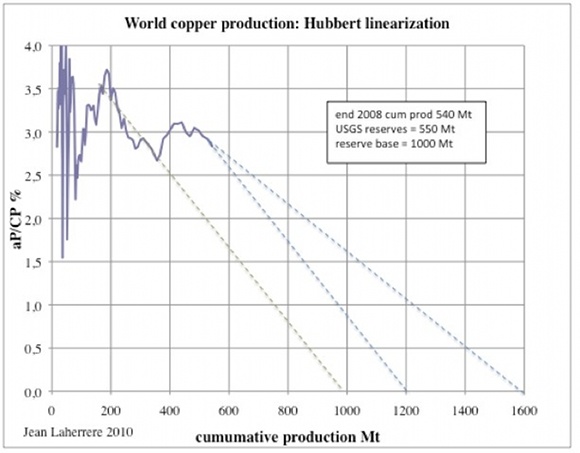 Figure 6: world copper production: Hubbert linearisation. |
The best approach is to rely on the geological inventory of the world potential estimated by the USGS, based on the study of known discoveries and possible yet to find. The USGS does not give a good and precise definition of its estimates reported as reserves and reserve base!
Contrary to the obsolete SEC rules for oil, forbidding reporting of probable reserves (now changed in 2010) the SEC rules for minerals (industry guide 7) allow to report proved and probable. The USGS only changes its data on copper reserves from time to time, when it shows the remaining discovered reserves, but it should be decreased when production isn't matched by new discovery. Only US and Canada reserves have decreased!
The reserves reported by the USGS since 1995 show a poor evolution when plotted in a log scale:
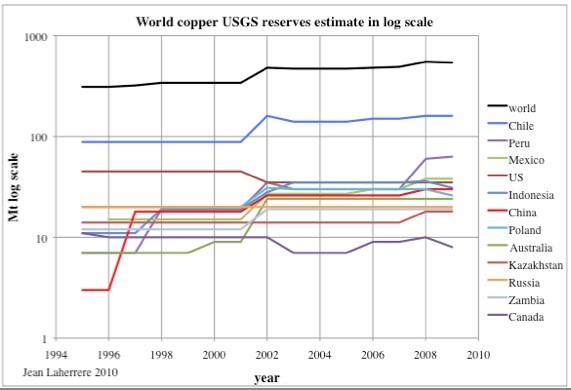 Figure 7: world and main producers copper reserves estimates by the USGS in log scale. |
This poor evolution, such as for Russia with no change during 15 years, means that their estimate lacks good data!
Geoscience Australia in their 2009 report [pdf!] use a more precise definition of resources and report Economic Demonstrated Resources (EDR) for Australia and the world at the end 2008 being 78 Mt and 603 Mt respectively. In its turn the USGS reserves stand at 24 Mt and 540 Mt and the USGS reserve base amounts to 43 Mt and 1000 Mt. USGS reserves look pessimistic compared to Geoscience Australia EDR. The reserve base looks similar, but there should be an upper limit.
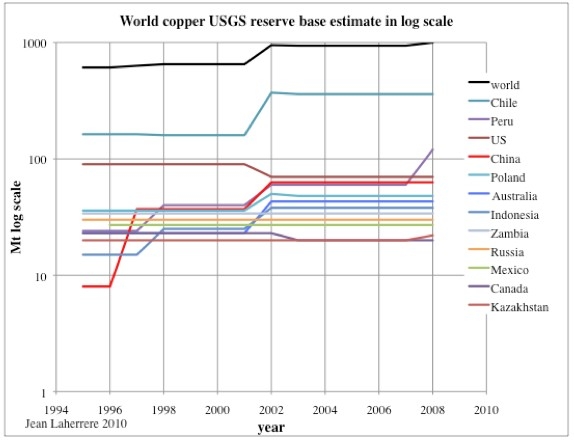 Figure 8: world and main producers copper reserves estimates by the USGS in log scale. |
In mining, economics depends mainly on the grade of the ore and it is important to plot the evolution with time. But my data is not good enough. Gavin Mudd (2009) has a graph showing the decline of the ore grades for the world, US, Australia and Canada, all declining below 1% in 2008. It is difficult to estimate the the point at which production ceases to be economic.
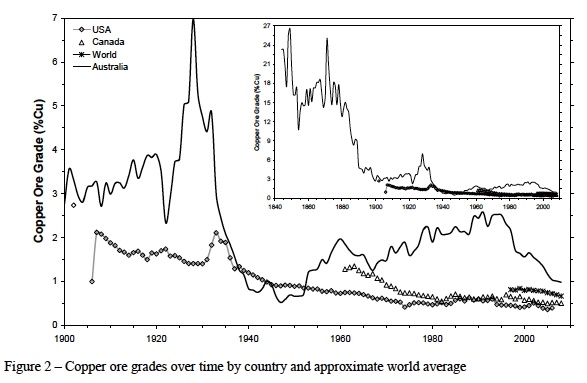 Figure 9: world, USA, Canada and Australia ore grade 1900-2008. |
United States
The cumulative US copper discovery (starting in 1545) from USGS 98-206A is 350 Mt at the end of 1998 and seems very optimistic compared to the USGS reserve base (around 200 Mt with cumulative production).
The cumulative production in 1900 is assumed to be around 6 Mt and it is at 129 Mt at end 2008. We have taken 200 Mt as the ultimate production.
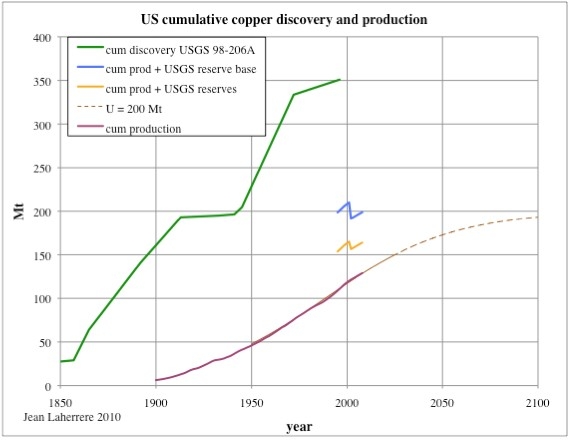 Figure 10: US copper cumulative discovery and production, USGS reserves and forecast for an ultimate of 200 Mt. |
The Hubbert linearisation of production is more reliable, having passed peak, trending towards 200 Mt.
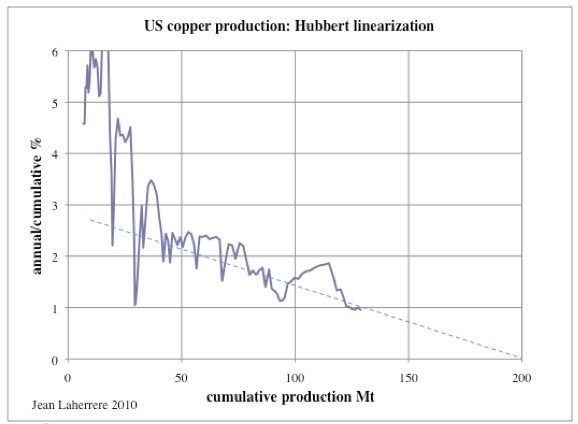 Figure 11: US copper production: Hubbert linearisation. |
The US annual production of copper is increasing chaotically from 1900 to a peak in 1998 at 2.1 Mt, and drops drastically to 1.2 Mt in 2005, despite a sharp increase in price!
 Figure 12: US copper annual production for an ultimate of 200 Mt. |
Chile
The USGS has almost doubled Chile's copper reserves from 1995 to 2009.
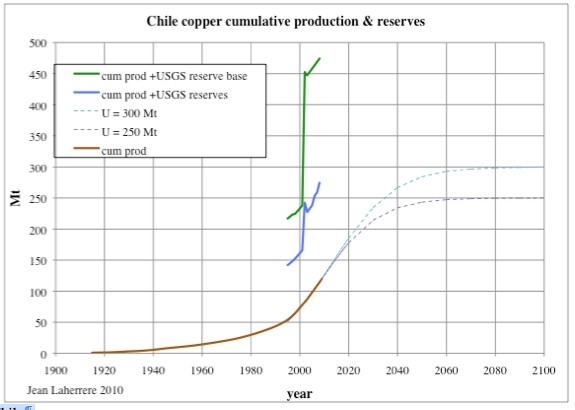 Figure 13: Chile copper cumulative production and USGS reserves andforecast for ultimates of 250 Mt &and 300 Mt. |
We have modelled for an ultimate of 250 Mt because the Hubbert linearisation since 1999 trends towards such value, but also 300 Mt, guessing that 275 Mt is not a bad value.
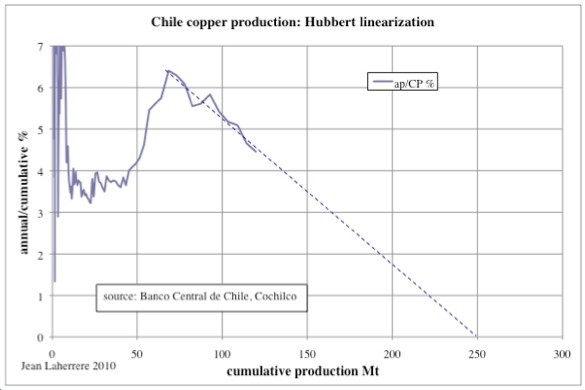 Figure 14: Chile copper production: Hubbert linearisation. |
Chile copper production has peaked in 2007.
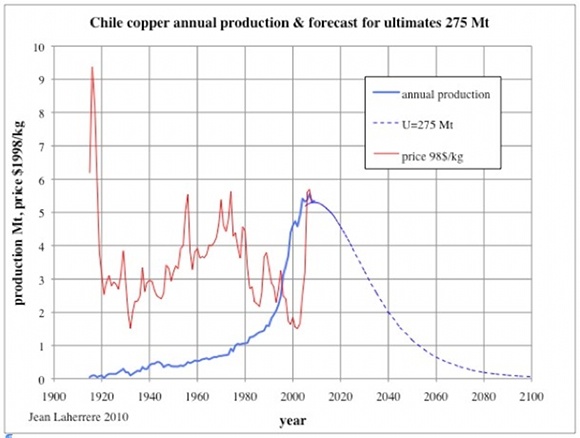 Figure 15: Chile copper annual production and forecast for an ultimate of 275 Mt. |
Peru
Like for Chile, the USGS has doubled its reserves estimate, but in 2008, from 30 to 60 Mt.
We guess that the ultimate is around 100 Mt.
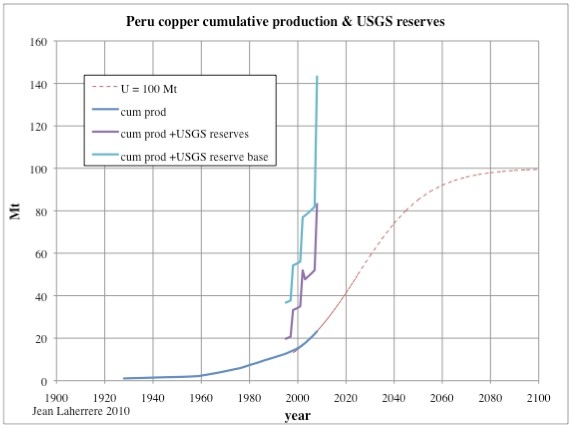 Figure 16: Peru copper cumulative production and USGS reserves & forecast for an ultimate of 100 Mt. |
The Hubbert linearisation is hopeless, being far from peak.
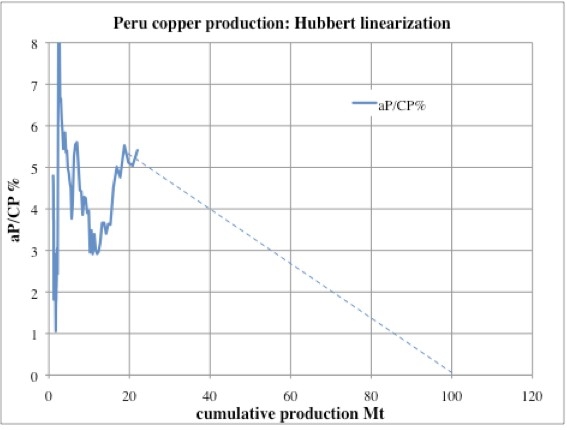 Figure 17: Peru copper production: Hubbert linearisation. |
For an ultimate of 100 Mt, Peru's copper production will peak around 2025 at 1.7 Mt.
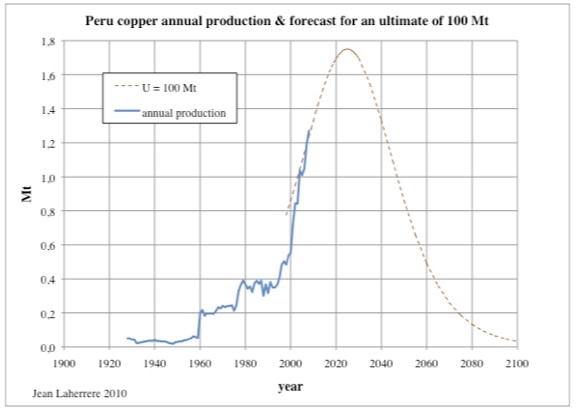 Figure 18: Peru copper annual production and forecast for an ultimate of 100 Mt. |
China
Data for China is hard to check and the USGS has increased its reserves lately. We have taken an ultimate of 50 Mt.
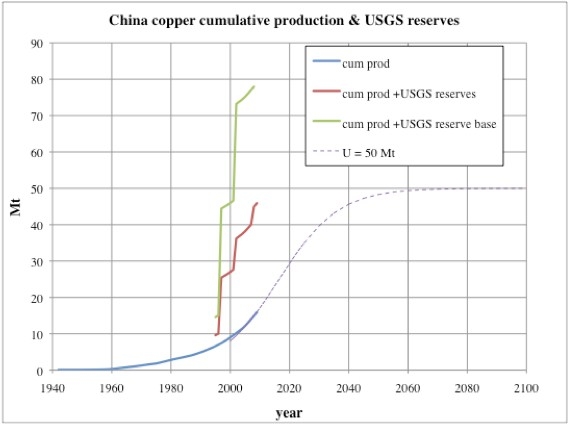 Figure 19: China copper cumulative production and USGS reserves and forecast for an ultimate of 50 Mt. |
The Hubbert linearisation plot trends towards infinite!
The annual production should peak around 2020 at 1.2 Mt.
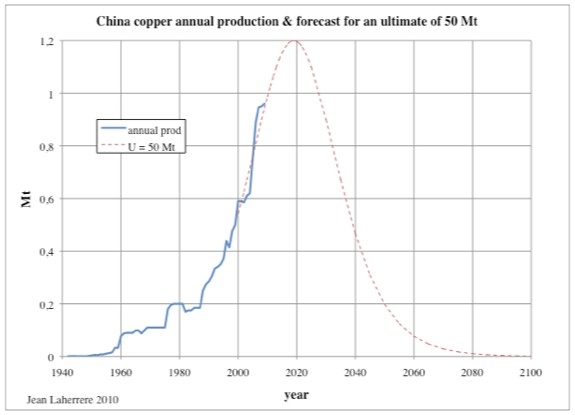 Figure 20: China copper annual production and forecast for an ultimate of 50 Mt. |
Indonesia
The USGS has sharply increased Indonesia’s reserves around 2000, but reduced them last year. We have taken an ultimate of 45 Mt.
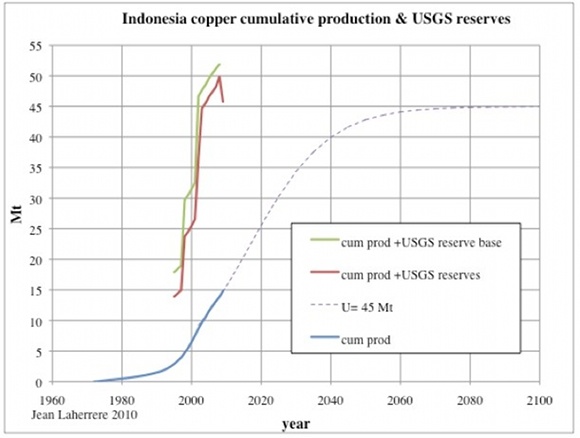 Figure 21: Indonesia copper cumulative production, USGS reserves and forecast for an ultimate of 45 Mt. |
Hubbert linearisation plot is impossible to extrapolate.
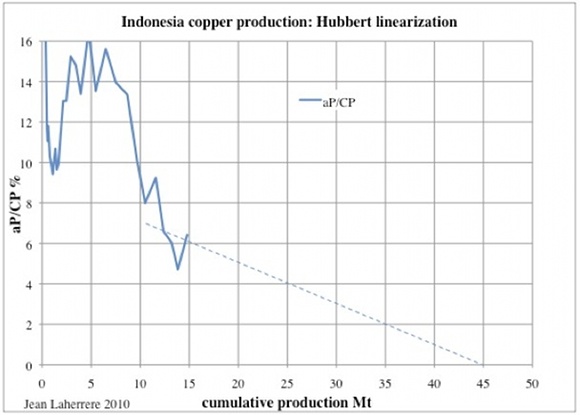 Figure 22: Indonesia copper production: Hubbert linearisation. |
Indonesia copper production has peaked in 2001 and will decline slowly until 2100.
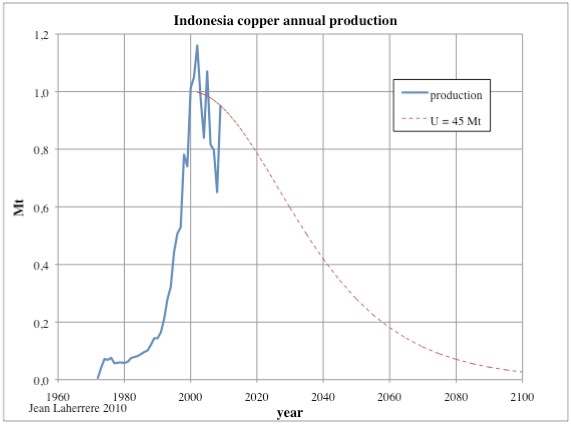 Figure 23: Indonesia copper annual production and forecast for an ultimate of 45 Mt. |
Australia
In the US, Wall Street (SEC) dominates reserves definition and it is good to see a country with a better scientific approach. Australia is a good choice to compare the USGS estimate with Geosciences Australia's estimate [pdf!]. Australia has a better reserve definition for minerals (EDR = Economic Demonstrated Resources).
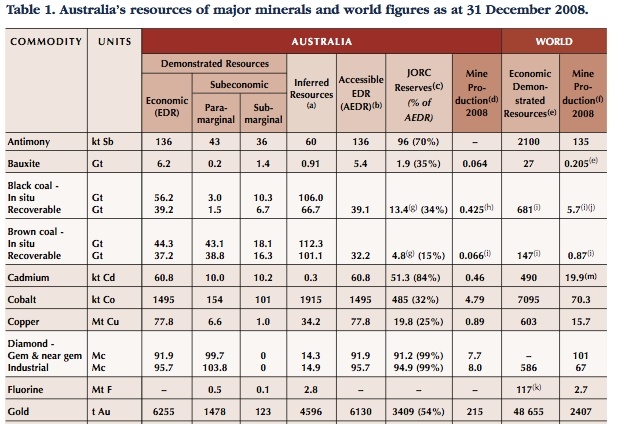 Figure 24: Australia’s resources from Geosciences Australia 2009 report. |
The sharp increase in Australia’s copper reserves comes mainly from the huge Olympic Dam field (copper and uranium) in South Australia. K.F.Bampton in Copper mining and treatment in South Australia [pdf!] displays (in a logarithmic scale) the up and down copper production in South Australia starting around 1840.
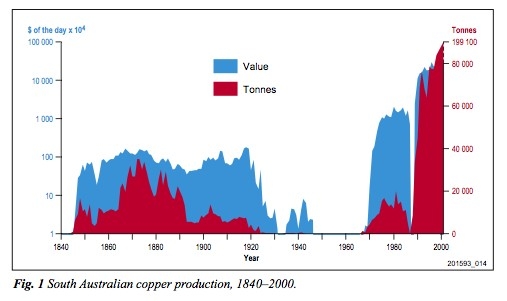 Figure 25: South Australia copper production. |
Olympic Dam copper reserves are estimated at 32 Mt. Australia copper ultimate is estimated at 100 Mt.
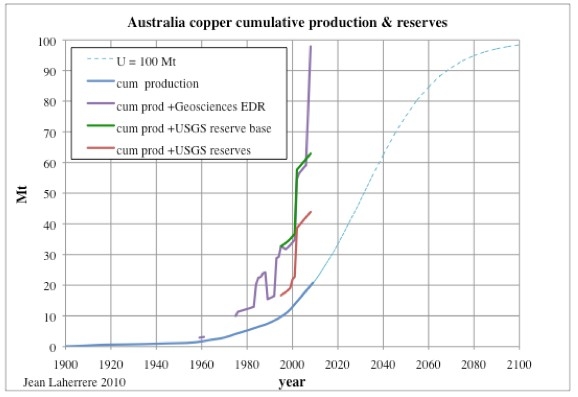 Figure 26: Australia copper cumulative production, USGS and Geosciences reserves with forecast for an ultimate of 100 Mt. |
The Hubbert linearisation is hard to extrapolate!
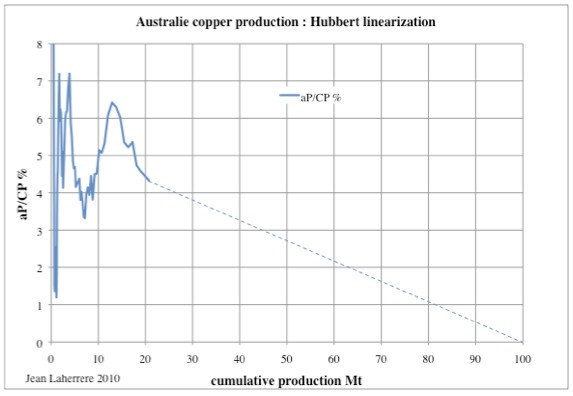 Figure 27: Australia copper production: Hubbert linearisation. |
For an ultimate of 100 Mt Australia’s copper production will peak around 2030 at 1.5 Mt.
But this optimistic future production increase is based only on geological constraints (reserves), yet above ground constraints (Economy) could dampen this forecast into a more chaotic behaviour!
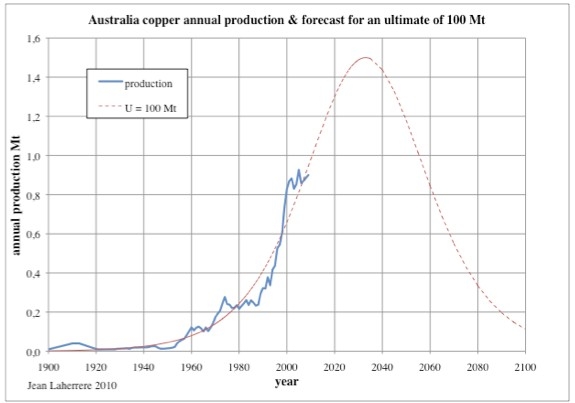 Figure 28: Australia’s copper annual production and forecast for an ultimate of 100 Mt. |
Canada
Canada is another good place to compare USGS and Natural Resources Canada (NRCan) approaches. NRCan reserves are more complete and slightly lower than the USGS reserves. From NRCan we estimate Canada's copper ultimate at 50 Mt.
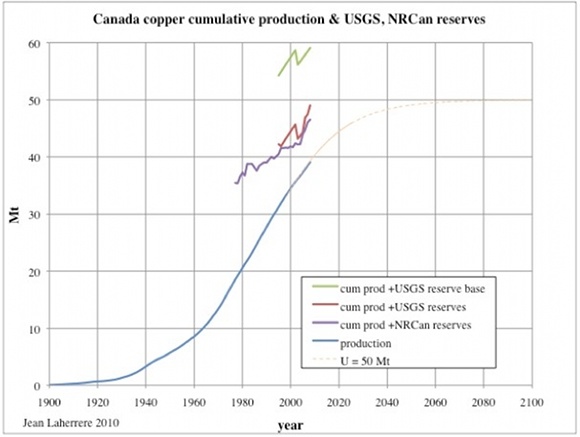 Figure 29: Canada copper cumulative production, USGS and NRCan reserves with forecast for an ultimate of 50 Mt . |
The Hubbert linearisation seems to be trending towards 50 Mt since 1970.
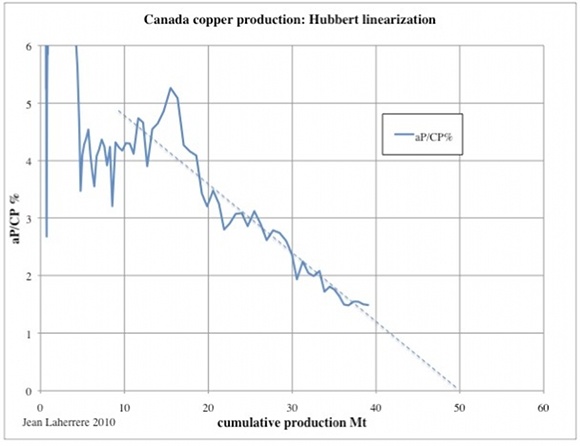 Figure 30: Canada’s copper production: Hubbert linearisation. |
Canada’s copper production has peaked in 1974 and will be producing at half peak around 2015.
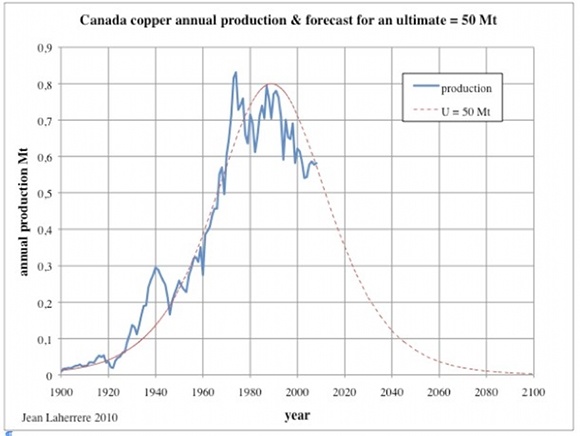 Figure 31: Canada’s copper annual production and forecast for an ultimate of 50 Mt. |
Russia
Russia is a difficult country to get reliable data from, because before the break up of the USSR the data was global and because the cold war data was very imprecise. We have assumed the copper production of Russia during the period of the FSU by taking a certain percentage of FSU data. The USGS reserves have not changed from 1995 to now, despite production, indicating the uncertainty of the estimate. The largest field is Udokan in Eastern Siberia, which displays some negative growth (from 20 to 14 Mt); it was sold in 2008 to be developed and is planned to be producing 0.5 Mt by 2016. We have assumed Russia’s copper ultimate to be 60 Mt.
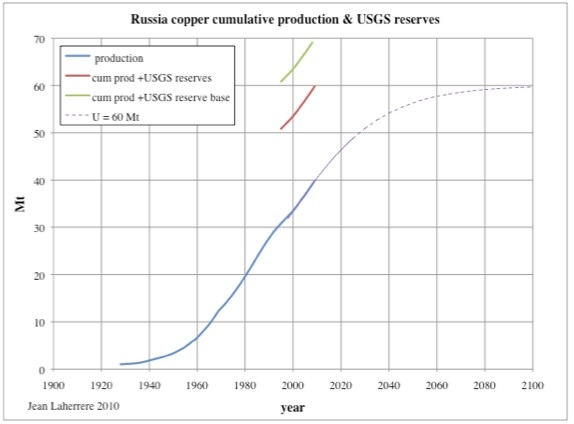 Figure 32: Russia’s copper cumulative production, USGS reserves with forecast for an ultimate of 60 Mt . |
The Hubbert linearisation could be extrapolated towards 60 Mt but it is not reliable!
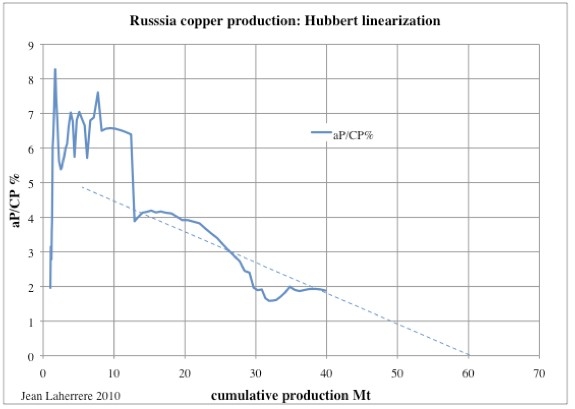 Figure 33: Russia’s copper production: Hubbert linearisation. |
Russia’s copper production has dropped sharply with the break up of the FSU, and is likely peaking now.
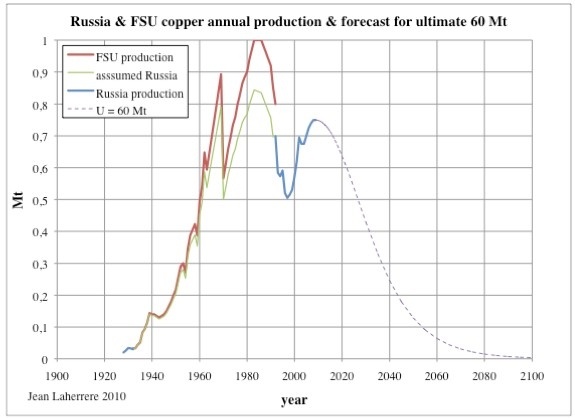 Figure 34: Russia (and FSU) copper annual production with forecast for an ultimate of 60 Mt. |
Copper consumption
The US copper consumption displays a chaotic constant increase from 1900 to 2000, and then a decline. The US consumption peak follows the US production peak.
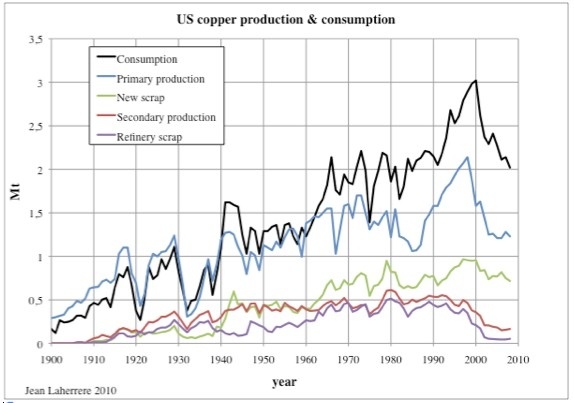 Figure 35: US copper consumption & production 1900-2008. |
The world copper consumption (N. Brewster, Rio Tinto, Outlooks for commodity markets [pdf!] displays a harmonious increase since 1850 but a possible peak in 2006, or just a bump! The real (in 2009 dollars) copper price displays an opposite trend!
 Figure 36: world copper consumption and real price 1850-2008 from Rio Tinto. |
It is hard to find a good graph of the distribution of the world copper use.
This Russian graph (from Copper industry: world production – Part I) shows the large range of use by industry:
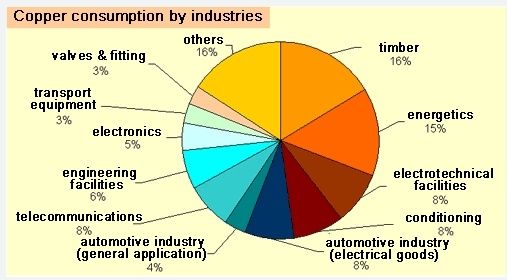 Figure 37: world copper consumption by industry. |
Another good graph on US copper use:
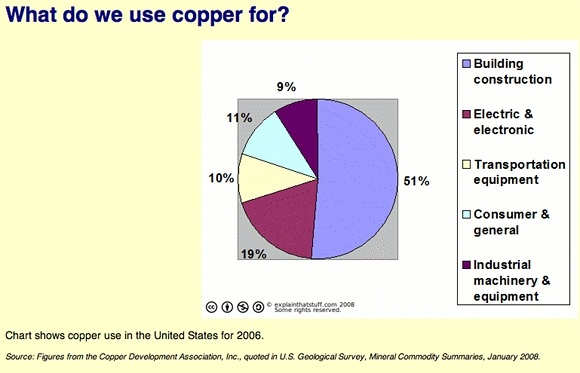 Figure 38: US copper use for 2006. |
Copper & gold & oil
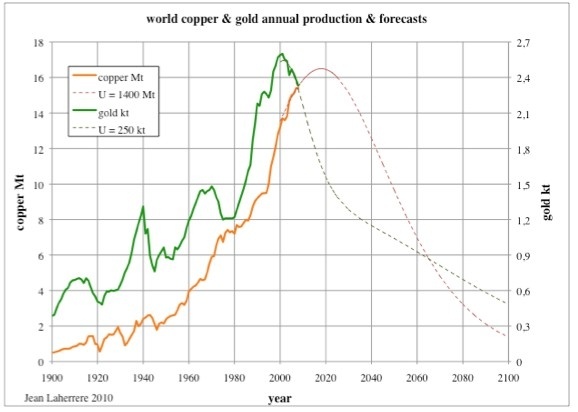
Gold production has peaked in 2000 and copper will likely peak in 2020. Their growth was roughly parallel (with a 20 years gap).
|
Figure 39: world copper and gold annual production. |
Copper's price in 1998 dollars has been chaotic with a sharp increase in 2006 (still, lower than in 1900!), but the gold price was also chaotic.
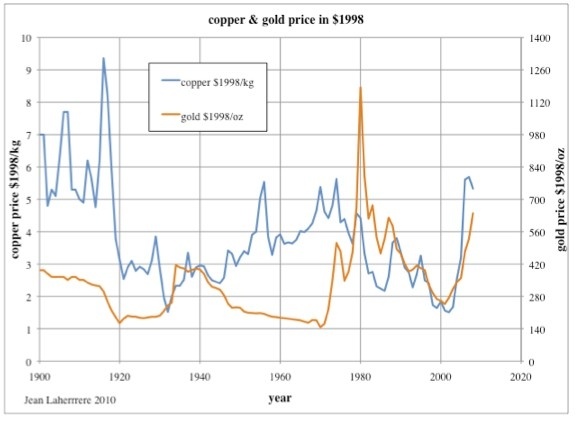 Figure 40: world copper and gold price in 1998 US dollars. |
Since 1980 the copper price has been following the oil price.
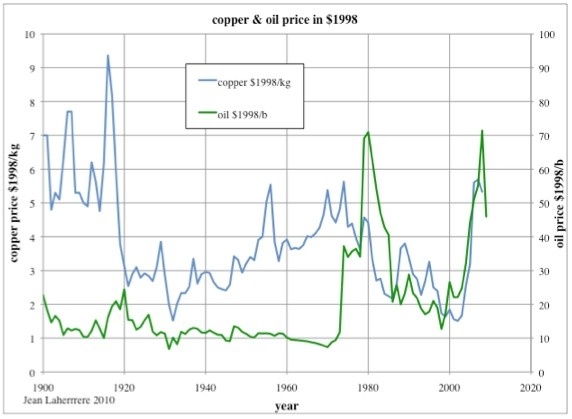 Figure 41: world copper and oil price in 1998 US dollars. |
Conclusions
Copper has been an important mineral in the world growth, in use for at least 10 000 years. The Bronze Age is well known for having replaced the Stone Age, and bronze is the alloy of copper and tin.
Copper has the second highest electrical conductivity after silver. Its price went so high that copper cables are now often stolen, disturbing telephone and Internet communications. Copper is used in piping (water supply, refrigeration and air conditioning). Measured by weight, it is the third most important metal used by man after iron and aluminium (Radetzki 2009). Its use is challenged by new substitutes, but copper production will peak because it is a limited resource amounting to around 1400 Mt. Unlike oil, copper can be recycled, but developing countries’ needs are huge.
Chile and China dominate the world's copper production. But Chile's production peaked in 2007 and China will likely peak around 2020. The future of copper is uncertain!
The Copper peak seems a real concern for many and there are several “Peak Copper” sites. The use of peak xxx has become a fashion following the introduction of the term Peak oil by Colin Campbell in 2001. Peak fat is described by Ugo Bardi.
From Goggle (February 2010) peak oil finds 2 080 000 quotes but oil peak only 91 400 quotes; peak copper finds 53 100 quotes, but copper peak only 24 100 quotes.
The Copper peak is not something new! The only question is when.
Jean has long been a friend and contributor to TheOilDrum, providing insights on such issues as Methane Hydrates, Oil Prices or Gold Depletion. His posts can be browsed here.
Personnel
Editors
Contributors
Peak Oil Primers
Archives
- November 2010 (3)
- October 2010 (6)
- September 2010 (4)
- August 2010 (7)
- July 2010 (6)
- June 2010 (7)
- May 2010 (2)
- April 2010 (8)
- March 2010 (4)
- February 2010 (6)
- January 2010 (3)
- December 2009 (5)
- November 2009 (8)
- October 2009 (12)
- September 2009 (6)
- August 2009 (5)
- July 2009 (11)
- June 2009 (8)
- May 2009 (16)
- April 2009 (10)
- March 2009 (7)
- February 2009 (10)
- January 2009 (15)
- December 2008 (9)
- November 2008 (9)
- October 2008 (9)
- September 2008 (13)
- August 2008 (10)
- July 2008 (14)
- June 2008 (23)
- May 2008 (16)
- April 2008 (12)
- March 2008 (16)
- February 2008 (9)
- January 2008 (13)
- December 2007 (13)
- November 2007 (16)
- October 2007 (22)
- September 2007 (8)
- August 2007 (9)
- July 2007 (16)
- June 2007 (8)
- May 2007 (7)
- April 2007 (7)
- March 2007 (10)
- February 2007 (10)
- January 2007 (12)
- December 2006 (9)
- November 2006 (15)
- October 2006 (4)
- September 2006 (5)
- August 2006 (5)
- July 2006 (9)
- June 2006 (5)
- May 2006 (10)
- April 2006 (9)
- March 2006 (13)
Vital Trivia
License

This work is licensed under a Creative Commons Attribution-Share Alike 3.0 United States License.
Once the rate of oil production peaks and goes into decline, the rate of mineral extraction will likely fall off a cliff regardless of how much there is left in the ground.
Yes, I agree with that. Mining is very dependent on oil in particular. As ore grades decline, the amount of energy required to extract and refine goes up. And as oil declines, that energy becomes more costly. And because of oil's energy-density and portability, no other source of energy can easily substitute for it. And ultimately all other forms of energy depend on minerals extracted and refined from beneath the ground.
The rise of industrialism occurred when more energy led to more and deeper mining for metals and minerals, and more metals and therefore machinery led to more coal, oil and gas, and these in turn led to more mining and metals and minerals and machines, and so forth in one big happy upward spiral. Now we are on the brink of a much less happy spiral downward.
If we wish to express it very cautiously we can say "the future of industrialism is uncertain".
Mining could be dependent upon coal instead, and there's a frightening amount of that available. We mined copper with coal before and we can do it again. Chile has high grade ore and relatively low wages so by being capable of producing large volume can be the determining factor in whether other mines are 'economic'.
Given that about 50% of copper is used in housing, I wonder what effect the use of plastic plumbing pipe has had. It's dropped way off around here, as much to do with installation cost as material price.
We mined copper with coal before and we can do it again
And that was in a time before electric motors/electric mining EQ. And the choice deposits got picked 1st. Going back to that would still mean going after lesser grade ore.
Having some way to make that electric power would be the key.
Given that about 50% of copper is used in housing,
At one time having over 200 lbs of copper was considered hoarding and therefore illegal.
*IF* superconductors ever get to 100 deg C - a large amount of copper could be replaced with new superconductors.
Given that new superconductors on the drawing board require the use of silver, and given the scarcity of silver (less refined silver extant than gold) this would be out of the copper frying pan and into the silver frying pan.
Then things will get interesting....is the energy (and eMergy) value embedded in the superconductor less than the same current capacity/current loss over time of copper.
At one time using 12 gauge copper over 14 gauge in house wiring was a topic for debate once one factored in losses over time and what those losses ment to your electric bill.
All metal and mineral ore grades are in decline, at varying rates of course. A reversion to coal, and it is a major reversion, with lesser ore grades is a double whammy. A far greater pct of GDP is then devoted to energy, metals and minerals extraction and refining, leaving less to other parts of the industrial infrastructure, leaving it ever more top-heavy and therefore unstable.
Lesser ore grades mean bringing huge multiples of what used to brought to the surface for the same amount of end product.
Water too is a major issue in many forms of mining, and is also, in a sense, mined, and is part of the web of interdependencies.
I have but the vaguest notion of the interdependencies of the various components of the industrial infrastructure. But I know they are there, and I cannot see how that web can but other than begin snapping at various points as energy becomes more costly and ore grades continue their decline.
That doesn't mean there won't be contervailing factors in the unwinding, just as shale gas has proved to be for the time being in the hydrocarbon depletion front. They can postpone, but not not avert the ultimate outcomes. In fact, they may well make the ultimate outcome all the more painful as we will have destroyed yet more of our sole remaining resources, the earth's surface ecology - water, soil, oceans, etc.
The majority of the copper used in construction appears to come more from that used in wood treatment as opposed to that used in copper pipe. Go back to the graph showing forestry use of copper. This could be somewhat replaced with zinc. Zinc napthanate rather than copper napthanate etc. Interior uses only require borate, which is very effective and quite safe, but anything outside or exposed needs something less water soluble.
Not to worry!
Exactly what I thought of.
Where is Julian Simon when you need him?
I have a sneaking suspicion Dr. Bartlett was being a little disingenuous with that quotation, I'm not convinced it was ever made... in fact...
He's clearly talking about an economic definition of copper rather than literal. What's it used for.
The uses we have for copper can also be satisfied by other materials. Aluminium for example as wiring. My own house is wired with aluminium, it's a poorer conductor but you just use slightly thicker wires (they didn't). Signalling wires can use fibre optics instead, or even wireless, steel for water pipes, (yes I have steel, rather than copper pipes as well).
Energy is also fungible, I use wood and burn less gas to heat my home, they can make cheaper electricity at the local CCGT plant.
If you have aluminum wiring in your house, be careful - very careful. The reason Al household wiring was banned in N. America is it doesn't bend very well. The resistance increases disproportionately when it is bent and creates hot spots. Back in the day, this led to many house fires. I've seen some wiring with the conductor blackened and the insulation melted away just waiting to cause a fire.
BC, aluminum wiring has not been banned in California, and is not a problem when used properly. The “aluminum is bad” mantra came from a problem that showed up in the early nineteen seventies. Aluminum house wiring was UL approved, and used with little problem from about 1946 until the late sixties. By the early seventies a number of house fires started investigations by government and UL. The upshot of the investigations was that the change from brass screws to color plated steel screws in receptacles was the main problem. For cost and availability reasons, during the Vietnam war, manufactures of common house wiring fixtures found that they could meet the code requirement of a “brass” color by plating like they did the “white” color of the neutral screw with nickel. The difference in thermal expansion between the steel screw and aluminum conductor plus the fact that aluminum has less spring back, and aluminum’s oxide is an insulator caused a progressing increase in resistance, and heating of the terminal. Receptacles must now be marked if can be used with aluminum.
The main conductor leading from the transformer at the street to the meter on the house is typically aluminum, as are any high amperage (100 Amp) lines, such as from a main panel to a sub panel, if such an arrangement is used.
Much lighting wiring is over sized per code, especially since the trend is to low wattage lighting.
Receptacles have to be sized for portable electric heaters, hair dryers (bathrooms), toasters(kitchens), irons and vacuum cleaners. If a house has a central vacuum and portable electric heaters are not used, 14 gauge wire should be more than adequate for any areas but kitchen, bath and laundry; however, most home owners have no concept of amperage so many codes specify 12 gauge as minimum.
Maybe it is time to have different plugs for high and low amperage or some type of circuit analyzing system installed in all new housing that would monitor and record loads on each circuit and alarm when current is high in addition to tripping a breaker.
Wouldn't heavier gauge wiring lose less power to resistance? I've been told that would pay for itself fairly quickly.
Yes, heavier gauge wire has lower loss. You can find wiring size charts on the internet and they are simple to use. Also, tables are on the National Electric Code.
The wires that should be over sized are those that are in continuous use and draw heavy current. That would be refrigerators and air conditioners. By using over sized wires in these applications and minimally sizing all others you will have a net savings of energy.
It makes no sense to oversize a wire to a receptacle supporting a table lamp, especially if it is almost never used, as are most receptacles. You will save next to nothing on a lightly loaded circuit.
The electrical code is more concerned with you setting your house on fire than power losses. Obviously they're related since lost power becomes heat which is an ignition source. I have 10 gauge wires on my solar panels which are only 10 amps. I'm kinda surprised you can use 12 or fourteen gauge wire on a household circuit which are usually like 20 amps.
Any idea what % of household power is lost to resistance? I understand that about 7% of power is lost between the central generator and the home - I wonder what it is in the home?
I doubt that the losses in household wiring are anywhere near what the losses are in transmission, which also includes transformer losses. Voltage drop is proportional to wire length, and good design is for less than a 10% voltage drop (at least when I was taught 35 years ago) in a circuit, although I would consider 10% excessive. However, I doubt that household circuits have any where near that drop because most are relatively short distance and are lightly loaded.
It never hurts to oversize a wire, but size the breaker for the load. It is important to check the breaker when replacing old air conditioners with new energy efficient ones because the amperage is so much lower you can burn out a motor without tripping the breaker.
My house has a 200 A aluminum wire from the transformer to the street, this being almost standard in new construction despite the fact that appliances and HVAC are much more efficient now, as well as houses being better insulated. Because I have nat gas back up on my heat pump, I could run most all of my appliances at once and still draw only about 35 amps (at 240V that the service line supplies).
I thought so too but I guess I was wrong.
http://www.search.com/reference/Julian_Lincoln_Simon
The full quote given above ("the possibility of creating copper and its economic equivalent from other materials") suggests that Simon meant substitution (such as fiber optic for telecom, or aluminium for wiring), not transmutation.
Do you have a direct, original quote from Simon?
OK, Here it is.
However you interpret it, he is clearly saying there are no limits to our access to what are unarguably finite resources because we will always be able to come up with an ingenious technological solution or will always be able to find a substitute for a finite resource that has becomes depleted. He is sure we can do this because his economic theories tell him that physical realities are irrelevant and we will always be able to outsmart nature.
He also said this:
Good luck with that, I believe that world view is profoundly flawed.
If he'd said "or its economic equivalent", you might have a point. But what you quoted clearly includes "the possibility of creating copper from other materials". The man was clearly an ass.
And what does "economic equivalent" even mean? The same monetary value? What would be needed, as copper declines, is the use equivalent, not the economic equivalent. And use equivalence can obviously not continue for every substitute, on a finite planet. This wouldn't have worried Simon, since he had a belief in infinite resources.
I suspect you're reading into the material too hard. It's kind've like trying to divine the truth from religious texts.
I'd say it's fairly clear that he meant that there are substitutes for copper:
US pennies went to zinc about 25 years ago;
Copper pots have gone to aluminium and stainless steel;
Most electrical wiring can go to aluminium, as long-distance transmission has;
Pipes can go to plastic, iron, etc;
Telecom wiring can go to fiber optic;
Wood treatment can go to zinc.
What's left? Internal electronics wiring/circuit boards?
Now, I think a worthwhile followup to the Original Post would be identifying the %'s for the above, as well as how much can be recycled, and how much is recycled now?
That's one interpretation but it goes against what he said. I think of how he might have modified the remark, to mean what you think he meant and it would take a significant modification. He might, for instance, have used "or", as I mentioned, but even that would still include the absurd notion that copper could be made from other materials.
Remember, he said, "Similarly, the quantity of copper that will ever be available to us is not finite, because there is no method (even in principle) of making an appropriate count of it, given the problem of the economic definition of 'copper', the possibility of creating copper and its economic equivalent from other materials, and thus the lack of boundaries to the sources from which copper might be drawn." To get your meaning, he would have needed to say something like, "Similarly, the quantity of copper, and its economic eqivalent, that will ever be available to us cannot be known, because there is no method (even in principle) of making an appropriate count of it, given the problem of the economic definition of 'copper', the possibility of creating copper's economic equivalent from other materials, and thus the lack of boundaries to the sources from which copper, or its economic equivalent, might be drawn."
This is so different from what he said, that he clearly believed in magic or in infinite resources. Either way, he should be classed as a fool, should he not?
Does anyone know what he meant by "the economic equivalent" of copper?
Again, I really think you're parsing his writing too carefully.
The fact is, most people just don't write like constitutional lawyers. They're just not that careful. If you try to tease out every possible nuance, you're like a medieval theologian analyzing the numbers of angels that can fit on a pin.
I'm quite confident that "the economic equivalent" of copper simply refers to substitutes. That fits with a normal economist's viewpoint.
Wow. It would have been incredibly simple to say it in another way, without having to write like a constitutional lawyer. That he chose a fairly complicated way of saying it, suggests that he truly believed in magic and infinite resources. This is not unusual; I come across many people every day who also have such beliefs, including some people here (even the odd main contributor).
I'm not sure why you're trying to defend Simon's words. As I say, they are pretty clear and need no careful parsing, except to get them to mean something different.
Suppose he really didn't mean that copper could be made from other materials (even though that's what he said). Even so, he clearly believed in infinite resources, which is an indefensible position. And yet you're trying to defend it.
That's because I think it's not really plausible to suggest that he meant transmutation, just because he chose an awkward phrasing. I see this often when people are trying to over interpret someone's writings, especially in religion: they come up with tortured, far fetched interpretations to support what they'd like to believe.
Why is this important? Because people are using it to discredit him. I see this too often on TOD: people use what are essentially ad hominem arguments of ridicule because they don't want to do the careful independent analysis necessary. When it comes right down to it, you have to do the research and calculations to understand it for yourself. Otherwise, you just have to trust authority. If you've done the work yourself, it doesn't matter what Simon says.
Sometimes you have to trust authority: I know, for instance, that I don't have the time to really understand all of the science of climatology. I'm willing to believe the climatologists when they say climate change is a big deal. But, I try not to just rely on authority if I can manage it. Fortunately, PO and most limit-to-growth questions are much, much easier to understand than climatology.
Now, I think it's worth saying that in a narrow sense Simon was clearly correct: simple limits to FF, metals and other basic resources are not going to do us in. It will be social choices that will be important: do we choose to limit CO2, for a relatively small cost? Do we choose to preserve wild habitat? Do we choose to educate the poor, give them micro-credit, and reduce population growth? These are social choices: we can greatly reduce CO2 emissions, species extinctions, and population growth and still have a perfectly healthy economy.
Perhaps, but how soon do you anticipate this happening?
http://www.maxtechoil.com/
Thanks, Jean!
I don't know if you are familiar with the new US Minerals Databrowser, produced by one of our readers, Jonathan Callahan, using USGS Data Series 140. This is one of the copper graphics from the Databrowser (which or course, does not disagree with what you are saying).
As I look at the graphic, and the others you produced, it seems to me that the graphs seem to suggest that historically, copper production has been governed mostly by demand, rather than availability. That is, production has ramped up and down to match need. That is consistent with your statements about cycles, and would make modeling difficult, I would think.
The recent run-up in price coincides with the run-up in oil price in the 2000s. It would seem like it might at least partly reflect the higher costs of mining, due to higher costs of oil inputs required for production. Some of the earlier reductions in cost may reflect improved methods of mining, and hence, lower needed price to cover costs and make a reasonable profit.
This type of fact and the likelihood this trend will escalate in the coming years is often overlooked by those who profess that electrification has merit to "save" civilization.
On the local Detroit news, an article ran last week that 6' high chain link fence surrounding a ballpark was stolen. 100's of feet.
One wonders if it was stolen for the scrap value or to fortify some site.
While I was working with Progress Energy thieves were a constant problem, I’m sure they still are. They would break into a storage site with ten cameras aimed at them. These sites are monitored twenty four hours a day with recording devices that store information for months. Today if someone steals copper from the power company the vehicles used by the thief can be confiscated and sold at auction. People risk their lives for a little cash cutting hot wires. Crazy. The same problem with loss of copper to thieves occurred at the telephone company. Someone was stealing catalytic converters from cars in the parking lots around Raleigh for the precious metal in them. It will become a major problem if the economy doesn’t pick up. In the future it will shut down the system.
hotrod
Well, you don't burn copper. Most of it is still around.
The thing about hydro-carbons is that they are complex chains of carbon and hydrogen that took lots of time and energy to assemble. We then BURN them to extract the energy in an irreversible process (poisoning the atmosphere in the process).
Elements on the other hand have always been here in roughly the same proportions. We don't create them and generally don't destroy them. We alloy them, shuffle them around, mine them and take them from one place and put them in another place but pretty much we are playing with the same deck now that was always there. Mining probably takes more energy than any other reclamation effort that we might ever engage in when it comes to second third fourth whatever useage of an element. So in a way, once an element is mined you could say that the hardest work is done. We need to get better at recycling. The dumps are the mines of the future.
SW - I agree with what you are saying but surely the point here is that once all the carbon is in use we can not make any more.
About creating and destroying elements-I'm under the impression that our efforts along these lines are limited to research labs dealing in gram quantities and a few kilos of plutonium, etc, produced in nuclear power stations annually.
But it seems we may have a problem with helium-apparently once it is captured in mining operations and concentrated and shipped it is generally allowed to escape into the atmosphere when it is used.
Evidently it is so light that it migrates right on out into space-or maybe I am totally off base here.
At any rate it seems certain that the concentration in the atmosphere will never be high enough to recover it in useful amounts.
Are we facing a helium shortage too?If so, does anybody know the approximate time frame?
Helium, being so light, does reach escape velocity at atmospheric temperatures.
Any Helium allowed to escape to the atmosphere is essentially lost to humans anyway, though, so it behooves users to recycle whenever possible. (I worked in a magnetic resonance lab in graduate school and we recycled all of the helium used for cryogenic cooling with minimal losses almost twenty years ago.)
Helium, like copper, is infinitely recyclable so that increased prices will encourage more responsible use of helium. Hopefully, we are already past peak helium-filled baloons.
Best Hopes for building a Reduce-Reuse-Recycle society.
-- Jon
Not in my experience. They are sold in huge quantities at fun fairs and are given away all over the place by any organisation targeting young children or their parents, here in the UK.
I don't remember ever seeing a helium balloon before I was 20. It was expensive stuff, even for my dad's research lab.
Helium is some really cool (no pun intended) stuff! Though using it to fill balloons is probably not where our biggest losses occur.
http://scienceblogs.com/startswithabang/2010/03/why_is_helium_so_scarce.php
Why is Helium so Scarce?
Category: Environment • Physics
Posted on: March 17, 2010 7:29 PM, by Ethan Siegel
I read months ago this could be an issue with Thorium powered nuclear reactors. Something about using helium for heat transfer or something (i'd have to look it up). They noted that other gases could probably be used, but helium must be preferred? Sounds like maybe the only sticking point (other then $$$) with Thorium nuclear power.
the only sticking point (other then $$$) with Thorium nuclear power.
Other than the history of man not being able to deliver on the biggest promises, not to mention reactors being targets of war.
Certainly valid points. My attitude on next-generation nuclear is "I'll believe it when I see it - at scale and in commercial production," kind of like my attitude toward IGCC, "cellulosic biofuels," "waste conversion technology," and other schemes and dreams seemingly powered primarily by big burning piles of money.
BTW, when $$$ is a sticking point (and not just capital costs but also the ability to recover those costs), that is often a sign that a technology's energetic viability is also questionable, see the history of in-vessel anaerobic digesters for source-separated organics from household waste as compared to bioreactor landfills or combustion if you don't believe me here...
Thorium reactor designs which use helium are piggybacking on other high-temp designs like the pebble-bed reactor. In such designs, in which the coolant flows through the core of the reactor, helium has the desirable feature of not being activated by the neutron flux. However, in thorium reactors, heat is transferred to the gas in a heat exchanger outside the core, so other gases, such as nitrogen and carbon dioxide, will work fine.
For lots of info on the vast potential for thorium power see
http://www.thoriumenergyalliance.com/
http://energyfromthorium.com/
Radioactive helium would just drift away. And Helium isn't a player in the food chain.
Radioactive CO2 and N2 have the ability to be part of the food chain.
What part of that statement did you not understand? (Oh, that's right. All of it.)
Bill’s comment is right. Several of the advanced reactor designs that use helium use it because it can be used to cool the core directly. If you do not have the turbines gas going through the core you can use nitrogen, or better yet CO2. This removes any problems with radioactive contamination of the turbo-machinery, and allows much smaller, and hence less costly machinery. With a LFTR, (Liquid Fluoride Thorium Reactor) you have a 600º - 900ºc heat source that can power gas turbines, hydrogen generators, (in the Sulfur-Iodine process), Methanol synthesis, gasoline, diesel, Jet A, fertilizers, etc. Essentially you are replacing the energy that oil and coal provide to drive your industry. The only coal, gas, or oil needed is that required for the products chemistry.
You just need LFTR.
Excerpts from Wikipedia:
For large-scale use, helium is extracted by fractional distillation from natural gas, which contains up to 7% helium.
By 1995, a billion cubic meters of the gas had been collected and the reserve was US$1.4 billion in debt, prompting the Congress of the United States in 1996 to phase out the reserve.[4][28] The resulting "Helium Privatization Act of 1996"[29] (Public Law 104–273) directed the United States Department of the Interior to start emptying the reserve by 2005
Current reserves of helium are being utilized much faster than they are being replenished. Given this situation, there are major concerns that the supply of helium may be depleted soon; the world's largest reserves, in Amarillo, Texas, are expected to run out within the next eight years. This might be preventable if current users capture and recycle the gas and if oil and gas companies make use of capture techniques when extracting gas.
Neither energy nor matter can be created or destroyed,
but it can be dispersed.
Dispersion is interchangeble with the concept of entropy. In that context one can do a nuch better analysis.
Recycling will help in the short term but, not in the long run.
Metals chip away, are ground to dust, some rust, and in this way, are very slowly dispersed through time.
And much of it ( according to the pie graph ) is used for building which means copper pipe plumbing and electrical wires. Other materials can be substituted. I replaced some steel pipe with copper recently in my old house. There was nothing wrong with the steel except that it was easier for me to replace it with copper than try to attach more copper stuff to it.
If steel pipes were used before they can be used again. Copper may be the BEST material in lots of cases but it's not irreplaceable for many uses. Copper makes a superior roofing material for instance, but because of it's price, asphalt shingles are generally used instead. For a time aluminum was used for house wiring. It was abandoned because it wasn't as safe as copper, but it WAS safe, and maybe could be made safer if used in thicker guages. It seems to me that there are ALOT of places copper is used where something else COULD be used, and WOULD be used if prices got high enough that they outweighed the benefits offered by use of copper.
Because copper is very recyclable new uses will tend to substitute other materials for a time as price rises while supply of recycled copper will continue steadily. This may tend to dampen non speculation driven spikes in price
As I understand there were basically two reasons aluminum was problematical for household wiring. One was that it is somewhat less flexible than copper and therefore more prone to breakage within its insulative casing if bent too much. Secondly, there were problems with oxidation buildup on connections, especially AL->CU connections. Both problems could be solved relatively easily even just with more conscientious use practices.
And the current losses over time monitized as the electric rate paid can exceed the price difference of the wiring as I was once told.
This is definitely true. Good observation!
http://www.maxtechoil.com/
With all due respect to Mr. Laherrère, I do not believe that the Hubbert Linearization technique has much to contribute when looking at copper or most other minerals. The real test of HL forecasts can be had by 'backcasting' -- only using data points up to some earlier date and then seeing how well the fit predicted production during the intervening years. Performing such validation tests will yield completely unsatisfactory results for the examples shown above. Another thing I find missing in most HL fits is any error analysis. My own investigations into using HL for oil production forecasts show huge error bars in most cases and leave me wondering why people continue to pursue this technique.
But HL is not the only focus of the article. I do believe that Peak ~Mineral~ is a very important issue and should be thoroughly investigated. Its is for this reason that we have set up the US Minerals Databrowser where one can generate graphs similar to those above for the entire set of minerals contained in the USGS Dataseries 140.
One of the charts in the US Minerals Databrowser addresses the prices from an economists' point of view by plotting adjusted price (in 1998 dollalrs) vs. global production. The assumption is that the commodity of interest is globally fungible with the US price a proxy for some general 'world price'. These charts for gold and copper help make sense of what Laherrère curiously describes as a 'chaotic' price evolution.
Having reviewd the price evolution charts for the entire list of minerals I can say that prices before WWII varied tremendously for many mineral commodities. Only after WWII did mechanization reach out to the furthest corners of the globe and bring rapidly increasing supplies to a genuinely international market. The price evolution charts therefore only cover the period from 1950 onward.
The general trend for most minerals since 1950 has been toward lower price and increased production -- toward the lower right in the charts below. Moves straight up as seen in gold circa 1980 indicate speculation while moves to the upper right indicate that a commodity is becoming increasingly dear, though not yet in short supply. In the two graphs below it looks like gold has reached an actual geologically driven peak -- increasing price at lower production, while copper is so far only becoming more expensive (dramatically so!).
It is important to remember that the interplay between supply and demand is also an interplay between geological constraints and economic necessity. The 'peak demand' meme is one to keep in mind. Browsing through the Minerals databrowser you will see that the asbestos world production curve should make it a poster child for the HL method as it fits the logisitic curve better than most other minerals. The only problem is that peak asbestos was determined entirely by a falloff in demand.
So what are the chance of demand for copper changing? Could we possibly get by using less copper if it were to become expensive enough? One more chart from the databrowser showing the 30 year history of US copper usage by industry demonstrates that consumption can go down in a pretty dramatic fashion as it did for copper between 2000 and 2003. For electrical products, the drop may be the result of offshoring the production of those products. But the housing industry was still strong in those years.
All in all, I think this is an important topic but I believe a modeling approach, particularly HL, is inappropriate. One gets a much better picture of the situation by actually reading the reports put out by the USGS. From the 2010 Minerals Yearbook section on copper:
Peak production and peak demand will be determined ultimately by peak price.
Best Regards,
-- Jon
It seems to me we have a lot of different things going on with copper:
1. Extraction is very energy dependent, so cost of extraction tends to vary with the price of oil.
2. Ores are getting to be of lower and lower quality.
3. Techniques for extraction are getting better over time, using less energy (one of the true forms of energy efficiency.)
4. Other metals can be substituted for copper, if the price gets high enough.
5. Economies around the world have been growing, generally pushing up the demand for metals.
6. Financial issues affect demand. The easier it is to get credit, the more building will be done, and the more copper will be needed. (This is true for other metals as well.) Peak credit will likely determine peak demand. (Or perhaps the limit will be determined by net energy available for uses such as mining.)
It seems to me that most of what we are seeing can be explained by these factors.
What we see in the world production graph is continuous growth in copper use, as world economies grow. It may be that one area of the world grows faster than another, as one area reaches lower ore concentration, or has lower labor costs. I would expect costs and production to vary with the six things listed above.
It seems to me too, that the when the peak occurs and the shape of the downside of the curve, is likely to be defined by the above factors. In fact, if the credit unwind gets to be a major issue, it could lead to a very steep drop in demand, and hence a very steep downslope on the copper production curve.
Like Jon, I am not convinced that Hubbert's Linearization will work very well for copper.
HL is a heuristic at best, and is unexplainable from first principles, due to ore grades etc.
I wonder if these graphs include still-expanding estimates for the Pebble Mine reserve in Alaska?
http://www.pebblepartnership.com/node/224
Looking over the headwaters of Upper Talarik Creek, with the mine site, Frying Pan Lake, and Sharp Mtn in background.
Pebble, a site not without controversy. The watersheds in the mine/s' footprint are part of the headwaters for the LAST LARGE wild salmon fishery left in the world. Nothing like a huge earthen dam holding back a toxic tailings lake in a wild wetland. Just to make things better the Pebble site is centered in a fault line ripped region that sits on a thousand mile long spine of active volcanoes.
Pictures like the above show the complex physical reality underlying the simple multicolored graphs quantifying reserves. The real Pebble dilemma, do we develop it now while and can afford the best possible current environment protecting design or take a gamble and wait? If things go well we will be able to do a better cleaner job with a smaller footprint in the future. If they go as so many on this site think they will, the copper, gold and molyB will be ripped out of the ground as quickly and cheaply as possible to hell with what havoc is wreaked.
On Olympic Dam things are in limbo for now. The anti-nuclear State Labor Party was narrowly re-elected two weeks ago. The mine expansion needs huge amounts of electricity (.7GW), diesel and explosives. The water supply currently from groundwater needs to increase five fold via a desal plant on the coast 300km away. That desal seems unlikely to get approved with an announcement due in July. However under a Plan B the coast is still not spared from heavy activity. Most (70%) of the copper concentrate will be shipped to Guangzhou in China where both copper and uranium will be extracted.
http://www.world-nuclear-news.org/ENF-BHP_Billiton_outlines_Olympic_Dam_...
This helps in a number of ways; China has cheap labour and unrestricted coal power while it gets Australia off the hook with finding more water and energy. Shame about exporting all those jobs though.
As a frequent visitor to Hong Kong, Shenzhen and industrialised Southern China, I marvel at the local population's ingenuity and determination to recycle all manner of materials.
In the back streets of Hong Kong, I have seen workers sitting in the street, taking hammers and cutters to old electric motors from washing machines etc, to extract the copper windings and the aluminium castings.
In the UK, under a boiler scrappage scheme, water heating boilers are cut up to extract the copper tubes and flat plate heat exchangers. White goods and appliances are regularly shipped to India and China, to be returned to the recycling chain. With high labour costs, we seldom recycle locally. With empty shipping containers going back to China, and the smelting plants being located in Asia, the balance of global economics has stimulated this movement of scrap metals from West to East.
There have even been thefts of cast iron street drain covers in the UK, creating serious hazards to drivers - as a result of the price of scrap iron escalating a few years ago.
2020
http://news.bbc.co.uk/1/hi/business/8594719.stm
And the price of iron ore has just jumped from $62 per tonne to $105 per tonne, literally over night. And guess why? ... Because of strong demand from Asia (read China). I can see people starting to trade in all their cast-iron railings outside their town houses soon.
People, wake up! The Asians have the money and the power to bid up anything they want. The West is in trouble. War looms me thinks.
The West is in trouble. War looms me thinks.
That works better (the other is to blame) than yourself is to blame or your leadership class is to blame.
If the choice is the leadership or war - war will end up being the choice unless you have leaders in leadership VS a grifter class.
Unfortunately the "ingenuity and determination" often results in an incredibly toxic mess. Copper wiring is commonly burned in open piles to remove the insulation, resulting in contamination of the local environment that will last for centuries.
http://china.usc.edu/ShowArticle.aspx?articleID=769&AspxAutoDetectCookie...
So while it is true that all the copper ever mined still exists, the recycling of it will likely mean an ever increasing toxic load in the biosphere.
Chris
India also has a cottage electronics recycling industry: poor people in alleys burning the copper off of motherboards, with toxic smoke billowing in their faces.
I think this is the same person who said natural gas was about to peak and start a steep decline.
Those charts were very convincing as well
An interesting article, but along with others I don't think the techniques used for predicting conventional oil production can be used for predicting copper production.
Copper is much more akin to oil sands. The problem is not finding the reserves, it's figuring out a way to make money mining and refining them.
The decent (>10%) copper ores were mainly found and depleted by 1890 (http://www.theoildrum.com/files/JL_Cu_09_OreGrades.jpg). These were like the Spindletops of the mining world. Then the waterflood equivalents, the mines with >3% copper came into their own.
But by 1940 these too were just about depleted. Since then, the world had mined steadily lower grades of oil-sand-equivalents. As with oil sands, there are really large reserves out there, and the cut-off is not a specific copper concentration, but the economics of a particular deposit. The Olympic Dam mine in Australia, for example, is both economically more attractive because the associated uranium is very valuable, and politically dangerous as a result of being associated with that same uranium.
For those interested, at the ASPO-Denver conference this year, Vince Mathews, Director, Colorado Geological Survey gave an informative presentation titled World Mineral Demand and Security
Thank you for sharing this informative and insightful piece. I found the graph with the breakdown of copper's uses to be particularly interesting and somewhat surprising. When I picture the effects of peak copper I am prone to thinking about its effects on building and maintaining electric grids, especially for projects involving long transmission lines such as remote or offshore wind farms. However, I see that "electric and electronic" uses constitute only 19% of copper demand, while "building construction" demands the most at a whopping 51% of the total. I assume some of the total is structural material (bronze etc.) in addition to use in residential and commercial boilers and other domestic equipment. I'd also be curious to see a further breakdown of the building and construction component; does this include a building's internal electric grid, for example, or is that counted under "electric/electronic?"
It would also be interesting to see a chart illustrating changes in usage patterns over time, and I wonder whether an increase in the electric sector's share could be expected in a world shifting to dependence on wind, hydroelectric and other energy resources most available in increasingly remote areas, not to mention transporting power to or from increasingly remote unconventional oil mining/refining areas (see discussion of shale oil refining and Heading Out's post from this past weekend)? I see a parallel here to the increase in demand for natural gas from the power sector, a big part of the sustained price increases since the 1990's that have led to the development of unconventional gas reserves (shale), where the share of total gas demand from the electric power producing sector increased from around 20% to 40% over the period of a decade or so (I do not have the exact figures offhand but that is the general idea).
Here, the U.S. usage chart is from 2006, before at least the full-on collapsed housing and construction markets we have today. So it is also possible that an increase in demand from the electric power sector could be at least partly offset by a decline in demand for new construction uses, as well as by an increase in recycling.
Edits: Looking back up now, I see that one of the other commenters did provide this data above, and while drop in demand from the building sector does account for a substantial share of overall decrease in U.S. demand, demand from "electric and electronic products" has declined as well by an even greater amount. Granted development of renewables in the early 2000's was also slower than it is today, and I still wonder about overall share of demand from the electric grid, particularly since grid infrastructure needs upgrading in many areas regardless of use of renewables, and this area has not consumed a significant share of copper production in a long time. Substitution may occur first in other areas where the use of copper is less essential, such as piping and ductwork, or ornamental brass in construction.
To the poster above sarcastically (it seems) drawing the comparison to peak gas, a sustained rise in price (not seen yet) would be expected along with a production peak, but a rise in energy costs and progressive decline in ore quality and location, and accompanying increase in environmental and other externalities, suggest that price increase could be on its way. You could say that with production of many metals shifting to large-scale labor-intensive and environmentally destructive mining in the Third World, as well as the emergence of black markets in some cases such as rare earths, we have already seen an increase in the human toil (and bloodshed) cost of metals, even if this has not translated into a price increase in the "civilized" world.
And even if North American gas reserves have dramatically increased and the price leveled in recent years, we have in fact seen the long-term sustained price increase mentioned above that has made unconventional gas economically (though not necessarily energetically) viable. Again, what remains to be seen is whether long-term supply predictions pan out or whether they sputter due to poor EROI of hydrofracking and other energy intensive exploration and drilling activities, or environmental problems like air and water quality or CO2 intensity. Keep in mind we are only a few years into intensive shale gas production on this continent, but already it has reached 40% of total production in the U.S.; meanwhile, it has become clear already that the activity is far from the innocuous and noninvasive job creation machine many gas companies initially claimed when staking out new drilling territory in the Marcellus and elsewhere. The same could be said for energy-intensive copper mining operations with large footprints.
The questions that spring to mind:
1) how much of copper's current uses have an easy substitute?
US pennies went to zinc about 25 years ago;
Copper pots have gone to aluminium and stainless steel;
Most electrical wiring can go to aluminium, as long-distance transmission has;
Pipes can go to plastic, iron, etc;
Telecom wiring can go to fiber optic;
Wood treatment can go to zinc?
What's left? Internal electronics wiring/circuit boards?
What are the %'s for the above? and
2) how much can be recycled, and how much is recycled now?
I think an interesting question is: what if there was no copper mining for the next twenty years?
Nothing new out of the ground.
What then?
Obviously, the price of copper would rise. Many substitutes could be used for wiring, pipes and so forth.
Perhaps for some things, there is no easy substitute for copper. However, we can also recycle copper quite easily. Maybe people would start recycling their old air conditioners and so forth, due to the high prices for copper scrap.
At a price of, say, $50 a pound in today's dollars, how much copper scrap would be available? How much would demand decline due to substitution?
In other words, we might find that we can get by pretty well without any new copper, maybe for twenty years.
I propose this as a thought exercise. We have this habit of thinking that the "industrial economy" "needs" X amount of copper. But things are actually quite a bit more flexible than that.
things are actually quite a bit more flexible than that.
Boy, that would be an important concept for someone on TOD to really explore.
Anybody mentioned Mongolia?
Today's news:
Rio Tinto has finalised a new agreement with the Mongolian government for the development of a $4.4 billion copper-gold project in the country.
Under the investment agreement, the Mongolia government will own 34 per cent of the company holding the license for project, which is being developed by Rio Tinto and Canada's Ivanhoe Mines.
Rio Tinto says the development phase of the project will now start, with production to commence in 2013.
Output will be ramped up over five years to a full production rate of 450,000 tonnes of copper per year, with substantial gold by-products.
The $4.4 billion project was initially expected to cost closer to $2 billion, and Ivanhoe originally planned to commission the mine last year.
source: http://metalsplace.com/news/articles/33565/rio-tinto-in-a-44b-copper-gol...
And then there's Snowdonia, North Wales, but we don't allow mining there because it nice countryside (seems we don't care about wrecking the countryside elsewhere as long as it's a long way away).
How much copper is in North Wales?
"Disseminated copper mineralisation, locally with gold
enrichment, occurs at several localities associated with
Caledonian50 intrusive rocks. The best known deposit
is Coed y Brenin, near Dolgellau in North Wales. This
deposit contains 200 million tonnes grading 0.3% Cu,
with trace gold. Coed y Brenin lies within the Snowdonia
National Park and proposals to mine it in the 1970s met
considerable opposition. Up until 1914 a breccia pipe
containing copper-gold mineralisation was worked at the
Glasdir mine close to Coed y Brenin, with total production
of about 75 000 tonnes at 1.5% Cu."
Source: http://nora.nerc.ac.uk/7977/1/OR09041.pdf
British Geological Survey Commodity Profile: Copper Internal Report OR/09/041 2009
This is a very informative and accessible 33-page document about copper, its geology, production and use.
(There is, of course, absolutely zero chance of mining in Snowdonia National Park at least until Hell freezes over.)
There's no shortage of 0.3% copper ore in the world (or Arizona). I'm not sure anyone would mine it even if it weren't in a national park.
RTZ was pretty keen!
Location , location, location.
The (full, un-ellipsissed) link to the Gavin Mudd paper is:
http://civil.eng.monash.edu.au/about/staff/muddpersonal/2009-CMS-03-Base-Metals.pdf
Full Reference:
Mudd, G M, 2009, Historical Trends in Base Metal Mining: Backcasting to Understand the Sustainability of Mining. Proc. “48th Annual Conference of Metallurgists”, Canadian Metallurgical Society, Sudbury, Ontario, Canada, August 2009.