A picture of depletion
Posted by Heading Out on June 1, 2005 - 6:29am
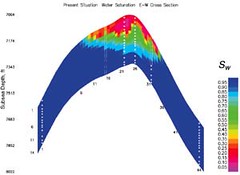
For most people there was some one thing that brought the reality of Peak Oil home to them. For me it was this picture, from a paper by Dogru, Hamoud and Barlow in JPT in February 2004. The reference, to the paper "Multiphase Pump Recovers More Oil in a Mature Carbonate Reservoir" can be found here. It shows a vertical slice taken through the Abqaiq oilfield in Saudi Arabia, using an instrument that measures the relative fluid densities at different levels in the field.
The shape is that of the carbonate rock which is the oil reservoir, although the vertical scale has been exaggerated considerably to show the current contents of the field. By using different colors the authors have shown the different fluid densities, and these can simply be translated into four zones. Over time the field has been injected with water (the blue zone) and this has pushed up the oil (the green zone) into the wells. The red is the overlying gas cap. When the reservoir was untapped it was likely all red and green. Ater all these years of pumping you can see how little of the green - the oil - remains. The field is about 800 ft thick from top to bottom and about 1.5 miles below the surface. If there is a picture that speaks to depletion this to me, is it.
The models which King Hubbert, Colin Campbell, Jean Laherrerre and Kenneth Deffeyes have shown valid all show a significant drop in production as an oilfield comes to an end. This one is, very obviously, that close and one must therefore accept that it is one of those that the new field production of Abu Sa'fah and Qatif is offsetting.
However it is perhaps appropriate to make a gentle coughing sound and point out that there are segments of Ghawar in the north that are also more than 50% extracted, and these too must be considered in the production decline that is being offset.
It is not clear if the current reduced production at Abu Sa'fah and Qatif, reported to be 650,000 bd, rather than the planned 800,000 bd, is due to production problems, or if is just that they have not yet completed drilling the planned number of wells.
Going back to 1990 some 792 oilwells produced around 8.2 mbd, for just over 10,000 bd per well, by 1998, as quoted earlier, Saudi production was down to around 5,140 bd per well. They are now down to somewhere around 3,500 bd per well. Which may explain why their planned production is not quite there yet. Unfortunately it is likely that this downward trend will continue. And since the last development cost around $1.2 billion one can understand how expensive it is going to be to actually increase overall production, when they get more drilling rigs.
UPDATED To include the reference to the paper (thanks Anonymous). And re-updated to reflect the papers new location (thanks Tim).
The shape is that of the carbonate rock which is the oil reservoir, although the vertical scale has been exaggerated considerably to show the current contents of the field. By using different colors the authors have shown the different fluid densities, and these can simply be translated into four zones. Over time the field has been injected with water (the blue zone) and this has pushed up the oil (the green zone) into the wells. The red is the overlying gas cap. When the reservoir was untapped it was likely all red and green. Ater all these years of pumping you can see how little of the green - the oil - remains. The field is about 800 ft thick from top to bottom and about 1.5 miles below the surface. If there is a picture that speaks to depletion this to me, is it.
The models which King Hubbert, Colin Campbell, Jean Laherrerre and Kenneth Deffeyes have shown valid all show a significant drop in production as an oilfield comes to an end. This one is, very obviously, that close and one must therefore accept that it is one of those that the new field production of Abu Sa'fah and Qatif is offsetting.
However it is perhaps appropriate to make a gentle coughing sound and point out that there are segments of Ghawar in the north that are also more than 50% extracted, and these too must be considered in the production decline that is being offset.
It is not clear if the current reduced production at Abu Sa'fah and Qatif, reported to be 650,000 bd, rather than the planned 800,000 bd, is due to production problems, or if is just that they have not yet completed drilling the planned number of wells.
A total of 151 wells, some for water injection, will be drilled in Qatif field, while another 29 wells will be drilled in Abu Saafah. Some 61 old wells at Abu Saafah will also be rehabilitated.The wells at Abu Sa'fah will raise its production from 195,000 bd to 300,000 bd. (Doing the arithmetic this means that the new wells will average somewhere between 3,000 and 4,000 bd in the two fields).
Going back to 1990 some 792 oilwells produced around 8.2 mbd, for just over 10,000 bd per well, by 1998, as quoted earlier, Saudi production was down to around 5,140 bd per well. They are now down to somewhere around 3,500 bd per well. Which may explain why their planned production is not quite there yet. Unfortunately it is likely that this downward trend will continue. And since the last development cost around $1.2 billion one can understand how expensive it is going to be to actually increase overall production, when they get more drilling rigs.
UPDATED To include the reference to the paper (thanks Anonymous). And re-updated to reflect the papers new location (thanks Tim).
“Considering the many productive uses of petroleum, burning it for fuel is like burning a Picasso for heat.”
—Big Oil Executive
Contact
- Content: editors at theoildrum dot com
- Tech support: support at theoildrum dot com
License

This work is licensed under a Creative Commons Attribution-Share Alike 3.0 United States License.
They are not going to increase production. Rigs or no rigs.
Well it is highly unlikely. But having the physical explanation as to why this is, is hopefully helpful to an overall understanding of the situation.
It would be very handy to have maps, or better, satellite images of the Saudi oil fields. I keep hearing the names Ghawar, Qatif, etc., but I do not have any idea where they are located in Saudi Arabia. Any links?
Here's the main link to UT's map site, http://www.lib.utexas.edu/maps/index.html
Here's another I got by googling, http://www.ndu.edu/inss/books/Books%20-%201998/Military%20Geography%20Ma...
There are many more if you look.
Just a little note from the oil guy. The optimum reservoir type for secondary recovery with water injection is sandstone. This is because it has a more reliable permeability (interconnectedness of the pore spaces between grains of sand). Carbonates typically have a wildly variable pore structure, but their permeability can be improved by acidizing. Sandstones can produce stripper amounts for decades - carbonates generally do not, with the exception of very densely compacted ones.
My family has oil property leased by ExxonMobil in the Hawkins field in East Texas that is still putting out gas, oil and condensate. These wells were drilled in the late 1950's into a sandstone reservoir.
This is secondary recovery we are looking at in Saudi, from a carbonate reservoir. Primary was when there was actually reservoir pressure driving some wells. When this is over, it will be very, very over. After water injection, acidizing and washing, this sucker will be bone dry.
And let's be conservative here and suppose that Ghawar, plotted in similar fashion, looks similar as well, but with more oil. Note that as the production declines, the oil moves up into the top of the reservoir. When the oil/water contact barrier is at the halfway point (the light blue region on the Abqaiq chart), nearly 2/3 of the oil is gone.
If you want to know how much is left in Ghawar, you need to know the depth of the outermost producing wells in the field (the ones that defined the limits of the reservoir), and the depth at which they are injecting water today. They will not drill any deeper for an injection well than is necessary, as it is stupid to inject at 12,000' if the water is already at 9,500'. It is an unnecessary drilling expense, and engineers hate that.
Those would let you approximate how depleted Ghawar is, based on public data about the general layout of the structure (from technical papers similar to this one). And you can differentiate an injection wellhead from a producing wellhead in satellite photos. And every drilling contractor keeps records of what their rig does each day (hourly summary of activity), as do the service contractors supplying rental equipment and services. And the drill bit manufacturers keep records of each bit run by depth to the end of each well.
Just some thoughts on why it is easy for me to believe Matt Simmons. I could tell all of you where we are with Ghawar if I had the time, because the data is already out there...
I have enjoyed this blog -
you guys have fun with it!
oilman2@urbansurvival.com
Here are links to some interesting maps of fields, wells, and bore holes in Saudi Arabia and elsewhere.
Trouble in the World's Largest Oil Field-Ghawar (scroll down for maps):
http://home.entouch.net/dmd/ghawar.htm
Map of bore holes in Ghawar:
http://www.cybcity.com/candollar/gha.jpg
Selected Features of Giant Fields, Using Maps and Histograms
http://www.searchanddiscovery.net/documents/2004/horn/index.htm
And of course, the Classic from Matt Simmons (see especially pages 8-15):
http://www.simmonsco-intl.com/files/Hudson%20Institute.pdf
FWIW -
If you assume the outlying productive wells are the deeper limits of an anticlinal structure, and that the wells dead on top of the structure are the shallow limits (top of the oil deposit), then you have a shot.
If new injection wells are only drilled to minimum required depth (just below the oil/water contact in the reservoir), then whatever that depth is can serve as an approximate depth of the oil remaining.
The rest is geometry...
The only reason not to do this would be due to overproduction, where the oil has been broken up into big globs separated by water within the reservoir. In that case, you would inject only in the deeper parts of the reservoir, hoping to eventually chase all the crude out to some well in the future.
Both provide interesting data, no?
OT, but curious:
Does anybody know if any news is driving the runup in crude oil price today, or is it just the interaction of supply and demand? I haven't found any oil related headlines of substance to explain the price increase.
From:
http://news.yahoo.com/news?tmpl=story&u=/ap/20050601/ap_on_bi_ge/oil_pri...
Crude oil futures jumped by more than $2 a barrel Wednesday on concerns that strong demand for diesel will leave it and other distillate fuels, including heating oil, in short supply later this year.
ADVERTISEMENT
"What's really blowing a lot of people's minds is that heating oil is trading higher than gasoline," said Andrew Lebow, senior vice president at Man Financial Inc. in New York.
Roy -
It's just speculators:
http://www.bloomberg.com/apps/news?pid=10001013&sid=axxJljZhZKjQ&refer=c...
Working their margin magic, buying long and driving it up a tad, then buying short and watching it fall back. Day traders should be outlawed...
NOTE: I say this BECAUSE Shell already said they would be back up in a few days. Margins are tight, but no that friggin tight.
If you go over to John Herold on the blogroll you will see that we have just started drawing down the reserve this year, somewhat earlier than usual.
J: It's hard to believe how brittle the market psychology can be, isn't it? It's almost as if all the traders just figured out in the last week or so that there isn't an infinite amount of oil in the ground, and they're still adjusting to their new world view.
I'm not saying that's what happened; generalizing like that is never a smart thing. But I do wonder why the market has a knee-jerk reaction every time someone in the Middle East or anywhere in the oil delivery chain has a bad burrito for lunch.
You know any traders Lou?
They are allsalivating to make the "big kill" - avarice in action. Until they do, they are sharpening their spears on these little burps and farts.
They see this as THEIR time, with the volatility index so high. Every move is watched by the rest of the pack, so if more than 1 or 2 make a similar move, the rest pile on. It's actually funny to think about them all cooped up in a room, chain smoking, each with 5 cell phones going...
The paper :
http://www.sulzerpumps.com/map/SulzerDocuments/DocumentsImages/Documents...
We'd better start mass producing those hybrid and hydrogen cars, soon. Oh, and get used to walking and bicycling everywhere. (Maybe we'll have to go back to using horses, too?)
It doesn't invalidate the cause per se, but holy FUD'ing hasty generalization (
http://www.nizkor.org/features/fallacies/hasty-generalization.html)! One little fuzzy graph from one test site on an oil field approximately 37 miles long and 6 miles wide doesn't mean much at all. It's like taking a picture of one pothole and assuming an entire road is undriveable.
The original quoting blog fails to properly link to the source article, which is at http://www.sulzerpumps.com/map/SulzerDocuments/DocumentsImages/Documents...
Check out http://www.nizkor.org/features/fallacies/ - it's a wonderful breakdown of different argument fallacies. It's worth keeping them in mind when reading (or writing) FUD tinged postings.
The Abqaiq field is 78% depleted, that is not a questionable statistic, it is an Saudi Arabian Oil Ministry number. The original point of the entry was to comment that a picture is worth a thousand words, which it obviously is.
I can make a model of parts of Ghawar, from published data, that would look similar. But having a source that illustrates the point made it easier to tie back to as a part of an ongoing explanation of why we are heading into trouble.
We are seriously all going to die. 2010 is going to look like Mad Max.
The drop in per well production rates is interesting because horizintal drilling come on big time in the 90's. Hence the overall rate per well fell even with the bigger soda straws of horizontal wells.
Aaron - get a grip, man, you ain't gonna die. I would prepare for major inflation and you better get use to riding a bus.
I read somewhere that America graduates 43,000 lawyers a year and 430 petroleum engineers. Maybe that will change too.