| Low energy return on investment (EROI) need not limit oil sands extraction | The Oil Drum | Energy Export Databrowser Updated to BP 2013 Data |
Tech Talk - A June TWIP and the OPEC MOMR
Posted by Heading Out on June 16, 2013 - 4:35am
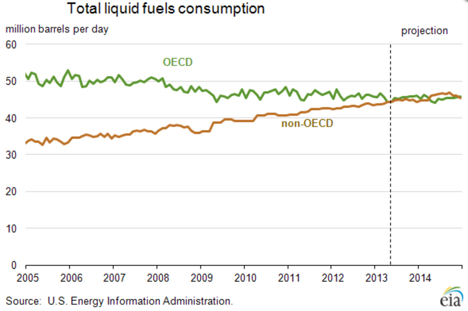
The EIA has noted in This Week in Petroleum that, for the first time, the sum of non-OECD country demand contributed more than half to the total of liquid fuels consumed in the world.
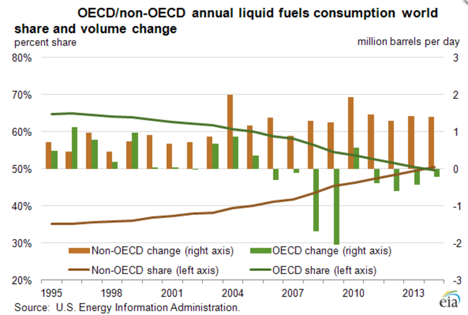
It does, however, point out that the projections of the Short Term Energy Outlook are for the two curves to re-intersect at the end of 2014.
The reality of that second assumption is, I rather suspect, more based on hope than reality. Once you start providing power and all its benefits to the general population, you are on a slippery slope that it is almost impossible to back away from. Consider as a small example, the problems that Egypt is currently having with the supply of subsidized bread to the general populace. Once you start supplying a commodity at a subsidized price it becomes very hard to change the equation, and too much of the non-OECD world is now living in an economy where energy use is subsidized. The problem that the above graph fails to recognize is that you cannot wean a culture from subsidies in the immediate short term and still expect their government to survive in its present condition.
Thus, when the EIA project that global demand will grow to over 92 mbd in the next year, they are likely only being realistic. Their assumption that it may then decline is perhaps more in the nature of wishful thinking.

There are, however, a couple of caveats to that last statement, the first of which is that the decline in demand may be more reflective of a lack of supply capacity (our raison d'être) and alternatively it may reflect, as a result of the first, that prices will rise to influence demand. Nevertheless we remain in a condition where the harsh realities that lie just over the horizon remain obfuscated by other events.
As with many other international agencies, the EIA continue to anticipate continued growth in the North American supply of liquid fuels. Outside of that growth the increased demand for more than an additional mbd of liquid fuels seems more likely to be desperately hunting for an invisible savior.
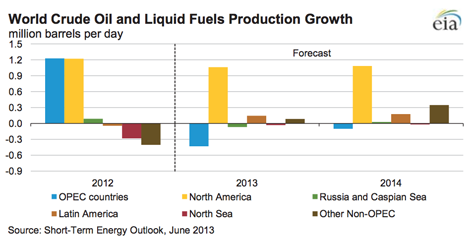
The decline in supply from OPEC in the two years ahead should be noted. It should also be remembered that this is likely to be as much a voluntary control, to ensure price stability in the face of increased North American production, rather than as a result of a short-term supply shortage. However the reality of continued domestic growth in demand in the Middle East, as Westexas has reminded us, is something that cannot be neglected. It has been noted that Saudi Arabia, although having less than a third of Germany’s population, recently surpassed it in terms of oil consumption. It will add several new oil-fired power stations including those at Yanbu and Jeddah. This will feed into an anticipated continued growth in Saudi domestic demand of 5.1% pa.
And this brings us to the OPEC Monthly Oil Market Report (MOMR) for June. OPEC continues to anticipate a global demand growth of 0.8 mbd this year, though they note that there will likely be a growth of 1.2 mbd in the non-OECD nations, requiring a reduction in OECD demand to match the overall forecast. Major growth in demand will continue to be in China (at 0.4 mbd and the Middle East at 0.3 mbd). On the other hand OPEC anticipate cutting their supply (to match anticipated need) by 0.4 mbd over the course of this year. OPEC, therefore, has slightly dropped their projection for year end; however, it will still crest above 90 mbd.
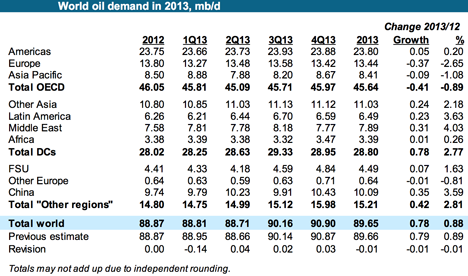
A large part of demand projection is tied to growth in the global and individual nation economies, and that is a murky crystal ball to view. But OPEC anticipates that these economies will continue to grow at an increasing rate, while recognizing that this projection is in an area with a high level of risk in the estimate.
The continue, and perhaps growing unrest in the Middle East continues to cast a further shadow over predictions over both supply and the reality of future demand in those countries. And, as one of the less frequently discussed topics, future output from Russia is not as assured as the average analyst appears to assume.
OPEC is anticipating a relatively strong growth in demand in the second half of the year to almost reach 91 mbd by the end of the year. Overall the growth in supply to meet this demand continues to come from North America.
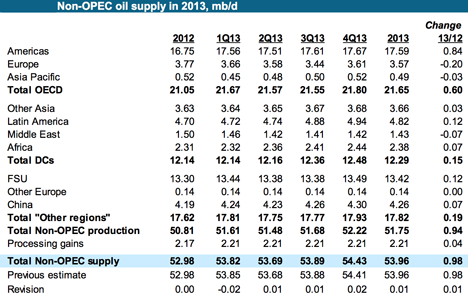
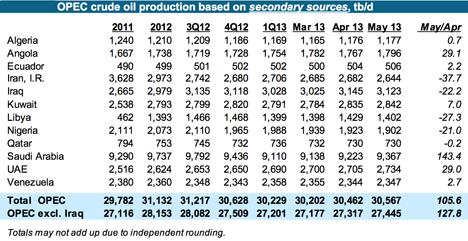
OPEC itself is reporting a slight increase in overall production (by about 128 kbd) although, as always, there are differences in the numbers between those supplied by the countries themselves, and those reported from other sources.
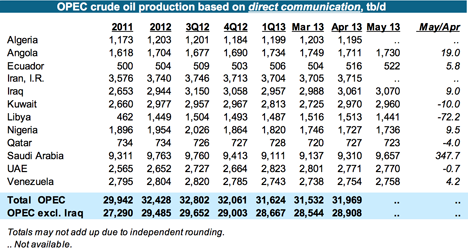
There continues to be a significant disparity between the numbers reported from Iran and Venezuela, for example, when other sources are reported to the tune of around 1.5 mbd roughly. In the short term, Iraqi production appears stable.
With the continued global reliance on increased production from North America, and in turn, that reliance on improved production from tight formations, I would be a little more confident of the future were it not for plots such as this, which I recently found.
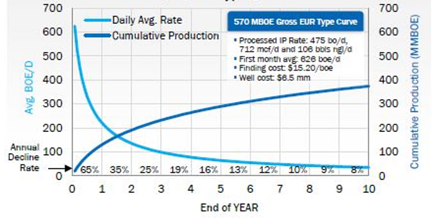
It is a curve that I rather suspect continues to be optimistic.
Contact
- Content: editors at theoildrum dot com
- Tech support: support at theoildrum dot com
License

This work is licensed under a Creative Commons Attribution-Share Alike 3.0 United States License.
Certainly NA production is marginally increasing with Oil Sands and tight formations all contributing. Despite increased non-OECD fuel consumption, high oil prices remain a fact of life and fluctuate only to tease out editorials and position papers that are seldom realistic beyond banging pet drums of whoever these writers speak for.
"The problem that the above graph fails to recognize is that you cannot wean a culture from subsidies in the immediate short term and still expect their government to survive in its present condition."
When said governments fall like dominos and erupt in 'Arab Springs', I only hope these same writers will link and explain that the high costs of embedded energy in our total way of life have limits and consequences. I still believe that the magic of ff and the work it does is cheap at $10.00/gal and shake my head at the hand wringing and accustaions as it approaches $4.00. We could always drive and consume less instead of piss this new production away in meaningless activities.
Thanks....paulo
Yes Paulo,
"We could always drive and consume less"
If Americans would get together and carpool we could save about 6 million barrels of oil per day!!
Conservation will buy us some time:
as Admiral Hyman Rickover said in 1957
"to invent ways of living off renewable or substitute energy sources"
The world has about 35 cubic miles of oil reserves still in the ground. The world uses about 1 cubic mile of oil per year. Do the Math.
We will soon see lots of problems that should have been addressed between 1958 and now!!
From Admiral Rickover Speech:
“…there is nothing man can do to rebuild exhausted fossil fuel reserves. They were created by solar energy 500 million years ago and took eons to grow to their present volume.”
“In the face of the basic fact that fossil fuel reserves are finite, the exact length of time these reserves will last is important in only one respect: the longer they last, the more time do we have, to invent ways of living off renewable or substitute energy sources and to adjust our economy to the vast changes which we can expect from such a shift.”
“Fossil fuels resemble capital in the bank. A prudent and responsible parent will use his capital sparingly in order to pass on to his children as much as possible of his inheritance. A selfish and irresponsible parent will squander it in riotous living and care not one whit how his offspring will fare.”
“Energy resources and our future” – by Admiral Hyman Rickover, 1957
@ Dick
Of all the graphs and articles I have read about PO, the one statement you made in your above post is one of the best illustrations I have ever encountered.
"The world has about 35 cubic miles of oil reserves still in the ground. The world uses about 1 cubic mile of oil per year. Do the Math."
It is so easy to imagine a cubic mile and its small size is within people's ability to make sense of distance and volume. If you add in the obvious extra costs of scraping the bottom of the barrel (couldn't resist), it is another simple step to imagine change is in our cards. Imminent change.
regards...Paulo
"The world has about 35 cubic miles of oil reserves still in the ground. The world uses about 1 cubic mile of oil per year..."
Yes, agree... Nice, neat number to pass along to my fellow Joes, but do you have an official link to this measurement/estimate?
Regards, Matt
Current world production of crude oil + condensate: 76 Mb/d
1 barrel = 42 gallons
1 gallon = .133681 cubic feet
1 cubic mile = (5280 feet)3
(76 Mb/d * 365.24 d/y * 42 gallons * .133681 cf/gallon) / 1.472 x 10¹¹ cf/mile = 1.06 cubic miles of C+C/year
The remaining amount of 972 billion barrels (76 Mb/d * 365.24 d/y * 35 y) might be a bit low. I suspect it is closer to 1.1 trillion barrels remaining or a 40 year supply at a rate of consumption of 76 Mb/d.
Matt,
I have no link for you. Sorry.
Here are my figures (rounded):
1 cubic mile = 5280 x 5280 x 5280 = 147,197,952,000
World consumption = 80,000,000 bpd x 365 days x 5 = 146,000,000,000
To make it simple I figured 5 cubic ft. per barrel.
Reserve = +/- 1 trillion barrels or about 5 trillion cubic ft.
The problems will come soon, when the rate of consumption starts to exceed the rate of production.
Yes, thanks for that, Dick.
I understood the basic math; was just after a link that perhaps was a little more "mainstream" that I could pass along to explain the obvious limit in today's terms (figuring current consumption/extraction rate/eroi/etc - it'll probably be worse of course as time goes on, unless the GLFA* comes along).
And no offense to Blue, but Dick's calcs are far easier to understand! ;)
Regards, Matt the Layman
* Great Liquid Fuel Alternative
I don't know about the saving for the future idea - better to leave it in the ground, and fuggedabout it.
It's highly likely that fossil hydrocarbons will be used less and less for fuel. Even petrochemical feedstock will likely be phased out in favor of pulling carbon from air and water, and hydrogen from water.
Renewables will get cheaper and cheaper, and FF will eventually be seen as a very, very odd, very very dirty anachronism.
Hopefully this news gets out. So many people keep saying "How come gas prices don't go down . . . we are pumping oil like crazy and people are driving less!" They just blame it all on 'speculators' who seem to magically be able to buy oil with matching sells that would push the prices down.
While not exactly on topic, I believe the following deserves mention:
Thirteen years ago, at Solar 2000, Knapp and Jester presented: “An Empirical Perspective on the Energy Payback Time for Photovoltaic Modules” at the Madison, WI conference in June of that year.
They presented a rigorous analysis of the 2857 materials and 2742 processes necessary to construct a PV panel at that time. In 2000, 200 micron thick wafers were wire-sawn from mono-crystalline ingot, then processed into cells, subsequently joined into panels. They determined that 2,856 Kwh of energy per Kwe of PV panel was represented by the materials used, and 2742 Kwh per Kwe of PV panel was represented by the energy involved in processing, for a total of 5598 Kwh/kwe. Mono-crystalline PV panel efficiencies were 13% at that time, and power densities were 130w/m2. They found that mono-crystalline PV panels returned the energy required to make them within 2-4 years, depending upon where emplaced.
I revisited their EROEI calculation using production data from White Co., Indiana, just a few miles north of Purdue University where I earned my BS in 1968. Using a 40 year life, 0.5% per year degradation, and 130 watts rated output per m2, I calculated an EROEI using their data of ~ 10.1. Using a 30 year life gave an EROEI of ~8, FOB plant.
There have been many process improvements in the solar industry since then. Power densities of 210w/m2, can be found in the high performance mono-crystalline PV panels currently available from China, for example. The SRI process which makes mono-crystalline Silicon Ingots from Phosphate mine waste, the Evergreen process which makes 100 micron ribbon directly from Silicon melt, and Twin Creek's proton-induced exfoilation method which spalls off 20 micron wafers from mono-crystalline Silicon, plus process efficiencies, have all contributed to reductions in energy inputs.
Because Silicon was 66% of material inputs, when 200 micron wire-sawn wafers were the norm at the time of the Knapp and Jester study, any changes which reduce the amount of Silicon in the panel have a very large effect. Because wire sawing imposes kerf losses, and involves a great deal of material and energy, eliminating wire sawing altogether has a major impact too. The Twin Creek proton-induced exfoilation process reduces the silicon required by 93%, through elimination of kerf loss, and reduction of thickness from 200 microns to 20 microns. This new method of making wafers from mono-crystalline Silicon Ingot, plus efficiency gains in panel output from 13% to 21%, reduce inputs to 1,774 kwh/kwe, a 68% reduction since the Knapp study.
Using these values, a PV panel located in White Co., Indiana at a non-shaded location, tilted toward the equator at an angle equal to it's latitude, producing 1564 kwh/kwe-yr, has an EROEI, FOB plant of ~32, given 0.5% per year degradation over a 40 year life, by the end of which it will be producing 82% of its capacity when new.
INDY
This is what the equivalent diffusional model for flow looks like out of a typical well. The squares are a model of average daily flow and the circles are cumulative. The model is superimposed on the data as taken from the Eagle Ford graph.
This was calibrated to match the 30 year cumulative value of 570,000 barrels.
What is interesting about this model is that it has a true EUR of 1,850,000 barrels, but it will take forever to reach that because of the diminishing return properties of diffusional flow.
Hi,
Since energy must be expended to lift the oil to the surface, there must be a practical limit at which the well will be capped and abandoned.
Yes, economics will ultimately determine this point, because the petroleum may have more value as feed stock than as energy by then, but
still such a point must exist.
Is it possible to place an EROEI cutoff on the graph?
I ask this, because you mention possible flow until 1.8 MmBbl, at ultimately teaspoons/day, and I imagine this oil must be lifted
by pumps.
Your thoughts?
INDY
The practical limit will be the cost of alternatives.
Prices will be capped at the cost of producing synthetic liquid fuel, which will probably fall below $5/gallon.
Heck, it's very likely that a world powered by wind and solar will have large amounts of cheap power available during periods of peak production. The sensible thing to do is turn some of that power into synthetic hydrocarbons. Given that the power input will be cheap, synthetic liquid fuel could easily cost in the range of $3.5/gallon. That would cap oil at about $140 per barrel (before the cost of refining).
Let's say wind provided 50% of the kWhs needed by the grid, and wind was overbuilt by 50% to reduce the frequency of lulls. That would create surplus power to the tune of about 25% of demand. That might be sold to synthetic fuel producers for, say, 2 cents per kWh.
Diesel has about 40 kWhs, so at 40% efficiency the energy input would cost about $2. The hardware might get 50% utilization if we're using surplus power, and that might raise capital costs to around $1 per gallon. Operating costs might get us in the range of $3.50 per gallon, which seems pretty feasible. Not quite competitive right now, but awfully useful in the long range.
And, of course, if there's a lot of surplus power you might get it for $.01 per kWh. Actually, this demand source would probably set the price for surplus power.
All of the tech needed for this exists right now, even if it's not quite competitive with the current moderate price of "rock oil" (petr-oleum).
In recent years solar panel production has undergone a transformation imposed by what is usually termed economies of scale. From small factories in Europe and the US, the production of solar PV cells migrated to huge factories in Asia. And with this transformation came the usual cycles in large markets where product differentiation isn't obvious. By the midst of 2012 some Asian producers were reportedly selling cells about $0.25 /Wp below cost, in a clear supply destruction cycle. This has created chaos, with local producers calling for taxes on Asian products and investors claiming that this is the way for affordable electricity. Even if this supply destruction cycle is indeed the driver of recent price drops, a return to prices of two, or even one year ago, is not to be expected, because solar panel production costs and prices are declining rapidly in a manner similar to those of computer hardware production. In both cases the final product is technology driven, with keen competition giving rise to a constant stream of improvements, like the number of transistors per unit of area. The efficiency of PV technology keeps increasing, and improvements like proton-induced exfoliation and auto-cooling have yet to reach the market. Production is not going back to either the US or Europe, either. If it's not economical to produce a smartphone or a laptop in either, it will be much less so with a simpler technology like a solar cell. The catalyst for the abrupt collapse of the past several years is termination of subsidies in the US and the EU, with Solyndra as poster child, in a glorious $250 million bankruptcy, but the nature of the business meant consolidation was inevitable.
Renewable electricity producing technologies like wind, solar, tidal or geothermal dispense with any sort of fuel to produce electricity. A gas or diesel fired power plant has a cost every time it produces power, so the operator is permanently paying for fuel, sourced via long term supply contracts. Additionally, there are other costs associated with operation and maintenance of the plant. In contrast, a solar panel, or a windmill, once emplaced, produces power until something breaks. Their maintenance costs are much smaller and can be predicted fairly accurately at project start. The result is that generating an extra kWh of electricity from an operating solar panel or wind turbine costs nothing, $0.00 / kWh. This is what in economics is termed marginal cost (in this case for electricity generation).
The second important aspect of renewable technologies is that they generate electricity, and once it is injected into the grid, that electron is equal to any other. Moreover, if the sun is shining on my PV array, I can be sure that any other PV system in the region, will also be generating electricity. In economics, markets where supply agents are unable to differentiate their products from one another, are called Perfect Concurrency Markets; cereals agriculture is the classic class room example. Perfect Concurrency Markets are dominated by long term prices which match marginal costs, and suppliers struggling to make a profit (a reason for agricultural price supports).
A perfect concurrency market with a marginal cost of zero is something totally outside standard study and practice in economics. It is the reason spot electricity prices collapse during sunny summer days or the Minnesota Hub suffers negative prices during storms (which means suppliers must pay to put their power on the grid). These are all symptoms of a market whose price will get closer and closer to zero as more renewable energy systems are connected.
I did an energy analysis of Doty's WindFuels process using atmospheric CO2 isolated using NaOH in scrubber towers. I got 3.44 Mwh/BOE
If their process works, it would seem WindFuels is economic now, given surplus wind power at <$25/Mwh is available.
But why convert? France has shown that electrified rail fed by pedestrians and bicyclists gives a healthier environment and population.
INDY
INDY,
Good info, thanks.
why convert?
Because liquid fuels have unusual advantages in significant niche markets: aviation, water shipping, rural/northern latitudes, and seasonal agricultural work.
I got 3.44 Mwh/BOE
So, about 50% conversion efficiency?
it would seem WindFuels is economic now, given surplus wind power at <$25/Mwh is available.
That surplus is currently only available for relatively short periods, which will lower capital utilization.
Could you provide detail for your energy analysis of Doty's WindFuels process? Do you have information on projected capital costs?
My energy analysis is based on info released by Doty in a peer reviewed paper:
"NEW PARADIGMS FOR STANDARD LIQUID FUELS FROM CO2, H2O, CH4, AND OFF-PEAK ENERGY
F David Doty, David L McCree, Glenn N Doty, Laura L Holte,Judy M Doty, and Paul D Ellis ,
Prepr. Pap.-Am. Chem. Soc., Div. Fuel Chem. 2010, 55 (1), "
Figure 2 is a material balance diagram showing energy and resource inputs and product outputs.
I recommend you download and read the source document yourself.
Regarding the duration of energy surplusses, Doty specifically mentions that he sees his process
utilizing surplus power, and apparently designed it that way.
Nonetheless, wind power is in a "perfect concurrency market" and without a feed-in tariff, the only way renewable energy producers can
guarantee a minimum price for their power, is to convert same into liquid fuels, a fungible resource with known value.
Also, given Doty's scale for his process was 80 tons of distillate/day, powered by 75 Mwe of wind, a modest size wind farm could market it's
power this way, and were this power augmented with rooftop PV, I'm certain throughput would rise.
I do agree that maritime and military air transport as currently configured need liquid fuels. Maritime transport can revert to sail, or coal, however. My analysis found 1.7 million barrels / day was sufficient for these needs and the plastics industries, with the latter consuming 2/3 of this amount which could be supplied by 374 Twh/yr from 150 Gwe of wind.
INDY
Ah, thanks for the paper. I found it at the dotyenergy website. A minor question - are you sure it's peer reviewed?
A few other quibbles:
without a feed-in tariff, the only way renewable energy producers can guarantee a minimum price for their power, is to convert same into liquid fuels
I agree that synthesis of H2 and hydrocarbons (partly liquid) is likely the primary solution to surplus renewable power, especially seasonal surpluses. It's worth noting that with time, many other "sinks" are likely to be valuable, such as DSM of EV charging.
were this power augmented with rooftop PV, I'm certain throughput would rise.
Solar should allow better tailoring of the renewable mix to consumption patterns, and therefor reduce surplus power. That's all good, of course.
Maritime transport can revert to sail, or coal, however.
I think either would be badly suboptimal as a primary solution. Wind (and PV) is likely to be a very valuable component of powering long-distance shipping, but I would think that liquid fuel will continue to be an essential component of a least-cost solution.
plastics industries
Feedstocks don't have to be liquid - they pretty much just need carbon and hydrogen, and they can build whatever compounds they need.
Hi WHT,
Was that a straight up diffusional model or the OU variant you have shared.
Coefficients for the model would be of interest as well.
The graphic suggests 6.5 million dollars for well cost, does anyone know if that is for drilling and fracking? Why is it so much less for the Eagle Ford vs Bakken/Three Forks at 9 million dollors per well?
Also that chart is quite optimistic, the data I have pulled from the RRC of TX suggests 30 year EUR of less than 240,000 barrels for the avg well. This is an early estimate I made which I am going to update soon, I am confident it will be less than the Bakken which is about 327,000 barrels for the average well for a 30 year EUR.
I will reply to my post to show a chart, look for it later after moderation.
DC
DC,
Are you adjusting for RRC's under-reporting of early production?
Yes,
the model was based on a sample of 150 wells which started producing between Dec 2010 and Jan 2012, The changes in total output for the state of TX is due to wells that get reported late, there are not many revisions of individual wells once they are reported. As I said I will go back and look at this at some point but as of the end of 2012, the data had not changed from when I had gathered it in mid 2012. The model may need to be tweaked a little as I have learned much from both WHT and Rune Likvern since I initially came up with this estimate. Check my blog which can be found by clicking on dcoyne78.
DC
Chart for Eagle Ford Avg Well