| Localism and some thoughts on Social Change | The Oil Drum: Europe | The Cost of Gasoline around the World |
Oilwatch Monthly - June 2007
Posted by Rembrandt on June 12, 2007 - 11:33am in The Oil Drum: Europe
This edition focuses on exports of all fuel liquids including conventional + unconventional crude oil, natural gas liquids, lease condensates, gas-to-liquids, coal-to-liquids and biofuels. The June newsletter can be downloaded at this weblink (PDF size 1 megabyte).
Three main conclusions have been found based on available data from January 2002 to February 2007:
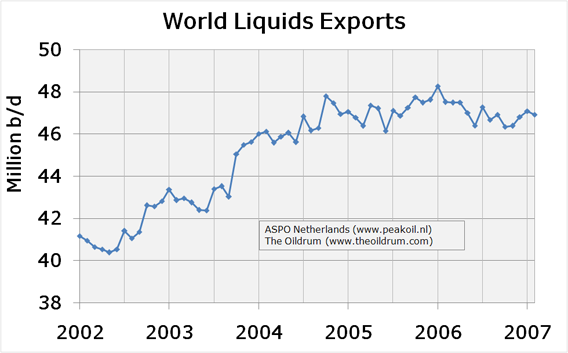
1) Total world exports of all fuel liquids have been on a plateau since the end of 2004, and declined slightly in the last year, despite production increases.
2) Liquids exports from non-OPEC countries as a whole have declined since the beginning of 2004.
3) OPEC liquids exports have increased until the end of 2005, followed by a short plateau after which a slow decline set in, mainly due to declining production in Saudi Arabia.
Next months edition will return to production data with the inclusion of the export assessment. A definite format for the newsletter is still being found at this stage. All suggestions for additional analysis and data inclusion next to liquids/crude oil production, stock and export data will be taken into consideration.
A permanent basis for the monthly newsletter has been made on the Oildrum under the following webadres: http://www.theoildrum.com/tag/oilwatch, with thanks to Super G. There all the previous editions can be found in order from newest to oldest. Feel free to use this newsletter in writing and communication as long as you cite the following: Rembrandt Koppelaar, Oilwatch Monthly June 2007, The Oildrum & ASPO Netherlands.
Liquids exports market on a plateau
The liquids export series was derived by subtracting the consumption of oil products, refinery fuel and direct crude oil sales from liquids production in producer countries. Data comes from the Joint Oil Data Initiative (JODI) for demand and the International Energy Agency (IEA) and Energy Information Agency (EIA) for supply. Biofuels are not included in consumption data but are included in production data. Because biofuels are not identified in the production data it is not possible to separate this flow. Given that net energy biofuel production has increased by approximately 50,000 to 100,000 b/d annually in recent years, the series is slightly optimistic.
No actual flows between producers and consumers have been taken into account, and only producer countries have been examined. Thus nothing can yet be said about how consumer countries react to an expanding or shrinking world export market. To bridge this gap, data on flows and consumer countries will be added over the next few months.
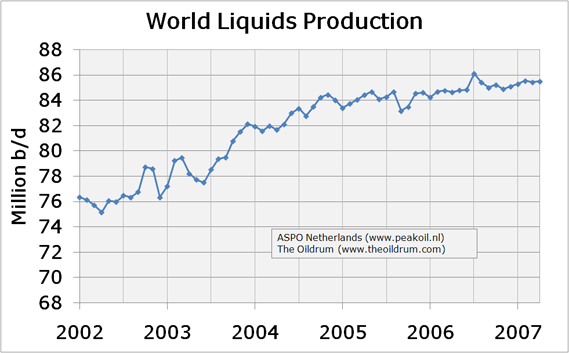
From 2005 to 2006, worldwide liquids production increased by nearly 1 million b/d from 84.1 million b/d in 2005 to 85 million b/d in 2006. Initial results on exports show that annual worldwide exports were 43.6 million b/d, 46.3 million b/d, 47.1 million b/d and 47 million b/d in 2003, 2004, 2005 and 2006 respectively. Data for the first two months of 2007 shows a similar export level of 47 million b/d. This plateau implies that all liquids production growth in producer countries has been absorbed by internal markets in recent years.
A worrisome trend is visible in the exports of non-OPEC countries. In 2003 exports were estimated at 17.3 million b/d, increasing to 18 million b/d in 2004 and subsequently declining to 17.5 million b/d in 2005 and 17.3 million b/d in 2006. The decline was caused by a multitude of factors.
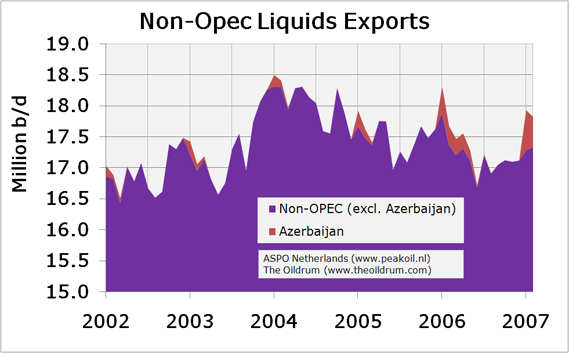
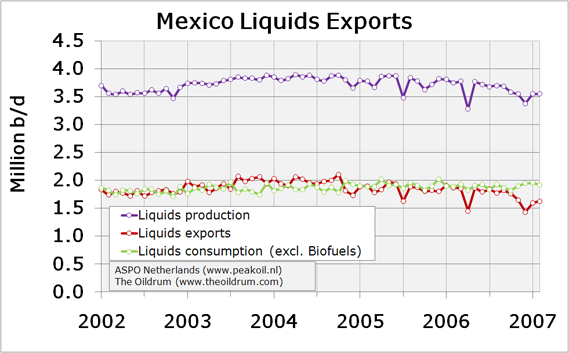
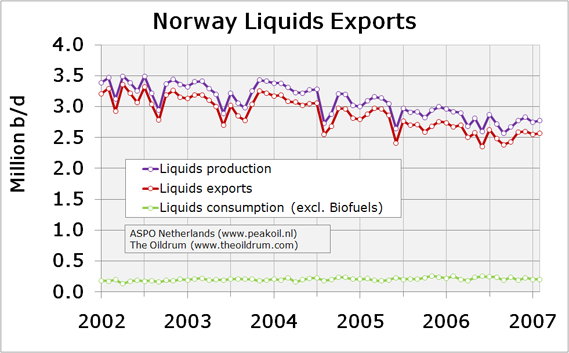
Firstly, sharp declines in the production of Mexico due to the peak of the supergiant oilfield Cantarell in 2005. Secondly, declines in the north sea oil producing countries Denmark, the United Kingdom and Norway. Thirdly, a plateau in exports from Russia at 6.6 million b/d since August 2004. The cause lies in Russian consumption which has increased at a similar pace as production. A similar situation is noticeable in Brazil. Fourthly, a decline in production in various small producers including Ecuador, Colombia, Oman, Syria and Yemen. Net export increases in countries such as Azerbaijan, Kazakhstan, Canada and Sudan were not sufficient to offset these declines.


While overall exports declined, production in non-OPEC has remained on a plateau in recent years. In 2003 production was 46.1 million b/d, in 2004, 47.1 million b/d, in 2005, 46.9 million b/d and 47.2 million b/d in 2006. The trend shows that the importance of OPEC in meeting worldwide demand has increased. Implying that it comes down to OPEC to increase exports to meet demand growth in non-OPEC importer countries. If OPEC fails to do so it will lead to significant price increases needed to slow down demand growth in consumer countries. Only if non-OPEC production sharply ascends from the current plateau can this situation be averted.
In 2003 exports from OPEC (including Iraq) were 26.3 million b/d, increasing to 28.3 million b/d in 2004, to 29.6 million b/d in 2005 and 29.7 million b/d in 2006. This increase has recently halted. Since July 2006 exports from OPEC have declined due to Production declines in Saudi Arabia, Venezuela, Iraq and large consumption increases in Iran.
It is currently unclear whether these production cuts are truly for the purpose of price management or an attempt to mask a geological decline. The difficulties OPEC has faced in recent years in controlling oil prices prompt the belief that the decline is a geological rather than a ‘price management’ cut. If this is so, it is likely caused by the loss of swing production capacity in Saudi Arabia.

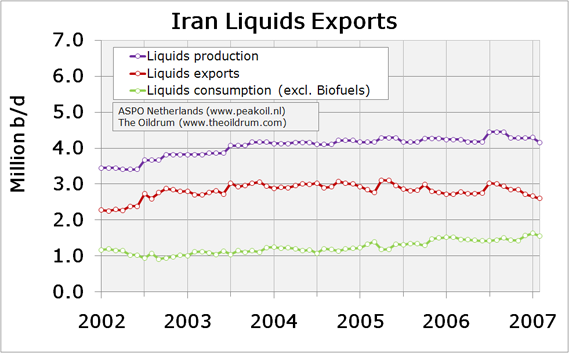
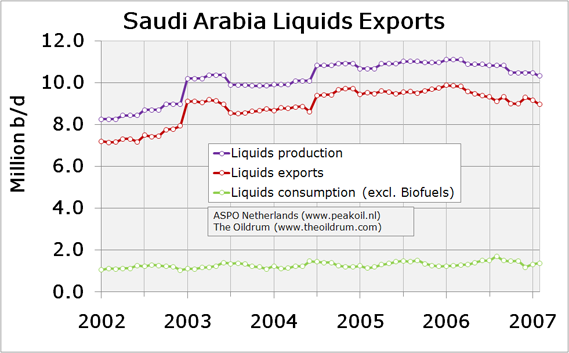
Export charts for individual producing countries can be found in the newsletter.
Robustness of the outcome
To verify the results, a second demand data set was taken from the International Energy Agencies oil market report. It contains demand data for regions as a whole including North America, Europe, the Middle East, the Former Soviet Union, Asia, Latin America and the Pacific. Because of this division only aggregate net export flows from regions could be ascertained. An example is North America where export data from Canada and Mexico is lost because North America as a whole is a net importer. Therefore, actual export levels are much lower than in the series with the individual countries demand data. Nonetheless, a similar liquid export plateau in recent years as in the detailed series is derived.
Suggestions and remarks related to the newsletter of May 2007
*ThatsItImout "Please consider adding any information you can find on LPG (Liquified Petroleum Gas) or propane."
I didn't have time to look into this yet. It will probably be very difficult to find such a differentation. If I come across something I will let you know, but don't expect anything.
*Marco "Is it possible to also have a "world crude oil export" chart? This would be very interesting."
This has been added for liquids, further differentation between different streams (conventional and unconventional crude and other liquids source) will be made in the upcoming months as additional data is incorporated.
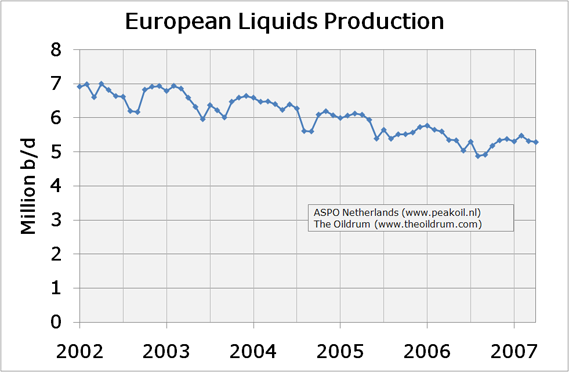
*And1 Is it possible to aggregate the North sea figures into one "north sea" diagram ?
I do not intend to add this at the moment, but maybe I will reconsider later when I decide to create a regional production series. For now here is a one time chart on European Liquids Production:
*FTX- It looks like there's room on page 3 for US distillate stocks. I know gasoline is all in the news at present, but if we ever have a bad winter...
I will add this in the next edition when I return to production and stocks.
*cuchulainn - Please could there be a graph of oil production by "OPEC subject to quota" countries - ie with Iraq and Angola excluded.
I have gathered this data and it will be added in next months edition
*john macklin - Please consider adding at least one graph of global production that starts at a date earlier than 2002. Such a graph would give greater perspective of more recent trends over the last 5 years.
Production dating back until probably 1930 will be added in next months newsletter for nearly all individual countries.
*Echelon - I'm curious, I can't tell from the graph. What is the IEA reporting Saudi and Neutral Zone production as for February, March, and April?
IEA says for Crude oil (excluding lease condensates) respectively 8,600 million b/d, 8,550 million b/d and 8,605 million b/d for February, March and April
*estamos jodidos - There has been a number of variations of charts showing Crude, liquids, crude & condensate, oil and gas in Barrel equivalent, etc. It seems to me that each liquid including crudes of different weights have varying Energy content. There appears to be an increase in the percent of heavy vs light etc. Would it be possible to normalize all of these and track something such as a Net BTU or Net Energy Production? If that were possible, I believe the point of Peak would become more relevant.
At the moment this is not possible because data on most liquid streams are not individually published.
*godraz - Another set of graphs I'd like to see are demand and/or import growth/decline ones of various key countries or regions. Production is but one half of the picture, whereas where it is and is not going lately is worth understanding too.
I am looking at incorporating crude oil trade flows. When the data is gathered and the analysis is done I will incorporate import growth/decline curves for several countries. This will take some time so don't expect anything soon.
Personnel
Editors
Contributors
Peak Oil Primers
Archives
- November 2010 (3)
- October 2010 (6)
- September 2010 (4)
- August 2010 (7)
- July 2010 (6)
- June 2010 (7)
- May 2010 (2)
- April 2010 (8)
- March 2010 (4)
- February 2010 (6)
- January 2010 (3)
- December 2009 (5)
- November 2009 (8)
- October 2009 (12)
- September 2009 (6)
- August 2009 (5)
- July 2009 (11)
- June 2009 (8)
- May 2009 (16)
- April 2009 (10)
- March 2009 (7)
- February 2009 (10)
- January 2009 (15)
- December 2008 (9)
- November 2008 (9)
- October 2008 (9)
- September 2008 (13)
- August 2008 (10)
- July 2008 (14)
- June 2008 (23)
- May 2008 (16)
- April 2008 (12)
- March 2008 (16)
- February 2008 (9)
- January 2008 (13)
- December 2007 (13)
- November 2007 (16)
- October 2007 (22)
- September 2007 (8)
- August 2007 (9)
- July 2007 (16)
- June 2007 (8)
- May 2007 (7)
- April 2007 (7)
- March 2007 (10)
- February 2007 (10)
- January 2007 (12)
- December 2006 (9)
- November 2006 (15)
- October 2006 (4)
- September 2006 (5)
- August 2006 (5)
- July 2006 (9)
- June 2006 (5)
- May 2006 (10)
- April 2006 (9)
- March 2006 (13)
Vital Trivia
License

This work is licensed under a Creative Commons Attribution-Share Alike 3.0 United States License.
Excellent work. BTW, do you know if the Total Liquids Export graph is Net Exports?
The following is based on EIA data:
The top four net oil exporters--Saudi Arabia; Russia; Norway and Iran--accounted for about 43% of Total Liquids Exports in 2006, based on the above graph. From 2005 to 2006, their combined production dropped by 1.8%. Their combined consumption increased by 4.3%. Their combined net exports declined by 3.9%.
Based on their HL plots, Saudi Arabia, Russia and Norway are well past their 50% of Qt marks. Iran is a somewhat more complex case, but I think that they are past the 50% mark, and their production declined from 2005 to 2006.
As we send torrents of cash flow to the exporting countries, I expect that in most cases, their domestic consumption will increase, probably at a rapid pace (at least initially), e.g., the 50% annual rate of increase in foreign car sales in Russia.
My analysis now is basically the same analysis that I had in January, 2006, to-wit, the combination of an advanced state of depletion in the top oil exporting countries and increasing domestic consumption in the exporting countries represents a lethal threat to the world industrial economy.
IMO, the very lifeblood of the world industrial economy is draining away in front of our very eyes.
Links to my 2006 articles follow. Note that PG edited my final statement in the January, 2006 article. I said that there "would be" a net export crisis. In the following, I also made one minor correction to the grammar.
http://www.energybulletin.net/19420.html
Published on 21 Aug 2006 by GraphOilogy / Energy Bulletin. Archived on 21 Aug 2006.
Net Oil Exports Revisited
by Jeffrey J. Brown
BP is saying net crude exports rose 2.5% in 2006 and net products rose 14%.
Perhaps someone can figure out the apparent discrepancies between the various data sets.
In any case, if we look at recent monthly data, there is no doubt that net exports are down. On a month to month basis, Saudi Arabia for example is down much more sharply than the average annual number shows, and Mexico is down 18% from 1/06. The EIA shows flat annual net exports for Mexico from 2005 to 2006. The common thread here is the near certain decline/crash of the two largest producing fields in the world, resulting in the near certain decline of every oil field in the world that has produced one mbpd or more (crude + condensate).
BTW, Mexico is declining as Khebab predicted, using the HL method. And it seems that someone did warn about a Saudi decline in the vicinity of 2006.
The only discrepancy is that BP is a complete global data set for 2006. The only one. EIA hasn't released their yearly update yet and it will only be for 2005 when they do.
See Rembrandt's note down the thread.
Lethal threat?
what do you mean... big recession?
Boris
London
You can pray that it's only a big recession. If that is all we get, then we get off easy but I'm not counting on it.
Ghawar Is Dying
The greatest shortcoming of the human race is our inability to understand the exponential function. - Dr. Albert Bartlett
@Westtexas
"BTW, do you know if the Total Liquids Export graph is Net Exports?
The method used is to subtract consumption of all liquids (except biofuels since no data on that is available) from all liquids production to obtain "exports". It does not provide figures for actual flows, these will be incorporated in the next months were available (only for OECD countries). I did not yet do this because it is very time consuming.
Incorporating actual flows will change the picture somewhat but probably not the overall conclusions. Producers who do not have refineries themselves will be worse off because they will have to compete on the global market when prices rise higher. Actual exports are therefore likely somewhat higher than portrayed in this picture.
Your point about the increasing consumption because of the higher prices of oil is an interesting subject to research in more detail.
@Echelon
BP is saying net crude exports rose 2.5% in 2006 and net products rose 14%.
I saw this too, BP tracks actual flows of liquids which gives a different picture because various producers do not refine their own crude. My method assumes that they all do currently. This would mean that oil exports are divided more equally over the globe. To know the exact differences, I need to do more analysis and see were the errors lie, and what they mean. Will come back to that next month when actual flows have been taken into account.
Unfortunately trade flows between the 2006 and 2007 BP report cannot be compared, because they increased the trade figures for 2005 with more than 1 million b/d! This makes their numbers somewhat doubtful regarding their accuracy.
If we look at the 2007 report we see that BP gives an increase in production in liquids of 413,000 b/d and that the increase in exports of liquids is 1,379,000 b/d. I currently do not have an explanation of why this discrepancy occurs.
Thank you for your analysis regarding BP's reports. Very interesting. Do you or anyone else have The IEA's OMR numbers for Saudi+neutral zone for May released today? The EIA is again reporting 8.6mbpd - exactly equal to their quota minus targeted cuts for November and February. I'm assuming the IEA is inline with this.
I don't have access to the IEA's report directly unfortunately. Would cost too much bucks for a report that is released for free two weeks later anyway.
What I do know is that the IEA forecasted a production decline of 110.000 b/d for OPEC from april to may, which is less than the EIA's expectation.
Therefore i think it si likely that Saudi Arabia's production didn't change or even slightly increased in the IEA's data.
It would be interesting to compare compare BP's numbers for net exports for each of the top 15 net exporters to the EIA's numbers for the top 15--an apples to apples comparison.
In regard to month to month versus average annual numbers, as noted above, the EIA shows Mexican Total Liquids exports to be flat from 2005 to 2006 (average annual), but Pemex itself shows that their exports are down by 18% from 1/06 to 4/07. The EIA shows Saudi Arabia to be down by about 4% from 2005 to 2006 (average annual), but their net exports are probably now down by at least 13% from their 2005 high (monthly basis).
As noted above, the central driving factor here for Saudi Arabia and Mexico is the near certain simultaneous decline/crash of the two largest producing fields in the world. As I have frequently stated, the primary difference, IMO, between Saudi Aramco and Pemex is that Pemex has admitted to the decline/crash of its largest field, while Saudi Aramco has not.
So, let's assume we have two countries--Production Land (producing 2 mbpd of crude oil), but it has no refineries and Refinery Land (with no crude oil production but they have the refineries).
Let's ignore refinery gains and crude/product transportation costs. Each country consumes one mbpd of product.
So Production Land exports 2 mbpd to Refinery Land, and Refinery Land exports one mbpd of product back to Production Land. So, the net exports are two mbpd less one mbpd = one mbpd.
Makes sense to me.
The paper that Khebab and I are going to work on is an attempt to model future exports. My tentative plan is to focus on the top 10 (accounting for about 70% of exports, based on your 47 mbpd estimate), and use HL plots of each country to predict future production, and then plug in at least two, and maybe three assumptions about consumption. As I have noted elsewhere, I have seen HL plots on six of the top 10, and all six are in close proximity to, or past, their respective 50% of Qt marks.
IMO, in 10 years time net exports will be down to a fraction of their current level--perhaps as low as 25%.--remember that the UK went down to zero in about six years. But we will see what Khebab comes up with.
Rembrandt, you might want to crosscheck your work with german statistics on the same topic from the Mineral Öl Wirtschaftsverband.
http://www.mwv.de/cms/front_content.php?idart=2&idcat=9
cool!
Great work, Rembrandt! Muchas Gracias!
It seems obvious to me that we are past the peak on crude, but the peak is being obscured by synthetic crude and ethanol. Since these fuels are the high priced stuff, their marginal costs are going to be the new bottom price for crude. Opec's cuts seem to reveal that they are trying to balance price and demand destruction (not big news) but their ineffectiveness at getting prices below alternatives shows their loss of control of this process.
Yeah, I know RR is going to argue. And we won't really have proof until exports are down at least 5%, but the continuing plateau in spite of large additions of ethanol and syncrude doesn't look good.
@oilmanbob
Thanks for your enthousiasm :)
I'm not sure whether we are past the peak of conventional crude, but the longer it stays on the plateau the more likely it gets. One of the reasons why I have started this newsletter, to monitor the situation.
I hope to return to some more accurate oil field projects forecasting in the summer, combined with this production dataset, it should provide a quite powerful tool for telling what is happening and wether the peak for conventional crude has occured or not.
Accidental double post removed
Really nice work. I'm impressed!
A few questions/comments:
1. I don't have the link handy, but I know we have talked about how production now includes more and more natural gas liquids and ethanol, both of which are lower in BTUs per barrel. So exports if measured in terms of BTUs are dropping even more than your chart would suggest.
2. Regarding the monthly fluctuating consumption in Azerbiajan, is there a possibility that what you are seeing reflects just bad monthly data, rather than real fluctuation? If so, you might want to use a moving average for Azerbiajan consumption.
3. In your calculation of exports, what are "direct crude oil sales"? Are these subtracted because they represent sales internal to the country?
@Gail the actuary & Euan,
"I don't have the link handy, but I know we have talked about how production now includes more and more natural gas liquids and ethanol, both of which are lower in BTUs per barrel. So exports if measured in terms of BTUs are dropping even more than your chart would suggest."
I'm currently trying to see if i can seperate different streams of liquid fuels to a relatively accurate extent from different data sources on an annual basis. If i'm happy with the results ill see if I can include an average BTU number.
"2. Regarding the monthly fluctuating consumption in Azerbiajan, is there a possibility that what you are seeing reflects just bad monthly data, rather than real fluctuation? If so, you might want to use a moving average for Azerbiajan consumption."
Probably bad data from the JODI database, I will look into that.
"3. In your calculation of exports, what are "direct crude oil sales"? Are these subtracted because they represent sales internal to the country?"
Exactly, they are direct sales from retailers internal in the producing country.
I suspect that this will be difficult to do, but I suspect that the amount of crude sold over 20 gravity with less than 2% sulfur is decreasing more rapidly than the supply of heavy, sour stuff. And I also suspect that the supplies from less stable politicially areas is increasing-Angola, and Nigeria. Any way to separate out the data?
To separate the grades (in terms of gravity and sulfur), you would need to combine types of grades in countries with flows and production data and on top of that preferably refinery data.
Don't think that would be feasible at this stage. The data simply doesn't exist I think in the public domain. It would also definetly consume too much time.
Thanks, anyway.Did you see NASAguys post in yesterday's drumbeat? He was charting days of gasoline supply capacity with US prices. Its about 3/4ths of the way down, past the childrens crusade flame war, I think well worth a look.
There's just a limited amount of time anyone can spend on this stuff. I'm a true yahoo at this-half remembered math skills, poor computer skills. I truly appreciate the time spent by you, Khebab,Stuart, WestTexas and RR and others on this stuff, feel its the best that theoildrum offers and a great public service.
thank you
Boris
London
Very interesting.
Can I just ask how you've handled Angola? since I believe that it has moved from non-OPEC to OPEC during the period which you're looking at.
Peter
@Blue Peter
"Can I just ask how you've handled Angola?"
Angola has been included in OPEC figures in the entire data range (from 2002 to present). This seemed like the most sensible thing to do to me. If you would split angola between Non-OPEC and OPEC because of their switch, it would create incomparibility in the data range.
THE STUFF OF NIGHTMARES
The UK trade balance has deteriorated to almost £60 billion per annum. In 2006, the UK went from having a trade surplus from oil and gas to a trade defecit. Forecast further decline in UK oil and gas production looks set to send the trade deficit spiralling towards £100 billion per annum by 2012 (subject to oil and gas price assumptions).
Nice post Rembrandt - but wtf is going on in Azerbaijan? This can't be seasonal variations.
UK trade stats from here:
http://www.statistics.gov.uk/cci/nscl.asp?ID=5819
Oil forecast is Mearns2, gas forecast is TDI median.
I assume that Russia and Norway are the two biggest, or certainly among the biggest, sources of oil for the EU.
If, as I expect, Russia starts showing sharp declines in net crude oil exports, the EU will be looking at sharp declines in oil supplies from their two closest sources of exported oil.
Jeffrey, the only EU countries that have significant oil production are the UK and Denmark. So the EU imports most of its oil - but I'm not sure of the flows - maybe an interesting topic for Rembrandt to tackle. I think Germany imports a lot of oil from Russia - historic ties. France and Italy I think import lots from Africa - Algeria and Angola etc. And I imagine that Norwegian oil stays in the EU. I would guess that Azeri oil from the BTC pipeline that is operated by BP ends up in the EU / UK. And the EU will import oil from the ME - UAE and Kuwait in particular, which again have historic links.
I covered EU + Norway imports and exports here:
http://www.theoildrum.com/story/2006/9/22/95855/4850
Dutch oil imports from Russia are 40% of total crude consumption. German European imports from Russia are probably in the same order of size
Being British, Euan's graph above doesn't make good reading. :-((
But, westexas we have a lot of very interesting data here today. So, does any of it back up your 'export land' theory.
The UK looks an ideal candidate!
Well done to Rembrant ... what a lot of work.
Xeroid.
The UK and Mexico are two real life examples of rapid net export declines.
UK exports probably declined at about 37% per year, after peaking in 1999.
Mexican exports are declining at 16% per year, based on data from 1/06 to 4/07.
I think that it will be a real scramble for rapidly declining net export capacity worldwide.
:-(((
Xeroid.
Along with ELM, I think there is an obvious but related, important trend: the remaining (declining) supply of oil is being divvied up by wealth and strength -- the poor countries without oil, and even some of them with oil, if they are poor enough, get little or no oil; in the "advanced" countries the consumption drops for the poor and the lower part of the middle class. Life remains more or less normal for those that remain the middle class. It just shrinks. Everything depends on keeping the middle class asleep until the last possible moment.
Maybe it's improper to get political in the midst of technical thread. If so, sorry.
But it all ties together, money, politics, economics, energy.
I remain amazed at the lack of news on this topic. I think infotainment has taken over, and the people let it.
Well my model for the US handling depletion is simple if 1 in 10 Americans falls into abject poverty they won't be using a lot of gasoline. Later it will be 2 in 10 etc. So the simple and ruthless solution is to do nothing and allow a increasing number of people to fall through the cracks. The simple model scales to regions countries etc. Its actually close to the way the world works now with 90% of the resources going to 10% of the population. It just that in the future it will be 90% to 1% of the population. The issue is this 9% that comprises the Western nations middle class. They consume a lot of resources but most have no stored wealth. You eliminate them then we don't have a depletion problem.
Paraphrasal:
"The worlds oil demand comes mainly from the US and European middle classes. Make a chunk of them poor and we don't have a depletion problem."
Flash of insight and light bulb goes off.
You're *exactly* right.
I don't think this completely solves the problem for the elite. By shrinking the middle class and reducing consumption you also reduce the size of the economy and hence the number of people that can live off of investments. This strategy will shrink the size of the upper class as well.
Not all the upper class will survive peak oil also.
The hit will be lower but ones invested heavily in food and probably oil or in general ELP related technologies or ones needed to transition will do well. We have not talked about transition technologies but obviously as the world re-localizes their must be a reinvestment in infrastructure that will make a few of the rich richer. Those invested in retail sales and non-required products will probably do poorly. The rich are as fragmented a group as any other and probably the least cohesive class that has no problem "eating its own" so to speak. Your correct that a lot of rich people today will not be rich post peak. This was the case in the Depression also.
Hi memmel,
This is really an interesting idea (here and above).
I wonder if there's any way to back this up with some numbers.
And if so, would they be meaningful? For example, what percentage of oil use is really done by the middle class? How would one go about attempting to quantify this? How would you classify "users"? What about manufacturing? What about corporations? Both use and consumption.
re: "transition technologies". Could you perhaps give some examples?
I'd like to see you (or someone) expand on this whole thing.
does anyone have a similar exports chart for norway and france, perhaps normalized to USD in 05/05?
Germany as well. and denmark even.
it would be interesting to see teh different european strategies.
Cause france has nuclear power, denmark has wind power, and exports tons and tons of tubines, same with germany!!
cheers
Gilgamesh - if you check out the link I gave to Westexas you'll find some charts along the lines you are looking for - in bpd not $.
Remember that most oil is used in transportation while France's nuclear and Denmark's and Germany's wind strategies are in power generation.
The UK strategy for power generation has involved a switch from indigenous coal to indigenous gas and imported coal - followed by a lot of hope when UK gas supplies ran down.
Right, nuclear power in France avoids essentially the use of coal, compared to similar european countries. Nice for CO2 emission, but not a big help to face oil depletion. And sorry, there is not enough uranium for all countries having the same proportion of nuclear power, until GenIV is ready. If it will...
Thanks for another fine post on TOD :-)
Regarding coal power, a new Wuppertal study on co2 capture and storage clain an additional energy consumption for capture and storage of +30% ( page 22 middle)
http://www.wupperinst.org/uploads/tx_wibeitrag/ws35e.pdf
If true then CO2 capture and storage is dead.
Kind regards/And1
Re CCS, yes, I had heard it cost about 30% in energy. And about 25% in extra capital cost, IIRC. What do you want - a free lunch? Still might be viable; depends on the cost of CO2. Currently about 18 EUR / tonne for 2008 futures.
This is for Europe only of course; if you are in the USA then you ignore externalities like global warming, and CO2 is free, gratis, $0.00. In which case, I agree with you: CCS is dead.
i was thinking along the lines of a quick switchover to electric transportation (more than current)
already having 80% nuclear and much lower FF usage as a percentage of gross energy product hedges strongly against rising coal/oil/natgas prices. It also means that less nuclear plants will need to be built (france may have to build 1/4 more nuclear plants to reach 100, but the usa would have to build 4 or 5 times as many as currently in operation to reach 100%!
Bullshit makes the flowers grow.
For the entire world to use as much nuclear as france does, that would be some 2000 reactors world wide. Each reactor consumes some 200 tons of natural uranium per year, but that can be halved to 100 with extra enrichment and halved again with reprocessing regimes. The economic breakeven for ore recovery today of uranium is some 200ppm. This is present in flyash from coal alone, and many other unexploited ores bodies around the globe.
http://nuclearinfo.net/Nuclearpower/UraniuamDistribution
The avaliable ore recoverable at this level is some 100 million tons. This would last some 1000 years.
When you allow technology to exploit lower ore grades (and just using double enrichment and reprocessing would) you have vast resource multiplication. With fluid fuel thorium burners, the resource avaliability is 120 trillion tons burned at 1 ton per GW/year. If you burned that as fast as possible without making the planet melt (some 10^16 watts worth) your fuel would only last 16 million years.
Concerns about uranium supply are simply ignorant.
Hi Euan
thats a great graphic of the problems facing the UK - I have been posting on David Smith's blog (the chief economics editor of the S.Times) trying to make him aware of the PO threat - and the threat to the UK from the North Sea collapse. He has at least printed a couple of my comments but he is still seemingly very anti-PO. I suggested he look at the upcoming problems faced by the UK, without much success but I wonder if you could send him that graph? It might stir him up a bit (your credentials are much better than mine, I believe you have been in contact with the DTI etc). Thanks andy
His latest blog is here:
http://business.timesonline.co.uk/tol/business/columnists//article190891...
I sent it to him.
Hmmm, think I'll move to Norway.
Thanks Rembrandt. Since I follow EIA Petroleum and Condensate Production, I see Peak in 2005. Your analysis confirms the consequence.
I am sure many will waste many words, but why? Frankly, Peak Oil is boring. No party favors and fireworks. More like watching the paint dry.
The Dinosaurs saw the bright light on the horizon, the asteroid burning in atmosphere, and then compacently turned their heads back to eating biofuels. Let us fill our glasses to the rim with lime and ethanol and toast the end.
SKÅL!
乾杯!
Is there any OPEC spare capacity in Iraq, Nigeria, or elsewhere?
With rig utilization rates high and infill drilling continuing in the fourth year of the oil boom, production curves were close to flat. The trillions of barrels of conventional oil reserves once forecast by Exxon are not rapidly appearing.
When one cannot find a new oil field, one goes to an old field and drills more wells, this increased the production rate and decreased the number of years of meaningful production.
The U.S. has about 500,000 producing oil wells. 400,000 of these produce about a million barrels a day combined. That is about 2.5 barrels of oil/day per well.
http://www.fossil.energy.gov/programs/oilgas/marginalwells/index.html