| Link roundup: Oil-free Sweden and We Luv Public Transportation | The Oil Drum | Economy grows at slowest pace in 3 years |
Hubbert Linearization Analysis of the Top Three Net Oil Exporters
Posted by Prof. Goose on January 27, 2006 - 3:47pm
Let's assume that we have a world where all oil production is from one country--Export Land--that produces 20 mbpd, consumes 10 mbpd, and exports 10 mbpd to oil consuming countries around the world.
Export Land hits the 50% of Qt (URR) point, and over a five year period production drops by 25%. Over the same time period, Export Land's consumption increases by 20% to 12 mbpd. This causes Export Land's net exports over the five year period to fall from 10 mbpd to 3 mbpd, a decrease of 70%--resulting from a combination of increasing domestic consumption in Export Land and a 25% drop in production.
Let's look at real world production with our hypothetical Export Land as a model.
Stuart's original Hubbert Linearizaton analyses for Saudi Arabia and Norway indicate that Saudi Arabia is 55% depleted, Russia is 88% depleted and Norway is 67% depleted (thanks Khebab).
I believe that Saudi Arabia is on the verge of a long term decline in production. Texas, the former swing producer, with a similar P/Q intercept, showed a 29% drop in production over a 10 year period after its 1972 peak.
Russia peaked at a broad plateau around 53% of Qt, and production is down about 25% from its peak. Although production has been increasing recently, in all likelihood this was just compensation for the dramatic drop in the Nineties, which was probably due to both natural depletion and political problems after the Soviet Union collapsed. If this assessment is correct, Russia is on verge of a dramatic collapse in production, almost certainly in the double digit percentage per year range.
Norway peaked at 55% of Qt, and has been following the predicted downward slope exactly as predicted.
As predicted by Hubbert Linearization, two of the three top net oil exporters are producing below their peak production level. The third country, Saudi Arabia, is probably on the verge of a permanent and irreversible decline. Both Russia and Saudi Arabia are probably going to show significant increases in consumption going forward. It would seem from this case that these factors could interact this year produce to an unprecedented--and probably permanent--net oil export crisis.
Contact
- Content: editors at theoildrum dot com
- Tech support: support at theoildrum dot com
License

This work is licensed under a Creative Commons Attribution-Share Alike 3.0 United States License.
- Stop the Iran war -
The most trustworthy source I have found for Russia is Ray Leonard, former VP Exploration and New Ventures for Yukos. He is now Sr. Vice President for MOL Plc. He is a regular ASPO attendee. In this abstract of the text of his 2002 Uppsala presentation RUSSIAN OIL AND GAS: A REALISTIC ASSESSMENT, he states
This conclusion is repeated in a presentation Russian Oil And Gas Reserves (ppt).He also presented in 2003 (ASPO newsletter #164) at the Paris Second International Workshop on Oil Depletion giving a talk entitled Can Russia make up the Difference and for how long?". I can't find the full text.
He also participated in the 2005 Lisbon meeting in another talk entitled The Reality of Russia (ppt). From Slide 3
So, he's an expert on Russia and an ASPO regular. I think some information you may be seeking on Russia can be found in these sources.As far as the Russia continental shelf/Artic goes (eg. the Kara, Barents Seas) go, I have a pending post on the shelf that I've been meaning to finish. I think I'll get right on it.
Hope this helps.
Most recently, as Matt Simmons pointed out, all of the majors were dead wrong regarding the North Sea. Hubbert Linearization was dead on right regarding the North Sea.
Except for some "noise" around the collapse of the Soviet Union, Russia has been following the "glidepath" down. Why should we not expect it to continue? However, the key point that a lot of people seem to be evading is that Russia--exactly as predicted by the model--peaked in a broad plateau centered on about 53% of Qt.
Let me repeat. Hubbert Linearization accurately picked the peak of Russian oil production.
The key challenge is the following. Name me one region/country with decades of serious production (at 2 mbpd or so or more), with a Qt of at least 50 Gb that has shown increasing production beyond 55% of Qt.
Hubbert linearizations are a good thing but in Russia we have the infamous "double peak" because of what happened in the 1990's. In the (P/Q)/Q calculation, where are we getting reliable information about cumulative production to date? The Soviets were pretty secretive about their production history. What's our data source?
Khebab addresses the data issue down the way.
The North Sea is a far more compact province than Russia that should have been far easier model. According to Matt Simmons, the best engineers in the world at all the major oil companies working the North Sea thought that it wouldn't peak until 2010.
The simple Hubbert Linearization method was far more accurate. North Sea production is down almost 25% from its 1999 peak (using the crude + condensate number). I assume that you would concur that this verges on a collapse--one that the best engineers in the world missed.
If the engineers can be that wrong about a province that--compared to Russia--is a piece of cake, don't you think that they might be wrong about Russia too? In my opinion, the "double peak" was simply cumulative production catching up to where it should have been at this point in time.
Backward induction is a technique to solve a game of perfect information. It first consid-
ers the moves that are the last in the game, and determines the best move for the player
in each case. Then, taking these as given future actions, it proceeds backwards in time,
again determining the best move for the respective player, until the beginning of the game
How much does it take to push people away from their natural strategies?
I have a suggestion for the geologists and petroleum engineers. Figure out what the heck your measurements and estimates mean, and then perfect the formula to eliminate the magical guess work. The more I look at it, the more I seriously think that no one has figured out how to do estimates of oil reservoir volume correctly
It almost sounds as if no one wants to admit that a parabolic growth law has any kind of importance.
And FSU Oil Shock Model here
However, if you discount OPEC reserves by 50%, it becomes clear that we are WELL past that half-way point. So production should have already begun to decline. This suggests that, as widely feared, only the use of water injection and water flood tecniques to keep reservoir pressure artificially high have kept production rates up for the past several years. The problem with this is that when a field who's production rate has been artificially sustained beyond the half-way point finally does begin to decline, its rate of decline tends to be very, very high. 10-18% has been suggested (by Simmons and others) as the decline rate for fields that have been pressed to the limits with injection technologies. This is critical, because while Peak Oil may be a quite manageable problem at 2% depletion, 10%+ depletion means that world production will fall by half in less than 7 years. That would be absolutely catastrophic. No wonder this story isn't available on CNN.
Mobjectivist has the Parabolic Growth Law and Fractional Yearly "Reserve Growth #'s and Jeff Vaill has the Implications.
Game Theory states that we now must assume the worst. Catastrophic oil depletion this year.
We've used 1000 Gb. If we have past 50% some time ago, that means we could be well into the 60s.
1000 /.60 = 1,666.67
1000 /.65 = 1,538.46
1000 /.70 = 1,428.57143
Overall, if we have used 60% of URR, the average decline rate will be much higher than if we were at 50%.
Which is why I asked if most countries use techonology that has delayed their peak...
Also, how much will the countries that are ramping up production offset the decline rate?
I certainly wouldn't compare myself to Hubbert, but I have gotten a small taste of what it must have been like for him to challenge conventional wisdom,
I was at an oil industry meeting last year where a geologist employed by the State of Texas gave a talk debunking Hubbert. Of course I challenged him on it during the Q&A. In response to one my points, he said "Texas may not be able to equal its peak production, but we can certainly get close with better use of technology."
In 33 years, Texas has never shown year over year increases in production, and we are down close to 75% from our peak. It shows how deep the denial is that an allegedly competent scientist can ignore data in front of his face and talk about production increases. Our problem is fields like the East Texas Field, which is now producing 1.2 mbpd of water, with a 1% oil cut. How does high tech help you revive a field that has watered out?
I saw the Enron documentary yesterday. It's a Ten
by the way. See it if you can.
Anyway the movie flashes the book Selfish Genes as a book Skilling runs his life by.
From the book or like minded authors-
We humans are blissfully unaware that we are driven to behave in ways that maximize inclusive fitness. Because of the advantages of unawareness of our own deceptive tactics and of our suspicion, I suggest that innate tendencies made us "embarrassingly stupid" as far as conscious awareness of these facts is concerned.
Evolutionary theory predicts the inherent selfishness of the individual. Therefore, we would not expect communication to develop as a means of informing others of the truth, if such truth gives the recipient an advantage at the expense of the sender. Cronk (1991) suggests to "follow the example of animal behavior studies in seeing communication more as a means to manipulate others than as a means to inform them". In other words, most communication serves for the purpose of social influence, defined as "change in one person's beliefs, attitudes, behavior, or emotions brought about by some other person or persons" (Raven, 1983, p. 8).
This demonstrates that deceit as an influence strategy is neither new nor a human invention. Second, it is likely that humans employ strategies as low as level two (body language signals of strength or submission) or maybe even level one (immature and baby-like facial features in an adult).
In summary, we should expect a good strategists to strive to maintain an image of being a truthful person. He or she should be prepared to deceive whenever it confers a sizable advantage versus a much smaller risk.
It's now obvious that the powers that be got away with the Enron model. Lay and Skilling are big, but they ain't
Chase Morgan or CSFB.
The US has absolutely no intention of slowing "growth"
(the same def as Enron's-whatever we say it is).
We will continue until stopped. By PO, Climate Change, or nuking Iran.
For example: I recently listened to a debate between a Peak Oiler and an Abundant Oiler from an Art Bell radio show from about a month ago. My wife said that she thought the Abundant Oiler won the debate, and I have to say that most unknowledgeable people would probably feel the same. The Abundant Oiler was lying up a storm, but it was obvious that he was used to this and he had practiced staying calm and beating his message to death. Also, his message induced a very warm, feel-good emotional state of long-term economic stability.
The Peak Oiler had the real data, but I could see how he could easily confuse the average non-technical person. Also, his voice got very shrill as he slowly freaked out at how many lies the Abundant Oiler was making. The tone of his voice and his message induced a state of confusion, insecurity, and irritation.
It was an interesting case of how easily a person ruthless enough to lie like a dog, can beat an honest technical person for the hearts of the average person. In my Neuro Linguistic Programming classes, they used to say that people aren't swayed by reasons, but by their emotional state.
On the other hand, maybe this is a lost cause, and we destined for the hard landing later, instead of the softer landing now. But, I would like to hope that we could do something...like convincing the average person of the reality of PO.
I can believe that some large fields in mid east, like Ghawar, may reach perhaps 70% URR / OOIP so there could be more recoverable oil than you expect.
Though the water cut from Ghawar is about 35% now its rate of increase has been slow, steady and seemingly well managed, it was over 20% 25 years ago.
Russia is just weird, I don't think any relatively simple model will work for it. There could be anything from 50 to 100 billion barrels of URR remaining (80% probability range).
One thing we really need to know more about is how EOR has impacted production rates and decline rates for large fields. I think this will be absolutely critical in attempting to project forward, I too expect some seriously nasty decline rates.
More philosophically, I almost never lie, often manage to go several years without telling even the smallest white lie, one lie a year is a bad record for me. When I do choose to lie it usually causes me considerable trauma both before and after, I almost never lie by mistake since being untrue is now so alien to me. Yet I am very aware of people around me lying continuously, often without being aware they are doing so. Is it me that is sick or them?
I never liked "The Selfish Gene" book or thesis, it is well argued but doesn't ring true. I generally consider the 'common good' above personal benefit, if I could gain 15 at the cost of 10 each losing 2 then I would not do it. But I am very rarely ripped off and can be a very good bargainer and negotiator when needed. Maybe I am a communist who believes in personal freedom, lol.
Besides, it's clear at a glance that the Hubbert linearization is no good for Russia:

Production has moved well above the logistic fit and continues to climb. If I fit a line to this last portion I get that Russia has, let's see... looks like an infinite quantity of oil to me. Boy, you sure can learn a lot by fitting lines to charts, can't you?
Until the collapse of the Soviet Union, the Russian P/Q versus Q plot was following a perfect linear progression. The recent increase in production was just compensation for the post-1989 decline below the "glidepath" down toward what is effectively zero annual production.
As I pointed out in regard to Norway, Russia peaked in the same range as other countries/regions, e.g., Lower 48 (48%), Texas (52%) and the North Sea (52%). Therefore, why should we not expect Russia to continue the linear progression?
I don't mean to be a contrarian for obnoxiousness' sake; I'm just trying to get some kind of quantitative handle on the fundamental similarity in depletion advance between the two that you are arguing for.
http://www.eia.doe.gov/emeu/cabs/topworldtables1_2.html
I think that the best estimate for US Qt is about 225 Gb, for Russia about 160 Gb.
67891012345678910123456789101012345678910
10123456789101012345678910101234567891010123
456789101012345678910111212345678910111212345
67891012345678910123456101234567012345678
9101234567891012345678910123456789101234
5678910
That leaves the mid east with a good hand to play. I could see China, Japan, US and EU all being played off one another in a high stakes game of "who gets my exports?"
I think Iran has the right idea. Build nuclear power plants and use those, while selling the oil and gas. Use your one-time gift of petroleum to build the infrastructure for the post-carbon age.
The case may be that Iran uses its oil wealth to build reactors and then at a later date with will not have the fuel to run the reactor.
Unfortunately, breeder reactors are the ones we don't want countries like Iran to have.
Small physical size, small power size, low fabrication costs, very sparse fault tree, low research and development costs, very small radioactive byproduct production, not proliferent (the plutonium does not get recycled to "clean" it for fabrication because it is just remelted, not even clad), thermodynamically and neutronically efficient.
Low CO2 emissions from mining because you use all the uranium instead of just .73%.
But the low research and development cost is a killer. If you go to all the trouble of renting some congressment and senators, why bid for a small contract designing one of these instead of something complicated that will let you make some money?
Well, assuming the Middle Eastern exporters want to get as much as possible for the oil they choose to sell, the place for them to go will be . . . the world oil market. For that matter, assuming that all exporters want to get as much as possible for the oil they choose to sell, the best place for them is also . . . the world oil market.
How this plays out and how far it eats into the fungibility of the oil market is likely to be very significant in the next few years, in both market and geopolitical effects. The US policy of 'free market or conquest' is likely to be a losing strategy in this environment.
So far, from what I have seen, no country/region with serious production over several decades, at serious levels of production (say two mbpd or more) and with a Qt of 50 Gb or more, has shown increasing production beyond the 55% of Qt mark. We have seen declines and then increases, e.g. Russia, but the recent Russian production level is far below is mid-Eighties peak.
I didn't mention it in my post, but if you use the 2004 EIA numbers (http://www.eia.doe.gov/emeu/cabs/topworldtables1_2.html), if Russian and US consumption figures were switched, the US would be the second largest exporter in the world. Would any of us be comfortable with the thought of relying on the US as the second largest exporter in the world? Then why aren't we concerned about Russia?
I have been studying the Peak Oil issue since Deffeyes' first book came out, and this is the first time that I have managed to scare myself.
I believe we will be hearing a lot more statements like this in the near future. Oil (and natural gas) is going to start losing its fungibility. It is THE strategic resource. Just ask Condi.
What evidence is there that this will happen? Has this happened in Norway? Their production has been declining for several years - are they keeping prices low domestically so that Norwegian businesses have all the oil they want, while exports are being cut off?
How about Russia? When their oil production dropped off as the economy collapsed post-communism, did they stop exporting? Or did they continue to export as a means of acquiring much-needed foreign capital?
And then, if these countries do subsidize internal oil consumption, how do they know what price to set? There is no market mechanism available for this purpose. It would have to be done on a purely central-planning basis.
I'd like to see some historical evidence that this is how countries behave, and that this diversion to internal markets is going to be a significant factor in the post-peak world. Did you know that the U.S. still exports oil? We are not a net exporter but there are still exports going on in various places. Oil goes where it is needed, where people are willing to pay for it. I am skeptical that this principle will cease to operate in the future.
In my opinion, this scenario is going to set up a positive feedback loop where increasing oil prices will accelerate the rate of growth in the Saudi and Russian economies, thus accelerating the increase in domestic oil demand, thus decreasing net oil exports.
By the way, current consumption for SA, Russia and Norway is about 20% of their total production (4.5 mbpd). Based on Hubbert Linearization, their combined remaining reserves are 109 Gb. For the sake of argument, and as a WAG, let's assume that their long term combined consumption averages 6 mbpd (remember that the average Saudi family has something like seven kids).
Let's look forward 15 years. At 6 mbpd, the three countries would consume a total of 33 Gb in 15 years, leaving 76 Gb available for export. At current rates of export (6.7 Gb per year), the 76 Gb would be consumed in about 11 years.
I would anticipate that they peak within five years, and then start a terminal decline. BTW, note that the ongoing problems in Iraq are not helping the export picture.
You beat me to the punch, and made the case more convincingly besides. As long as oil goes to the highest bidder, it's possible (probable is another matter) for exports to increase even as production declines.
However, my gut tells me that when peak oil becomes obvious to everyone, and prices start to skyrocket, then exporting countries may not be willing to let the market set the price, at least internally.
If there are oil riots in Saudi Arabia over the price of oil, the Saudis may begin to subsidise oil use internally and cut back on exports, for example. But I don't see it happening in the short term.
Some countries have not followed that route, UK is one example: its domestic price of petrol is higher than all other EU countries, I think, despite it having been a net exporter (until a few months ago) for more than 20 years.
The optimal use of taxation, particularly on gasoline / petrol is probably worthy of analysis, particularly when oil supply may go down, oil prices go up, in the near future. A steady increase in taxation while prices are relatively low can encourage increased efficiency without significantly prejudicing business competitiveness by allowing them to gradually adapt. It also builds a buffer into the local market price which is protective should real market prices increase significantly. When retail gas prices in US increased 50% in response to the hurricane supply shocks the UK price rose a mere 10% (I do realise this argument is somewhat flawed since the local US effects were inevitably more profound, but the difference is well beyond what could be explained by those local effects).
On this I would say that UK and other developed countries like Japan and other EU countries have got it right and the US has got it badly wrong. Admittedly that has mostly been arguably for the wrong reasons (easy source of taxation, excessive govt spending) but the US low gas taxation policy has been due to even more wrong reasons IMO.
In Russia the situation is different, just look at the situation in the Ukraine, Belorussia, Georgia and other ex-sovjet states. It seems pretty clear that Russia is prepared to use her energy resources as a strategic weapon. Ukrainians has experienced what happens when they elect a pro-western leader. Belorussia, called the last dictatorship in Europe, has a much more Moscow friendly leader, and Russia has not been threatening to increase their prices. If Putin thinks Russia gains more from selling cheap energy to country A than selling expensive energy to country B, then Gazprom will sell cheap energy to country A. This all depends on how much foreign capital Russia needs, balanced against what strategic advantages they can gain by shutting and opening valves on the pipelines going to various countries.
Expect another round of valve closing and bitching by the EU aimed at the wrong country.
There might be such a contract, there might be arguing about the legality of it, I do not know for sure. The point is that it is arguable if there is stealing involved.
"Saudi exec: Oil prices unlikely to drop"
http://www.businessweek.com/ap/financialnews/D8FD1VHG1.htm?campaign_id=apn_home_down&chan=db
But honestly, the high price of oil is mostly down to speculators making money on the markets. There is no rational reason for current high prices, supply is plentiful.
There was this french guy about 100 years back, Petomane was his stage name I think. He was a wow in London theatres doing talking farts and igniting them.
Here is my question - we are all assuming that internal oil use will remain unchanged as oil prices rise. But is this really a valid assumption?
If exporting countries (SA and Russia) are poor relative to consuming countries (US and Europe), then the consuming and wealthier countries can afford higher prices which the poorer exporting countries can not.
What I'm asking is, why the response to high oil prices be a decrease in internal oil and gas usage in exporting countries, keeping exports constant or even allowing exports to increase (at least in the short term)?
One part is to open for lease more northerly waters at a very measured pace. This allows technology to "come along" and start production from a new area as the old one nears depletion.
So Norway may be past peak (surely so for current North Sea areas) but fresh areas may have more or less oil (probably less, the North Sea was a VERY good area). So I would keep Norwegian production on a bumpy plateau. (Think US production with the "bump" of a new area opened for exploration, North Slope Alaska).
They are NOT following the implicit assumptions behind the Hubbert exploration and production curve.
Matt Simmons pointed out that all of the majors working the North Sea were predicting that the North Sea would not peak until 2010. But Hubbert Linearization was dead on right for Norway specifically, and the North Sea in general.
The Qt mentioned is for the Norwegian North Sea, not Norway as a whole. They exploited their first half of the North Sea more conservatively than the British did theirs and are likely to continue for the second half. Natural gas production For now, AFAIK, increased and is offsetting decreased oil production. They have more than enough money coming in.
Norway is now talking about future leases in unexplored territory but, again, AFAIK, has not yet made a firm decision.
Would be a bummer if the financial system collapses, but I give them immense credit for the responsible and longsighted way they have developed their oil and invested it for their future.
When you look at Scandinavia (Sweden, Norway, Denmark - insufficient knowledge of Finland, I felt it necessary to elaborate, there may ne americans here) they seem to be much more intelligent than other countries in the policies they have followed and intend to follow.
Once Qinf and K are individually computed using the Hubbert linearization, the resulting logistic curve is placed in order to match as best possible the last production number. Note that there is probably quite a large uncertainty bar on the resulting logistic curves.
It does not change much the curve, it's maybe less steep.
- Russia: 200 Gb
sorry! the figure has been updated.
For your two graphs, can you please give us the exact years when each of the curves (SA, R, N, I and Total) peak, and the size of the drop in the subsequent year? It's hard to compare a graph with a low-resolution scale against reality.
To me, this casts serious doubt on the methodology. It's most obvious when you look at the total production curve (the top one). Here it's been heading almost straight up, and the extrapolation from the model has it doing a 180 and heading almost straight down. If Peak Oil theory depends on models that make the reverse prediction from what is really happening, you have to wonder if these curves mean as much as everyone assumes.
- Norway:
Past production (<
2004)19.4746 GbLogistic parameters: K= 0.1647, Qinf= 30.45 Gb, peak date= 2000
- Iran:
Past production (<
2004)56.95 GbLogistic parameters: K= 0.0473, Qinf= 121.0982 Gb, peak date= 2009
- Saudi Arabia:
Past production (<
2004)110.63 GbLogistic parameters: K= 0.0777, Qinf= 175.82 Gb, peak date= 2003.5
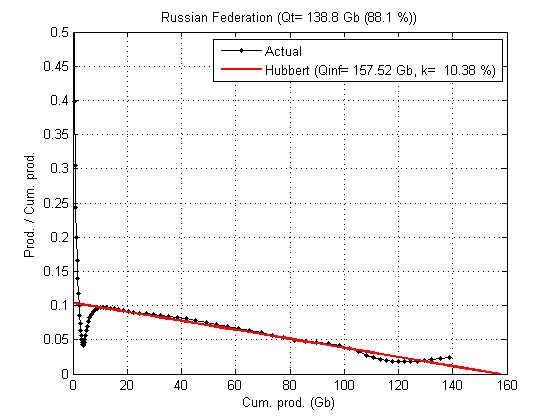
- Russia:
Past production (<
2004)138.79 GbLogistic parameters: K= 0.1083, Qinf= 151.59 Gb, peak date= 1995.5
If you think there are errors in my cumulative production values, let me know.
I've watched the herculean efforts that you and others here have made to model the russian situation and my gut feeling is: not possible without a detailed multidimensional and complex model that would probably take several man months to devise and tweak. For now I would suggest that the approach of analysing new fields coming on stream and probable declines in existing fields is likely to be the most realistic method.
The other countries look more reasonable, though I very seriously hope that Saudi outperforms your analysis. Iran looks optimistic on the final graph.
I take it from the graph that Russia reached its 2nd peak in 2004, and has been declining since. This conflicts with the actual data from the EIA, which states that Russian oil production increased by 2.5% in 2005. What was the percentage drop in 2005 predicted by this model?
As I said before, an unimodal function is not appropriate for Russia. Below, I give a tentative multi-logistic fit obtained from an algorithm I developped recently (too complicated to explain here). The red curve is obtain from a mixture of 4 logistic curves (the blue curves) with the following parameters:
   peak year   K   URR

1: 1982.943  0.169 80.601

2: 1973.552  0.100 43.104

3: 2021.743  0.112 43.790

4: 2008.652  0.234 53.938
The second peak is in 2009 at 11.5 mbpd for an URR of 221 Gb which is close to the reserve estimates given by Dave above.
Re: Blindingly Obvious Idea for Testing the Validity of Hubbert Linearization (HL)
mcgowanjm had a post on "Backward Induction" that gave me an idea that is, in retrospect, blindingly obvious. FYI--mcgowanjm also posted a link to a FSU oil shock analysis: http://mobjectivist.blogspot.com/2005/11/fsu-oil-shock-model.html
We have data on several large regions that are well past the 50% of Qt. Examples are: Texas; Lower 48; Total US; North Sea and Russia.
I propose that the HL gurus take the data through the 50% of Qt mark--AND ONLY THOSE DATA POINTS (i.e., pretending that the data after the 50% mark don't exist)--and estimate what Q (cumulative production to date) should have been through 2004, and then compare those predictions to the actual data. This would be especially useful for testing the validity of the HL model as applied to Russia.
This seems so obvious that it would seem that someone should have tried this before. Anyone know if it has been done?
If as I suspect, this analysis confirms that we are at the threshold of a severe net export capacity crisis, I think that someone needs to hold a press conference.
westexas@aol.com
Also, if you have a chance, could you try the excerice that I described for Russia?
P(t)= 0.25 * k * Qinf * (1- (tanh(0.5 * k * (t - t_mid)))^2)
You need to estimate t_mid:
1- if the production is mature enough (past 50% of Qinf), simply find the production date where Q(t_mid)= Qinf/2
2- if production midpoint has not been reached yet, you need to use another criterion, for instance you can look for t_mid which is minimizing the fit mean square error.
I'm working on it, also I'm trying to apply the Hubbert linearization separately on different regions (Volga-Ural and west Siberia)
It's like,"Are your ready for extremely high oil prices?" "Oh, and by the way, did you know that the Nazi in the White House is to blame." I think he might be taking advantage of already-high prices to subtly Bush-bash. His underwriting of the Kerry campaign obviously didn't work out as planned.
I couldn't help but notice that your analysis is well-larded with waffle words. For example:
It would seem from this case that these factors could interact this year produce to an unprecedented--and probably permanent--net oil export crisis.
Clearly you are hedging for the possibility that you might be wrong, but why do you have doubts? The overall tone of your presentation is that the linearization method always, and infallibly, works. So why are you expressing doubts?
You also say: "If this assessment is correct, Russia is on verge of a dramatic collapse in production, almost certainly in the double digit percentage per year range."
What are your doubts here? Are there some possible reasons why you believe your assessment might not be correct? If so, what are they? If not, why do you hedge? Also, what do you mean by "verge"? Can you put a number on that?
Similarly, can you put some numbers on this: "I believe that Saudi Arabia is on the verge of a long term decline in production." How far away (in months, years etc.) is "verge"?
I find your literary criticism somewhat pedantic, nay, I will go further: it is borish, nitpicking and unwarranted. It is possible that you, sir, may be a cad. More bluntly...
If we knew the damned fucking numbers with certainty, had a proved reliable fucking model, we would fucking tell you, and TOD could probably breathe a sigh of relief and vanish in a puff of bloody smoke, quite possibly along with most of modern civilisation. But, and here I must apologise, we and no one does and it hasn't.
On re-reading my last two paragraphs were over the top a bit, sorry, my attempted point was that style in grammar is not necessarily obfuscation. I found his language reasonably precise and accurate, perhaps he's been mixing too much in polite UK circles.
A wider, perhaps relevant, point: I find that often people do not tell the whole and absolute truth as they see it, sometime people actually lie. I solve this by becoming more aware of the truth underlying their words, it is a useful skill, can work online as well as IRL. TOD is a very truthful place as I find it.
Way to lay it on the line. The oil industry has collectively laid down a set of data mining boobytraps that we have to carefully navigate around or we will blow up real good.
They don't call it data "mine" for nothing.
"As predicted by Hubbert Linearization, two of the three top net oil exporters are producing below their peak production level. The third country, Saudi Arabia, is probably on the verge of a permanent and irreversible decline. Both Russia and Saudi Arabia are probably going to show significant increases in consumption going forward. I predict that these factors will interact this year to produce an unprecedented--and probably permanent--net oil export crisis."
In regard to Hubbert Linearization "always working," I don't think I said that. What I did do was challenge anyone to come up with an example of it not working, for a country/region with a Qt of 50 Gb or more, with decades of serious production (say 2 mbpd or more). My specific challenge was to find an example of such a country/region showing increasing production beyond 55% of Qt.
I don't think that Saudi and Russia are likely to go into imminent and significant decline. I think Russia is a special case of constrained production and must be modelled in a more complex way.
Saudi is complex in a different way. There has been less pressure on Saudi to develop and overproduce its resource than any other country, there has always been more in their tank. They say that their major fields could have a URR of perhaps 75% of OOIP, I find that hard to believe, but I would bet that it could average as much as 65%.
Saudi Aramco are quoting a predicted URR / OOIP of 75% for some of their best major fields (like Ghawar). The best figure for a worked out field that I am aware of is 68% so I am sceptical, but I do think it will be better than our modelling suggests.
I must to bed, been an interesting night here, sleep well when you do.
Thanks.
From this article:
SPK: How large are the Saudi tank farms in country and internationally, like the ones in the Caribbean?
MRS: Somewhere between 50 and 70 million barrels of domestic tank farms and they have about 10-15 million barrels of Atlantic basin tanks farms that is broken out between some storage they rent in Rotterdam but the majority is in the Caribbean. The only times there is clear evidence of a Saudi surge was during the Iraq war where it jumped by about 800,000 barrels a day for about 45 days. I bet you they were just emptying the tanks farms.
sorry if it was already posted/commented on
http://money.cnn.com/2006/01/27/news/international/pluggedin_fortune/index.htm
Long time reader, first time poster.
From my studies of ecological populations, I have an appreciation of trying to make sense of huge data sets without the luxury of control groups. As I recall, cluster analysis was the tool of the day back then (could have merit in your pursuits). I pay homage to all of you that have crunched the data that you have presented. It is hard work and an addiction (there is a pattern here...I know it...if I just gather more info). Anyways, I get it and tend to side with the early toppers (to quote Legget). I believe we have passed Peak Oil, but not Peak Oil Awareness (in the general population). Another few revisions in reserves from companies and/or countries and will be be there as well. Your site has gone a long way towards more awareness.
I am constantly checking oil prices online at work and love seeing the myriad of justifications put forth by government officials, corporation PR personnel, and economists. Today, it is the continuing tensions with Iran/Nigeria. Yesterday, it was ????....I forget it changes so often. Oil goes up to almost Katrina highs and it's not a big story...no mainstream press covers it. It is the boiled frog symdrome. 2 steps forward, 1 step back. While everyone was distracted by the AMAZING corporate profits and gains...oil price increases sneak in the back door.
I know this was not quite on topic for this thread, but couldn't wait for an open thread to post. I felt it was time to join up.
Keep plugging away on the data. You are making Simmons proud (towards data transparency). Now if you all would just create a political party we could all rally around.
I'm a pessimist (= early peaker) but I don't think that peak oil is yet in the bag. It could be, especially if we get a significant long term supply disruption soon but, barring such, I'd guess at 2008 unless a recession delays it.
Best not to pay much attention to the comments about why this or that price moved today, they are mostly just grabbing the first plausible hook that has been impregnated in their head. 'Tis entertaining though.
Just correlations could be just useful. If any potentially useful thoughts occur to you please do mention them. You might get some flack if they are really silly but you might help save the planet if they are useful. I don't think something like TOD has really existed before, it's a place where possibly the most significant turning point in human history for thousands of years is being explored while most of the world sails ignorantly by (for now, at least). You have a duty do help where you can.
My own view is that Stuart and Khebab should right a paper together for a peer reviewed scientific journal, not that TOD isn't pretty close, putting all of the information generated over the past six months together. Such information is far more likely to reach a larger audience that way, although one can never overestimate the capacity for the main stream media and press for over simplifying these concepts.
Main stream media? as long as it doesn't make "The Situation Room" on CNN. I can't take Wolf Blitzer anymore than 2 seconds. If that! Where's my remote?
But it is important to remember that they are working with inadequate, possibly less than accurate, sometimes contradictory and shifting data; trying out a variety of fairly simple models; getting a real feel for the underlying truth as best they can.
Someone, maybe the planet, maybe the US govt, maybe Bill Gates or some other affluence, should say: here is $1m, give us the best answers you can as soon as you can. It would be a wise investment.
BTW...I wonder how many unspoken readers there are out there. Have you ever posted visitor tracking data to this site?
Note that the Hubbert Linearization estimates range from about one-third to one-half of conventional estimates. You may also recall the recent apparent leak of confidential Kuwait data that support the Hubbert Linearization estimate that Stuart did.
IMO, there is nothing particularly earth shaking about the Russian estimate. It falls in the same ballpark--as a percentage of conventional estimates--as the other Hubbert Linearizaton estimates, and the recent trend has been decidedly against conventional estimates, e.g. Shell Oil, Kuwait, North Sea, etc.
http://www.infoplease.com/ipa/A0872964.html
RankCountryProved reserves
(billion barrels)
1. Saudi Arabia 261.9 (80)
2.Canada 178.81*
3.Iran 125.8 (60)
4.Iraq 115.0
5.Kuwait 101.5 (40)
6.United Arab Emirates 97.8
7.Venezuela 77.2
8.Russia 60.0 (20)
9.Libya 39.0
10.Nigeria 35.3
*Including tar sands
Westexas, Khebab, whoever--show me--outside of the standard modelling--that the shit is about to hit the fan in Russia. I want facts about below ground geology in their various oil provinces and above the ground considerations to show me that the modelling is somehow in touch with reality. Don't show me some curve fitting. Show me some approximate real numbers about what's going on there in Russia and then back them up with mathematical modelling. I want reliable figures about cumulative production to date--now, 2006.
I am concerned all the time that people here go off into never-never land based on their sophisticated mathematical skills. I admire the effort and purpose but I need to see how these models fit the facts above and below the ground.
Modelling is a good thing if it is based on good data. Otherwise, it is masturbation. If you're going to do a thorough analysis, put the two together and make a truly convincing case.
best, Dave
Occam's Razor, "One should not increase, beyond what is necessary, the number of entities required to explain anything."
I think that Hubbert Linearization works because whether you are capitalist, communist, American, Arab or Russian, you find the big fields first. I think that we are primarily plotting the decline of the big old fields, and the smaller fields that we subsequently find have little effect on the plot. Case in point: the frantic drilling program in Texas from 1972 to 1982 increased the number of producing wells by 14%, while production fell by almost 30%.
The simple fact is that Russian oil production peaked at a broad plateau centered on about 53% of Qt, and nothing that anyone in Russia has done has brought production back up to its peak level.
As I pointed out above, the North Sea is kid's play compared to modeling Russia, but the majors--and the best engineers in the world--got the North Sea dead wrong, while the simple Hubbert Linearization method got it right.
The Lower 48 peaked at 48% of Qt.
The North Sea peaked at 52% of Qt.
Russia peaked at a broad plateau centered on 53% of Qt.
There is no evidence that production in any of these three provinces will ever be brought back up to their peak levels. The only real difference between Russia and the other two is that political instability caused a lot of production to temporarily cease after the collapse of the Soviet Union. The recent uptick is just bringing the cumulative production back to where it should be at this point in time.
We find the big fields first. The smaller fields that we subsequently find can certainly be profitable, but they don't have a significant effect on Qt. It's as simple as that.
Furthermore, I require more evidence for the statement that "Russia peaked at a broad plateau centered on 53% of Qt".
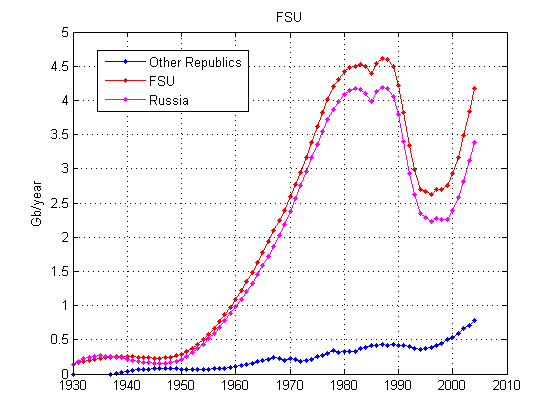
Following is a link to Khebab's production versus time plot. Russia production hit a plateau from roughly 1979 to 1989. Production then fell by about 50%--in my opinion because of a combination of natural depletion and production being shut in because of the political problems. But the key fact is that Russia has never come close to producing at the same level that they achieved at the "broad plateau." I would define this as a peak.
Russian Production & FSU Production versus time plot:
http://static.flickr.com/33/89752437_ab8b3ac428_o.png
Then how do you explain Prudhoe Bay ? Or Cantarell ?
How ? By creating two nations where one exists, Lower 48 & Alaska.
Hubbert Linearization, applied before the discovery of Cantarell would have shown a nation nearing their peak. It would have been a worthless tool in 1970 in predicting Mexican production from that point forward.
If you cannot (technology) or will not (political) explore in certain areas then your Qt figures and your "biggest first" logic does not apply.
Once an area is open to exploration for a just a few years, then I agree.
Technology opens up a new province in VERY deep water in the Gulf of Mexico. New Qt for the US. Decent new discoveries are found, total US production stabilizes for a few years instead of decling. With better luck, production could have gone up a bit in the US. And such VERY deep technology has not yet been universally applied.
Yellow Sea & South China Sea almost certainly have oil & gas. But whose ? Undersea border disputes prevent drilling. How much is there ?
Russia still has some unexplored provinces (not THAT much, but some) and two different levels of technology (a step function there while it has been a gradual year-by-year improvement elsewhere). The application of new levels of technology plus some new provinces resulted in the the double peak.
In my opinion for HL to work best we need: (1) reasonable geographic limits; (2) decades of serious production at 2 mbpd or so or more and (3) a Qt of 50 Gb or more.
As I have said before, in terms of distance, geology and timing of development (relative to the Lower 48), Alaska might as well be in the Middle East. Mexico, in the early Seventies, doesn't meet the parameters I outlined above.
If do you want to incorporate Alaska, I think it makes more sense to look at all of North America.
The Lower 48, the North Sea and Russia meet all three of the above characteristics. All three are producing at levels far below their peak production in the vicinity of 50% of Qt. All three regions have been unable to increase their production beyond what they achieved in the vicinity of 50% of Qt.
The conventional wisdom regarding the Lower 48 and the North Sea was that peak production was far later than what HL indicated. Conventional wisdom was wrong. HL was right. I think that conventional wisdom is wrong regarding the remaining reserves in Russia. Time will tell, but the historical models are not in Russia's favor.
Finally, the Cantarell Field is interesting. It is the last one mbpd field to be found (depending on how you classify the Caspian Sea production, where it seems to be primarily a case of deciding to start development programs). It has been 30 (Thirty) years since we found a one mbpd or larger field, while we are producing and consuming record amounts of oil. It this is not evidence for the premise that we find the big fields first, I don't know what is.
My point in starting this thread was that, in my opinion, we are going to face a critical problem with net export capacity, probably this year, because so much of the export capacity is critically dependent on big old fields. Furthermore, because of torrents of cash being dumped into the exporting countries, one would expect to see their rate of consumption accelerate as their economies expand more rapidly, which is what we saw in Saudi Arabia in the Seventies. I expect some version of my Export Land model to become harsh reality.
Russia is in the midst of a massive rail electrification. The finished the Trans-Siberian in 2002. They are working on electrifying BAM RR (the last major project of the Soviets) and the "Trans-Turkish" line (name from memory). They are slowly expanding Urban rail. The population is not increasing much and may start decreasing.
If they want to, they can lay more pipelines and replace much of their oil heating with natural gas (a logical step IMO). They finally signed onto Kyoto.
They have surplus hydroelectric power in Siberia that could be used in a variety of ways (methanol production for example).
So the assumption that a richer Russia will consume more oil is flawed. It depends upon decisions made.
Saudi is a more compelling case for increased oil consumption, although I will note that Dubai is building an urban rail line and Saudi could as well, moving away from a car-centric culture. Their petrochemical industry depends upon export demand, which may not be strong soon.
A Russian over at PeakOil.com said the population of Moscow has increased by 30% in the past five years. They're facing rolling blackouts because the infrastructure cannot handle the sudden increase in population.
I think Russia is going to be consuming a lot, just in the higher standard of living of its citizens, and in upgrading their infrastructure for the new Russia.
Russian is actively working towards almost zeroing out that 3 million b/day figure* via electrifying rail (and moving some pax that way too) and keeping that the primary mover of freight (probably increasing modal share).
* Russia is larger and has lower population than the US. They will likely need as many or more tonne-km than the US for a comparable living standard, even with fewer people.
Their population is smaller and MUCH more dense, so oil for local delivery use should be far less as well even with comparable living standards.
Yes, Moscow is growing and they are building some more urban rail (not enough yet). New electricity is likely to come from natural gas, not oil. Russia cannot sell all of the NG that they can produce (yet) but they can sell all of the oil . Later, they will build more nuclear and coal for electricity (and hydro is not exhausted). But growth in Moscow means shrinking population elsewhere, and reduced demand for new infrastructure.
Building new infrastructure is NOT a highly oil intensive activity (unless one builds American sprawl). Construction workers in Berlin often come to work by electrified urban rail and do get supplies via truck from local depot. I suspect Moscow is comparable. Concrete, glass & steel consume coal and natural gas and not oil.
If Russia wants to, they can get richer and use less oil in the process.
I was thinking of energy it takes to make the materials - steel, concrete, asphalt. And mostly, I was thinking of the rising standard of living that goes with the money pouring into the Russian economy. A rising standard of living is as good as a population increase.
It would be interesting to see a graph of Russia's energy use. I know their oil use dropped by something like 50% when their economy collapsed, but I wonder what's happened since 1998? I bet it's going back up again.
Russia ended 2005 with its seventh straight year of growth, averaging 6.4% annually since the financial crisis of 1998. Although high oil prices and a relatively cheap ruble are important drivers of this economic rebound, since 2000 investment and consumer-driven demand have played a noticeably increasing role. Real fixed capital investments have averaged gains greater than 10% over the last five years, and real personal incomes have realized average increases over 12%.
LUKoil Cuts Exports
LUKoil said on Friday that it would cut fuel oil exports by a quarter in February to meet local demand at a time of extreme cold. Traders said other firms might follow suit. A LUKoil official said the firm would cut exports by around 118,000 tons in February from the 435,000 tons it intended to send abroad in January.
"LUKoil confirms it is ready to deliver fuel oil to [power monopoly] UES, and the housing sector as electricity demand has peaked because of the cold snap," the official said.
Private major LUKoil has always tried to maintain good relations with the Kremlin and has often been among the first to react to state requests, such as a call for a cut in gasoline prices or a reduction in fuel oil exports. (Reuters)
http://english.pravda.ru/society/2002/06/19/30663.html
http://www.interfax.ru/e/B/politics/28.html?id_issue=11456325
http://prorev.com/2005/09/russian-population-falling.htm
The high end estimate for ANWAR is 1 mbpd (based upon geological surveys but no drilling). If we are lucky and that is what is produces, then it will be the last one found.
If there is a better argument that if you 1) can't or 2) don't look for oil in a particular area, then you will not find it, I don't know what is.
Is there a 1 mbpd field in the South China Sea ? Quite possibly but no one knows. Boundary claims prevent exploration. China and Japan are talking about resolving their differences and opening up the Yellow Sea.
What is further north along the Norwegian coast ? Oil & gas (VERY high probability). How Much ? No one knows.
HL works for explored areas. I believe that a giant or super giant, with modern geology, will show up in 3 or 4 years after an area is opened for exploration. Rabbits are MUCH easier to miss than elephants when you go hunting, BUT you have to be hunting ! If one "stays home" even the elephants will be missed.
Russia cannot yet explore the Barents Sea. One day it will be able to. Norway expects significant oil & gas in their section. Where else has either the Soviet Union or Russia not explored at all ? Offshore Pacific & Artic mainly, and some high Artic land areas AFAIK.
If you don't look, you cannot find.
Granted, but once world production peaks (which I think is probably happening right now), we will probably be losing something on the order of three to four mbpd, net per year. Are there other fields out there? Certainly. Will they make a real difference? No.
I have only half-kiddingly suggested to my brethren in the Oil Patch that we need to blend in--we need to be driving 1985 lime green Volvos with Greenpeace stickers.
This is one of the most important statements I've read here in a while. You're absolutely right, Dave. The question of how much oil is in the ground in Russia will be settled not by analyzing production trends, but by going to the horse's mouth: the below ground geological structures of Russia.
I think it's way past time that the peak oil community stopped glibly dismissing the USGS, and actually looked at the geological data which the USGS amassed in its 2000 survey of world petroleum resources. If it's wrong, I want to know what's wrong with it from the standpoint of geology.
I'm not an expert on the subject yet, but I have spent a fair amount of time searching this weekend, and have found no evidence at all that the USGS ever forecasted any level of discovery. If you have a cite to back up the claim that the USGS made such a forecast, I would love to see it. :-)
I also find it hard to believe that the USGS method has nothing to do with geology, since most of the undiscovered oil resource is expected to occur in well-known prolific provinces like the Middle East, West Africa, Western Siberia etc. If the method is just rolling the dice, without reference to geology, why is that the case?
Also, the method was correct regarding North American gas:
http://www.geotimes.org/nov02/feature_oil.html
It looks like you may have been sold a straw man:
http://energy.cr.usgs.gov/WEcont/chaps/IN.pdf
The USGS 2000 report was based on a combination of geological, economic and statistical factors. It also considered the extent to which exploration had or not been done. Their statistical method was very flawed: if I remember correctly they estimated the 5% and 95% probabilities of undiscovered reserves and interpolated the 50% probability from those - think about that for a moment, it would almost certainly overstate probable discoveries.
I think that subsequent discovery data has near totally refuted the USGS 2000 analysis. As a prediction of future discoveries it is now totally discredited, anyone who uses it or quotes it for such must be treated with extreme scepticism or downright ridicule.
The USGS did make predictions about future discoveries, it used a statistically nonsensical method to interpolate the probable future discoveries, subsequent discovery data has exposed its method and conclusions, I would guess that the USGS are very embarrassed by it and wiosh they had never done it.
I don't believe you, and won't believe you until you produce a cite showing exactly where the USGS made those predictions.
U.S. Geological Survey World Energy Assessment Team (2000), "U.S. Geological Survey World Assessment 2000," USGS Digital Data Series DDS-60 (4 compact discs).
Not sure if there's been an update. I haven't bought his newer book yet.
http://pubs.usgs.gov/dds/dds-060/
Looks like 2000 is the most recent.
I'm in the process of reading that document right now. The purpose of the study is to assess the "quantities of oil, gas, and natural gas liquids (NGL) that have the potential to be added to reserves within a 30-year time frame"Source.
There are no forecasts of discovery trends in the document. This widely reproduced graph is a straw man, drawn by Colin Campbell, not the USGS. The USGS study attempts to assess the likely amount of conventional oil resources in the ground which are subject to discovery. It explicitly DOES NOT forecast discovery trends because those trends are influenced by economic and political factors beyond the scope of the USGS's expertise.
Here it is, straight from the horse's mouth:
So, as I said, the idea that the USGS has been discredited by the failure of its discovery forecast is a fraudulent strawman being propagated by Campbell and Deffeyes. THE USGS NEVER MADE A DISCOVERY FORECAST.
http://energy.cr.usgs.gov/WEcont/chaps/MC.pdf
says it takes into account "accessibility," which includes political accessibility.
Risk calculations are performed where there is some chance for no resource in the assessment unit. The probabilities for fluids, rocks, and timing are multiplied to give the geologic probability of the assessment unit, the probability of the presence in the assessment unit of at least one field at least as large as the user-defined minimum size. Accessability is the probability that at least part of the assessment unit will be politically and technologically open to petroleum-related activity during the assessment period. When the geologic probability is multiplied by the accessability probability, the product is the geologic and access probability of the assessment unit.
You could start with these links:
http://www.energybulletin.net/2544.html (scroll down for detailed USGS discussion)
http://www.eia.doe.gov/pub/oil_gas/petroleum/feature_articles/2004/worldoilsupply/oilsupply04.html (EIA 2004 supporting and based on USGS)
Here's the EIA 2000 analysis based on the USGS 2000 report:
http://www.eia.doe.gov/pub/oil_gas/petroleum/presentations/2000/long_term_supply/index.htm
Am I not stating the obvious when I say that the USGS 2000 report was explicitly an attempt to predict probable recoverable oil reserves, augmented by predictions of future discoveries. To which I would add: for mostly political reasons.
I appreciate your effort, and look forward to your response.
For reference, I would point out that the USGS methods were vetted and endorsed by reputable organizations:
The methodology was also designed to insulate the process from outside influences:
If I recall correctly (someone tell me if my memory is wrong) USGS used Monte Carlo simulations. I used Monte Carlos to model future revenue streams during the tech downturn. As a result, we had to make only one small lay-off and were able to downsize without going broke. Monte Carlos are extremely useful for getting a handle on ranges of likelihoods (like how much oil might be left out there) -- if you're confident that you're using OK data.
In any case, they are, as Deffeyes puts it, "one Kuwait" behind in U.S. new discoveries, and "one Middle East" behind in world oil discoveries.
So, shall we agree to disagree on semantics, agree that the USGS assessed that URR with its phantom discoveries is about 3,000 Gb based on its 50% interpolation. Note that the USGS 95% probability is 2,268 Gb - remarkably similar to the URR's calculated here - and proceed with trying to comprehend reality?
Baloney. You claimed earlier in this thread that the USGS was totally discredited and should be ridiculed due to the failure of its discovery forecasts. I subsequently showed that the USGS made no forecast, and your case against the credibility of the USGS went down the toilet.
... and proceed with trying to comprehend reality?
Good idea. Maybe we could start by actually considering the geology of different regions before deciding how much oil is yet to be discovered in them. That's my whole point here. Let's quit pretending that geology is irrelevant to determining how much oil is in the ground. Discovery trends are one way of understanding future discovery potential. Looking at the geology is another way, just as Dave said.
The U.S. Geological Survey (USGS) World Petroleum assessment 2000 provides estimates of the quantities of conventional oil, gas, and natural gas liquids outside the United States that have the potential to be added to reserves in the next 30 years (1995 to 2025).
http://energy.cr.usgs.gov/WEcont/chaps/ES.pdf
Why give a timeline, if you're not making a projection?
We would not attempt to assess ultimate recoverable resources; rather, we would forecast the potential for additional reserves to be added in a 30-year time frame (1995-2025) in the current (priority) or emerging (boutique) petroleum provinces (RH). Rationale: Thirty years is very long range for financial planners and technological changes beyond 30 years are difficult, if not impossible, to conceptualize and quantify.
http://www.philhart.com/peak_oil.php
I've been hunting for an article (from late 2005 maybe, though perhaps it was a reprint with comments or update from 2001) on EnergyBulletin that did a critique of the USGS (? EIA based on USGS) for specific countries (UK and Norway amongst them) but I can't find it. I thought I saved the direct link but seems not, if you know what I'm looking for and have the link I would be most indebted.
1. Don't bother to read original sources
2. Don't fully understand techniques, but call them flawed anyway
3. Don't provide cites to back up your claims
4. Despite 1-3 above, suggest that those not in agreement with you should be ridiculed.
In case you're wondering, Colin Campbell doesn't understand the USGS technique either, and frankly admits it:
I have also read a good deal of the original sources, including all of the USGS report that is online.
I have used Monte-Carlo simulation techniques, as far back as 1979, in a variety of diverse situations.
I will provide links and data showing the USGS predictions (yes, that is very specifically the report's purpose) are wildly optimistic and have not been substantiated by subsequent reality.
Does it not seem quite possible that Colin Campbell was diplomatically trying to avoid being critical?
I draw your attention to this in the quoted question: "is averaging F5 & F95 predictions still a valid approach for determining the mean estimate" to which I answer, with total certainty: it is absolutely statistically and mathematically invalid. Go ask a decent statistician if you don't believe me.
Not at all. I am simply insisting on scientific integrity, and respect for accepted standards of proof/scholarship.
I do appreciate Westexas your work and quantifing the hoarding(look at the manical sense of power this will give some ) that I agree will be very significant, and may make Hubbert's not true from about now, into the future.
http://www.peakoil.com/fortopic8497.html
comes up with 97 billion barrels of offshore and onshore oil remaining in the ground in the RF at this moment, enough to produce oil at the current rate of 9.6 MBa/day for 28 years.
mcgowanjm had a post on "Backward Induction" that gave me an idea that is, in retrospect, blindingly obvious. FYI--mcgowanjm also posted a link to a FSU oil shock analysis: http://mobjectivist.blogspot.com/2005/11/fsu-oil-shock-model.html
We have data on several large regions that are well past the 50% of Qt. Examples are: Texas; Lower 48; Total US; North Sea and Russia.
I propose that the HL gurus take the data through the 50% of Qt mark--AND ONLY THOSE DATA POINTS (i.e., pretending that the data after the 50% mark don't exist)--and estimate what Q (cumulative production to date) should have been through 2004, and then compare those predictions to the actual data. This would be especially useful for testing the validity of the HL model as applied to Russia.
This seems so obvious that it would seem that someone should have tried this before. Anyone know if it has been done?
If as I suspect, this analysis confirms that we are at the threshold of a severe net export capacity crisis, I think that someone needs to hold a press conference.
Based on a Lower 48 plot that I found on The Wolf at the Door website, the Lower 48 hit 50% of Qt in 1972.
The total US hit 50% of Qt in 1976 (based on Stuart's Model #1).
It appears that Russia hit 50% of Qt in 1984 (Khebab would have to verify this).
My question: what is the variance (% below or % above) for each region and country if we use the data from the year that the region/country hit 50% of Qt--and back--to estimate a new Qt and then use the logistic plot to estimate Q through 2004, henceforth called Q (2004).
Note the only influence on the variance estimates from current data is to pick the 50% point. We would only use the data from that point and back to predict the Q(2004) number for each region/country.
We could then presumably use this to derive a low, middle and high case for annual production in five year intervals going forward for the exporting countries and for the world (which, regardless of whether we use crude + codensate or all liquids, is at about 50% of Qt).
The average length of time between hitting 50% of Qt and 2004 for these five regions is 24 years (29 years if we exclude the North Sea). If the HL method is more or less accurate in predicting Q (2004), using data from an average of 24 years ago, how could anyone doubt the validity of the model?
Hitting the 50% mark was the Deffeyes' reason for picking Thanksgiving Day last year as the Peak Oil date. He outlined what I call the Hubbert/Deffeyes method in great detail in Chapter Three of his book, "Beyond Oil: The View From Hubbert's Peak."
What we know is that world oil production is flat year over year--which has happened before, but we have never been at the 50% mark before. Also, even before the hurricanes and current geopolitical problems, the price of light, sweet crude oil was trading at record high nominal oil prices. These two facts support the proximity to peak production.
Hubbert predicted world peak based mostly on geology. I see techonlogy as being used delay global peak oil by keeping extraction rates high. This would be important to model. It's scary but I think it needs to be done. Could you help me with that?
We need to be clear about some of our words and numbers though. OOIP is largely irrelevant, a minority of fields actually recover more than 50% of OOIP. What is important is the URR and the means used to calculate that. The URR / OOIP % is important and does vary with time (in response to new data and new tech).
Peak oil is when we produce the most. The odds are that will closely coincide with when we have produced about 50% of URR but that need not be the case. That may be a very important distinction. Ultimately neither of these are the most important measure, that is probably when current production (and probable future production) falls short of current (and probable future) demand. That is when the current economic system becomes aware it is unsustainable, all bets are off the table then.
country_Qt_1 + country_Qt_n = global Qt. Right?
Another thing I think will factor into decline rates is Crude API. As far as I can tell, reserves do not differentiate between light and heavy, sweet vs sour. This is where transparancey would probably crash the global economy if light sweet crude is actually running out, while 60-70% of Qt is heavy or sour.
Thanks again.
For Russia, URR_0 is the first URR that determines the points used for the fit, URR_1 is then the result of the fit.
Not sure how to interpret the results!
Q_obs(2004) - Q_1(2004) is the difference between the observed cumulative production in 2004 and the predicted cumulative production in 2004 based on URR_1.
If I understand the plot, there is zero variance at at URR of 220 Gb?
BTW, based on your original Russian plot, what year did Russia hit 50% of Qt? (It looks to me that it was around 1984).
However, the key question I am asking is the following: if you take the P/Q versus Q data from the 50% mark and back (from about 1984 and back) and generate an estimated Qt, Y intercept and new slope--using only the 50% mark and earlier data points--what would the predicted Q(2004) estimate be versus the actual Q(2004)?
I really appreciate all your work.
Question: what is your initial Qt -- what I call URR_0 -- in order to define the 50% mark?
What I did is the following:
1- I fix a putative URR_0 value ranging from 140Gb to 240Gb
2- from this URR_0 I define an interval of years from 10% of URR_0 to 50% URR_0
3- I perform a fit in P/Q vs Q using only the years above which give me URR_1 and K1 (note that URR_1 can be very different from URR_0 and therefore the 50% mark is displaced)
4- I compute t_mid (peak year) for the logistic curve defined by URR_1 and K1
5- I compute the difference between the actual Q(2004) and the predicted Q(2004).
Below is the fit that has the minimum displacement of the 50% mark (1985), URR_0 is equal to 164 Gb:
Once again, thank you for all your hard work.
My idea was to use the Qt on your original Russian plot (158 Gb) to get the year that Russia hit 50% of Qt. What year did Russia hit the 50% mark, based on this plot, and what was the production through that year?
Was the plot you just posted constructed using the 1985 and prior data to get a new Qt, Y intercept and slope?
The actual Q(2004) was 139 Gb. The predicted was 143 Gb, based on the above plot. What I find fascinating is that the actual production fell SHORT of the predicted production, when the whole story of late has been about rising Russian production. In other words, Russia seems to be underperforming the Hubbert model, although actual was 97% of predicted. Can we then assume that Russia will continue to follow the Hubbert model?
1985, the observed production level is 10.9 mbpd and the logistic curve gives 11.75 mbpd.
Yes, the used points are circled on the plot, the new Qt is 161.6 Gb.
That's correct, in terms of cumulative production we should be at 88.3% and we are at 85.9% but again we don't know how immature is the second peak.
Russia is a very complex region and the HL analysis should be performed independently on sub-regions such as Volga-Ural and West Siberia for instance. The Volga-Ural region being being much more mature and the recent increase comes from small fields. I believe Russia should be modeled by a multi-logistic model as I said before because the HL result is biased by the first peak.
One (final?) question. What was the cumulative production through 1985?
Observed Q(1985): 81.5 Gb
Logistic Q(1985): 80.78 Gb
The Hubbert Linearization (HL) method--using only data through 1985--predicted that Russia would produce 61 Gb in the 19 years after 1985. In reality, Russia produced 57 Gb. Actual production was 93% of predicted. As I noted above, I think that it is significant that actual production is 4 Gb below the HL prediction, given that everyone is so mesmerized by the recent increase in production.
Can anyone think of any other method that would have been this accurate? Remember, the data cutoff, used to generate the plot, was 1985. Currently, it appears that production is about 5 mbpd above where it should be based on the HL plot, but 5 mbpd is 1.8 Gb per year, so we could actually see a year or two of rising production before production reverts to the curve (assuming that it will). For what's worth, my bet is that Russia will start a steep decline no later than next year. If Russia is going to revert to the curve, if it started right now it would probably require a decline rate of about 11% per year.
Note that if Russia had followed the curve, and if current production was about 4.5 mbpd, total cumulative production would have been 4 Gb higher than current cumulative production. I sugges that you read that again.
I guess my basic question is if the HL method was 93% accurate in predicting the incremental cumulative production from 1985 to 2004, why are we so distrustful of the predicted production in the next couple of decades? The model predicts that production in 20 years will be down to about one mbpd.
IMO, this plot reinforces my concern that we are facing an immediate crisis in net export capacity. What if the Saudi plot is 93% correct?
I think so too. Especially the Arctic continental shelves, the Sea of Okhotsk (where Sakhalin is) and other land-based oil provinces in Russia.
None of this seems to be based on the opinions of Russian or other petroleum geologists (like Ray Leonard) but simply on an estimate of cumulative production up to an estimated 50% Qt.
Sorry, I think reality there is more complicated than that. Westexas said above
Being an empiricist, we'll just have to wait and see. Even Leonard expects some % decline after 2010 but what that will be is unknown. This depends on the extrapolation of the second peak, decline rates in Western Siberia and new discoveries--yes, there are new discoveries--coming onstream and the timeframe for that.IMO, the "second peak" is an optical illusion, especially since the post-1985 cumulative production is 4 Gb BELOW the HL prediction. I am a geologist, but I think that geology verges on being irrelevant in evaluating these provinces with tens of billions of barrels in produced reserves that have been producing for decades. IMO, we are plotting the rise and fall of the big fields. Will there be new discoveries in Russia? Yes. Will they make a real difference? My bet is no.
Don't get me wrong. I think that there is a lot of money to be made in Russia in putting new reserves into production, but my bet is that the new discoveries won't begin to make up for the decline in the BOF's (Big Old Fields)--just like the fields we found in Texas after 1972 could not make up for the decline in BOF's like the East Texas Field.
The linearization for Russia is a mess and we have many estimates of URR there. For christ's sake, you're making me out to be Michael Lynch here ! I'm not him!
You surely admit that you are making a very radical prediction based on uncertainties in the data. Stuart (personal communication) says that John Grace's book Russian Oil Supply, a book I haven't read, says that remaining URR might be about 68 Gb by SPE standards. I myself took a high position based on Leonard--maybe 220 to 240 GB URR all told and maybe between 90 to 100 Gb to go. Your position is that Russia is about come to a resounding crash. My position is that there are new discoveries coming in the Sakhalin region and the polar continental shelves (all liquids, not just oil). Khebab himself in a number of comments on this thread commented on the uncertainties he felt about the situation and the modelling, which I quoted above.
If Russia were to crash the way you think it will, there goes non-OPEC production and we are all really screwed. I just have my doubts about it. This would certainly not be in concert with Stuart's "Long Slow Squeeze".
best, Dave
Russia has been producing 2 mbpd or more for about 50 years. They have produced 140 Gb of oil--roughly 14% of all oil produced to date. If we don't use HL on this area, where do we use it? The HL plot is not a mess. It is a perfectly linear plot up until the collapse of the Soviet Union. The falloff in production was due to political problems. The recent rebound was just catching up, and they are still 4.5 Gb below where they should be.
The HL plot was 93% accurate in predicting post-1985 production. Name me any other method that has been that accurate in predicting cumulative production from a major producing province over a two decade period. How much more verification do you need? Russia is an old province, just like the US. Will there be new fields? Yes. The same as here in the US. I'm developing a couple of new discoveries in Texas right now. Will they make any real difference? None whatsoever.
There is no good analogy between some small new fields in Texas and the potentially much larger discoveries in Russia. No comparison. Russia comprises a larger number of oil basins some of which have not been adequately evaluated.
Please acknowledge that you are comparing apples and oranges as far as Russia goes on the one hand and the US on the other. I'm not denying you could be right but I seriously doubt it. Take the Grace estimate of 68 Gb left to develop. I have no information about what he took into account but perhaps it does not include polar and the Sakhalin areas. I just don't know. Russia and Texas are not shown to be analogous in my view.
Again I say, you are taking a very radical position here and empirically only time will tell. And I would add that extremist statements about declining future Russian oil production are not lending credibility to what we're trying to do at TOD. I am sorry if that sounds harsh but a lot of the future of non-OPEC production is at stake here. If you are right--and I don't discount that altogether--then world liquids production is in the toilet in 2007 and thereafter. Many people, including me, think we've got big trouble but not that bad. Look, Russia is the 2nd biggest oil producer in the world. You are depending on modelling but not the facts below and above the ground in Russia (and also the FSU minus Russia) to tell us all that we're toast--and really pretty soon at that.
If you want to back that up, you've got to make a more convincing case than you have made on this thread. It's got to be more than questionable Hubbert Linerarizations that don't take erratic production histories and unknown discoveries into account. This will be my final word on the subject but I am going to post on Polar Oil vis-a-vis Russia including, I have decided, the Sakhalin regions in the Sea of Okhotsk and whatever new land-based discoveries (like the recent on in the Russian part of the Caspian) that I can find.
again, best, Dave
If we look at some large producing regions that have definitely gone into decline, excluding Russia for now, they are: Texas; the entire US and the North Sea. Conventional Wisdom (CW) was wrong three out of three times and Hubbert Linearization (HL) was right three out of three times.
In my opinion, HL was also right on Russia since production peaked in the vicinity of 50% and since post-1985 production is below where it should be based on the HL model. As cumulative production begins to get close to where it should be, year over year increases are slowing, from 11% to 9% to 2.7% last year.
I don't deny that the post-peak discoveries in Russia will be larger than in Texas, but look at the scale--if the industry finds a new 1.6 Gb field or (more likely) a group of fields with 1.6 Gb in reserves, they have increased URR by 1%. I'm certainly not an expert, but my guess is that the lightly explored regions will be to Russia as Alaska was to the US--helpful, but not helpful enough to reverse the decline.
Again, the reason that we can compare Russia to Texas to the North Sea to the US overall is that we are plotting the rise and fall of big fields.
What amazes me is the depth of denial--on a Peak Oil website of all places--regarding the remaining recoverable reserves in a very mature, old producing region. HL has beat CW three out of three times and it seems to me that the facts--production peaked at around 50%; cumulative production is below the forecast model; and as cumulative production gets close to the predicted model, production growth is slowing--all support HL, not CW.
You are WAY off the mark saying that "you do not expect" what may or may not be in unexplored basins. Your expectations have no relation to facts about an unknown.
Your analogy to Texas is DEEPLY flawed. EVERY onshore basin in Texas had at least one well drilled (some of which missed the large, but not supergiant, fields in that basin) by the 1930s. There were no political or technical (except depth) limits on exploration in onshore Texas. Supergaint fields are hard to miss with even the first well in the basin and primitive geology. Later Texas drilling found the large, medium & small size fields missed with primitive geology and shallow wells.
Mexico (part of Texas offshore geologically, but not politically due to a 19th century revolution) did not find Cantarell till the 1970s. If the United States had drawn maps differently in 1848, Cantarell would have been found in the late 1950s or early 1960s. If one does not explore, one does not find.
There is a chance that a second Ghawar may be off the delta of one of the Russian rivers. There WAS a chance that Prudhoe Bay could have been 3 times larger than it turned out to be. You assume that because Prudhoe Bay was so large (an accident of geology) then any unexplored Russians basins will be no larger has no predictive value. (Note that many oil fields are along the ancient deltas of major rivers).
I will listen with great respect & interest to a Russian geologist who talks about the structures offshore from the Ob or the Barents Sea. And I will accept that, with modern geology, any potential Ghawar will be found within the first 5 wells drilled in a basin (and probably with the very first well). But absent any wells drilled and absent detailed geological survey knowledge, your predictions of the size of of oil discoveries in unexplored basins has no basis.
I am willing to accept that, based upon statistical analysis of the 80+% of the world's basins that HAVE been explored, that the remaining ~10% unexplored basins are 1) unlikely to have a field larger than Ghawar 2) that the pattern of unexplored oil reserves will follow the pattern of the explored 80+% basins. They is X% chance (less than 10%, proably less than 2%) that offshore Russia is another Persian Gulf. However, you cannot seriously preclude another aupergiant field in a completely unexplored basin in Russia (or Norway).
If you want to state (which I believe) that EVEN IF another Ghawar is found in remotest artic Russia it will not save our bacon, then do so.
And it is valid to argue that whilst a second Ghawar could be found in the remaining ~10% of basins, (after all only one was found in the first 80+%) it is HIGHLY unlikely that TWO Ghawars will be found in the remaining 10%. Just do not impose an artifical limit on what is there when no one knows !
Texas peaked at 54% of Qt, and it has fallen ever since.
The Lower 48 peaked at 48% of Qt, and it has fallen ever since. (You can add in Alaska, but it doesn't change the long term decline).
The North Sea peaked at 52% of Qt, and it has fallen ever since.
In all three of the above cases, the Conventional Wisdom (CW) was dead wrong, and the simple Hubbert Linearization (HL) method was dead on right.
Most notably, the majors working the North Sea--with the best talent and the best technology in the world--were 100% dead wrong about the North Sea peak. The simple HL statistical model was dead on right.
Russia peaked in a broad plateau around the 50% of Qt mark, and HL has accurately predicted 93% of the post-1985 production. Can anyone name any other technique that has been this accurate in predicting long term production over close to two decades?
I concede the point the unexplored and/or lightly explored Russian basins will add production, but I predict that it will basically have the same effect as Alaska had on total US production. It will help, but it probably won't change the long term trend. The key Russian oil fields are so far down the depletion curve that huge production declines are a mathematical certainty.
Worldwide, lots of things are possible, but the fact is that no one has found a one mbpd of larger field since Cantarell, 30 years ago (again, it seems that the Caspian Sea production was primarily a question of deciding to develop it). Russia should soon start seeing production declines of several hundred thousand bpd to one mbpd per year.
So who are going to believe, the CW guys who have gotten is consistently wrong, or the simple statistical HL analysis that has gotten it consistently right?
I don't dispute your arguments have merit and might be proven true. But I have two reasons to feel they are wrong: Russia is not amenable to simplistic modelling; it is about the only region we might find significant new oil.
I have another hunch, too: they know of more oil and will not let it be known (or exploited) until it suits them.
There is a crux in this. The US must fall (economically and as a world power), what happens then is flux. Will it be cooperative or a fight for supremacy? No way to know yet, but i probably will as that time nears.
Data will prove you right within a couple of years if that is so, be content to wait on that. Meanwhile put it aside and use your considerable mind to focus on other aspects.
Said with love, blessedbe
Would you consider doing the same exercise for Texas and the North Sea? The following links take you to the data tables. Note both are crude + condensate. I have P/Q versus Q plots on both that I can e-mail you. I suppose that a better way to present the data is to look at the predicted incremental production from the 50% mark to Q(2004) versus the actual incremental production from the 50% mark to Q(2004). If you have time for it, the only one we would be missing is total US (Lower 48 would probably be too hard). I can e-mail you an Excel file with the Texas data on it (also the North Sea, but the EIA data are already in an Excel format).
What would be great would be to have the difference between predicted future production and actual future production from the 50% mark through 2004 for: Texas; Total US; Russia and the North Sea.
What I am really trying to get at is a quantitative assessment of just how good this method is at predicting cumulative production years and decades after we cross the 50% mark. The obvious application is total world production, since we are at the 50% mark now.
Texas Data (note that according the RRC, 3.5 Gb were produced prior to 1935):
http://www.rrc.state.tx.us/divisions/og/statistics/production/ogisopwc.html
North Sea (under 4.1b):
http://www.eia.doe.gov/emeu/ipsr/supply.html