Oilwatch Monthly - October 2007
Posted by Rembrandt on October 17, 2007 - 10:00am in The Oil Drum: Europe
The October edition of Oilwatch Monthly can be downloaded at this weblink (PDF, 1.48 MB, 21 pp).
Latest Developments:
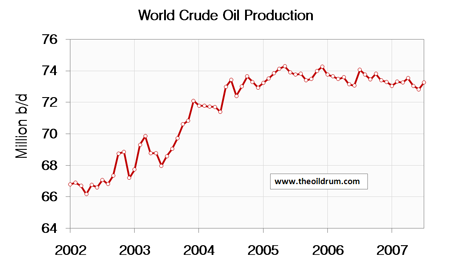
1) Crude oil - Latest available figures from the Energy Information Administration (EIA) show that crude oil production including lease condensates increased by 455,000 b/d from June to July. Total production in July was estimated at 73.28 million b/d, which is 1.01 million b/d lower than the all time high crude oil production of 74.30 million b/d reached in May 2005.
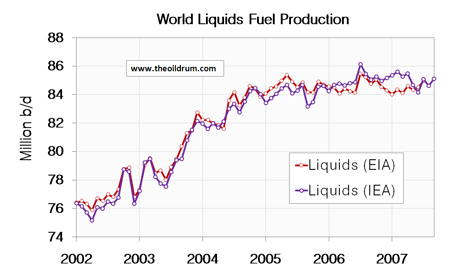
2) Total liquids - In September world production of total liquids increased by 450,000 barrels per day from August according to the latest figures of the International Energy Agency (IEA). Resulting in total world liquids production of 85.10 million b/d, which is 1.03 million b/d lower than the all time maximum liquids production of 86.13 million b/d reached in July 2006.
3) Status of the production plateau - Both the International Energy Agency (IEA) and Energy Information Administration (EIA) figures show that global liquids production has been on a plateau since 2005. The IEA figures result in an average global production in 2007 up to September of 85.03 million b/d, almost to the same as the average 2006 production of 85.00 million b/d and higher than the average 2005 production of 84.10 million b/d. The EIA puts the average global 2007 production up to July at 84.40 million b/d, slightly lower than the average 2006 production of 84.60 million b/d and the average 2005 production of 84.63 million b/d.
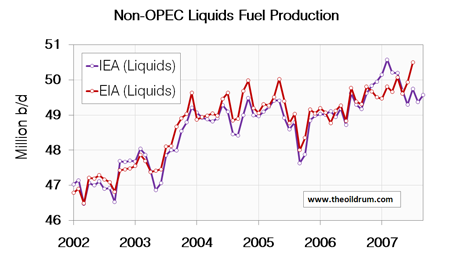
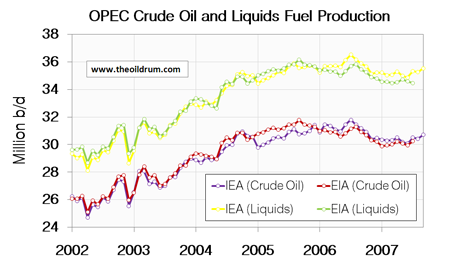
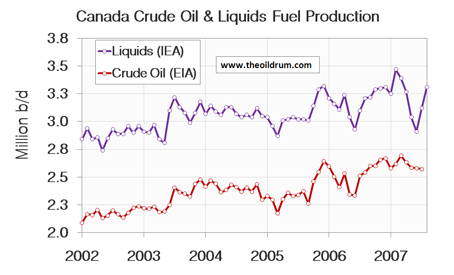
A selection of charts from this edition:
Personnel
Editors
Contributors
Peak Oil Primers
Archives
- November 2010 (3)
- October 2010 (6)
- September 2010 (4)
- August 2010 (7)
- July 2010 (6)
- June 2010 (7)
- May 2010 (2)
- April 2010 (8)
- March 2010 (4)
- February 2010 (6)
- January 2010 (3)
- December 2009 (5)
- November 2009 (8)
- October 2009 (12)
- September 2009 (6)
- August 2009 (5)
- July 2009 (11)
- June 2009 (8)
- May 2009 (16)
- April 2009 (10)
- March 2009 (7)
- February 2009 (10)
- January 2009 (15)
- December 2008 (9)
- November 2008 (9)
- October 2008 (9)
- September 2008 (13)
- August 2008 (10)
- July 2008 (14)
- June 2008 (23)
- May 2008 (16)
- April 2008 (12)
- March 2008 (16)
- February 2008 (9)
- January 2008 (13)
- December 2007 (13)
- November 2007 (16)
- October 2007 (22)
- September 2007 (8)
- August 2007 (9)
- July 2007 (16)
- June 2007 (8)
- May 2007 (7)
- April 2007 (7)
- March 2007 (10)
- February 2007 (10)
- January 2007 (12)
- December 2006 (9)
- November 2006 (15)
- October 2006 (4)
- September 2006 (5)
- August 2006 (5)
- July 2006 (9)
- June 2006 (5)
- May 2006 (10)
- April 2006 (9)
- March 2006 (13)
Vital Trivia
License

This work is licensed under a Creative Commons Attribution-Share Alike 3.0 United States License.
By all appearances, we've hit a plateau. Are we being gamed by OPEC with some hidden spare capacity, with the end result being a world that reforms before the worst hits (while incidentally making an obscene fortune)? I'd like to think so, but perhaps that assumes too much good will on the part of those pulling the levers. Plus, I hear frequently now, "better fly while you can", so we can't assume too much about those who let their levers be pulled.
I was born in Yugoslavia and have witnessed all the mess we had during '90-es. After that experience, I am extremely doubtful that we humans are truly capable of solving our problems reasonably and peacefully. Individually, we can be pretty smart, but as a crowd, we are like a hysterical child. Centrifugal forces might tear this world apart.
Nice to have you here Miroslav. I have been to some parts -Croatia/Bosnia as a tourist. Lovely place, people, beer and wine. Maybe it was too nice??
I agree about groups, they are dangerous and waiting for someone to direct them. We all can see how that ends up.
Can't we all just get along and hate the Turks like the good old days.
RobertInTucson
I haven't escaped from reality. I have a daypass.
The graph is looking a little more plateau like than it had in previous months. But as memmmel has said, perhaps the focus should be more on crude oil than on total liquids, and crude oil is looking "peaked" if you ask me.
Ken
I agree, and I assert that TODer's can really build up credibility by showing how well they can model and substantiate the crude oil situation. Excluding BushCo, it is all about credibility isn't it?
I want to remind the reader of this post that Gail and me wrote an article entitled:
"Did Katrina Hide the Real Peak in World Oil Production? and Other Oil Supply Insights"
http://www.theoildrum.com/node/3052
clearly showing a peak in crude oil production in 2005. A PDF version (1 Mb) is now available here:
http://sydneypeakoil.com/downloads/KatrinaAndPeakOil2005.pdf
We have now to set aside oil and gas fields for the sole purpose of serving as an energy input into all those projects which are needed to de-carbonise our economies. Global warming is accelerating at alarming rates. Read a study from the Naval Postgraduate School
http://www.ametsoc.org/atmospolicy/documents/May032006_Dr.WieslawMaslows...
already from last year, that Arctic sea ice in summer could be gone by as early as 2013, leading to warmer waters around Greenland. This in turn will speed up the disintegration of its icesheets. A 5 m sea level rise this century is now possible as warned by NASA climatologist James Hansen in many of his papers. A good summary from Carbon Equity can be found here:
www.carbonequity.info/PDFs/Arctic.pdf
A peak yes, but likely a temporary peak. An issue that is also adressed on the first page of this month's oilwatch monthly.
You and Matt write in the article that
Consider the case that this 0.6 million bpd of production decline stops and reserves. Then we would not have a decline but an increase, above peak levels of 2005.
In that case the 2005 peak wasn't the peak, and production shall continue to increase.
You quoted by cutting the sentence in half. What we said:
and we specifically included the link to this post:
Geopolitical Feedback Loops in Peak Oil
http://www.theoildrum.com/node/3017#more
I think it's misguided to think in terms of a "geological peak" versus some other kind of peak (and it leads to too many stupid arguments here). Peak will always and necessarily be a result of combined geologic and economic factors.
And when people estimate recoverable reserves, the estimate is based on combined geological and economic factors, which is why the HL model works.
Obviously there is a lot of oil in the ground, even though it is a finite amount.
And obviously we could pump more of it at any given time if we were willing to throw every last dollar in the world at it to create a higher peak.
Memmel is right--the effective peak happened a couple of years ago, because it was the end of the easy, most versatile, most economically-produced stuff. As it takes more energy to get and refine the current stuff, we are in effect getting less even if we technically produce more.
Also consider that all liquids includes a still growing volume of ethanol. Forgetting the very large energy inputs in producing this particular liquid, much akin to tar sands, it contains 1/3 less btu/gallon than gasoline or crude. If the ethanol component of all liquids were simply reduced by 1/3 of the ethanol contribution, we would see all liquids declining faster than recent charts indicate.
I suspect more people would buy into the concept that demand is increasing faster than supply capacity and that excess capacity will soon be absent from the system as a result. Once this occurs, prices will rise until there is sufficient demand destruction to bring supply and demand back into balance.
The above can be successfully argued without requiring the listener to accept that oil production is peaking. It is sufficient to get this listener to accept that the rate of increase in supply capacity is slowing; a much easier argument to make regardless whether it understates the actual situation.
http://politics.reddit.com/info/5ygqz/comments/
thank you for your support...
A concise summation of an over-the-top situation. Thanks.
I've started to believe in modeling just the crude oil component of the peak as this fits in better with estimated discoveries. For example, how do you backdate NGL to previous discovery estimates? What does this even mean? Did somebody at some prior date say that a particular reservoir would produce X amount of NGL? I think not.
http://mobjectivist.blogspot.com/2007/10/global-update-of-dispersive-dis...
Read the blog post and you will notice that I should have realized this a long time ago, and the updated oil shock model results do not attempt to overcompensate for the non-crude discoveries that we lack data for.

Why would just doing crude+condensates only be considered wrong anyway as far as peak detection goes ?
NGL's do not provide anything close to the range of products derived from crude oil so they are not directly equivalent to crude and neither is natural gas for that matter.
I even question including the very heavy high sulfur crudes and tar sands without weighting. The production and refining of these is far more expensive and energy intensive than regular crudes and overall they are not a replacement for light sweet crude.
In short the key is the production of the types of crude we have built our economy around which is centralized on light sweet crude and thus the economic impact of peak oil which is what we are really interested in will follow the availability of the lighter sweeter oils.
The interesting thing to look at is how the main depressive shock started in the 1970s and then slowed down into the 1990's. For this model to truly make sense, people should buy into the fact that significant changes in oil usage occurred spanning the two decades. Clearly, up to the 1970s, consumers used oil like it was water, applying it to all sorts of what we would consider now incredibly wasteful actions. But then the conservation movement woke up, and the USA subconsciously lead the way when they realized their own supply was petering out. So the key is to buy into the possibility of that 40% dip in extraction rate from the available reserves over two decades.
I don't think NYMEX believes the EIA:
$88.50
Arkansaw of Samuel L Clemens
Your graph doesn't provide the details. Did the adjustement change the peak date and the slope afterwards?
It pushed the peak out a few years from my original estimate that I did in 2005. The downslope is less steep as well. This is intuitively obvious in that I don't have to account for as high a peak. The estimate also includes an optimistic model for discoveries that I had developed in the interim, the dispersive discovery model linked in the blog post.
Interesting energy consumption stats by local + more... Check out this US Carbon Footprint Map - http://www.eredux.com/states/
I wonder how California's importation of coal powered electricity skews this??
FF
Some but it really skews Wyoming. Our mild climate gets most of the credit.
RobertInTucson
I haven't escaped from reality. I have a daypass.
Looks like plateau to me. Geologic control has kicked in.
Thanks Rembrandt, I've been hanging out for this report.
There is some comfort in the uptick in world exports - but everything else looks pretty bleak.
In your intro you say
My own view on the peak is that it doesn't matter when. What does matter is that demand is exceeding supply, and this has been the case since 2002. In spite of a 13% increase in supply, prices have risen four fold in US dollar terms, and tripled in Euro terms. This is not what you would expect if demand was constant.
Ron Ox, ex Shell CEO, commented on this recently, commentiing on when the peak is likely to occur:
"In a way it scarcely matters; what really matters is the gap between production and demand. I don’t know whether there is going to be a peak in world oil production, whether it’s going to plateau and then slowly come down."
http://www.davidstrahan.com/blog/?p=46
Once again, fantastic work Rembrandt, looking forward to the next report.
Many thanks for the clear and concise summary.
I will again point out that, as worldwide storage changes are small relative to the vast amounts of oil flowing through the system, PRODUCTION = CONSUMPTION, and so this data shows an incontestable plateau in worldwide consumption for the last few years.
As over this time there has been little rationing, and no major recessions, a plateau in consumption signifies the impact of prices on consumption. The Business As Usual (BAU) growth before the price increases which started in 2004 was to +2 to +3 m/d per year. Three years of plateau is consistent with about 6 to 9 mb/d of price-induced reduction of demand relative to BAU, as of now.
It will be interesting to see how much more demand reduction (relative to BAU) is in the pipeline due to the past price profile, although of course if we move to substantial shortages relative to inherent demand (Oil Crunch), then we might never know!
Looks like being an interesting winter for TOD readers. Actually it is already an interesting autumn!
With flat production and increasing demand, prices are probably headed higher yet. At some point the "invisible hand " of the market will take over. That is usually when the poor can not afford it and demand growth slows.