Did Katrina Hide the Real Peak in World Oil Production? and Other Oil Supply Insights
Posted by Gail the Actuary on October 9, 2007 - 10:00am
In this post, I collaborate with Matt Mushalik from Sydney, Australia. Matt is a civil engineer, town and regional planner, peak oil advisor, and member of ASPO Australia. Most of the ideas in the post are Matt's. I have added a little to the analysis, particularly in the area of the Katrina impact.
In this post, we use a graphical approach for analyzing oil production since 2001. This analysis shows that more and more countries are showing declining oil production, and that this decline in production is not being offset by increases in production elsewhere. If this pattern continues, this analysis suggests that we may already be past the peak in world oil production.
We also look at the question of whether the impact of Hurricane Katrina may have hidden the real peak in world oil production. We find that if an adjustment is made for hurricane impacts, the peak month of production seems to be December 2005 on a crude and condensate basis, and September 2005 on an all liquids basis. The higher adjusted peaks, and greater declines since the adjusted peaks, further suggest that we may be post-peak.
What Does Figure 1 Show?
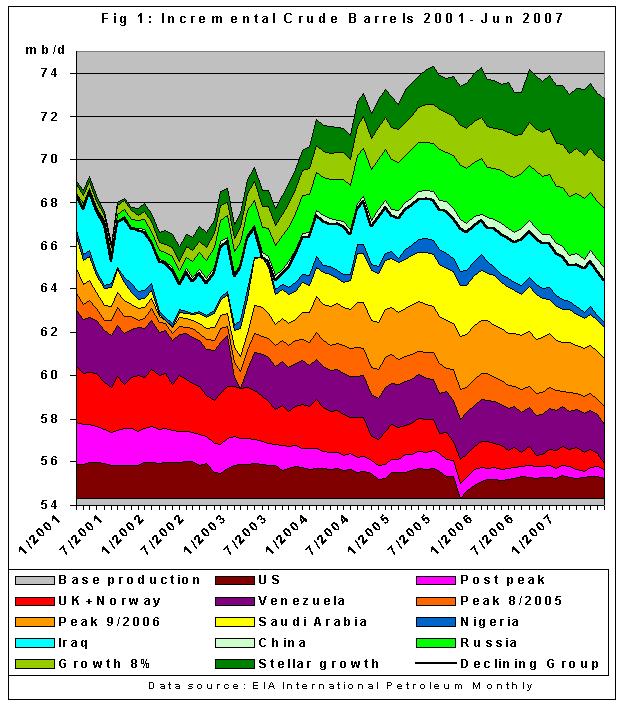
One way of analyzing crude oil production is in terms of how much production has increased or decreased in recent years. To get a visual picture of this, Matt has prepared graphs of what he calls incremental crude oil production for various groupings of countries. Figure 1 shows incremental crude oil production for January 2001- June 2007 using EIA data.
The data used in Figure 1 is developed as follows:
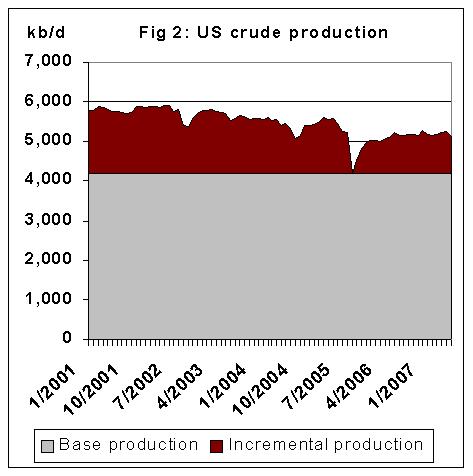
(1) For each country, Matt finds the minimum monthly production in the period 2001-June 2007 and subtracts this minimum from each monthly production to arrive at an incremental production relative to the minimum. For example, for the United States, the incremental oil production is the area in dark red on Figure 2. The data used in the analysis is EIA "crude plus condensate" data.
(2) Note that the amount in the "base" is determined by the minimum, and not the first month. If the first month were used, this would result in positive and negative areas which cannot be stacked to give a useful production profile. Also note that when the bases plus the incremental amounts are stacked, as in Exhibit 1 or 2, in total we get back to the full amount of crude for the appropriate grouping.
(3) For each country, the size of the area on the graph is proportional to the variation in production for the period under consideration. This is a measure for the size of the impact changes have had on the overall production profile, both positive and negative. The US, for example, had only a decline of around 600 thousand bpd, if one excludes the impact of Hurricane Katrina in 2005. The big drop in production after Katrina causes the US layer to be much "thicker".
(4) Matt then sorts countries into following groups, from bottom to top in the graph:
(a) US (Figure 2, shown above)
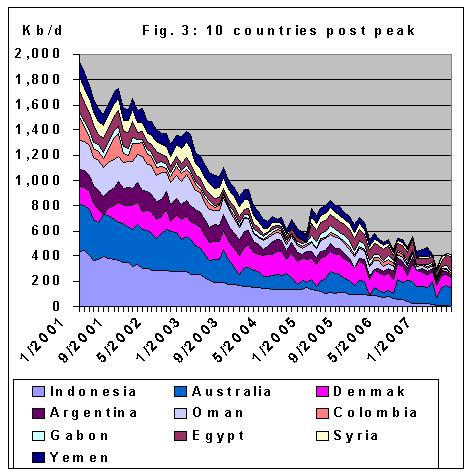
(b) "Post Peak" grouping: Indonesia, Egypt, Syria, Gabon, Argentina, Colombia, Australia, Oman, Yemen, Denmark
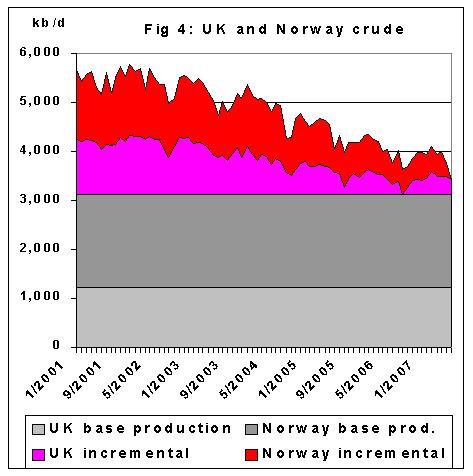
(c) North Sea: UK and Norway
(d) Venezuela (thick layer because of the production drop during the strike)
(e) A group of countries with a common, recent peak in 8/2005: Iran, Mexico, Malaysia

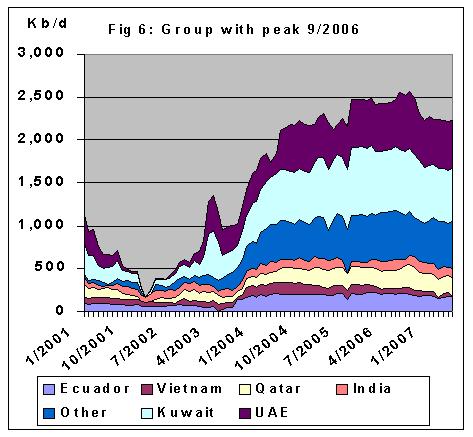
(f) A group of countries with a common, recent peak in 9/2006: Ecuador, Vietnam, Qatar, Kuwait, UAE, India and other
(g) Saudi Arabia
(h) Nigeria
(i) Iraq - A line is drawn between Iraq and China. All countries above the line are considered to be countries with increasing production. The countries below the line are either decreasing, or have variable production that appears not to be increasing.
(j) China
(k) Russia
(l) "Growth 8%" group: Algeria, Libya, Sudan, Eq. Guinea, Brazil. These are the countries below the black line in Figure 7.
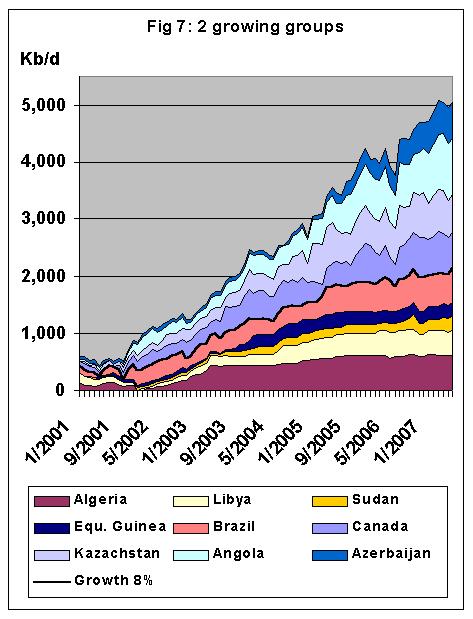
(m) "Stellar growth" group: Canada, Kazakhstan, Angola, Azerbaijan. These are the countries shown above the black line in Figure 7.
What Can We Learn From the Graphs? (Matt and Gail)
This is a repeat of Figure 1, so you don't have to scroll up:
If a person looks at the black line, and the production beneath the black line, one thing that stands out is the extent of the decline since early 2005. Production for this group of countries is now about 3.8 million barrels a day lower than it was in May 2005 . This decline equates to a decline of about 1.8 million bpd per year for these countries. One reason for the large decline is the increasing number of countries that are now post peak, including the countries in the Peak 8/2005 and the Peak 9/2006 groups.
This annual decline of 1.8 million bpd can be broken down to about .6 million bpd annual decline relating to the countries Nigeria, Iraq, and Saudi Arabia (combined), and about 1.2 million bpd for other countries below the black line. One might argue that the production of Nigeria, Iraq, and Saudi Arabia (Figure 8) is not necessarily in long-term decline, so should not be below the black line. Since the production for these countries has recently declined, it is shown in this group.

What is offsetting this decline in oil production below the black line? Figure 9 shows a graph of the increases in production for all of the growing countries (the countries above the black line in Figure 1).
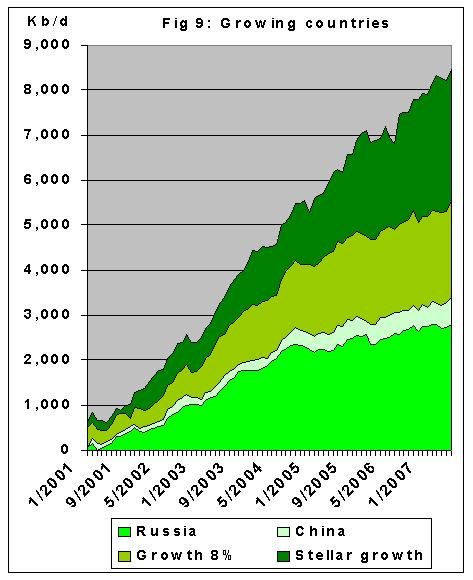
This group of countries has been increasing its production by an average of about 1.2 million bpd a year. While this is good, it is not enough to keep up with the decline in production of about 1.8 million bpd per year of the declining group of countries. Clearly, if the mismatch between increases and declines continues, a long-term decline in world crude oil production can be expected. If this happens, world oil production is past its peak.
If a person looks only at the group of countries that are currently level or declining, the overall rate of decrease in production has recently been 4% per year. This suggests that some day, world production may decrease by something in the range of 4% per year, once there is little new production being added. If there are many offshore wells (which tend to have high decline rates), or if there are above ground issues (like hoarding), the decline rate could be much higher than this.
Where is there a possibility for change?
One possible change is in the countries shown in Figure 8 - Iraq, Saudi Arabia, and Nigeria. If their production can be increased, it could eliminate the recent 0.6 million bpd per year decline, and possibly even increase production. At this point, there is no evidence of this happening, however.
Another possible change is in China and Russia. These are the countries with the greatest oil production in the growing group. Many are forecasting that their production will begin to decline in the next few years. If this happens, the mismatch between countries with increases and decreases will be worse, leading to more of an overall decline.
Another issue is whether the Azerbaijan and Kazakhstan can continue to grow at the rate they have in the recent past. The capacity of the BTC pipeline (1 million bpd) and of other infrastructure are limiting factors in bringing oil to the market. Thus it is not clear their high rate of growth in the past can continue very long into the future.
Impact of Hurricane Katrina (and Rita) (Matt and Gail)
The graphs of EIA oil production we are used to looking at are distorted by the impact of Hurricane Katrina (August 23, 2005) and Hurricane Rita (September 2005). Figure 2 above indicates that these hurricanes clearly had an impact on US crude oil production. What happens if we make an adjustment for this impact?
Figure 10 shows an estimate of the extent of the impact of these hurricanes. Since it is not possible to distinguish which hurricane, we call this the Hurricane Katrina adjustment.
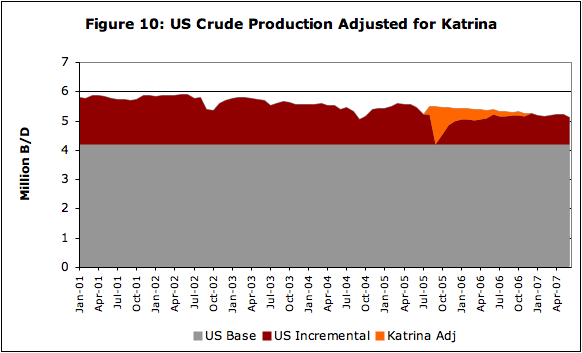
The adjustment shown on Figure 10 applies to crude and condensate. It is also possible to use a similar approach to calculate an adjustment to all liquids. With these adjustments, one can then approximate what world oil production would have looked like, in the absence of the hurricanes. The revised graphs are shown in Figure 11.
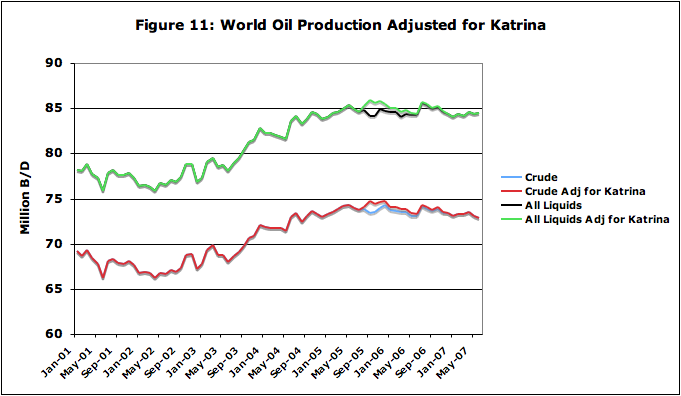
The numeric amounts corresponding to the production amounts used in Figure 11 are shown in Figure 12.
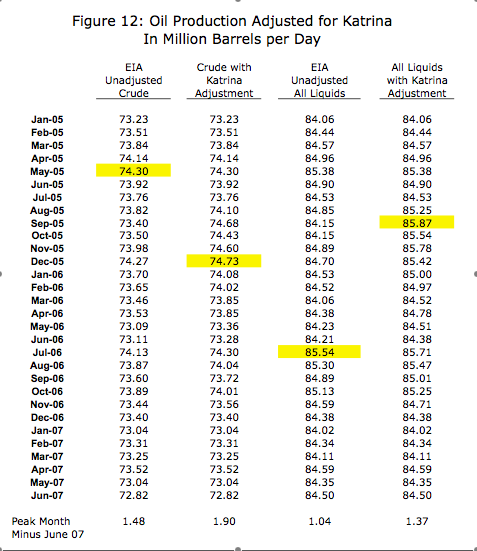
With these adjustments, the peak moves to late 2005, on both a "crude and condensate" and an "all liquids" basis. On a crude and condensate basis, the peak was December 2005, so perhaps Kenneth Deffeyes was correct after all. On an all liquids basis, the peak month appears to be September 2005. With these adjusted peaks, the June 2007 crude amount is 1.90 million bpd below peak and the all liquids is 1.37 million bpd below peak. These adjustments make a stronger case that (apart from the hurricanes) production in late 2005 was the true peak, and we are now on a declining slope.
What Should We Do Now? (Matt)
One of the things we need to do now is monitor the data, and confirm the 2005 peak in world oil production. We cannot know whether this peak was a geological peak per se, or whether there were other factors, such as geopolitical feed back loops involved.
Besides confirming the 2005 peak, it is time (and past time) for governments to take action. I strongly recommend that governments set aside oil and gas fields for the sole purpose of serving as an energy input into all those projects which are required to:
(A) Mitigate the impact of peak oil (e.g. rail development)
(B) De-carbonize our economies (e.g. renewable energy systems)
If this is not done immediately, all these projects may get stuck in diesel shortages. In the worst case scenario, peak oil may damage our economy and financial system to such an extent that we no longer have the strength to decommission and replace our coal fired power plants. The result of all of this could be a different planet Earth (2-3 degree Celsius warming, sea level rises, and crop failures, as warned by NASA climatologist James Hansen).
Hansen writes in his latest paper Global Warming: East-West Connections:
The Earth’s history provides a sobering perspective on prospects for climate change. The Earth’s climate is sensitive to changes in climate forcings, human-made forcings now overwhelm natural climate forcings, and the climate system is dangerously close to tipping points that could have disastrous consequences. Atmospheric composition is now near the limits that must not be exceeded if we wish to maintain a planet resembling the one on which civilization developed, with the equable climate of the Holocene.
How urgent action on global warming is will be seen when the summary IPCC report comes out in November. Tim Flannery, author of the book "The Weathermakers" and Australian of the year, informed us about new data presented in this report in an interview with the Australian public broadcaster ABC TV:
TIM FLANNERY: ..... We thought we'd be at that threshold within about a decade, we thought we had that much time. But the new data indicates that in about mid 2005 we crossed that threshold. So as of mid 2005, there was about 455 parts per million of what's called carbon dioxide equivalent. And that's a figure that's gathered by taking the potential of all of the 30 greenhouse gases and converting them into carbon dioxide potential, so we call it CO2 equivalent.
So 2005 seemed to have been the tipping point year both on peak oil and global warming.
To close on a more positive note, here is an example from the Australian city of Perth how to prepare for peak oil. The mass transit authority Transperth has built a rail line on the median strip of 2 freeways.
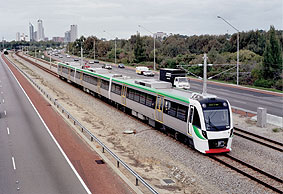
Park & Ride facilities as well as bus interchanges at stations allow long distance commuters access to the rail line from low density suburbs. Perth has also introduced TravelSmart, individualized marketing, bringing together various modes of transport including car pooling and cycling.
Did Katrina Hide the Real Peak in World Oil Production? and Other Oil Supply Insights
PDF version
133 comments
Did Katrina Hide the Real Peak in World Oil Production? and Other Oil Supply Insights
PDF version
133 comments
Contact
- Content: editors at theoildrum dot com
- Tech support: support at theoildrum dot com
License

This work is licensed under a Creative Commons Attribution-Share Alike 3.0 United States License.
http://science.reddit.com/info/2y8it/comments
we thank you for your support.
People don't often associate our soils with the main solution to Global Warming, but there is a growing body of evidence that cooking up agricultural WASTE could both give us a little diesel to maybe run farming, and be a "Silver Bullet" for reducing Co2 back down to safer levels. Just farming an area the size of France in this method is reputed to be able to absorb ALL Anthropogenic Greenhouse gases.
Eprida state:
The Eprida model is an international, decentralized, self supporting approach to carbon sequestration. Because making charcoal locks up carbon which can then be added to the soil, it is offers a method whereby agriculture can become a form of carbon sequestration. The machine they have developed for doing the charcoal burning basically takes 10 tons of any woody or plant biomass and turns it into 1 ton of charcoal and 3.2 tons of diesel.
See also "Black is the new Green" at Worldchanging.
http://www.worldchanging.com/archives/004815.html
And don't forget the ABC Catalyst special with Australian of the Year and Global Warming author, Tim Flannery, at the world's first International Agrichar conference.
http://www.abc.net.au/catalyst/stories/s2012892.htm
Remember that this is vastly different to just storing CO2 underground where it does nobody any good and could potentially be dangerous. Instead we can convert CO2 into useful charcoal that works for us in replenishing the soil. If Agrichar can be scaled up quickly enough, then we have a chance to mitigate the worst of the CO2 emissions until fossil fuel depletion takes over at peak coal in 2025.
Why on earth are we wasting money investigating carbon capture and storage underground, when we could store it in our soils and prepare agriculture for peak oil at the same time?
Eclipse Now
Free peak oil posters to put up at your local library, university, school, or notice board.
Don't want to look for the hair in the soup, especially because I generally agree with what you are saying.
1. Either you take an area the size of France out of the presently farmed area in order to accomplish this goal (which is pol. difficult (!) in an environment of rising produce prices)
OR
2. You create new agricultural area the size of France. This is theoretically possible - just wondering tho, where are you planning on getting the water for it?
OR
3. You could create a Carbon Tax in Kind (i.e. payment to be paid in carbon) to be placed on all agriculture and then systematically build up the soils of run down areas with the procedes...
I could continue my comments, BUT..
btw, wouldn't this post be more appropriate on a drumbeat?
Cheers, Dom
---
Just remember the Golden Years, all you at the top!
The great thing about the EPRIDA model of production is that it DOES NOT take land out of production-- it actually makes the land more productive, by generating carbon negative fertilizer to go along with the biofuels:
http://www.eprida.com/home/index.php4
So, not only do you sequester carbon, you do it in a way that makes the soil more productive, long term, and frees farmers from the need to buy fertilizers generated with fossil fuels. The Amazonians were doing this thing 4000 years ago, just not generating the biofuels along with it.
Yes, terra preta was and is a great method.
A real silver bullet.
I'm quite curious how modern man will screw this one up.
(who, me? negative? naaaaaaaa......)
IMO, what our mathematical modeling primarily shows is the rise and fall of the large oil fields. Regardless of one's political philosophy--Ayn Rand capitalist or Marxist Communist--we tend to find the big fields first. And the smaller fields that we find post-peak can't offset the declines from the old, large fields--whether it is the East Texas Field decline in Texas, or the Ghawar Field decline in Saudi Arabia.
One of the more bizarre discussions I had in the past few months was whether world oil production could grow if every single oil field that has ever produced one mbpd or more of crude oil is definitely in decline.
"One of the more bizarre discussions I had in the past few months"
Yes, however you are surely now ready to admit that your earlier prognostications are almost singly responsible for the depleting credibility of the peak oil community.
Are you kidding?
So far everything that is happening over the last 2 years has consistent with what WT has been saying. Don't know yet if this will continue to be the case, but so far nothing is challenging the peak oil community credibility except CERA and other's CLAIM that the peak is still to come. Over a year since total liquids peak, over 2 yrs since oil peak - if the numbers aren't exceeded in the next couple of yrs I think the game is up.
Way to go, WT!
I personally hold you singularly responsible for the decline and fall of Western Civilization. No wait I mean the Western Front.
No no wait I'm confused. (sips more coffee, laced with pathosanol, jots note to self: diol substitution? )
I have a rendezvous with death...
Remember WT has presented two things the Export Land model and ELP. It looks like as usual we are going to make the right decision way to late but ELP is not a bad life especially if coupled with the electric rail proposals.
I for one will not be sad to see the infinite growth lie to be exposed and a saner more realistic way of living take its place. So the ELP message needs as much exposure as ExportLand.
Its saddening that we are so arrogant and wasteful that it looks like millions if not billions will die because we are wasting our current oil supplies feeding the dying infinite growth propaganda machine.
The only thing I can say is that the Third world is as guilty as the first of turning its back on sustainable living so they share in the blame its not just wasteful Americans.
But hopefully ELP and electric rail will become important soon so don't forget WT second message from the mount or more apt the plain :)
The third world ha been duped into believing that they can all live the American model, They are reaching or this goal in india and china, the reality is that the world can not support another major first world economy based on the current model of buy bury and waste resources.
A perfect example of this is made in a recent TV show in Ireland Future Shock: End of the Oil Age at http://www.rte.ie/tv/futureshock/
While Ireland is not a poor country anymore, it was so just a generation ago, the country has so emulated the American model that it is has gone to a very different place than it was. From a country that while poor was basically starting from scratch in the 70s and 80s, the road that they went down was one of suburbia and sprawl Dublin is getting bigger than la with a 7th of the population. As a tabla blanca the planners and government could have gone down the other path but there was no obvious need to do so.
The blame goes to the planners and oil execs who knew as far back as the 70's that peak oil was a reality. How much of the suffering that is going to occur in the future could have been avoided if big oil had let onthat the future was not as energy rich as they let on.
So it's the third world that has been duped? Somehow I thought it was the first world that has been duped into believing that everything can continue just as it is. I haven't seen any big move away from SUV's, cheap airfares, weekend vacations in the sun, driving to 7-11 for a slurpee, fresh flowers from Africa, my entitlement to a 4,000 sq ft home, cars for the kids, ATVs, living in Phoenix or Las Vegas, etc etc (all parts of our non-negotiable lifestyle that need buckets of energy). So whether there are Katrina effects or not we have some nasty big problems ahead of us. And you think it was a tough sell just trying to get PO on the agenda. Now try to explain that maybe we have also had Peak Lifestyle.
The point is everyone is guilty of drinking the kool-aid.
Certainly if the third world had not tried to follow in the footsteps of the first world and rejected aspiring to the American dream you outlined and instead invested in sustainable high tech they would not be getting the shaft now.
Simply because they waste less does not mean they made the right decisions and I'm sure given the chance they would be just as bad as any American look at the consumption of China's growing middle class. We are all pigs just some are skinner pigs.
I'm sure the peak oil message is not going over any better in the third world than the first and ELP is a hard sell to those who should adapt the most.
Put it this way the third world countries tend to have reasonable natural resources they could have easily leveraged those to buy/build learn technology/medicine to create a ELP culture.
They did not.
No disagreement from me, the cities like those you mentioned as well as Orlando, are unsustainable in an energy scarce future, Take away cheap AC and water from them and they will be very harsh places to live especially if you live in a house designed after the advent of AC. Even if the power goes of for a few hours in one of these homes on a day in the summer it takes a couple of days for the house to cool off again at full AC.
Peak Lifestyle is what the RTE documentary is all about but of course much of what is said can apply to the new cities of America.
Its indefatigable ignorance as a cultural choice. Until the peak lifestyle becomes apparent to enough people that the opinion makers catch on to attract and point the masses attention. Which is ALWAYS too late . . . http://newenergyandfuel.com/ . . . So you're right, peak lifestyle was and is shrinking for many right now. With more to come of course.
umass82 -
Jimmy Carter knew - and he told everybody. Actually, everybody knows that everything will have a peak, and they always have known. But, in the 1970's, no one had a clue as to when peak oil would occur worldwide - just WAG's. Right now, the world is running out of 100's of key items, but no one "knows" when the real problems will begin, oil excepted, because of the size of the oil market and the attention it gets.
JC did try to wean the US of of foreign oil, it is one of the things that cost him the election in 1980. The US did not want to deal with this perhaps what we have here is a ostrich feedback loop, Politicians will not try to force the country to change because hey believe it is political suicide, and because there has been little leadership on this issue then the country is not going to make the changes needed,
I do not believe that there is a real awareness on this issue. I believe that people just do not want to know, the reality is too much for the soccer mom and dad crowd.
That is what doomed JC's reelection bid people did not want to hear gloom and doom they wanted it to be morning again on America and for a while perhaps it was but at the expense of so much.
Awareness it seems will only come when it is too late. The days of a cornucopias society are of course limited, the commodities markets are a reflection of this from iron to copper etc et. It took a lot to convince people on global warming, and still some do not believe in it or do not see it as a bad thing, more days at the beach, long term this will screw us but at least there is some awareness of it, however PO is a train wreck that is going to hit soon and the lack of government and media attention is astounding.
toilfor oil-
That seems odd that you should say the peak oil community has decreasing credibility, as it appears the opposite is true to me. Peak oil is being mentioned with more regularity in the mainstream media, and even the National Petroleum Council is using some of the charts with ASPO predictions on them .
Which of WT's prognostications do you consider as depleting credibility, and why? Or did you just post this as a gratuitous ad hominem attack? Bob Ebersole
Uuucchh..uumm, he grunted, as though clearing his throat.
WT-
when did you start making your first "prognostications"?
-----
Just remember the Golden Years, all you at the top!
Probably January, 2006, regarding net oil exports, followed up by work regarding Saudi production specifically, and overall world production.
Well then, which "earlier" forecasts do you think he would be talking about? The ones in the early '90s?-)
Are we slow to recognize some big fields? I've become curious about esitmates of 400 bbl in the Bakken formation. You can read the Leigh Price paper here.
Chris
It's not oil; it's shale. It needs extensive energy-intensive processing to be useable. There is no way it can be ramped up quickly enough- It's the size of the tap that counts, not the size of the tank.
Plus it would be environmentally catastrophic.
Actually, not so far as I can tell, the formation is shale but it drips oil which is recovered as oil using horizontal wells. The claim then is that there may be 200 bbl recoverable.
Any oil is catastrophic at this point. I'm just wondering if we could be in a situation where large fields exist but we just don't recognize them as quickly?
Chris
md solar
Chris,
There's lots of oil in the world. But what makes an oil field economic to produce is the speed at which it can be recovered from the ground and the cost of drilling and production.
When deciding whether to invest in an oil and gas project a company looks at how quickly they will get their money back from drilling and completing the well and the total expected profits from the well. As prices for oil go up, lower volume wells become more profitable.
Right now stripper oil wells in Texas sell for approximately $50,000 per barrel of oil per day, which should pay out in about 48 months. There's some other considrations, too. Low volume wells are very hard to sell unless someone has some other wells located close by because of the labor involved in operating the wells. Somebody needs to check the tanks and repair equipment as it breaks down,call for the salt water disposal truck and generally at least look at a well every day.
But looking for overlooked and bypassed oil is what our friend WesTexas does for a living. I'm looking in old oil fields for oil that has been left stranded when the wells became uneconomic about 50 years or more ago when oil was $2 or $3 a barrel. there's plenty of oil left, but its not able to be produced in volumes big enough for the car culture to continue using internal combustion engines. Bob Ebersole
Hi Bob,
Thanks. From what I've been reading, getting this oil requires a new way of drilling but it would count as a large field at 200 billion barrels recoverable. Apparently production is increasing rapidly with some oil costing only $5/barrel to produce in Canada. So, I wonder if we are seeing a slower recognition of big fields just because more detailed geology is needed. Since so much of the analysis depends on the behavior of large fields, this might have a large effect on conclusions about decline. If we are seeing slow recognition rather than slow discovery then the discovery rate may not be as low as assumed.
Chris
Essentially a correct assessment of the large field/small field conundrum.
In a presentation I am doing I show that the "first peak" of UK offshore C+C production was accomplished with 32 fields, 75% of which were more than 2 million cubic meters production in 1985 with the largest (Forties, Brent, Ninian, Claymore, Thistle, and several others) past peak. Just the first 3 fields on that list have production 1/4 of the UK's offshore production since 1975.
In the lastest peak (1999), the combined contribution of 136 fields was required to exceed the 1985 peak and that just barely by just under 2 million cubic meters for the year. For 2006, the number of fields had increased to 171 with even more in 2007, but the peak(s) are long since past.
While the Forties field continues to produce at a rather prodigious rate compared to the other fields online in 2006(beat only by the Elgin and the Schiehallion fields) , it really is looking like Brent is going away for good over the next couple of years. Each of the fields shows a relatively quick peak and then decline. The current "buzz" is Buzzard, but given the history in this region, it's output will be short-lived.
A similar review of Norway's production is also possible (though I have the information, I just haven't had the time to turn the crank on the data yet).
I think I would have the same reaction (bizarre) as you did.
If you look closely at Norway's production you can see also two peaks:
Hi Khebab,
Powerful graph!
Thanks,
Dave
Cool graph.
This seems to show that the swarm effect I've proposed for smaller fields is real esp the offshore developments.
Basically since the 1980's-1990's a lot of the production has been from small generally offshore wells that are produced quickly and shutin when at best secondary recovery is finished. These well will never be produced to the extremes seen in Texas. In this graph you get a beautiful example in my opinion of the swarm effect acting in aggregate as a giant field. And its clear from your graph that the swarm of small offshore fields developed of the last few decades may in aggregate be in decline.
So not only do we have the big fields in decline which will ensure that we are probably past peak. But also I believe we are facing fairly serious declines in this swarm of small offshore fields which make up a significant amount of production today.
The key point is that these fields decline quickly but new discoveries and the support of the giant fields has allowed us to grow. With both of these exhausted the aggregate decline rate of the small offshore fields should be very steep and play a large role in the overall global decline rate as we past peak.
We'll call it "Twin Peaks." Oh, somebody already used that.
Thanks. Iw was retty sure it would look something like the UK curves.
I also see two peaks in the UK North Sea discovery curves. One strong one and a later broader blip. This plus the disturbance the 1988 Piper Alpha platform fire can cause a purely extraction limited valley between the production peaks.
Khebab,
are there other countries/areas that follow this pattern when split (eg US, russia, the whole world) - large fields peak first, sum of small fields peak second?
Andrew
Perhaps, in some cases, this is what the "dog-leg up" pattern is really showing...the addition of smaller wells all at once.
The infamous dogleg :)
Its and obvious example of a technical change influencing production rate and thus HL results. A more insidious problem is that this swarm of small fields has generally been developed later with more advanced extraction methods so we don't see the "dogleg" from them. In general this means that HL is probably systematically high in its URR estimates for the smaller fields. In effect URR for large fields and URR for many small fields esp ones developed using advanced technology are not equal. The small fields have a bias and URR is over reported and post peak decline rates are probably under reported.
The dogleg highlights a problem with HL thats actually systematic through the data set if its not corrected for small field/technical bias.
Now of course the big question is how big is this correction. My opinion is its fairly large and we are of by a substantial amount especially for global production since swarms of small fields generally offshore produced using advanced methods make up a large portion of current production.
Taken in aggregate we can consider these swarms as another super giant field or sets of super giants divided by region.
Not only are the real giant fields declining but these swarms are also in steep decline and probably decline faster than a real giant field.
probably but unfortunately Norway and the UK are the only countries in the world that are providing complete datasets per field.
I'm sure I'm missing something here.
If you split Norway into three Top/Middle/Small groups with URR/group around 8.2 each, wouldn't you see three peaks?
--
Jaymax (cornucomer-doomopian)
Yes you're right, you can actually split the datasets in as many peaks as you want. The main point here is that 10% of the fields are responsible for 50% of the total production (what Simmons calls the oil pyramid) and that these fields are usually exploited first.
That's incorrect, Khebab. It's actually far worse than that. Robelius has stated that over 60% of all produced oil comes from 1% of the fields. People simply do not grasp the impact of large fields on total production and consequently they cannot grasp the impact of those large fields going into decline. To them it is all "oil" sitting in a "field" somewhere. But most people just do not get that the average oil field is a few tens of millions of barrels total - less than one day's global consumption while the massive fields are so large that they have pumped oil for decades.
"The greatest shortcoming of the human race is our inability to understand the exponential function." -- Dr. Albert Bartlett
Into the Grey Zone
My 10% for 50% is for the particular case of Norway, it's far worst at the world level as you said.
Regardless of one's political philosophy--Ayn Rand capitalist or Marxist Communist--we tend to find the big fields first.
And what about us Shumacher Marxists? We find little piles of pooh first. :)
I've never found an Ayn Randian who took either Global Warming or Peak Oil seriously. In fact, on the internet, they are the most vociferous opponents of both theories, and they dredge up the most spurious and discredited scientific information to support it.
For a Randian, Global Warming is nothing other than a left wing plot to take stuff away from them. Peak Oil is a violation of the doctrine of optimistic cornucopia.
As for Marxists, well, arguably the best country positioned for Peak Oil is the country that already had its 1990s 'power down' -- Cuba.
..and is also looking to discredit the "bigger first" thing by hitting an enormous pay dirt off their shores...
A fortuitous collection of information yet again from TOD. Mitigations mentioned included;
(A) Mitigate the impact of peak oil (e.g. rail development)
And of course we can add bicycling, walking, improving mixed used development "in the large", substantive home gardens, and the whole collection of relocalization mitigations, as a start.
(B) De-carbonize our economies (e.g. renewable energy systems)
I thoroughly agree, though this is easier said than done. A full look at the management of variable energy sources would be a great TOD showcase piece.
All information is nicely discussed and summarized. A difficult thing to do with so much data...excellent job one and all.
Thanks! I am not certain how much Matt will be able to respond during the daytime. Being in Australia, he is in quite a different time zone.
Ask him if it's rained more than 10 mm where he is.
And if he's near a wheat field, please.
Also, I've been doing research on the Fayetteville Shale
Gas Play.
A guy here- at NARO-National Royalty Owners Association Forum Index -> Arkansas
http://www.naro-us.org/forum/viewtopic.php?t=1240
The guy's a great read. Here's a sample:
The play is real. The money is real. But the margin of future profit is over-stated and the risks are understated. The author suggests the players need to concentrate their efforts on the best places and the process of leasing huge chunks of land that has to be drilled willy-nilly or lost because they cannot get to it before the lease expires was a poor policy and wasted a lot of money. At least the landowners benefit from that.
For the record, I believe this is a national problem as companies reject comventional plays and flock to shale plays whether the South, the East, the Rockies, or Texas. Shale gas is as sexy to investors as subprime mortgage instruments were in 2005...and just as dangerous. The end result will probably mean that new reserves added to the national coffers will rise slower than the cost to drill them and do little to help us become more self-sufficient in energy. If investors smell a rat, whether real or not, then the funds to drill these shale plays will dry up faster than Countrywide's bank account.
For your enjoyment.
BTW-great posting Gail.
Sincerely,
James
Arkansaw of Samuel L Clemens
mcgowanmc,
you're about a year too late on the money drying up on the Silurian/Devonian shale plays. While there are some areas that may be economic, it appears that about 5 out of 6 wells are going to have a hard time reaching payout on the wells that are being drillled.
In order for the plays to be economic, the wells had to have rising gas prices. The LNG import boom has put a ceiling on gas prices, because the overseas producers have a zero production cost on associated gas, and the floor is the price required to reinject the gas in overseas reservoirs, and its going to be this way for the foreseeable future
Of course, all bets are off if the US has an oil embargo or the ELM kicks in at a much higher rate than WT and Khebab are projecting. Considering the explosive situation with domestic Mexican politics and the sabre-rattling by Cheney about Iran, I suspect the ELM is much too low anyway. Those events would make Boone Picken's LNG for automobiles the only substitution that can effectively replace much gasoline quickly.
"...you're about a year too late on the money drying up on the Silurian/Devonian shale plays."
The S/D shale must be beneath (?) the Fayetteville (FS)
or is part of the same?
For reference I just heard about the Reelfoot Rift.
And generally surmised that the Ouachita Upthrust
created the gas. But that The FS dives/is covered
by the Reelfoot Rift.
Correct me anywhere in the above, thank you.
I've been following this intently since October 05.
Thru leasing of mineral rights.
I figured the Reelfoot Rift East FS Gas Play, along with Maverick Oil,
fell apart as Gas dropped below $10 and stayed around
$6/7.
And I just found out the route of the Boardwalk/Texas Gas
Fayetteville/Greenville Lateral.
But you are right that the Western part of the FS
around Conway, Van Buren Co is the most profitable so far,
IMHO.
Do me a favor and go here to read some comments.
http://www.naro-us.org/discus/messages/2382/2382.html
Tell me if you agree or dis, Thank You,
James
Arkansaw of Samuel L Clemens
Silurian and Devonian are geogological ages in the paleozoic when the Woodford, Barnett, Fayetteville and Appalacian shales were formed. The names like Woodford or Barnett are local names for the formations in vaious areas. We're talking about the same stuff, I just used names that are more general.
There is huge amounts of stranded natural gas overseas, and unless the US puts an import tax on gas its going to keep US prices too low for the tight shale gas wells to be profitable. I glance at those comments and they're right, the figures are from an article in World Oil a few months ago.
Bob Ebersole
Thank you for all.
And we have made a nice living since Oct 05.
I could write a novella on what's happened in E Arkansas
since Feb 05.
And we still have our mineral rights.
Which will have to be re negotiated next year.
;}
Arkansaw of Samuel L Clemens
I don't see ROW NG putting much of a floor under USA NG prices because of LNG. The problem is shipping capacity. The stock may be big, but the flow is severely limited. Prices have been held down this year by a small increase in domestic production, from a huge increse in drilling, and there is almost zero incremental drilling capacity available. Drilling growth has offset declines, but can't continue to do so, and LNG shipping capacity can't offset more than about 0.5 TCF of further domestic and/or Canadian decline. Murray
I love arthur berman's 2.3 MMCFPM (76 MCFPd) economic limit.
These wells produce no water.... dry gas wells.
Would you plug something that netted over $10,000/ month?? and this is where the decline should go shallow.
FF
Dry gas wells refers to the fact that the gas is not associated with oil or condensate production, not to the amount of water in the product stream. Bob Ebersole
mcgowanmc
Matt lives in Sydney and it rained a bit on the weekend, however it will also rain later in the week. Like Matt I also live in Sydney and its a long way from the wheat fields. Probably a good 300-400 miles.
The wheat areas are very dry and the harvest will be disappointing.
Here is a map of the wheat growing areas of Australia
http://www.awb.com.au/customers/australianwheat/
There maybe some rain in wheat growing areas later in the week but what comes for the farmers remains to be seen.
And about the Perth median railway.
Look at your interstate. Imagine one side being converted to rail. On the concrete itself. I think that's where we're going.
Arkansaw of Samuel L Clemens
Why 'convert'?
Simply run mass transport carriages on tarmac. We'd need a short and memorable name that emphasised the business commuter applicability. Maybe something like "Bis", but we could play with the vowels somewhat to provide for a trademark...
Is there information about which is easier - a build over one lane of the interstate allowing some use of the lane for vehicle as well as rail traffic like they do in San Jose, or is it cheaper to use ties and build in the median?
I'd have to guess that in the US the road beds are probably not capable of being used for trains. So the reality is we probably will have to completely redo for rail.
Now since a lot of the roads are now four lane or more and we have divided highways you probably can easily convert to a two lane road and double track using the existing right of ways.
The asphalt ripped up on half of the roads can be used for a long time to maintain the remaining two lanes and the concrete crushed to make part of the rail bed. Maybe the rebar can be used in rails ?
Now Bridges may be a real issue not sure they are high enough for trains in general but I guess you can cut down the rail bed if needed.
I have read about both road and rail bed construction and I'm pretty certain you have to rebuild.
Pretty interesting maybe a engineer can asses how much reuse we could get.
If your scenario is implemented, then the ripped out lanes could become the perfect location for a large scale installation of PV panels and/or wind generators.
I was thinking the median and the right of ways but yes
you could run quite a bit of pv/wind along our current road beds.
I suspect it it would more than power the trains.
The real issue is load balancing but flywheels would probably work well in this situation also new capacitor technology would fit. And of course hydro pumped storage would also work.
Note that the combination of wind/solar and flywheel/hydro capacitance storage would provide both effective free high speed rail and base load electricity.
Some one can do the math but the trains should only use a fraction of the electricity collected along the rail lines.
Next of course collector fields/ wind farms can be located in strategic places along the lines but out of site of communities.
If you consider just the major interstate routes alone for this sort of treatment is probably enough power for the US today.
And also think about similar stuff along rivers and canals with microwave for power transfer and electric ships.
Lovely. And steam could fit in here somewhere?
Arkansaw of Samuel L Clemens
What IS it with rail?
My original sarcastic comment was pointing up that if you want to use a road surface for mass transport its insane to start planning how you are going to rip up the surface or start planting windfarms in the meridian.
The easiest, quickest and most appropriate is to populate it with buses. You can do that today, at minimal cost. These have the massive advantage that they are perfectly viable for alternative energy techniques - indeed there are already flywheel storage, gas, hydrogen, overhead power etc. versions.
There is nothing rail can do that buses cannot, provided you use a little imagination.
Why on earth the fixation on rail?
garyp
Rail hauls more people, and buses have a huge amount more labor involved. The vehicles cost a lot more per passnger mile, and the roadbed mantenence on highways is a lot more expensive. High speed rail runs up to 200MPH on high speed lines Bob Ebersole
I guess I look at this from the UK perspective, but:
a) Carriage for carriage, I doubt a train and a bus have much in it. After all the space taken up by fitting x bodies into a space is pretty much the same.
b) Splitting up into separate carriages provides the opportunity to tailor the size of carriage to the demand much more accurately, thereby reducing the hauling around of dead weight. In addition if you take a typical 4 carriage train and split it into 4 buses, you can have 15mins between buses rather than 1 hour between trains - making it much more acceptable for most people through reducing waiting times.
c) Although buses tend to have a driver per carriage, as opposed to driver and ticker checker per 4 carriage train, the maintenance requirements are much less. In addition we should be looking towards total automation and no drivers - its perfectly possible if you can segment and control the routes.
d) I'm not sure roadbed maintenance is more than rail, do you have figures? Don't forget the effort required to get low incline trackbeds in the firstplace - and the signals and points which really eat up rail maintenance costs.
e) About the only place where rail can win is in highspeed connections - which aren't exactly energy efficient anyway! However you could never use roadways for such rail uses, it would be a total rebuild to get the type of trackbed needed for high speed uses (BTW I agree with the need for high speed rail).
The major point however is the difference in investment. Getting a working and workable bus service up and running over existing infrastructure would be many time more affordable than reengineering for rail. In addition the time for such effort is many years less and the risk is much lower.
Nothing so far has changed my mind that a remodelled bus service approach is a more practical solution for the issues we face. Such a bus service could connect suburbs with city centres and make the 'burbs viable even without cars. What's more it could be implemented within a year or two, using what we've already got.
You still come at this from more "public acceptance
of less convenience".
When I'm saying it's "this or nothing".
We've past the Tipping Point.
We cannot afford to "remodel busses" unless you're
talking trains with rubber wheels.
And electricity will have to be produced locally
and have some rudiments in place already.
One engine for the entire "bus train".
And again. My family talks of getting frsh baked bread
delivered by 7:30 AM from 70 miles away in LR
by train.
Rail is not a hardship to be endured.
Arkansaw of Samuel L Clemens
But he's on to something (which I have been thinking about for about 15 years now):
Rail (as well as air travel, btw) is the most inflexible transportation model around.
Cars are the most (ok, 4-wheelers/offroaders) flexible.
Electric busses can run on guidewires (? overhead wires).
With additional batteries, the guidewires don't even have to be contiguous (w/out breaks in the electric).
Once the bus system works, other corporate/private vehicles can be added...
Cheers, Dom
The reality is that to build a rail network takes decades and hundreds of millions US. Either a trolley LRV or a high speed rail the cost is enormous. To shift all of the cities to rail that do not have them would entail a massive construction project that would surpass the Manhattan project. The MBTA in Boston has spent decades adding 18 miles of the green bush line and another twenty five to add ten miles on the green line.
To add a high number of rail networks in a world with quickly diminishing resources, especially if rights of way through suburban sprawl have to be acquired and a large number of carriages would have to be built which means we would have to add capacity far beyond what currently exists this is unrealistic,
Florida had a high speed rail amendment in its constitution that would have gone from miami to orlando and Gov Bush first ignored it and then pushed to have it repealed because argued that the cost would bankrupt the state.
Buses can be built to run on LNG much quicker and they have flexibility if you put a rail line in the wrong place then you are screwed, with a bus you change the route. And we can use the current road network,
And a Bus can be built a lot quicker than a rail line,
This is not to say that Amtrack should not be supported but to just keep it status quo by repairing the rail bed and rolling stock is going to cost millions. And for the above reasons a build out of AMTRACK much beyond what it already has is also unrealistic.
Hat tip to Robert A. Heinlein, who in 1940 wrote "The Roads Must Roll", in which a vast network of moving roads was built to replace the interstates, and powered by 90% efficient PV systems placed along the sides of the road.
http://en.wikipedia.org/wiki/The_Roads_Must_Roll
Some issues to consider:
Geometry incompatibilities between road & rail.
- Vertical clearances
- Horizontal clearances
- Horizontal and vertical curves.
- Ramp geometry & operations
'Capacity' Issues
- Highway bridges designed for much lighter loads than rail bridges.
- Pavement/subgrade support for rail.
No source, but I seem to recall that asphalt is already the #1 recycled product by weight in the US today(?) There is a well accepted technique to 'rubbelize' concrete pavement in place at the end of it's life.
How well can rail handle 7% grades which are common on Interstates?
If it's conventional rail, not well. If it's monorail, either suspended (cheapest) or straddle monorail, grades up to 15% are possible (but 10% is a more realistic upper limit).
see http://www.monorails.org/tMspages/TPindex.html
A "non-starter", grade becomes a concern beyond about 1.5%, a big one at 2%+ i.e. train lengths get limited quite a bit. Nothing in standard railroad could be built at 7% I'm pretty certain
Also for double stacked containers I think you need about 22' to get under the bridges
Then there is the question of minimum curve radius, trains need more room than cars and trucks, its not a plug and play conversion by any means...
I'd suggest a more interesting analysis would be to determine cross correlations in production changes (due to common worldwide factors) and remove them from the data to provide an estimate of true capacity factors. Then remove known events such as Katrina, Nigeria insurrection, Iraq, etc. and total to provide underlying capacity capability.
Fields peaking should be totally uncorrelated so any correlated signals are noise on what we are really trying to see.
Thanks for coming up with the data to document that I'd already concluded from the landman's primary skill, hunches!
Why is there such a serious discrepany with ASPO-Ireland, who are predicting the peak on about 5 years at 90 million barrels? Are they just being conservative in order to not raise much of an alarm, or is their some big development that I'm not aware of?
Bob Ebersole
I think that they are overestimating how quickly the new (smaller) fields come on line, and they are underestimating the decline from the old (larger) fields.
My impression is that ASPO organizations tend to be very afraid of saying the peak is too soon, and being proven wrong. They also think the a global recession could postpone peak for a few years, so don't want to put it too early for that reason.
There may also be some issue with the methods used. There may be an upward bias if published reserves are given some consideration in developing the reserve numbers used in the calculation--that is, published reserves are not rolled back far enough.
The numbers you have show that if even if we add back all of the gulf oil we hit peak. Of course we will never add all of that back in as a number of wells that were past prime were capped as it would be cost prohibitive to bring them back on line even at $80 US. While these smaller wells may in the singular have been low producers I wonder what their combined production amounts would be. Although this is a small adjustment it would push ever more slightly forward the PO date.
Understand that this is a general problem with offshore production even though the URR predicted from HL analysis points to a greater recovery for economic reasons a lot of oil is left in the ground offshore and not recovered.
I believe that about half of the worlds production is now offshore and most easy offshore regions have been exploited.
So its a pretty safe bet to assume that HL is a overestimate of the decline rate and URR post global peak.
The reason is fairly simple up till recently the growth in offshore offset the rapid depletion of the fields so HL has been tracking production from offshore with new offshore fields continuously coming online. This is part of the projections for the future. As the ability to bring on new fields ceases this will quickly pull the HL down from the current projections. HL cannot predict this fundamental change i.e no new offshore fields and thus is a overestimate.
The shock model probably gets this better and can be used to show that HL is probably high because of the offshore effect.
So I'm pretty skeptical of the projected decline rates post global peak. I expect them to continue to accelerate as a host of factors which in a sense artificially inflated the URR determined via HL cease. Its troublesome that what has been our best tool to date looks like its producing overestimates for global decline.
And of course we have ExportLand.
Given this and the results presented here the chances of a slow squeeze or soft landing with a gentle decline off the global peak are pretty slim instead we can expect a number of effectively shocks to occur over the coming years which will cause the production decline rate to accelerate.
So it is essentially that Hubbert worked in a world that had a much higher percentage of onshore fields than we do now, The oil in the ground does not equate to URR there is a slippage.
The slippage that MKH worked with was land based and now we are in the realm of offshore slippage and also different techniques and higher costs come into play in keeping wells and fields going, injection etc.
A true projection would entail figuring what an offshore well URR is as opposed to land based wells, then taking and adjusting future world URR based on the percentage of those wells in operation or coming on line, and doing the same for deep water as well as compared to onshore wells and then combining those figures to establish an accurate true URR.
What ever the true numbers they have to be lower than those that do not adjust for various depletion rates based on types of fields,
This would indicate that if as I suspect we are past peak and the question of what the actual PO date was is academic, but of course the further back in time the longer we have been lied to. The real question is what is and will be available for the near and mid term future.
Because combined with ELM and increased imports from our competitors on the market, china etc, and also combined with exporters turning into importers Indonesia, UK etc the time to act is coming on quicker than many suspect, and as the amount of oil being produced is coming more and more from fields that give up less and less and deplete faster and faster i.e. Canterell.
The questions now are how long before we leave the plateau of production how fast will the depletion rate be and what if anything can we do about it. And of the remaining oil how much energy are we in the US going to get and how much are we willing to divert to developing viable forms of alternative energy, transportation etc. Remembering that rails take time, money and equipment I.E. in metro Boston just to put in rails for a train of 18 miles on the existing Greenbush line right of way to over twenty years of planning and construction and cost 512 million and that does not buy the fuel to run the trains and biofuels like corn fuel have a negative energy output and have the added burden of driving up food prices for those who can least afford it.
All of this in a climate where the politicians have for the most part the knowledge of courage to wake people up, thc clock is ticking and nothing is being done.
When will someone in so called authority wake up the populace to this sword of Damocles hanging over the worlds head?
The bottom line is that just like the Artic melting we can reasonably expect the situation to get worse faster than anticipated. And the ExportLand model is already fairly dire.
I think its a safe bet to expect accelerating decline rates especially in oil exports and worse for the US gasoline and diesel finished products available for export.
This means we probably will see absolute volume declines that are constant or growing at least in available exports.
WT pointed this out earlier I'm just saying that a lot of other things besides ExportLand support accelerating decline rates as we pass global peak. ExportLand may or may not be the biggest factor it is at the moment but other factors will grow in influence overtime swamping the ExportLand effect. And sudden shocks are practically certain in this strained environment.
And ...
We do nothing.
memmel:
Upstream in this thread, you have made several references to "ELP". Please forgive my ignorance. What is that?
ELP Plan (April, 2007)
http://graphoilogy.blogspot.com/2007/04/elp-plan-economize-localize-prod...
Hi Bob, ASPO-Ireland show a 2005 peak of regular oil at around 67 Mbpd. They just revised the big picture though ( 30 Sep '07 PDF ) and the all liquids peak is now down to 87 Mbpd from 90 Mbpd and now occurs a year earlier, ie 2010.
Thank you for this post. I was looking for how to keep the climate change conversation relevant in an environment of falling carbon emissions. I predict that soon peak oil will replace climate change as the emerging, soon-to-be-dominant conversation — and climate change will have to work even harder to stay in the picture.
You just gave me the best way to look at it: study the CO2 equivalent and approach it from that perspective.
On another note, I would be grateful for the readers of TOD to assess and comment on the Peak Oil and Climate Change Q&A I put together primarily to educate my colleagues. If you are interested, please see http://www.inspiringgreenleadership.com/blog/aangel/peak-oil-and-climate...
Andre' Angelantoni
www.InspiringGreenLeadership.com
Anything but.
James Hansen has looked at this and written a recent paper on this. We can probably deal with the optimistic estimates of how much gas and oil there is out there.
However there is far more than enough coal (not to mention Alberta Tar Sands, Venezuelan Oil Sands, and potentially Colorado Oil Shale) out there to drown us in CO2, and potentially completely destabilise the climate.
No it's global warming first and foremost.
The Tim Flannery quote is very recent. Matt just e-mailed me it to me this morning, and asked me to add it to the post. I also posted it on the Dumbeat. Apparently the fourth IPCC report is coming out with just terrible numbers, when it is released in November. This is a longer section of the interview:
What a totally depressing report.
I expect to begin hearing a lot more about geo-engineering, such as firing aerosols into near orbit, pouring iron on the still cold bits of ocean, humongous mirrors, etc. Wonder if anyone at TOD would like to study this subject?
On the positive, near-term side of things...got my corn and dry beans out ahead of the rain!
We have, and it's mostly a non-starter.
http://www.realclimate.org/index.php/archives/2006/06/geo-engineering-in...
http://www.aip.org/history/climate/RainMake.htm
We don't know what to do, nor do we know how to do it. And we don't know what the side effects would be.
Taking a damaged climate system and trying to add something to stop the heating, is not the same thing as not doing the damage in the first place.
Besides, I would hardly call all this "geoengineering" but rather "geo-fixing". Call it a stage before engineering.
Real engineering would blow away Panama to (partially) revert the Gulf Stream so that the global climate improves to that what it was 3 million years ago, meaning before N. and S. America joined. Back then, the temperature was a good bit higher..
Wait - that's engineering in the other direction than everybody here wants it...
-------
Just remember the Golden Years, all you at the top!
We know so little about the deep ocean currents (we are not even sure what the historic flow rate of the North Atlantic Conveyor is) that mucking around down there, or with them, is as likely to cause catastrophe as to do any good.
Thank you Gail for your interesting post, which consequent analysis you have made strenghten an insight I had in 2005 when making this short movie (Black October) : http://www.youtube.com/watch?v=G7xtQftN2mI
;-)
It looks like a teaser for your article!
I don't think we should use that as part of our "Peak Oil Outreach". Interesting video - but gloomy.
Interesting analysis.
It certainly highlights how close we really are to finding out how the energy unwinding will play out.
1. We already know that the EROEI ratio has been deteriorating at the rate of about 3.5% per annum since the 1930's. No matter when gross production peaks, we will continuously have less and less of that production to use because of this increasing cost factor.
2. It has been demonstrated in other articles on this site that it takes about 9 years for an exporting country to end exports once they reach their own peak. This is ominous for the USA which imports 60% of what it uses. Essentially most of the post peak fall off in production will likely directly reduce what the USA imports.
3. This article demonstrates that 4% is not an unreasonable rate of decline for post peak gross production.
If you make the assumption that after 2011 US domestic production falls at 4% per annum, that USA imports fall over the 9 years after 2011 to zero, and the deterioration in EROEI will continue at the historic rate of 3.5%, what is the result to the USA? The simple mathematical calculation for these three factors is that 2020 consumption can only be about 25% of what it will be in 2011. This is astounding for just 13 years away. These three are the new horsemen of the apocalypse.
Doesn't allow for hoarding by producers!
Xeroid.
The three key factors that determine how fast exports from an exporting country decline/crash once production starts declining are: consumption as a percentage of production at peak production; the production decline rate and the rate of change in domestic consumption.
The ELM, UK, and Indonesia all consumed 50% to 60% of production at their most recent peaks, so the decline/crash was quite rapid in all three cases.
The top five consumed about 23% of production in 2005.
However, the low, middle and high cases for the top five hitting zero exports are still scary as hell.
BTW, the UK, at peak production in 1999, had already exported 80% of its total cumulative net export capacity (presumably all that would ever be exported).
The future does look bleak, but it might not get quite as bleak quite as quickly as you suggest.
First, while I respect WT's ELM theory and believe that he is on to something, it is a mistake to think that every single exporting country is just going to automatically and passively let their exports decline to zero with no policy interventions to attempt to slow the export decline. Too many of these exporters are too dependent upon their export revenues to allow them to go away, especially so quickly. They do have policy options to restrain domestic demand, and some of them can be counted upon to make some attempt to do so. From a very long term analysis, of course, the ultimate result will be futile. But it might very well make the difference of stretching out export availability for a few more years.
Second, the governments of importing countries have policy options too. I think it is pretty naive to think that nothing will be done to restrain demand. The US government is spectacularly inept, and can be counted upon to do lots of wrong things, and to do the right things too little and too late. I doubt that they will just be totally passive, though. For example, at some point, gasoline rationing could be introduced. It will be tardy, it will be inadequate, and it will be a mess; however, when things get bad enough, then eventually it will happen. Once again, from a long term perspective, these policy interventions will make very little difference, but they might stretch out the rate of decline a bit.
Thirdly, while I don't believe in the possibility of massive new discoveries in a quantity that will turn the tide, it is possible that a massive increase in investment might succeed in bringing online a little more oil than what our projections and analyses currently anticipate. Once the reality of peak oil has sunk in and is indisputable, we can count upon politicians, business leaders, and the MSM to all fly into panic mode. They will HAVE TO DO SOMETHING!! I think we can pretty much take it for granted that there will be crash exploration & development programs going on left and right after about 2012. Again, from a long term perspective these will not make much difference, but they could help drag out out the decline so it is a little less severe for a while.
We will certainly end up at somewhere around that 25% level per your calculations -- but we just might be able to drag out getting there for a few years later than 2020.
Some other positives about Peak Oil...we will be forced to know ourselves a little better. We will be forced to work together on something, either large-scale projects for the good of the country or smaller groups (state, city, communal working group). Hopefully, working together won't mean prison camps, debtors camps, etc., but will be from necessity.
Yes, there will probably be many negatives as well, but I can still view some of the above as a positive.
Maybe I should spell out what I mean by shock in general its either the collapse of a government/economy or war the other shock is a natural disaster.
Even with WT exportland model the rate at which oil becomes tight is fast. Under the pressure of citizens for governments to DO SOMETHING !!!! The general choice will be war.
Convince me we won't see widespread war esp in the middle east and potentially on a global scale as governments scramble for the remaining resources.
This is why the sharper decline in exports predicted by ExportLand and the fact that plausible scenarios point to even steeper declines means only one thing
WAR
The problem is war means even faster depletion
from fighting in our "gas stations".
See John Robb and Schwerpunkt Systempunckt 4GW for details.
Arkansaw of Samuel L Clemens
And what happens when a nuclear power starts to go hungry and decides to blackmail Oil or food exporting countries, or even Nukes an exporter or two to make their point.
"And what happens when a nuclear power starts to go hungry and decides to blackmail Oil or food exporting countries, or even Nukes an exporter or two to make their point."
1-The Blackmail began with Iraq. It failed. But that hasn't stopped the Cheney Faction of TPTB from trying it on Iran.
2-You too can now play the game that the nuke powers have been playing since 49.
2a-Once a nuke is exploded over a nation, how do you
stop nuke explosions from spreading?
2b-Once the rubble stops bouncing how do you get the oil/food from the glowing nation to your nation.
2c-And how will the US Economy still be around when/if
those particular food/oil ships arrive?
Arkansaw of Samuel L Clemens
Indy
All to easy to forget that political concerns are preventing OPEC members shifting to Nuclear Power to conserve Fossil fuels for export.
All to easy to forget that policy decisions have crippled exports from key producers, and will continue to do so indefinitely.
WestTexas is an optimist.
INDY
Sometimes I feel like I am living in a madhouse. Here all you good folks are talking about a certain collapse of the oil supply, going to war, or to nuclear, because of the lack of oil, when a lot of the oil producing places are SUNSOAKED DESERTS. We have way more sunlight than we could ever use. And we know lots of ways to turn sunlight into electricity, and electricity into anything. And we know how to transport electricity long distances efficiently.
Hard to do? Expensive? Sure. Question. Is it harder, more expensive, than not doing?
Or is it true, that old saying, that we would rather die than think?
Yes, going to war (among other unsavory alternatives) is much much easier.
The problem is the rate at which exports decline. If its a gentle decline spanning decades governments can adapt. If its a fairly fast collapse with serious problems in less than 5 years then your dealing with a reactionary environment with a lot of explosive political pressure and finger pointing. Not to mention economies in effect collapsing.
If you don't think this is the perfect conditions for war then ...
Just look at Iraq and the Arctic land grab, Russia posturing, Chinese moves in Africa etc...
And still very little about peak oil in the media.
OK, so I do live in a madhouse. And it surely is real easy to go to war. Did it myself, long ago, without a thought in my head.
Given all that, what to do? All this is way beyond simple solutions of the engineering or science type. We are dealing with HUMANS.
So somebody has got to write a totally engrossing,absolutely addictive tale of heroism/machismo, all laced with boobs, butts and bombs, which even those comrades two sigma down the wrong side will gobble up and get soaked thru their bloodstream into their very soul.
And, having got the subliminal virus above embedded, everybody will be yelling - QUIT THE COAL, GO FOR SOLAR, NOW, NOW NOW. The cowards we call leaders will follow, and the biosphere will be saved.
And I can go back to thinking about bicycles.
With respect to exports, you can have problems at either end - the exporter or the importer. The exporter problems are fairly clear - higher internal consumption, possible civil unrest, possible hoarding. Given the issues OilManBob mentions below, hoarding may be less of an issue than a theoretical discussion would suggest.
On the importing side, you have the likely problem of monetary systems in collapse, because they were set up for growth, and cannot continue once the growth hits the wall, because of constrained oil supplies. We may altready be hitting that point. I talk some about this in my series of Economic Implication of Peak Oil articles. These are links to Part 1, Part 2, and Part 3.
Good job connecting dots Matt & Gail. I never thought of the hurricanes skewing the data; but
since 4/05 meeting at bush's crawford ranch w/
http://www.npr.org/templates/story/story.php?storyId
Bush, Saudi Prince Meet to Discuss Oil Prices
Listen to this story...
President George W. Bush and Saudi Arabia's Crown Prince Abdullah in Crawford, Texas.
U.S. President George W. Bush welcomes Saudi Arabia's Crown Prince Abdullah to his ranch in Crawford, Texas, April 25. Reuters © 2005
Morning Edition, April 25, 2005
i have always thought this was about strain in US SA relationship & strain in the the supply of oil
[possibly peak itself-though i doubt SA would confirm such].
condi was assigned to a committee in S.A. re oil- like they
needed her[ couldn't find link]. high oil prices was hurting bush in the polls, hence the meeting. The hand holding solidarity was to assure we were in this together. S. A. motive here. about to be blamed for economic pbs. worldwide as $55 oil was supposed to hurt such.
just reading between the lines.
I also sometimes think the credit mess is attributable to the lack of profit available with the high oil
prices.
The value of the U.S. dollar has declined about 37% in the last 5 or so years....take your oil price at $80 a barrel, and subtract 37%...what price do you have?
If we are truly post peak, SA and the other producers are still giving oil away....the price at the pump for gasoline in my area is $2.69 to $2.75. That's what the public sees, and that is a givaway price no matter how you look at it...if we are post peak it is INSANITY.
RC
"what price do you have?"
Iraq?
And to the preceding comment...
Iraq?
Yes, this is insanity.
Except that we are on the "bumpy plateau" right now. The downslope will be about 4% less production per year. imho.
But I'm still waiting for an answer from something I've asked before - cause obviously things aren't reacting as you would expect:
Please answer this:
Will we have hyperinflation or deflation once PO is causing 2-5% less production per year?
Well?
Will oil prices rise or fall in a recession?
I'll skip the rest of what I wrote last time..
Cheers, Dom
p.s. I live in Germany and gas prices have hardly been going down the last 5 years.
Deflation.
We're in hyper inflation now.
Because hyper inflation is simply hyper theft.
And labor will tire and veto the format.
Deflation or the Empire fractures. Or both.
And war is the answer of TPTB to Peak Oil.
Arkansaw of Samuel L Clemens
Thanks MC -
I just want Roger to respond with his predictions.
He refuses to be concrete about when peak is, "'cause we got burned thinking it was here in the 1970s."
My point is, that it doesn't matter when it is because we don't have a time line how the history of the world (politics, economics, technology) after peak. So - even if you were to know the "peak" time line, you wouldn't know exactly when and where to put your money anyway.
Or you bet on the wrong technology and get burned anyway.
My bet is that we will have economic GROWTH the first few years after peak WITH rising prices UNTIL production schrinks more than 2%p.a. This could last til 2015, for instance, and nobody will be able to figure out how the world is staying afloat.
THEN we won't be able to keep up with depletion rates, and according to government policy, we will either have hyperinflation OR deflation like in Japan now.
Cause and effect is not always linear.
Cheers, Dom
Gail,
Good post. Figure 12 seems to show some kind of peak no matter which way you look at it... and it can be argued (as Ken Deffeyes does) that we've been seeing a decline for the past 2 years.
I've heard a lot of "industry experts" claim that we're seeing a decline that's due to "geo-political" factors. While this may be true, it looks like (to me) that by the time these geo-politcal factors get ironed out, the rest of the non-geo-politically-affected oil producers will be so far along depleted that we'll probably not again see the peaks that we saw in Figure 12.
I don't know if I'm a realist, pessimist, or maybe I might even be in my own LA-LA Land, but I think that it looks as if I'm already in Post-Peak Land.
A better link for London Buses: http://www.tfl.gov.uk/tfl/gettingaround/maps/buses/
Browse and be amazed at the quantity of routes, most have a frequency of more than 1/10mins and everywhers is served by 24hr buses.
"Nobody needs to go anywhere else. We are all, if we only knew it, already there." (Aldous Huxley "Island" 1962, p38)
This post was meant to be earlier, I am writing to counter the obsession here on electric rail, which is only really carbon efficient used for heavy goods cargo or if compared with flights (even then its not particulary amazing if high speed and not fuelled by renewable electricity).
The real revolution comes if we adopt intercity coaches and make better use of local buses (see tfl link above).
Oxford is a great example with frequent 24/7 luxury coaches to London which cost far less than rail. www.oxfordtube.com
Oxford express also provide a competing service.
In the UK we have park and ride carparks at motorway interchanges, add a few parking spaces, coach stops and more frequent park and ride buses and you have a high frequency, fast intercity low carbon coach network with next to no investment which would massively increase the person capcity of motorways. Rail cannot achieve this except when competing with shorthaul flights on major routes.
"Nobody needs to go anywhere else. We are all, if we only knew it, already there." (Aldous Huxley "Island" 1962, p38)
Facts I forgot to include, London has the largest bus fleet of any city in the world and prices are just 90p a trip (You never pay more than a travelcard, 30p for 4th trip free thereafter in 1 day, something like that).
School kids and people on social security get free bus travel in London
Disabled people in London now get free dial a ride bus travel.
Pensioners get free off peak bus trave thoughout the UK.
Rail just can't compete with the speed at which we must adapt, Crossrail in London is going to cost £16bn and wont' be ready until 2016. Coach travel can be rolled out in a year for next to nothing on a national basis.
I think car pooling is a good option in a lot of places. We have lots of cars. If we can keep them full of 4 people most of the time, we will save a lot of gas, with virtually no investment.
The problem with carpooling today over in the past is that everyone is scattered all over and the same for jobs. Even in the 1970 most jobs where still located in the downtown areas. Also in general one of your neighbors probably worked for the same company as you if not nearby.
And worse we in general for married couples both work and they have day care.
Its almost amazing how our current lifestyle is practically impossible without personal private transport.
And next of course many people have home loans on houses that would be difficult or impossible to sell under peak oil conditions. Suburbia might not come to a end but your investment in a suburban home will certainly be lost at best. This makes it hard for people to move to create a way to carpool or use public transport.
So I think your right in that car pooling will buy us time but I think considering our current lifestyles we would still be facing major dislocations even if we can car pool.
So in short car pooling does not save us since its not directly viable given todays lifestyle. I think a lot of people will fact a choice of abandoning the house in the burbs and moving close to town and renting or spending a lot of their income on gasoline. Given this they won't be buying junk so its not clear a lot of them will have jobs.
So I can't see how Suburbia can survive but I agree since we could car pool etc people may swallow their pride to keep their homes and gasp car pool with strangers.
I am a town planner and we protect jobs in downtown areas
http://www.communities.gov.uk/publications/planningandbuilding/planningp...
and adopt sequential tests and require retail needs and impact assessments for new retail development to protect sustainable town centres and discourage disconnected car dependent small business and community unfriendly malls, admitedly we haven't done it all well on this front, but go to America or Australia and you drive to a mall to shop, go to the UK and you walk, cycle or take a bus into a traditional town or village centre to shop (sure, can drive too, but that's often not the best option).
http://www.communities.gov.uk/publications/planningandbuilding/planningp...
http://www.communities.gov.uk/publications/planningandbuilding/planningtown
America needs to say goodbye to neo-liberal free market principles in relation to property development and embrace Spatial Planning to overcome its car addiction and this requires a federal policy direction as seen in the UK. In london you don't actually need a car here as a result and can rely on public transport for most needs and car clubs work really well for other needs, where you pay £50/yr membership to cover insurance, etc. then you pay £5/hr to pick up a VW Golf (new) and that covers petrol and everything for the hour and you just drop it off in a designated on-street bay. You open the car with a swipe card and just leave it when finished, minimum rental period 1/hr and you can rent the car for a day for about £30.
http://www.tfl.gov.uk/tfl/roadusers/sustainable-travel/car-clubs.aspx
And in the UK new housing development can be refused if too reliant on the motor vehicle:
http://www.communities.gov.uk/publications/planningandbuilding/pps3housing
Safe car poo;ing could be set up fairly easily. Have people in the 'hood meet at the local mall or Walmart Parking lot, then arrange rides to the urban sources of employment. Perhaps have a few local cops to watch the cars on a drive through basis. Have them check on a computer for recent criminal history.
At companies out in suburban areas or downtown central business districts, organise rides to similar parking places as above. Perhaps have company bulletin boards for people seeking rides.
People will just have to realise that every once in a while they may have a real emergency and have to take a taxi from their work back to their car. And, this doesn't have to be forever, but just until Alan Drakes Electricfacation of Rail plan can be built.
Our biggest enemy in changes like this is our rigidity in how we look at life, and our biggest enemy is our lack of leadership in accepting the necessity for change and working out methods to deal with the changes. blanket statements such as people will never accept carpooling are wrong. They will gripe about it, they'll be angry because they are forced into it without warning or preparation, but if its a choice between working things out or walking away from their homes and possibly losing their place in the middle class forever, they'll choose what they see as their best option for maintaining their status. Bob Ebersole
Right on Bob. Carpooling, expanded bus service, more walking/cycling will all be used more extensively, and will result in substantial reductions in fuel consumption. PO will obviously produce fuel availability problems and much higher prices, which will translate to finally "accepting the necessity for change", so that these other transportation options become the norm rather than the exception. For example, I could carpool, but it is much more convenient to drive my own vehicle. At $10/gallon, I would change many of my convenience oriented choices to lower cost, lower fuel use options.
Also regarding earlier, comments of Bus vs Rail --- the two can complement and even overlap each other quite nicely. Bus service can be implemented quickly and efficiently, and in a severe PO environment is one of the few options for many suburban areas.
budr
It takes effort to make a carpool work. Not a lot but some work. In our case, two of us live relatively close and for others not in the immediate area there is a "park-and-ride" lot established by the town. Although that parking lot is really aimed at allowing people to park outside the town and take the free bus service into the town (yes, our bus service IS fare free), it is also the point to pick up the intra-city express bus. It's also conveniently located next to the Interstate highway for our other carpool members to drop off and meet at the park-and ride lot.
I do both (carpool and ride the bus) depending upon our respective schedules.
The greatest benefit to carpooling and bus riding is two-fold. First, it does significantly reduce our respective fuel consumption. Second, by dealing with scheduling, I am not as inclined to "stay around" working a great number extra hours in the office. We all have a little flexibility in schedule, but it means that I get to work and get home at very reasonable times.
I carpooled in the 1970's when we had four of us that lived in the same city (with a convenient meeting point). After a few years that carpool gradually dissolved when the travel schedule for two of us had us away from home much more than we were at the office, and one of our carpoll members got married and moved away.
Listening to Mike Malloy radio show now. Michael Klare on after the break. Online at KPHX in Phoenix.
I have seen no evidence that large fields are necessarily found first. After time fewer and fewer fields are found irrespective of size.
What I want to know: Once it becomes widely accepted that we have passed the world oil production peak will some countries cut back on production because they can always sell for an even higher price by waiting?
Of course, a capped well is a great investment.
Harold Hotelling's work implies that once the expected price rise is higher than the discount rate, countries will cut back on production. Common sense suggests this also.
Yeah that was the very first thing my Russian Brother in law said to me 2 years ago regarding potential Russian behaviour(stop pumping) when I explained PO to him. It's a no brainer(and he just works on an assembly line).
“Without a video the people perish”-Is. 13:24
Whether people cut back on production will depend on a well by well basis and a field by field basis.
When oil prices were low, operators would often abandon a completion in a well still making a decent amount of oil to try a virgin sand up the hole. Completions will be produced longer before moving up the hole, and maybe some completions wil be squeezed off up the hole to try to reenter the old sand again.
Equipment in an oilfield doesn't just sit around unused and ready to restart. It rusts, siezes up from lack of maintainence, and deteriorates. Any time you shut in a well you risk not being able to restart it, plus the field workers will canabalise the equipment for replacement parts.
And on leases in the US, the operator is required to produce oil in commercial quantities or loose the leases.And I never met a politician who thought his successor would be better able to use revenue than he can, so I doubt much gets shut in by national companies overseas, its just not human nature to leave stuff for the future. I'm sure that everyone remebers that for years the Saudis have said they were going to develop their heavy oil resources in the future. In spite of their drilling flurry the last couple of years the production hasn't materialised, a pretty good indication they can't raise the production much.
So while some projects may be postponed, I doubt many leases will have much oil shut in waiting for higher prices. Its one thing to therorize and another to produce oil.Bob Ebersole
Regarding the role of buses and trains, they are complementary. In the US and Australia, where the last 50 years of sprawling development have created dormitory suburbs with few facilities, new local 'nodes' and regional centres need to be created. The flexibility of buses can work against that - the certainty of rail or light rail stations is needed to stimulate investment in new infrastructure. Still, buses are vital to support the rail system, and can be ramped up so much quicker than rail.
I find it kind of interesting that peak oil and climate change will correct our unsustainable path... given that we have no natural predators... just a shame that millions will die because world leaders have their heads in the sand (looking for oil!)
Unless we change direction, we are likely to end up where we are going (Chinese proverb)