| Did Katrina Hide the Real Peak in World Oil Production? and Other Oil Supply Insights | The Oil Drum | The Finance Round-Up: October 9th 2007 |
Getting a Grasp on Oil Production Volumes
Posted by Sam Foucher on October 9, 2007 - 10:30am
Oil production numbers are often measured in millions of barrels (1 mb= 106 barrels) or billions of barrels (1 Gb= 109 barrels). In the January issue of the IEEE Spectrum magazine, I found this little article: Joules, BTUs, Quads—Let's Call the Whole Thing Off. They proposed to measure energy quantities in terms of Cubic Miles of Oil (CMO):
1 CMO= 4.17 cubic kilometers= 26.22 Gb (assuming 1 US barrel= 42 gallons)
Last year, the world produced around 26.86 Gb of crude oil + condensate or 1.02 CMO. The figure below gives you an idea of the scale of a CMO compared to the Eiffel tower:
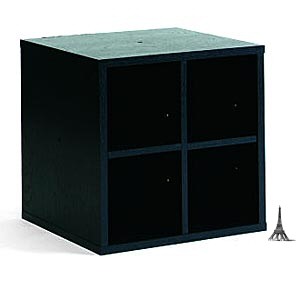
1 Cubic Miles of Oil (CMO) or 26.22 Gb or 71.82 mbpd
The cumulative production for crude oil through 2006 is about 1,000 Gb= 38.13 CMO or enough to fill up one third of Lake Erie (~115 CMO).
The authors (Hewitt Crane and Ed Ed Kinderman from SRI International) proceed to translate the figures of energy from various sources into one CMO unit: "To obtain in one year the amount of energy contained in one cubic mile of oil, each year for 50 years we would need to have produced the numbers of dams, nuclear power plants, coal plants, windmills, or solar panels" shown on this amazing representation:
Assumptions: The Three Gorges Dam is rated at its full design capacity of 18 gigawatts. A nuclear power plant is postulated to be the equivalent of a 1.1-GW unit at the Diablo Canyon plant in California. A coal plant is one rated at 500 megawatts. A wind turbine is one with a 100‑meter blade span, and rated at 1.65 MW. A solar panel is a 2.1‑kilowatt system made for home roofs. In comparing categories, bear in mind that the average amount of time that power is produced varies among them, so that total energy obtained is not a simple function of power rating.
src: Joules, BTUs, Quads—Let's Call the Whole Thing Off, IEEE Spectrum, January 2007
Illustration: bryan christie design
Also check this lecture given by Hewitt Crane:
Second set of considerations about the state of the world’s energy supply
This article initially ran on January 18, 2007.
Contact
- Content: editors at theoildrum dot com
- Tech support: support at theoildrum dot com
License

This work is licensed under a Creative Commons Attribution-Share Alike 3.0 United States License.
Lake Erie is always the best Great Lake to compare against because it is the shallowest. People don't have a great appreciation for how deep some of these lakes are.
Wow!!! This is incredible information to share with people who do not begin to understand the enormity of the peak oil situation. And, "each year for 50 years" --- well, how in the world could that be done?
http://digg.com/environment/Getting_a_Grasp_on_Oil_Production_Volumes_2
(reddit is broken...I will submit it later)
if you are so inclined...we appreciate your support and spreading our work around the web.
This is unsettling....
"To obtain in one year the amount of energy contained in one cubic mile of oil, each year for 50 years we would need to have produced the numbers of dams, nuclear power plants, coal plants, windmills, or solar panels"
Is that statement worded correctly? You seem to be mixing apples and oranges.
Comparing a coal fired plant to oil doesn't seem valid. Comparing oil to coal would seem to be a better comparison. I can halfway see the point for solar, wind or hydro, but coal and nuclear also need their cube of fuel.
There are some mistakes, see following discussion:
http://www.theoildrum.com/node/2320
oy. I was looking for something to post today and I remembered this one for some reason. Now it's all coming back to me...I can't remember it all, I guess.
I'd like to second this point - the statement (as quoted by bitteroldcoot, above) seems to compare 1) a rate of energy consumption (one CMO/year) and 2) a rate of INCREASE of energy production (building X number of solar panels/year). This doesn't make any sense to me. I had actually come across this study before but was so flummoxed by what they were trying to say that I couldn't take it seriously.
Cuchulainn