| The Energy and Environment Round-Up: October 14th 2007 | The Oil Drum: Canada | Canadian Gas - Decline Sets in. |
World Energy and Population: Trends to 2100
Posted by Stoneleigh on October 17, 2007 - 12:30pm in The Oil Drum: Canada
This is a guest post by GliderGuider. It is also available on the author's own website.
Throughout history, the expansion of human population has been supported by a steady growth in our use of high-quality exosomatic energy. The operation of our present industrial civilization is wholly dependent on access to a very large amount of energy of various types. If the availability of this energy were to decline significantly it could have serious repercussions for civilization and the human population it supports.
This paper constructs production models for the various energy sources we use and projects their likely supply evolution out to the year 2100. The full energy picture that emerges is then translated into a population model based on an estimate of changing average per-capita energy consumption over the century. Finally, the impact of ecological damage is added to the model to arrive at a final population estimate.
This model, known as the "World Energy and Population" model, or WEAP, suggests that the world's population will decline significantly over the course of the century.
Introduction
During the historically recent period of global industrialization, the level of human population has been closely related to the amount of energy we have used. Over the last forty years, the per capita energy consumption has averaged about 1.5 tonnes of oil equivalent (toe) per person per year. As industrialization has progressed, the amount of per capita energy used has also increased, rising from a global average of 1.2 toe per person in 1966 to 1.7 toe per person in 2006. As the global energy supply tripled over that time, the population has doubled.
Figure 1 shows the close relationship between global energy consumption,
world GDP and global population and implies that an overall increase in the energy supply has supported the increase in population. Can we assume that there would be negative consequences for the human population if our energy supplies should start to diminish? In this paper I shall present my estimate of the world energy situation over the next century, and tie that to a projection of the human population from now to 2100.
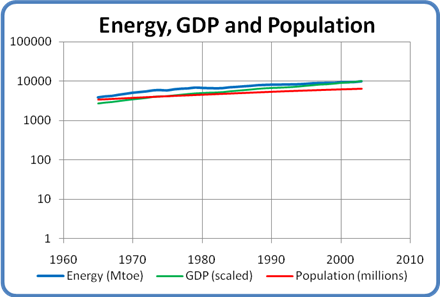
Figure 1: World Energy, GDP and Population, 1965 to 2003
Methodology
The analysis in this paper is supported by a model of trends in energy production. The model is based on historical data of actual energy production, connected to projections that are drawn from the thinking of various expert energy analysts as well as my own interpretation of future directions.
The current global energy mix consists of oil (36%), natural gas (24%), coal (28%), nuclear (6%), hydro (6%) and renewable energy such as wind and solar (about 1%). Historical production in each category (except for renewable energy) has been taken from the BP Statistical Review of World Energy 2007. In order to permit comparison between categories I use a standard measure called the tonne of oil equivalent (toe). Using this measure, well-known conversion factors permit the energy obtained from different sources to be easily compared. While this approach doesn't take into account the varying efficiencies of different sources like oil and hydroelectricity, it does provide a well accepted standard for general comparison.
We will first examine each of the energy categories separately, applying the development parameters that seem most appropriate to each. For each component I will define as clearly as possible the factors and parameters I have considered in building its scenario. This will allow you to decide for yourself whether my assumptions seem plausible. We will then combine them into a single global energy projection.
Once the energy picture has been established we will explore the effect the projected changes in energy supply may have on the world population. Once that baseline has been developed, we will incorporate the probable effects of ongoing ecological damage to arrive at a final projection of human numbers over the next century.
Notes
The WEAP model was developed as a simple Excel spreadsheet. The timing of significant energy-related events and rates of increase or decrease of supply were chosen through careful study of the available literature. In some cases different authors had diverging opinions on these matters. To resolve those situations I have relied on my own analysis and judgment.
As a result the model has remained open to the influence of my personal biases. I make no apology for this; such scenarios always reflect the opinions of their authors, and it is best to be clear about that from the start. Nevertheless, I have made deliberate efforts throughout to be objective in my choices, to base my projections on observed trends in the present and recent past, and to refrain from wishful thinking at all times.
The WEAP model presents a global aggregation of the effects of energy and ecological factors on world population. Although there is some discussion of regional or national differences (which would be expected to have a profound impact on the course of events in those places), the model does not directly incorporate such influences. While you may see this lack of granularity as a shortcoming, the paper is intended to give a higher level view. Its purpose is to establish a broad conceptual framework within which such regional disparities may be understood.
This paper will not present any prescriptive measures. The analysis is intended solely to clarify a "most likely" future scenario, based purely on the situation as it now exists and will probably unfold. You will not find any specific suggestions for what we ought to do, or any proposals based on the assumption that we can radically alter the behaviour of people or institutions over the short term. While the probability of such changes will increase if the global situation shifts dramatically, such considerations would introduce a level of uncertainty into the analysis that would make it conceptually intractable. The same constraint holds true for new technologies. You will not find any discussion of fusion or hydrogen power, for example.
Energy Component Models
Oil
The analysis of our oil supply starts from the recognition that it is finite, non-renewable, and subject to effects which will result in a declining production rate in the near future. This situation is popularly known as Peak Oil. The key concept of Peak Oil is that after we have extracted about half the total amount of oil in place the rate of extraction will reach a peak and then begin an irreversible decline.
This happens both for individual oil fields and for larger regions like countries, but for different reasons. In individual oil fields this phenomenon is caused by geological factors inherent to the structure of the oil reservoir. At the national or global level it is caused by logistical factors. When we start producing oil from a region, we usually find and develop the biggest, most accessible oil fields first. As they go into decline and we try to replace the lost production, the available new fields tend to be smaller with lower production rates that don't compensate for the decline of the large fields they are replacing.
Oil fields follow a size distribution consisting of a very few large fields and a great many smaller ones. This distribution is illustrated by the fact that 60% of the world's oil supply is extracted from only 1% of the world's active oil fields. As one of these very large fields plays out it can require the development of hundreds of small fields to replace its production.
The theory behind Peak Oil is widely available on the Internet, and some introductory references are given here, here and here.
Timing
There is much debate over when we should expect global oil production to peak and what the subsequent rate of decline might be. While the rate of decline is still hotly contested, the timing of the peak has become less controversial. Recently a number of very well informed people have declared that the peak has arrived. This brave band includes such people as billionaire investor T. Boone Pickens, energy investment banker Matthew Simmons (author of the book "Twilight in the Desert" that deconstructs the state of the Saudi Arabian oil reserves), retired geologist Ken Deffeyes (a colleague of Peak Oil legend M. King Hubbert) and Dr. Samsam Bakhtiari (a former senior scientist with the National Iranian Oil Company).
My position is in agreement with the luminaries mentioned above, that the peak is happening as I write this (in late 2007). I have confirmed this to my own satisfaction by examining the pattern of oil production and oil prices over the last three years. I discovered in the process that crude oil production peaked in May 2005 and has shown no growth since then despite a doubling in price and a dramatic surge in exploration activity.
Decline Rate
The post-peak decline rate is another question. The best guides we have are the performances of oil fields and countries that are known to be already in decline. Unfortunately, those decline rates vary all over the map. The United States, for instance, has been in decline since 1971 and has lost two thirds of its capacity since then, for a decline rate of about 3% per year. On the other hand, the North Sea basin is showing an annual decline around 10%, and the giant Cantarell field in Mexico is losing production at rates approaching 20%
per year.
In order to create a realistic decline model for the world's oil, I have chosen to follow the approach of Dr. Bakhtiari in his WOCAP model. He assumes a gradually increasing decline rate over time, starting off very gently and ramping up as the years go by. WOCAP has proven to be fairly accurate so far, and I have adopted a variant of it.
The main difference is that my model is a little less aggressive.
Where WOCAP predicts that production will fall from 4000 million tonnes of oil per year (Mtoe/yr) now to 2750 Mtoe/yr in 2020, my model doesn't reach that point until 2030. The WEAP model increases from a decline rate of 1% per year in 2015 to a constant rate of 5% per year after 2040. Even such a relatively conservative decline model gives astonishing results over the course of the century, as shown in Figure 2.
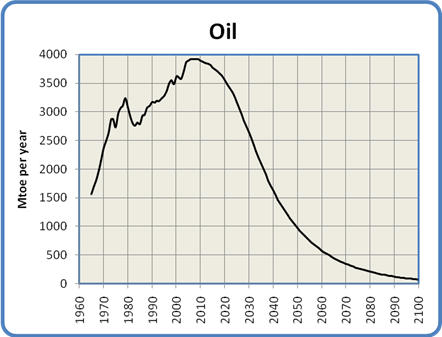
Figure 2: Global Oil Production, 1965 to 2100
The Net Export Problem
Before we leave the subject of oil, some comments about oil exports are in order. The graph in Figure 2 shows the aggregate oil production for the world. However, the world is not a uniform place of oil production and consumption. Some countries are net exporters of oil, while some are net importers who buy the exporters' oil on the international market.
In most countries the demand for oil is constantly increasing. This applies especially to oil exporting nations, where rising oil prices have stimulated economic growth. This additional growth has in turn resulted in a higher domestic demand for oil which is satisfied out of their surplus before it is made available for export. While the nation's oil production is increasing this does not pose much of a problem. When the exporting nation's production peaks and begins to decline however, something ominous happens: the amount of oil available for export declines at a faster rate than the production decline. This has become known as the "net oil export problem".
Consider this example. Say an exporting country produces one million barrels per day, and its citizens consume 500,000 barrels per day. This leaves 500,000 barrels for export. Then production declines by 5% per year. After one year their production is 950,000 barrels per day. At the same time, their economy is booming, resulting in an increased demand of 5%. This leads to a consumption of 525,000 barrels per day. That leaves only 425,000 barrels for export, for a 15% decline in exports. A graph over a number of years demonstrates the consequences:
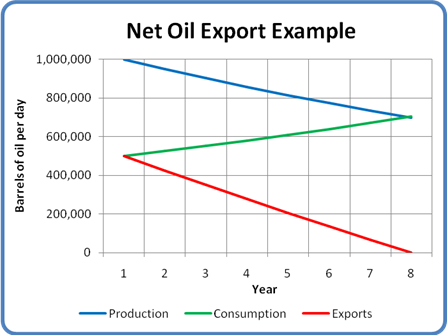
Figure 3: Net Export Example
At the end of 8 years, although the country is still producing over 700,000 barrels per day its exports have dropped to zero. This pattern has already been seen in Indonesia, the UK and the USA, each of whom was once a major oil exporter but is now a net importer.
This effect is already visible on the world oil market. Figure 4 shows a graph of total world exports over the last 5 years. An overlaid trend line (a second order polynomial for those who are interested) shows the pattern an imminent, rapid drop in the world's net oil exports.
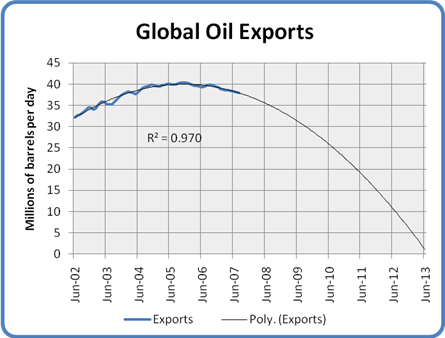
Figure 4: World Net Oil Exports 2002 to 2013
Such changes in exports are very worrisome for importing nations. The USA, for instance, imports about two thirds of its oil requirements. If the oil export market should suddenly begin to dry up as Figure 4 suggests it could, the US would be forced to make some very hard choices. These could include accepting a drastic reduction in industrial activity, GDP and lifestyle, abandoning the international oil market and enter into long-term supply contracts with producing nations, or even military action to secure foreign oil supplies (as may have already been attempted in Iraq).
I am indebted to the work of Jeffrey Brown and his Export Land Model for these insights.
Natural Gas
The supply situation with natural gas is very similar to that of oil. This makes sense because oil and gas come from the same biological source and tend to be found in similar geological formations. Gas and oil wells are drilled using very similar equipment. The differences between them have everything to do with the fact that oil is a viscous liquid while natural gas is, well, a gas.
While oil and gas will both exhibit a production peak, the slope of the post-peak decline for gas will be significantly steeper due to its lower viscosity. To help understand why, imagine two identical balloons, one filled with water and the other with air. If you set them down and let go of their necks, the air-filled balloon will empty much faster than the one filled with water. A gas reservoir works much the same way. When it is pierced by the well, the gas flows out under its own pressure. As the reservoir empties the flow can be kept relatively constant until the gas is gone, then it will suddenly stop.
Gas reservoirs show the same size distribution as oil reservoirs. As with oil, we found and drilled the big ones first. The reservoirs that are coming on-line now are getting progressively smaller, requiring a larger number of wells to be drilled to recover the same volume of gas. For example, the number of gas wells drilled in Canada between 1998 and 2004 went up by 400% (from 4,000 wells in 1998 to 16,000 wells in 2004), while the annual production stayed constant. All this means that the natural gas supply will exhibit a similar bell-shaped curve to what we saw for oil.
One other difference between oil and gas is the nature of their global export markets. Compared to oil, the gas market is quite small. This is due to the difficulty in transporting a gas as opposed to a liquid. While oil can be simply pumped into tankers and back out again, natural gas must first be liquefied (which takes substantial energy), transported in special tankers at low temperature and high pressure, then re-gasified at the destination which requires yet more energy. As a result most of the world's natural gas is shipped by pipeline. This pretty well limits gas to national and continental markets. That has an important implication: if a continent's gas supply runs low it is very difficult to supplement it with gas from somewhere else that is still well-supplied.
The peak of world gas production may not occur until 2025, but two things are sure: we will have even less warning than we had for Peak Oil, and the subsequent decline rates may be shockingly high. For the gas model I have chosen as the peak a plateau from 2025 to 2030. This is followed by a rapid increase in decline to 8% per year by 2050, remaining at a constant 8% per year for the following 50 years. This gives the production curve shown in Figure 5.
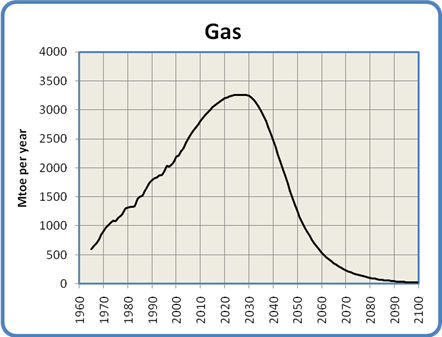
Figure 5: Global Natural Gas Production, 1965 to 2100
Coal
Coal is the ugly stepsister of fossil fuels. It has a terrible environmental reputation, going back to its first widespread use in Britain in the 1700s. London's coal-fired "peasoup" fogs were notorious, and damaged the health of hundreds of thousands of people. Nowadays the concern is less about soot and ash than about the carbon dioxide that results from burning coal. Weight for weight, coal produces more CO2 than either oil or gas. From an energy production standpoint coal has the advantage of very great abundance. Of course this abundance is a huge negative when considered from the perspective of global warming.
Most coal today is used to generate electricity. As economies grow, so does their demand for electricity, and if electricity is used to replace some of the energy lost due to the decline of oil and natural gas, this will put yet more upward pressure on the demand for coal. At the moment China is installing two to three new coal-fired power plants per week, and has plans to continue at this pace for at least the next decade.
Just as we saw with oil and gas, coal will exhibit an energy peak and decline. One factor in this is that we have in the past concentrated on finding and using the highest grade of coal, anthracite. Much of what remains consists of lower grade bituminous and lignite. These grades of coal produce less energy when burned, and require the mining of ever more coal to get the same amount of energy.
The Energy Watch Group has conducted an extensive analysis of coal use over the next century, and I have adopted their "best case" conclusions as a starting point for this model. The model projects a continued rise in the use of coal out to a peak in 2025. As global warming begins to have serious effects there will be mounting pressure to reduce coal use, resulting in a slightly more aggressive decline slope than the one projected by the Energy Watch Group.
Unfortunately, due to its abundance and our need to replace some of the energy lost from the depletion of oil and gas, the decline in coal use will not be as dramatic as seen with those fossil fuels. The model has the annual decline in coal use increasing evenly from 0% in 2025 to a steady 5% annual decline in 2100. These assumptions give the curve shown in Figure 6.
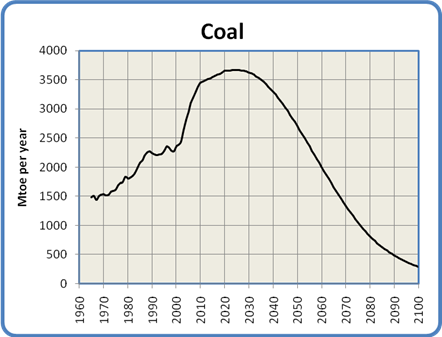
Figure 6: Global Coal Production, 1965 to 2100
Of course this use of coal carries with it the threat of increased global warming due to the continued production of CO2. Many hopeful words have been written about the possibility of alleviating this worry by implementing Carbon Capture and Storage. CCS usually involves the capture and compression of CO2 from power plant exhaust, which is then pumped into played-out gas fields for long term storage.
This technology is still in the experimental stage, and there is much skepticism surrounding the security of storing such enormous quantities of CO2 in porous rock strata. Such plans play little part in this analysis, although later when we discuss the intersection of ecological degradation with declining energy I will assume that little has been done compared to the scale of global CO2 generation.
Nuclear
The graph in Figure 7 is the result of a data synthesis and a bit of projection. I started with a table of reactor ages from the IAEA (reprinted in a presentation to the Association for the Study of Peak Oil and Gas), the table of historical nuclear power production numbers from the BP Statistical Review of World Energy 200 and a table from the Uranium Information Centre showing the number of reactors that are installed, under construction, planned or proposed worldwide.
The interesting thing about the table of reactor ages is that it shows that the vast majority of them (361 out of 439 or 82% to be precise) are between 17 and 40 years old. The number of reactors at each age varies of course, but the average number of reactors in each year is about 17. The number actually goes over 30 in a couple of years.
Two realizations form the basis for my model of nuclear power. The first is that since reactors have a finite lifespan averaging around 40 years, a lot of the world's reactors are rapidly approaching the end of their useful life. The second is that the replacement rate inferred from the UIC planning table is only about three to four reactors per year for at least the next ten years, and probably the next twenty.
These two facts mean that within the next twenty years we will have retired over 300 reactors, but will have built only 60. So by 2030 we will have seen a net loss of 240 or more reactors: over half the present stock. Since these reactors are all broadly similar in size (a bit less than 1 GW on average) that means we can calculate the approximate world generating capacity at any moment in time, with reasonable accuracy out to 2030 or so.
The model takes a generous interpretation of the available data. It assumes we will build 3 GW of nuclear capacity per year for the next ten years (about what is under construction now), 4.5 GW per year for the subsequent ten years (these are the reactors in the planning stages that will probably end up being built), and 6 GW/year for the 20 years following that from the reactors that have been proposed. It assumes a rising construction profile because I think we will start to get desperate for power in about 20 years - this is the reason reactor completions double over that period compared to today.
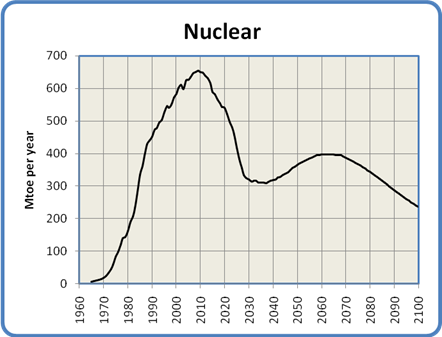
Figure 7: Global Nuclear Production, 1965 to 2100
The drop in capacity between now and 2030 is the result of new construction not keeping pace with the rapid decommissioning of large numbers of old reactors. The rise after 2030 comes from my prediction that we will double the pace of reactor construction in about 2025 when the energy situation starts to become visibly desperate and we realize that most of the reactors from the 1970-1990 building boom are out of service. The final decline after 2060 comes from my expectation that we will start losing global industrial capacity in a big way in a few decades due to the decline in oil and natural gas. As a result, by 2060 we won't have the capability we would need to replace all our aging nuclear reactors.
The argument for a peak in nuclear capacity in 2010 and the subsequent drop is very similar to the logistical considerations behind Peak Oil - the big pool of reactors is about to be exhausted, and we're not building enough replacements. In fact, to stay even with the rate of decommissioning of our current reactor base we would need to build 17 new reactors a year (more than 5 times the number that are now on the books) forever. That seems very unlikely given the capital, regulatory and public relations environments that the nuclear industry is now operating in.
As an aside, the drop in generating capacity after 2010 means that any concerns about outstripping the supply of mined uranium (currently about 50,000 tonnes per year worldwide) are avoided altogether.
Hydro
If coal is the ugly stepsister, hydro is one of the fairy godmothers of the energy story. Environmentally speaking it's relatively clean, if perhaps not quite as clean as once thought. It has the ability to supply large amounts of electricity quite consistently. The technology is well understood, universally available and not too technically demanding (at least compared to nuclear power). Dams and generators last a long time.
It has its share of problems, though they tend to be quite localized. Destruction of habitat due to flooding, the release of CO2 and methane from flooded vegetation, and the disruption of river flows are the primary issues. In terms of further development the main obstacle is that in many places the best hydro sites are already being used.
Nevertheless, it is an attractive energy source. Development will probably continue in the future at a similar pace as in the past, at least until loss of technological capacity or demand makes further development moot.
In order to project the growth rate of hydro power, I used a second order polynomial curve fitted to the production history of the past 40 years. Using such a projection assumes that future development will look very much like the past, at least until an external influence alters the course of events. The projection is shown in Figure 8. One thing that gives confidence in the reliability of the projection is the high correlation of the chosen curve to the actual data, as shown in the R-squared value of .994 (the closer to 1.0 the better the fit).
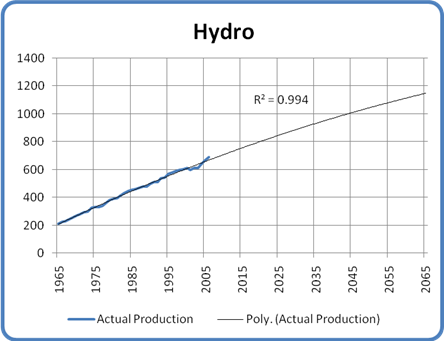
Figure 8: Projected Hydro Production
The model for hydro power shown in Figure 9 has capacity growing to about double its current level by 2060. It then declines back to the current level by 2100. The decline in the second half of the century is ascribed to a general loss of global industrial capacity and a reduction in water flows due to global warming. These are the external influences mentioned above.
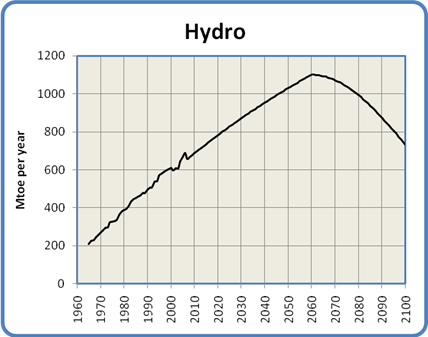
Figure 9: Global Hydro Production, 1965 to 2100
Renewable Energy
Renewable energy includes such sources as wind, photovoltaic and thermal solar, tidal and wave power etc. Assessing their probable contribution to the future energy mix is one of the more difficult balancing acts encountered in the construction of this model. The whole renewable energy industry is still in its infancy. At the moment, therefore, it shows little impact but enormous promise. While the global contribution is still minor (at the moment renewable technologies supply less than 1% of the world's total energy needs) its growth rate is exceptional. Wind power, for example, has experienced annual growth rates of 30% over the last decade.
Proponents of renewable energy point to the enormous amount of research being conducted and to the vast range of approaches being explored. They also point out correctly that the incentive is enormous: the development of renewable alternatives is crucial for the sustainability of human civilization. All this awareness, work, and promise give the nascent industry an aura of strength verging on invincibility. That in turn supports a conviction among its promoters that all things are possible.
Of course, the real world is full of unexpected constraints and unwarranted optimism. One such constraint has shown up in the field of biofuels, where a realization of the conflict between food and fuel has recently broken through into public consciousness. One can also see excessive optimism at work in the same field, where dreams of replacing the world's gasoline with ethanol and biodiesel are now struggling against the limits of low net energy in biological processes.
The key questions in developing a believable model are, what is the probable long-term growth rate of renewable energy going to be over the next 50 years, and what amount of energy will it ultimately contribute?
While I do not subscribe to the pessimistic notion that renewables will make little significant contribution, it's equally unrealistic to expect that they will achieve a dominant position in the energy marketplace. This is primarily because of their late start relative to the imminent decline of oil, gas and nuclear power, as well as their continued economic disadvantage relative to coal.
In order to project a realistic growth rate for renewable energy I have used the same approach as with hydro above. Data on the global production of renewable energy from 1980 to 2005, collected by the Energy Information Agency , was used as the starting point for the projection shown in Figure 10. As in the earlier use of this technique for the projection of hydro production, the closeness of the fit (again a second order polynomial giving an R-squared value of .994) gives a high degree of confidence in the projection.
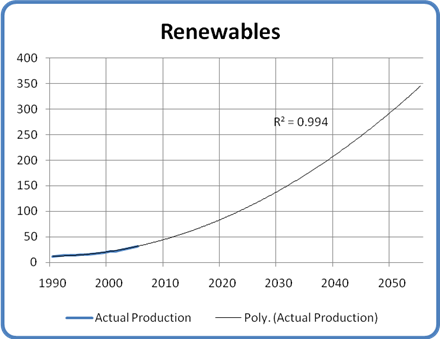
Figure 10: Projected Renewable Production
This technique has a couple of shortcomings. First, it aggregates all renewable energy sources: geothermal, solar, wind, biomass etc. Because some of these sources are still in their infancy, it is possible that they may exhibit higher growth rates in the future, thus making the projection too conservative. Balancing this of course is the possibility that they may run into unexpected constraints, skewing the outcome in the other direction. The second problem is that due to the youth of the industry large discontinuities in production from year to year may render the curve fit unreliable.
These objections have been addressed by using only the most recent 15 years of data as the basis for the projection. This encompasses the years of highest growth in the wind and solar industries, and as we see from the high correlation of the fit, the yearly variation from the curve is quite low. On balance, the projection seems suitable as a basis for the model.
I have placed the peak contribution in 2070. Production declines following the peak because many renewable energy sources (e.g. wind turbines and photovoltaic solar panels) are dependent on a high level of technology and manufacturing capacity. Still, the model foresees renewables contributing more to the energy picture at the end of the century than any other source except for hydro.
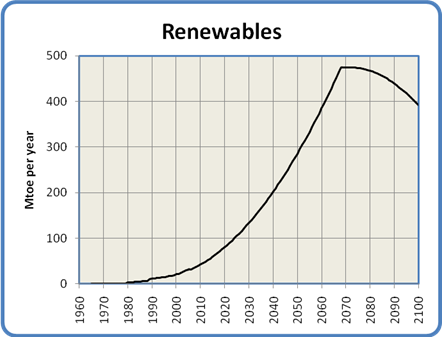
Figure 11: Global Renewable Energy Production, 1965 to 2100
Putting the Energy Sources in Perspective
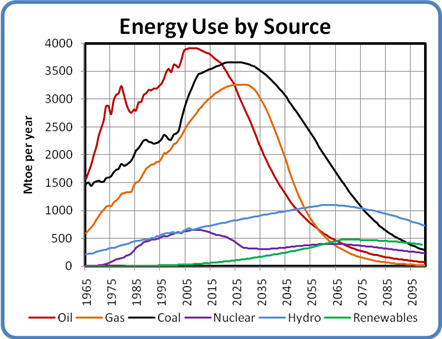
Figure 12: Energy Use by Source, 1965 to 2100
Figure 12 shows all the above curves on a single graph. This gives a sense of the relative timing of the various production peaks, as well as showing the contribution of each energy source relative to the others over time.
As you can see, fossil fuels are by far the most important contributors to the world's current energy mix, but all three are in rapid decline by the second half of the century. Hydro and renewables are making respectable contributions by mid-century, while nuclear power plays a constant role. By the end of the century, oil and natural gas have dropped out of the picture almost entirely, while the dominant players are hydro, renewable sources , coal and nuclear power, in that order.

Figure 13: Total Energy Use, 1965 to 2100
Figure 13 has all the energy curves added together to show the overall shape of total world energy consumption. This graph aggregates all the rises, peaks and declines to give a sense of the complete energy picture out to 2100. The graph shows a strong peak in about 2020, with a steepening decline out to 2100. The main reason for the decline is the loss of oil, gas, and (to a lesser extent) coal. The decline is cushioned by an increase in hydro and renewables over the middle of the century, and averages out to a little less than 3% per year.
Unfortunately, the loss of the enormous contribution of fossil fuels means that the total amount of energy available to humanity by the end of the century may be less than one fifth of the amount we use now, and less than one sixth the amount we will use at our energy peak a decade or so from now. This shortfall contains an ominous message for our future. That message is the subject of the remainder of this paper.
The Effect of Energy Decline on Population
As I said in the introduction, human population growth has been enabled by the growth in our energy supply. It is now time to examine this relationship a little more closely, and to think about the implications of the global energy model we have just assembled.
The Historical and Current Situation
According to an analysis of historical human energy use published by Western Oregon University, while per our capita food energy consumption has remained relatively constant (within a range of 3:1 over most of human history), the energy we each use for the rest of our activities has grown almost thirty times from our early agricultural days to the consumption we now see in developed countries. The world's population has increased by a similar amount in that time, from 200 million in 1 CE to 6.6 billion today.
One of the more significant results from the WOU study is the non-food energy consumption of an "advanced agricultural man" from northern Europe in the 1400s. When that number of 20,000 kilo-calories per day is converted to our standard measure of tonnes of oil equivalent, it turns out to be 0.75 toe per year. The consumption of an "early industrial man" in 1875 was estimated to be 2.5 toe per year. For comparison, the global average per capita non-food energy consumption in 1965 was only 1.2 toe per year.
There is of course a great disparity in global energy consumption. The combined populations of China, India, Pakistan and Bangladesh (2.7 billion) today use an average of just 0.8 toe per person per year, compared to the global average of 1.7 and the American consumption of about 8.0.
It is reasonable to expect that a declining world energy supply would affect countries at opposite ends of the consumption spectrum quite differently. The picture will be further complicated by the effects of declining net oil exports on oil importing nations, and whether those nations are rich or poor. While a rigorous analysis of these effects is beyond the scope of this paper, we will look at some of the probable short and medium term impacts. This will be in addition to our examination of the overall effect of energy decline on global population that is the main objective of the paper.
Long-Term and Aggregate Effects
As shown in the example of the "agricultural man" above, human beings need a significant amount of energy to sustain even a relatively poor quality of life. This implies that as energy supplies decline and per capita energy falls, the quality of life of those on the bottom end of the consumption scale will be drastically affected. The degree of the effect will depend on how close they are to a bare subsistence level of consumption.
In our civilization, scarce goods are allocated by price: the scarcer a necessary good is, the higher its price will go. Those who can afford to pay can acquire it at the expense of those who cannot. Those who are out-bid have to reduce their consumption or even do without. This applies as much to energy as an aggregate commodity as it does to any other good.
The extent to which someone can survive a drop in energy supplies and the resulting rise in energy prices depends primarily on whether they have other consumption they can forego to allow them to pay for the energy they need. Those at the bottom of the economic ladder have no ability to reallocate their discretionary spending for this purpose, because they have no discretionary spending. As a result, they will be out-bid and will have to do without some amount of fuel or electricity. If their consumption is already so low that it barely sustains them, such an occurrence would obviously be catastrophic.
Over 4.5 billion of the world's 6.6 billion occupants live in countries that have per capita energy consumptions under 2.0 toe per year. As energy supplies decline, these countries are at risk of vast increases in mortality as they are out-bid in the global energy marketplace and their populations begin to fall below the minimum energy level required for sustaining life.
Short Term and Regional Effects
These effects will result primarily from Peak Oil and the coming net export crisis. As the effects of declining exports are felt, the market price of oil will escalate very rapidly.
Some oil producing countries will choose to sell much of their product on the international market for the money it will bring. Such actions may result in a deprived and discontented population, giving rise to fuel riots and even the threat of revolution. Other producers may decide to keep their oil at home to preferentially supply their own citizens' needs. This will result in a wave of nationalization of oil resources so that governments can direct its distribution and control the local price.
Oil importing nations will face a choice similar to the poor nations described in the previous section. They will need to reallocate their discretionary money toward the purchase of oil. If that cannot buy enough to satisfy their needs they will be forced to reduce their consumption. If they are unwilling to do either, and have the means available, they may decide to secure their oil supply by force of arms. Nearby producing nations that are keeping (or thought to be keeping) their oil off the world market will be at special risk of becoming targets in a resource war. Some aspects of this geopolitical energy calculus may have already come into play in the American invasion of Iraq.
The net oil export crisis may well be the defining geopolitical event of the next decade.
The Population Model
The population model is based mainly on the long-term aggregate effects of energy decline. The mechanisms of the population decline it projects are not specified. However, it is likely that they will include such things as major regional food shortages, a spread of diseases due to a loss of urban medical and sanitation services and an increase in deaths due to exposure to heat and cold.
The main interaction in the model is between the energy available at any point in time (shown in Figure 13) and an estimate of average global per capita consumption. Current global consumption is about 1.7 toe per person per year, and in the model that declines evenly to a consumption of 1.0 toe per person per year by 2100. To put that in perspective, the world average in 1965 was 1.2, so the model is not predicting a huge decline below that level of consumption. An increase in the disparity between rich and poor nations is also likely, but that effect is masked by this approach.
Under those assumptions, the world population would rise to about 7.5 billion in 2025 before starting an inexorable decline to 1.8 billion by 2100.
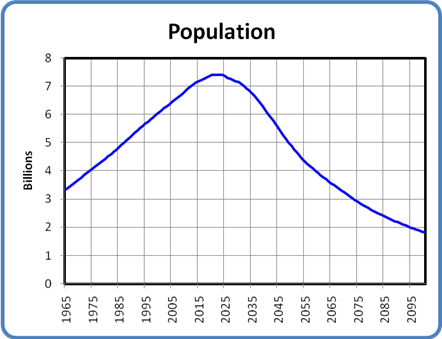
Figure 14: World Population with Declining Energy, 1965 to 2100
Effects of Ecological Damage
In order to complete the picture of human population over the next century it is necessary to bring some ecological insights to bear.
According to Wikipedia:
Ecology is the scientific study of the distribution and abundance of living organisms and how the distribution and abundance are affected by interactions between the organisms and their environment.
There are two ecological concepts that are the keys to understanding humanity's situation on our planet today. The first is Carrying Capacity, the second is Overshoot.
Carrying Capacity
The carrying capacity of an environment is established by the quantity of resources available to the population that inhabits it. The usual limiting resource is assumed to be the food supply. For plants and animals this definition is easily applied. The fluctuations in predator-prey relationships (e.g. wolves and deer or foxes and rabbits), or the number of buffalo that can live on a given area of prairie grassland are classic examples.
When we try to apply this definition to human beings we run into problems. In the animal world if a population is below the carrying capacity of its environment it will expand, and when it reaches the carrying capacity its numbers will stabilize. In the case of human beings, however, our numbers have been growing for a very long time, and in fact are still growing, though more slowly. Does this mean that we have not yet reached the carrying capacity of the Earth, or are other factors at work?
The missing consideration is, of course, the type of resource consumption by the individuals in the population.
In the animal world the main resource consumed is food, which is a fairly constant requirement. It may fluctuate somewhat due to such factors as growth or seasonal energy needs, but on average the amount of food that any organism needs to live is relatively stable. Since animals have few resource needs outside food and water it is relatively easy (at least conceptually) to establish the carrying capacity of a given environment for a particular species.
Even for humans, as we saw earlier, the amount of food we require to survive varies within only a small range – say 2000 to 5000 kilocalories per day, depending on our level of activity. What is variable, makes us distinct from other animals and makes the question of human carrying capacity more complicated is of course the level of non-food resources that humans consume. This can and does vary all over the map. In the previous sections we have been using energy as a proxy for all these resources.
My preferred definition of carrying capacity is:
The carrying capacity of a given environment is the maximum number of individuals that the environment can support sustainably at a given level of activity.
Sustainability is defined as follows:
A sustainable process or state is one that can be maintained at a certain level indefinitely. A sustainable process or state should provide optimal conditions for all organisms affected by it. A sustainable process or state must not threaten, directly or indirectly, the viability of any of the organisms affected by it.
Given these definitions it is intuitively obvious that the current level of human activity is not sustainable. The fact that it has been possible at all is mainly because of the use of fossil fuel, a non-renewable resource. That use is by definition unsustainable, and Peak Oil is graphic evidence of that fact.
Overshoot
A species is said to be in overshoot if its numbers (or more properly, its aggregate level of consumption) has exceeded the carrying capacity of its environment.
When a population rises beyond the carrying capacity of its environment, the existing population cannot be supported and must eventually decline to match or fall below the carrying capacity. A population usually cannot stay in overshoot for long. The rapidity and extent of the decline depend on the degree of overshoot and whether the carrying capacity is eroded during the overshoot, as shown in Figure 15. William Catton's book "Overshoot" is recommended for a full treatment of the subject.
There are two ways a population in overshoot can regain its balance with the carrying capacity of its environment. If the population stays constant or continues rising, its activity (expressed in terms of per capita resource consumption and waste production) must fall. If per capita consumption stays constant, population numbers must decline.
Populations in serious overshoot always decline. This is seen in wine vats when the yeast cells die after consuming all the sugar from the grapes and bathing themselves in their own poisonous alcoholic wastes. It's seen in predator-prey relations in the animal world, where the depletion of the prey species results in a reduction in the number of predators. This population reduction is known as a crash or a die-off, and can be very rapid.

Figure 15: Overshoot
It is an axiom of ecology that overshoots degrade the carrying capacity of the environment. This is illustrated in the declining "Carrying Capacity" curve in Figure 15. In the case of humanity, our use of oil has allowed us to perform prodigious feats of resource extraction and waste production that would simply have been inconceivable without the one-time gift of oil. Fossil fuels in general and oil in particular have made it possible for humanity to stay in a state of overshoot for a long time.
At the same time, the use of fossil fuel and other high-intensity energy has allowed us to mask the underlying degradation of the Earth's carrying capacity. For instance, the loss of arable land and topsoil fertility (estimated at 30% or more since World War II) has been masked by the use of artificial fertilizers made largely from natural gas. Another example is the death of the oceans, where 90% of all large fish species are now at risk, and most fish species will be at riskwithin 40 years.
This situation would be calamitous for nations that depend on the oceans for food, except that the use of fossil fuels allow them to fish ever farther from their home waters or import non-oceanic food to make up for the shortage of fish. Depleted water tables can be supplemented by water pumped from deeper wells; air pollution can be avoided by the use of air conditioners, etc. All of these indicate that ecological decline is being conveniently masked by our use of energy.
As our supply of energy (and especially that one-time gift of fossil fuels) begins to decline, this mask will be gradually peeled away to reveal the true extent of our ecological depredations. As we have to rely more and more on the unassisted bounty of nature, the consequences of our actions will begin to affect us all.
It is impossible to say with certainty how deep into overshoot humanity is at the moment. Some calculations point to an overshoot of 25%, others hint that it may be much greater than that. No matter what that number "really" is, there is no question of the damage we have done to the natural systems of air, land and water that supported us before the advent of coal, oil, and natural gas.
In order to complete the population model, I have factored in a gradually increasing effect from the unmasking of the world's loss of carrying capacity. The effect increases over time for two reasons. The first is simply that with less energy we won't be able to hide the existing ecological losses as well. The second is more insidious: as our energy supply declines we will do ever greater damage to the ecosphere in our attempt to forestall the inevitable. One major example of this is the increase in Global Warming that will come from the extra CO2 produced by the coal we will burn to try and replace the energy lost from declining oil and gas.
As in other aspects of this model, aggregation has been used to make the calculations more straightforward. In this case I have used a single numerical expression for "ecological damage" that rolls up all the possible sources of damage into a single mathematical term. The damage is assumed to come from a large variety of sources: climate change (e.g. droughts, flooding and other extreme weather events), loss of soil fertility, loss of fresh water supplies, the death of the oceans, chemical pollution of land and water, and the loss of biodiversity due to extinctions, habitat loss and monoculture food production. Such an aggregation necessarily results in a loss of precision, and may overstate or understate the actual situation. The chosen values represent my best estimate of the current state of the global ecology.
The model assumes that the impact of diminished carrying capacity will start now, and will reach about 40% by 2100. This 40% number represents the extent to which carrying capacity has been diminished and can no longer be masked by energy use. This impact is applied directly to the population numbers from Figure 14: an impact of 40% is taken to mean that the world will be able to support 40% fewer people than it might without the effect.
This affects the scenario in a three ways. First, the maximum population is slightly lower than it was in Figure 12. Second, the decline curve is a bit steeper. Most importantly the ultimate population in 2100 is no longer 1.8 billion, but just 1 billion people. Figure 15 shows the final population curve.
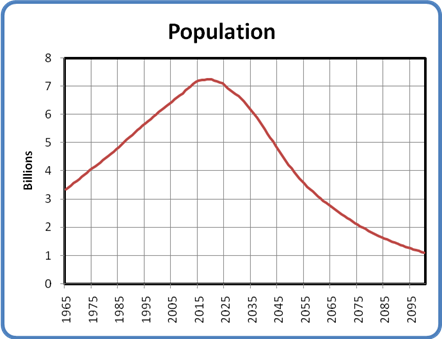
Figure 16: World Population with Declining Energy and Carrying Capacity, 1965 to 2100
Discussion
The scenario developed in this paper is fearsome indeed, and most people have an instinctive aversion to discussions of overpopulation or die-off. In my opinion, however, an awareness of the possibilities described here is essential if we are to make correct decisions on actions and policy at both the personal and government levels. An understanding of the problems of scale relating to energy sources is fundamental to this awareness.
The immediate objection to any worries about overpopulation is that population is declining naturally anyway, and will soon stabilize at a manageable number. The proper objective is therefore to hasten the fall of fertility rates, usually through the education and empowerment of women. Others claim that birth rates will fall naturally as poor nations industrialize, through the behaviour described by the Demographic Transition Model. We will examine each argument on its merits.
The education and empowerment approach has much to recommend it. It is humane, provides major benefits to societies where it occurs, and costs very little in either economic or energy terms. It is a valuable tool that must be promoted at every opportunity. Even in a resource-depleted world of one billion people, communities where such principles are in action will be much better off than those that hew strictly to the dominant "masculine" principles of our civilization (e.g. competition, domination and exploitation). Empowering women improves the diversity of values and makes more room for alternative social organizations, expanded conflict resolution approaches and a better understanding of humanity's relationship to our environment.
What we should not expect is that this approach will make a significant contribution to resolving the population problem in the time we have left. Education and empowerment take time, and there is far too little time remaining before the first wave of impacts is upon us. Where it will help is during the population decline. That decline will be going on for many years, possibly for two or three generations.
During that time, any birth that is humanely avoided adds one less person to the pool of those who are at horrifying risk of war, disease, starvation and death. Under such circumstances I would expect birth rates to fall dramatically anyway, but if we concentrate on educating and empowering women we will make fertility reduction more likely, along with improving the lot of those whose task it will be to keep civilization running.
Proponents of the Demographic Transition Model have a more difficult time. That model proposes that as a society industrializes it goes through two phases, the first consisting of rising life expectancies, the second characterized by a drop in fertility. The society transitions from a demographic situation of high birth and death rates through one of high birth and low death rates, to one of low birth and death rates.
I have published a study examining the energy that might be required to bring the world to a stable or declining population by this method. The result of that study was that it would take over five times the energy we use today to accomplish this, which is clearly an unrealistic expectation.
This leads naturally to the question, "Well, what if we come up with a new source that will give us the energy we need? What about fusion power or some even more exotic source? Wouldn't that take care of it?" My response is to suggest that the questioner take a hard look at what we've done with the energy we do have. Using it we have strip-mined the topsoil, drained the aquifers, destroyed the oceans, melted the glaciers, changed the very temperature of the planet, and exterminated untold other species in the process. Would more energy change that behaviour? There isn't a chance in (what's left of) the world.
In any event, if the conclusions of this model are anywhere close to correct all these arguments are moot. Energy constraints will trigger a reduction in population starting within 20 years, and the impact of those constraints will far exceed anything that such humanitarian measures could accomplish. In fact, if the model is correct, there will be no ongoing overpopulation problem at all, as natural processes intervene to bring our numbers back in line with our resource base.
This leaves the question of what such a population decline would look and feel like. The details of such a profound experience are impossible to predict, but it's safe to say it will be catastrophic far beyond anything humanity has experienced. The loss of life alone beggars belief. In the most serious part of the decline, during the two or three decades spanning the middle of this century, even with a net birth rate of zero we might expect death rates between 100 million and 150 million per year.
To put this in perspective, World War II caused 10 million excess deaths per year, and lasted a scant 6 years. This could be 50 times worse. Of course, a raw statement of excess deaths doesn't speak to the risk this will pose to the fabric of civilization itself. If it is true that the Inuit have a dozen words for "snow", we will need to invent a hundred for "hard times".
Conclusion
All the research I have done for this paper has convinced me that the human race is now out of time. We are staring at hard limits on our activities and numbers, imposed by energy constraints and ecological damage. There is no time left to mitigate the situation, and no way to bargain or engineer our way out of it. It is what it is, and neither Mother Nature nor the Laws of Physics are open to negotiation.
We have come to this point so suddenly that most of us have not yet realized it. While it may take another twenty years for the full effects to sink in, the first impacts from oil depletion (the net oil export crisis) will be felt within five years. Given the size of our civilization and the extent to which we rely on energy in all its myriad forms, five years is far too short a time to accomplish any of the unraveling or re-engineering it would take to back away from the precipice. At this point we are committed to going over the edge into a major population reduction.
However, this does not mean that we should adopt a fatalistic stance and assume there is nothing to be done. In fact nothing could be further from the truth. The need for action is more urgent now than ever. Humanity is not going to go extinct. There are going to be massive and ever-growing numbers of people in dire need for the foreseeable future. We need to start now to put systems, structures and attitudes in place that will help them cope with the difficulties, find happiness where it exists and thrive as best they can.
We need to develop new ways of seeing the world, new ways of seeing each other, new values and ethics. We need to do this with the aim of minimizing the misery and ensuring that as many healthy, happy people as possible emerge from this long trauma with the skills and knowledge needed to build the next cycle of civilization.
Personnel
Archives
- December 2008 (1)
- October 2008 (1)
- July 2008 (2)
- June 2008 (2)
- May 2008 (6)
- January 2008 (2)
- December 2007 (8)
- November 2007 (9)
- October 2007 (11)
- September 2007 (14)
- August 2007 (14)
- July 2007 (10)
- June 2007 (9)
- May 2007 (11)
- April 2007 (9)
- March 2007 (11)
- February 2007 (11)
- January 2007 (11)
- December 2006 (12)
- November 2006 (16)
- October 2006 (13)
License

This work is licensed under a Creative Commons Attribution-Share Alike 3.0 United States License.
Thanks for this well-presented and researched report on the population dilemma.
In the "Not adopting a fatalistic stance" department, I think many population-based calculations overlook the impact of the consumption multiplier that the billion of us that comprise the global middle class bring to the calculation.
If a Human Consumption Unit (HCU) is the reasonable amount of food and 'stuff' that a human needs to live a minimal full life (As opposed to what Ted Honderich refers to as the half- and quarter- lives that at least 2 billion of us lead currently) Then the global middle class is living about 10 HCU-equivalents. I expect that if you average the under-HCU population with the obscenely over-HCU population, the planet is currently support something like 15-20 billion HCUs.
These excess HCUs are the fat in the system that gives us a window to act.
A controlled and intentional crash of global middle-class consumption, combined with the increase in death rates and reduction in birth rate that will accompany reduced middle class consumption (Think post-soviet Russia), gives us a much more humane way to negotiate the downslope to a sustainable population than the apocalyptic dreams of some of the more extreme overshoot fans.
When it comes to downsizing HCUs, I think it is far better to focus first and foremost on reducing the global "C"s, while encouraging the global "H"s to decline more gradually to carrying capacity.
You get to the same place demographically, but the trip is far more pleasant.
A future earth with 1 billion humans each enjoying a full HCU, is a far more just, stable, and humane world than our current highly polarized one.
This sort of what I was referring to when I wrote about rich individuals and nations reallocating their discretionary spending towards the purchase of energy (or other essentials such as food). The problem is with the nations and individuals who don't have the discretionary spending power. The current economic system gives them virtually no chance. There is no mechanism for the just distribution of wealth, and those who presently hold it are not likely to opt for one.
The middle class will tighten their belts, but it won't keep the Chinese, Indians, Pakistanis, Bangladeshis, Africans, South East Asians and South Americans from falling into the abyss.
It's a nice dream, but the future reality is much more likely to involve a widening of the gulf of inequity rather than its narrowing.
Good point Glider Guider. I do find it fortunate that the US is an oil importing country. We have the most fat that can be reallocated to preparing for the future and we will be forced to face reality faster than if we were a net exporter. Because the net export model suggests that our imports will decline much faster than actual depletion, we will have the incentive and technology to improve efficiency while many poor exporting countries avoid collapse. The US/Europe still has the excess capital to improve our infrastructure and the incentive to encourage leapfrogging to avoid global warming and keep the costs of fossil fuels down. Making this happen is our responsibility as citizens.
Does anyone have any information on the effect the Iraq war had on American oil supplies? If it decreased oil supply and was a failure on that front (which I think it was) there will be less incentive to repeat the debacle. War is very oil intensive; I'm sure we've burned more than we've gotten, but I have no data to back that up. Any references would be most appreciated.
Very well written/thought out article. I repeat your plea to reject fatalism. We must not let perfection be the enemy of good. Any action to reduce overshoot must be pursued, perhaps a cost analyses of effective overshoot reduction strategies might be in order? And not just of energy supplies; all limiting factors (food, land, water etc). Perhaps some guest posts?
Thanks
Any solution to peak oil, global warming and poverty will depend on wide or universal access to contraception.
I=PAT
Impact = Population x Affluence x Technology (from Ehrlich)
Arkansaw of Samuel L Clemens
That should be Impact = Population X Affluence / Technology.
Concentrating solar can reduce natural gas consumption for peaking power within a timespan of months. Solar energy could be 25% of our power production in one years time, since our hundreds of megawatts of production would turn into hundreds of gigawatts at 1000 sun levels. More practically, we will just go to 100 sun levels and only produce an additional 25 gigawatts a year each year, substituting for gas at first, then for coal, then for nuclear, as we go from photovoltaic to thermal generation while our manufacturing capacity ramps up.
Concentrating solar ramps up within months, concentrating thermal takes years. Say, ten years to ramp up to the point of replacing all natural gas, and another ten years to replacing all coal.
Superb article. Thank you. With the press release from Accenture about their study around the world interviewing people's perceptions: http://newsroom.accenture.com/article_display.cfm?article_id=4601 perhaps getting this work passed around will encourage the average Joes to wake up to what's coming. It will be on the Weekend Link List Friday at http://newenergyandfuel.com/ with a very strong recommendation. I doubt that we're too late though. Rather we could be looking for policy leadership to mitigate the harm to those who most likely will be harmed. No where near enough attention and investment is being leveled at getting all the alternatives into working productive shape. But until 10s of millions of Joes catch on, well . . .
It's the leadership that inflicts the harm. To get out of that spiral, you need a completely new system of politics. The problem with that is that the current leaders have their fingers on all the important triggers and buttons and printing presses, and they're not planning on giving that up easily.
I agree - But what to use in place of it? A communist party as in China, soft dictatorship/democracy as in Russia or a hard dictatorship? The corporate business model doesn't have the cahones to put the money up nor should it put the investment, management, and labor at such risk. A government is a poor choice, too, as you note. Can a public corporate model be made to work or will it quickly be a bureaucratic sinkhole? Other than that Joe and Jane public has to become aware, educated, motivated and complaining about it. That means these articles are important. So . . . Pass it Around!
Like this: http://newenergyandfuel.com/
Maybe take a look at Jay Hanson's conclusions about Humans and Politics.
http://tech.groups.yahoo.com/group/killer_ape-peak_oil/messages/1?l=1
http://www.thesocialcontract.com/pdf/sixteen-two/xvi-2-93.pdf
Mr. Hanson's "killer_ape-peak_oil" group is private to members and apparently closed to anyone wishing to join at this time, as I cannot get Yahoo to give me any options about joining the group.
"The greatest shortcoming of the human race is our inability to understand the exponential function." -- Dr. Albert Bartlett
Into the Grey Zone
GZ
go to warsocialism.com
http://tech.groups.yahoo.com/group/WarSocialism/
I don't agree with the attempt to blame our current standard of living for the predicament we are facing. Regardless of the structure of society, overshoot would have come anyway. China and India are examples, and they swamp any “excessive” HCU we have here by their sheer numbers.
I watched a show the other day where the Chinese Ambassador to Canada said that their country is so polluted and so over populated that within 10 years they will have 150 MILLION environmental refugees that will have to be “relocated”. Is that a warning that they will have to emigrate to other countries??? That’s 40% of the US population. Where would they all go?
We require the high level of HCU to run this society. A society whose science and medicine has actually caused the over population in other countries to occur with the aid and technology we send them. http://www.parl.gc.ca/39/1/parlbus/commbus/senate/com-e/fore-e/rep-e/rep... is a prime example of where billions of aid to Africa has only made more poorer people.
If anything, advanced societies have a much better track record on the environment than less advanced societies. Soviet Russia, Africa, Indonesia, China and many others who live in advancement only because we export from our society, were/are environmental disasters. Yes, a lot of that is supporting our advanced society, no question, but even before that environment took second fiddle to humans, and in many places humans took second fiddle to “the motherland”.
Thus we should not feel ashamed, nor feel guilty at our high consumptive lifestyle. It was a great effort while it lasted. People of the future will marvel at us, and wonder what kind of wonderful life people today must have had, and wish they had lived in our times. But they will also realize that our high technological society had a lifespan of its own. Maybe they will learn a lesson from that.
As with any population of any organism, they eventually reach the carrying capacity, or have the carrying capacity pulled out from under it. Humans are no different, and we would have gotten here anyway. If anything we should be proud of what we have achieved as a species. We have achieved so much in science and technology, that absolutely must be preserved for future peoples, even thousands of years from now.
We will crash, maybe to a small fraction of our current population. There may be some modest recovery in 100 or 200 years. Though we have essentially raped the planet of all non-renewable resources save what those people in the future can mine from our buildings and garbage dumps, if there is one positive thing we can leave behind it’s our knowledge of science and technology. Of all things it would be a great shame to see that all evaporate and return to an age where people think the world is flat, we are at center of the universe and create all sorts of gods to explain how their world works.
Richard
London, Ont.
No one is ahead of their time, just the rest of humanity is slow to catch on.
Your conclusions are dire and your charts are very useful, thanks.
Research into solar, wave, wind and geothermal alternative energy supplies is not guaranteed to be the solution to global warming or the fossil fuels crisis.
And that is definite if we don’t even try. Funding for the alternative energy field is intentionally neglected. What we get is the War on Terror® instead.
Thank you GliderGuider for this assessment of a topic that is hard to bear, but bear it we must.
Wendell Berry has written that our "moral predicament as that of a steward. To live we must daily break the body and shed the blood of Creation. When we do this lovingly, knowingly, skillfully, reverently, it is a sacrament. When we do it greedily, clumsily, ignorantly, destructively, it is a desecration."
Combining this thought with your concluding ones:
And in reply to this population decline dilemma as was raised in yesterday's drumbeat, I offered what I hope might be seen as a fairly considered reflection on this whole question and how we might see fit to cope with it. I'm mentioning it here not to toot my own horn but to ask that we might treat this subject with a degree of respect it deserves and that I think GliderGuider is asking us to give it our consideration as well.
I'd be disappointed if we rehashed this topic in the way it usually occurs, of which the latest example IMO was in Robert Rapier's most recent post, and in which I thought contained a lot of heat but not much light to guide us by.
May some light of decency prevail here even in contemplation of the ultimate darkness. My linked to thoughts are far from perfect or anywhere near the be all and end all on this subject, but for me they were a start, and that is why I mention it.
http://reddit.com/info/5yig3/comments/
thank you for your support.
This is a keeper.
Caveat: 1-Food/Calories are given short shrift here.
Australia has had almost zero rain (20 mm) in the last three weeks.
An Ozzie said (from an FT article) that if no rain is received in three weeks, then disaster.
Right now the wheat forecast is 13.5 million tons, and you have to hunt ABARE to find that figure.
We're looking at less than seven. Australia needs
5 for domestic consumption.
The International Grain Council hasn't factored in
the Ozzie drop to 15.5 million tons yet.
PEAK OIL, TOTAL COLLAPSE, AND THE ROAD TO THE OLDUVAI
a commentary by Perry Arnett – 18 April 2007
A New Zealander factoring in Non Linear.
http://www.oilcrash.com/articles/arnett05.htm
Thanx again for all of your fine work.
Sincerely yours,
James
Arkansaw of Samuel L Clemens
I agree about food. I wanted to focus primarily on the energy linkage, so I aggregated the decline in food supply into the 40% "ecological damage" term I applied at the end. A complete analysis would entail breaking out that term into its components as I did with energy, but I think the whole ecological goatrope is still too hazy and chaotic for quantifiable projections.
Actually mcg I live in a part of Australia that has had 500 millimetres (20") of rain in the past 3 weeks, some places more. However so certain is middle Australia that things will 'work out' that they won't move from their familiar suburbs. Social and economic inertia is a powerful force.
They'll just have to start raising rice in the north instead of wheat in the middle, I guess. Australian farmers will have to follow the rain if they want to stay in the farming business.
Glider: Great post. One point: you say that Chindia is currently using .8 per person yet in your population assumptions you use 1.0. It would appear that the minimum necessary energy per capita to grow population is somewhat below .8 (IMO quite a bit below). Why 1.0?
I actually project a declining per capita energy consumption over the century, dropping from 1.7 toe/yr now to 1.0 in 2100. I settled on 1.0 as a target because I think the main impact to the global consumption profile is going to come from increasing inequality, where consumption goes even more strongly bimodal than it is today. I think the people in the upper consumption band are going to have the economic and military power to maintain their consumption (at least relative to the overall decline) while more people at the bottom fall off the cliff than would if the distribution were more equitable. The net effect IMO is for the per capita consumption to stay higher than it otherwise would.
I also wanted to avoid being accused of wanting to send the world back to the 1400s, which is what a reduction to the average consumption level of an "advanced agricultural man" (0.75) might have implied.
.
GliderGuider, IMO Europeans in the 1400's had an already unsustainable level of industrialization. Here's a quote from William Reid's "Weapons Throught the Ages" p 73:
"The quantity production of metal - along with men and food, the main raw material of war - is centered on a large degree on the development of a crushing mill to break down the mined metallic ores. A sketch of c. 1430 by a Hussite engineer illustates an engine that was probably designed for this purpose, although it wasa no more than another member of the trip-hammer family....The ore-crushing machine made an important contribution to the development of both offensive and defensive arms."
He goes on to talk of waterwheels powering bellows for tree-charcoal fired blast furnaces and for sharpening grinders.
I mention this because I think it's worth noting the industrial age had really started before the steam engine, and that the main inpetus for investment seems to have been advantage in warfare. America's disproportionate expenditures for military researearch is merely a continuation of this long-running trend. This doesn't bode well for a post-overshoot society based on European 1400 CE technology!
PLAN, PLANt, PLANet
Errol in Miami
If history had been a little different...
I think it's quite possible that the invasion of N.America and elsewhere by Europeans enabled them (unknowingly albeit) to forstall social failure from "Peak Wood" or some such.
If the First Nations peoples had done what was clearly in their interest (unknowingly) at the time and slaughtered them on the beaches, or at least prior to them getting back home with the good news of all the goodies to be found in the "New World" then things would have been much different I think
Slaughtering them on the beaches would have changed nothing. The vast majority of native American casualties came from disease, disease introduced by Europeans who had been exposed for generations to these same diseases (which were a direct outgrowth of our ability to domesticate large varieties of wild animals) and who were therefore largely immune to these diseases or at least had been naturally selected against that factor.
The course of modern history was probably largely dictated by the fortuitous circumstances described by Jared Diamond in Guns, Germs and Steel - that the Middle East happened to be home to the largest number of domesticable plants and animals and that this "agricultural package" is what made the civilizations that sprang from Middle Eastern heritage (Europe and Asia) so strong. Diamond argues that the lack of domesticable plants and animals in North America greatly hampered the spread of civilization here. As Diamond notes, North and South America only had a couple of domesticable animal species and Africa had none, leaving them poorer than their neighbors in the race for power. That shortcoming created the discrepancies that we find still in play even today. So slaughtering them would not have changed much at all. Massive casualties still would have occurred as smallpox and other diseases rapidly spread outwards from first contact locations. (Some estimates place the casualty rate from disease as high as 90%.)
"The greatest shortcoming of the human race is our inability to understand the exponential function." -- Dr. Albert Bartlett
Into the Grey Zone
Others have said that human activity became unsustainable when we developed agriculture 10,000 years ago. I wouldn't go quite that far but I agree with the underlying point - that any human activity that permits any degree of long-term growth in numbers and per-capita consumption is inherently unsustainable.
Have you considered different high low case scenarios at all the branches in your thinking?
for instance is it not possible that the military power effect may shrink the number of nations capable of maintaining a high consumption level and the countries falling into the gorge may be larger in number. winner takes all scenario
also if geopolitical maneuvering causes a distortion in distribution.. and I think most of us would agree it already does... does this distortion suppress or increase consumption compared to some unknownable base case?
I'm in two minds about that myself..
since these are highly subjective issues is it possible to re-gig the analysis for different what if options?
did you calculate the analysis through with a die off result as a priori or just assume some starting conditions, rates of change etc and calculate the result?
well structured post by the way....
Boris
London
OH RLY? I mean, if this is considered a "great post", then I have to reconsider the respectability of this site.
This is not just a Great Post, it is one of the Greatest. How many people have the guts to tell it like it is. We are deep into overshoot and there is only one way out, down.
But for those looking to play the blame game, I think most of you are looking in the wrong place. There is no blame other than the evolutionary success of our species.
Ron Patterson
"We are deep into overshoot"
On a linear graph with linear thinking,
we are into overshoot.
Since humans tend to think linearly, you MIGHT be right.
"The sun will come out
Tomorrow
Bet your bottom dollar that tomorrow
There'll be sun..."
This is fearsome indeed. In ecological impacts that you have factored in, have you fully taken account of the latest predictions of James Hansen on the stability and possible melt rate of the Greenland and West Antarctic ice sheets? If the oil, gas and (especially) coal resources you have shown are mostly burnt without carbon capture - the most likely outcome if there is the "energy panic" you predict in 10-15 years time, we can expect irreversible and rapid melting of at least Greenland and probably West Antartic to begin by the third decade of this century. That could put 5-10m on sea levels by the end of the century.
Even 1/3rd of that by 2050 would mean extensive flooding and saline contamination of some of the world's most productive cropland and major coastal cities, with inevitable major economic impacts. This in itself might be enough to stimulate industrial collapse.
Several posters here (including Gail) have talked about the ending of the perpetual growth paradigm - which would be obvious by 2020 - as signalling a collapse of world economic systems which would itself accelerate societal collapse.
Sorry to be so doomish, as if the scenario is not bad enough as it is. On a practical note, I'd encourage all who take this seriously to undertake westexas's ELP strategy as a crash programme for themselves and families. Also, consider moving to (or even helping to create), a resilient community such a small town where a reasonable number of people still have or can develop the varied, "old-style" skills which will be essential to survival in such a situation.
I think you discussed in more detail a few months ago the scale of excess deaths the scenario implies. While most of these will affect "developing" countries, it is clear that no nation will escape. I think JM Greer recently wrote in his Archdruid Report that for the future you need to heed the advice given at the start of commercial airline flights - "secure your own oxygen mask before trying to help others" - i.e. ensure that you yourself have a range of skills that will be relevant to your own survival in the world to come.
In ecological impacts that you have factored in, have you fully taken account of the latest predictions of James Hansen on the stability and possible melt rate of the Greenland and West Antarctic ice sheets? If the oil, gas and (especially) coal resources you have shown are mostly burnt without carbon capture - the most likely outcome if there is the "energy panic" you predict in 10-15 years time, we can expect irreversible and rapid melting of at least Greenland and probably West Antartic to begin by the third decade of this century. That could put 5-10m on sea levels by the end of the century.
The last time Greenland was ice free was 110,000 years ago. There have been periods in that time since were Greenland was as much as 15C warmer for hundreds of years, and it did not all melt. In fact ice there continued to accumulate, which is why there is even a record in those cores of those events. (BTW, ice accumulation in Greenland is still occuring at a faster rate than the melting).
The volume of ice, and the latent heat required to melt it all is emormous, taking thousands of years to melt it all.
Some predictions claim that the start of the melt will put so much fresh water into the North Atlantic as to force a shut down of the Gulf Stream which would start a cooling effect in the Arctic and possibly trigger a new ice age.
The climate is so complex, has so many factors, is so unknown, that any predictions in the near, let alone the far future, is highly suspect.
Besides, I'm voting for a much warmer future. Bring it on as I'm not looking forward to try to keep us warm in the winter. Global warming may be a life saver for many after and during the crash.
Richard
London, Ont.
No one is ahead of their time, just the rest of humanity is slow to catch on.
"Bring it on". Be careful what you wish for.
Current ice accumulation in Greenland is not occurring faster than the melt. Total melt versus ice formation yields a loss of total ice and it is accelerating.
"The greatest shortcoming of the human race is our inability to understand the exponential function." -- Dr. Albert Bartlett
Into the Grey Zone
Then how come the accumulation in the centre has been going up the past several decades? It's snowing more. Doesn't matter, the volume of ice would take a 1000 years to melt. We wont last that long as this society.
Yea, I'm wishing for warmer times due to GW if it means survival for us in Canada from not having to heat our homes as much vs people in another far off country who are grossly over population living on shore lines getting flooded. Yea, no brainer. Callous? Heartless? No realistic. I have 4 children and 4 grandchildren and they are my duty to protect. Better get used to it, hard choices are coming.
Richard Wakefield
London, Ont.
No one is ahead of their time, just the rest of humanity is slow to catch on.
What makes you think warmer weather will necessarily be better?
Hi jrwakefield
Global warming does not mean just warmer world temperatures, it also means chaos and unpredictable temperatures. We have had relatively stable weather in Canada for all our history; with global warming weather is becoming unstable and this may not be good for your 4 children and 4 grandchildren.
Might get sucked up in a tornado,eh?:)
From what I've read warmer average temperatures will mean more moderated temps, less swings. With warmier Arctic means fewer cold fronts (that cause your tornados) hence LESS severe storms. That's not from me, that's from climatologists I've read.
If temperatures are warmer on averge does not mean the world will get hotter. If the swing between high and low is changed only with the low getting warmer, but the high staying put, then the average temp increase. But with more moderate temps over all.
This appears to be the case when the world was warmer before this last round of ice ages 110,000 years ago (when Greenland was more or less free of ice) and 55 million years ago when the average temp was 8C warmer than now.
The bottom line for me, from what I've read, is the alarmism is way over blown (a number of scientists on the IPCC panel have said that not me) and highly politizied. This whole worry about CC is irrelevant anyway. This current version of society isn't going to be around when issues from that take hold. The population may very well be in the midst of a crash anyway, and quite frankly those trying to survive buy growing their own food are not going to give a rats ass for anyone who is being flooded out elsewhere.
In my view AGW has hijacked where PO should be in the public's mind. It's a much sooner and world wide threat than GW ever will be. It's almost like AGW is a distraction, but that would mean a conspiricy theory, which I don't subscribe to.
Richard Wakefield
London, Ont.
No one is ahead of their time, just the rest of humanity is slow to catch on.
The world had different temperature ranges in the geologic past because the thermohaline circulation was vastly different due to different continental placement. Just a few million years ago, there was no "central America" and the Atlantic flowed freely into the Pacific. Global circulation patterns were very different. Likewise, not too many million years ago, there was clear circulation from the Atlantic through the Mediterranean into the Indian Ocean. These changes are massive and attempting to equate the climate of several million years past with today's climate without also attempting to account for these serious differences leads to improbable conclusions.
Unlike your wholly speculative position, the global warming community has developed extensive models that continue to be refined as more data becomes available. These models include factors like the thermohaline circulation, and many other factors as well. The truth is that as our climate becomes warmer, more volatility is predicted by the models and that is indeed what we have seen thus far. Your assertion that the highs "stay put" is already disproven by the available data to date. Rather than speculating from a preconceived position, you should study the data with an open mind.
"The greatest shortcoming of the human race is our inability to understand the exponential function." -- Dr. Albert Bartlett
Into the Grey Zone
Yes, I'm well versed in geological history, so I understand those past events and what it means. My point about CC is two fold. 1) predictions from climate models are highly suspect (I write software for a living) and vary by orders of magnitude. Hence predictions based on them cannot be trusted. 2) Yes, climate changes happen, and has happened in the geological past. It doesn't even matter we are causing it as there is no way we have the time nor resouces to change it, assuming CC is changable. The reduction in CO2 everyone wants, some calling for more than 80%, is simply unrealistic to expect civilization to voluntarily do that. With the continued inclusion into the argument that North Americans consume 10 times the energy than someone in Nigeria, means to me that much of the action demanded is nothing but a highly leftist plot to kill off our society (I'm not a far right BTW, but in the middle, where most of the public is).
Besides, and I'll say it again, CC is not the threat it's made out to be, because resource depletion, the purpose of this threat to start with, will be the CO2 reducer you are looking for by crashing our civilization.
If we are serious about doing something to save future peoples, and hopefully ourselves, then we should just forget trying to change climate change, take it as a given, and get to work preparing for a lifestyle that is far more local, far less energy insensive and sustainable for the lower population that's to come. There's a lot to do in order to do that, and there is precious little being done, and even less time to do it in. That's what our focus should be.
Richard Wakefield
London, Ont.
No one is ahead of their time, just the rest of humanity is slow to catch on.
.
I don't know. 40% of British Columbia's pine forest is dead due to climate change, and the rest is likely to go by 2013.
Doesn't sound good for Canada.
That's not climate change, that's pine beetles. Even in a worst-case scenario, those areas get logged and replanted, either with pine or with some other native tree - there's no major threat to human habitability involved.
"That's not climate change, that's pine beetles. "
It's pine beetles, able to live in a new environment due to the lack of killing frosts, due to climate change.
It's not a killer threat to humans, but it's a very good example of an unexpected and large harm to Canada, a northern country, due to CC.
My point is, it's a big mistake to assume that any country will benefit from climate change, just because it's farther north. It's not "warming", it's "change", and usually not for the better.
"Mountain pine beetle (MPB) has been present in British Columbia's forests for millenia."
That's not entirely clear. As these animations of infestation areas over the last 40 years show, there was a pretty bad infestation in the early 80s, suggesting severe infestations are not a new occurrence.
.
Yes it is climate change, Pitt. The Pine Beetle normally dies off in very large numbers after laying its eggs. This die off occurs even though the adult beetles burrow in an effort to survive the winter. But the temperatures would kill them. As temperatures have risen in the north, the winter no longer gets sufficiently cold to kill off as many adults. Thus, these adults join the newly hatched young the following spring, increasing the size of the swarm. This has been clearly established by those researching the issue. You may wish to further familiarize yourself with this topic. This is exactly the sort of unanticipated side effects from global warming that will cause serious harm to our environment.
"The greatest shortcoming of the human race is our inability to understand the exponential function." -- Dr. Albert Bartlett
Into the Grey Zone
But this begs the question. How did the pine trees survive that last warming before the last ice age? There were several 1000's of years of very warm times then and there must have been something that allowed the trees to outwit, or live with these beetles.
This is my beef with the alarmism. It may indeed be bad for many humans (but so too is PO and the coming collapse), but that does not mean that GW is the end of the world or life. This is normal for populations to go through these highs and lows.
If humans were never here, this would quite likely happen anyway with the pine beetle. The issue is because our society has become dependant upon clear cutting forests. The threat to the trees is not the beetle per se, but what we are doing to the forests that make them more suseptable to the beetles. We are thining out trees that have the potential to deal with the beetle and it's fungus that stops the tree's defence mechanism. The fewer the indiviuals in a population the more suseptable it is to selection pressures.
That's the problem, and will soon be solved once the population crashes.
Richard Wakefield
London, Ont.
No one is ahead of their time, just the rest of humanity is slow to catch on.
In past climate change, the trees migrated. Now, trees migrate by propagating rather than by packing their suitcases, but with gradual climate change, that is no big deal. A tree and it's children can live out their lives where they are rooted. Kids to the north or south may have a little more relative success with their kids depending on the direction of climate change. Trees are adapted to that sort of thing. They don't attempt to live forever on the assumption of climate stability. They reproduce. But, they do take some time to mature. Now, if you are a tree, and packing the suitcase is not an option, what are you suppose to make of what the tree news is reporting over at ArborDay.org?
Guess you try to figure out how to bribe the squirrels to run your acorns 200 miles north and hope that will work.
Rapid climate change is not so good for trees. They are not adapted to it.
Chris
BC's timber problems is more than just climate change. I'm not denying climate is changing, I'm skeptical it is enterly bad. Some of the bad is our own making. The pine beatle is an example.
"During early stages of an outbreak, attacks are limited largely to trees under stress from injury, poor site conditions, fire damage, overcrowding, root disease or old age. As beetle populations increase, the beetles attack most large trees in the outbreak area."
http://en.wikipedia.org/wiki/Pine_beetle
The clear cutting is also contributing to the problem. To me the pine beetle problem is just another in a long series of human caused problems that is going to hit our society hard.
Richard Wakefield
London, Ont.
No one is ahead of their time, just the rest of humanity is slow to catch on.
"Some of the bad is our own making."
Climate change is just that:
Change.
No "good" or "bad". Just is.
Millions might die because of floods, for instance.
Malaria might become a plague.
The (southern) Sahara might get a rainy season again.
Since AGW took root about 6-8TYears ago, probably resulting from agriculture, the earth has probable never had a more stable climate:
Click for full graph.
Notice how volatile temperature before the past couple millenia were. Now for the past 12TYears:
Click for full graph.
Please refer to: http://www.globalwarmingart.com/wiki/Image:Ice_Age_Temperature_Rev_png
As we see, temperatures have been falling/stable the past 8TY. Many think that without man, we would already be moving into a new glaciation period.
Recent years suggest that we are breaking out of this, into higher terrain - Now AGW seems to be going into overdrive. Things are *beginning* to change.
There will be benefitters and losers, profit and strife.
Humans have destroyed local environments many times in the past, usually by ruining the soil.
This change will be epic (If I have any predictive abilities). There will be dying populations and migrant populations. Miami/NO and co might go under. Many will want into Canada...
But I agree with Richard: GW is linear change which humanity is used to dealing with. Cities are built and abandon. Others are build. Ur falls into the annals of history.
PO, on the other hand, challenges the basic system which has been put together over hundreds / thousands of years.
Cheers, Dom
This is a good analysis of long term trends, based on best estimates of remaining resources, extraction, infrastructure, and decline rates. Of course the real world rarely develops along such smooth trajectories. One area which would benefit from further consideration is the effect of short term discontinuities. The robustness/diversity of supply sources and infrastructure, and the risks of short-term
supply interruptions to a country's abilities to provide food, water, warmth and security for their populations. In the case of the UK with its 10 or so days of natural gas storage, and probably a similar petrol/diesel storage, plus limited food storage, the effects on domestic heating,
supermarket shelves, and electricity generation of a cut in supplies, would become critical within just a few weeks, as in 2000. Such a risk, from a US/European/Isreali attack to disarm Iran's nuclear ambitions, is real and present. The short term loss of supply of Middle-East oil, potentially compounded by Russian Iranian support, expressed through supply constriction, would test the JIT supply chains supporting developed countries populations to the limit.
Records
I disagree with one of the fundamental premises of this article:
GliderGuider accurately describes the energy situation, something well known to people on this forum. He also accurately describes the population growth situation, again a topic that is well known. However, the existence of two similar trends does not imply causality. One could just as well show that the population growth rate is similar to the growth rate of the number of NFL football games played per year.
Places like the state of Uttar Pradesh in India have experienced a population boom in the last 100 years, but almost all of their population has no access to fossil fuels, even indirectly. On the other hand, places like Europe, with heavy energy usage, have seen their population growth rates flatten out, and these growth rates will begin to decline soon regardless of what happens with energy.
Japan in 1850 had a population of 23 million, a higher population density than the earth's overall population density today. (Here is a link giving Japanese population figures from 1872: http://www.stat.go.jp/english/data/chouki/02.htm). I think this gives evidence that a high density population can be maintained without fossil fuels.
Don't get me wrong; I am not saying that peak oil will bring pleasant consequences or anything like that. I'm also not saying that the planet will support infinite population growth. I am only saying that there is little causality between energy growth and population growth.
NG,
A bit of an old argument, I think.
There is no doubt that the energy embedded in the Green Revolution, both in its fertilizer/herbicide- and in its transport aspect, has greatly impacted world population. Uttar Pradesh without food aid would be a whole different place today.
Uh - you realized that Uttar Pradesh is the largest producer of food grains in India, and has a food surplus, yes?
Why did you assert something without bothering to check your facts? How are we supposed to take any assertions you make seriously if you have this demonstrated tendency to make things up to support your arguments?
That an argument is old doesn't invalidate it. In fact, that an argument is old and hasn't been invalidated tends to suggest that whatever it's arguing against probably needs serious revision.
Perhaps one needs to remember that the Green Revolution also entailed the massive irrigation projects now having so many problems in U.P.: lack of water, intermittent distribution, and where there is enough blue gold... salinity is killing production.
U.P. is THE exception in that it lies at the foothills of the Himalayas and thus is swimming in free silt and water (or should be!). When U.P. is starting to have problems, which it most definitely, let's just say the hotter, drier states of India are going to suffer much more dramatically.
Gary
And your evidence for any of this is?...
I'm not saying you're wrong, but the last guy to make evidence-free assertions about Uttar Pradesh was wrong, so history suggests a certain amount of skepticism is in order.
Some questions please.
Does Pradesh have closed borders?
How much of a population boom in 100 years?
Do people in Pradesh use birth control as in Europe?
What do you mean by "ALMOST all of their population has no access to fossil fuels".
Do you subscribe to the assertion that the population of the world would have jumped from 1 billion to the current 6.5 billion without oil, gas and the internal combustion engine?
How is Japan's population density in 1872 relate to the earth's overall density now? Are you including Antarctica, Greenland, Australia and Canada in your calculations, for "earth's overall population density"?
No - it's an Indian state, and India is more-or-less a Western-style democracy. The state saw large migrations during the partition of India and Pakistan, for example.
AS I thought 90% bulldust.
Immigration, no figures given for anything concerning the reason for the population explosion.
Stated population boom was cited over 100 years now changed by you to 50.
So no birth control, yet population increase was compared with Europe.
"so it's not like nobody there has access to oil"
High yield crop varieties, hybrids. Where do they come from?
From a proudly declared "story" which you backed up I get several "probably's" now and still no hard data.
If you have evidence that contradicts the cites I've given, please provide it. Otherwise, your assertions are little more than your opinion, and are not credible.
It doesn't matter; they're there now, and don't require continuous oil inputs to maintain.
Sorry, but what are you talking about? That bears no relation to anything I've written, and appears to have no relevant point. What are you trying to say?
Not to mention, of course, that you're wrong - the link I provided gives population information for both 50 and 100 years ago.
What is your point? Are you even trying to make one? I have no idea what this comment is supposed to mean.
If you have some point you're trying to make, you're going to have to write a whole lot more clearly to make it understandable.
Pitt you are the one who made all the declarations, with not one piece of evidence.
Now you want evidence for my requesting evidence.
I'll state it bluntly.......
Prove to me that the large population increase in Uttar Pradesh was not due in any part to the use of oil.
This is what has happened.
To show that a population explosion can occur without the use of oil, an example is given of Utter Pradesh.
I say Bulldust.
You say prove it.
Now I say bulldust AGAIN.
Do not answer unless YOU provide evidence. So far I've been questioning a fairy tale.
You see those words that are different colours than the other ones? That are called links, and if you click on them with your mouse pointer, they'll take you to another website. Those other websites will give you evidence backing up what I've said, which is why I linked to them.
Nonsensical demand - nothing can be proven (outside of math and logic), meaning that you could always complain that any level of evidence I provide is not enough. Demanding that someone prove a negative is particularly absurd - it's like demanding you prove nobody lives in the Horsehead Nebula.
As it stands now, though, I've provided evidence and you've provided nothing. The ball ain't in my court.
Read the links yourself. They prove my point.
Do you want a few long links to read from me, they are easy to find with google?
Use Google Earth and have a look at Lucknow, Varanisi or Kanpur and tell me oil had nothing to do with it.
Not once anywhere have I read that any population increase is due in no part to oil or industrialization. If I have missed it please show it to me.
They have trains, cars and trucks, like anywhere else in India.
They don't practice birth control and Uttar Pradesh has immigration and migration.
They don't have closed borders, it is a part of India, so simple to understand.
You speak like it was some huge experiment to prove the fact that populations explode without oil and industrialization.
For you to tell me the increase of 250% is due in no part to oil is BS. I need proof or STFU.
"It was in the Uttar Pradesh (The period between 1857-58) that the first struggle for liberation from the British yoke was unleashed. The revolt was suppressed and from then till independence it remained under British dominance. In 1950 the state was organised and named as Uttar Pradesh".
I getting from you 100 years of population increase.
Can you show me the population explosion from 1900 to 1950.
You also haven't read it from me, so I'm really not sure what you're complaining about.
You're right - it's BS that I told you that. I've never said any such thing.
No I don't. You asked some questions, I answered them, and then you started getting abusive.
You're assuming I'm saying all kinds of things that I've never said, and then complaining about them. You could have this argument all by yourself, since you seem to be making up most of the things you claim I'm saying.
Yep get out now while you are behind.
You are the one with all the links. You were acting like Clarence Darrow.
You said them all because you defended the original fairy tale. You thought it was true.
How consistent to you think your report is with the report today in the WSJ that 44% of proposed new generation is renewable? Taking wind as providing 20% of new generation in 2006, your figure 11 does not seem to be consistent with an annual or biannual doubling of renewable energy capacity.
Chris
That has to be 44% of new CAPACITY.
Apply real world capacity factors, and one can expect only 19% of future POWER from these additions to come from renewables.
Not nearly as rosy a picture.
"Apply real world capacity factors, and one can expect only 19% of future POWER from these additions to come from renewables."
What capacity factors are you using? About 90 of the 326GW was gas, and only 56 was coal and only 36 was nuclear. A lot of gas plants have a capacity factor of less than 20%. If you assume 73% for coal (per NEI) and oil, 90% for nuclear and 40% for gas, you get 28% coming from renewables.
It was indeed 20% in 2006, per NEI, so that's 40% growth year over year. Not bad.
Alternatives cannot be scaled up. It's easy to calculate that the number of wind turbines the US would need to replace just automobile gasoline is some 2 million turbines. We don't have the fossil fuels left to build 10,000 turbines let alone 2 million of them.
Alternatives may be great on small scale, may even be a god-send for peoples 100 years from now (if they can keep them running), but alternatives will never substitute for fossil fuels to keep this society going as is.
Richard
London, Ont.
No one is ahead of their time, just the rest of humanity is slow to catch on.
And your evidence for this is?...
15,000MW of wind generation capacity was installed last year. With an average per-turbine generation capacity of about 1MW, that means more than 10,000 turbines were installed last year alone.
i.e., you have no idea what you're talking about.
"Alternatives cannot be scaled up."
Sure, they can. The US organization of utility System Operators has received interconnection requests for about 120GW of renewables. Only about 330GW of wind would be needed to replace gasoline (see below).
"It's easy to calculate that the number of wind turbines the US would need to replace just automobile gasoline is some 2 million turbines. "
Could you show your calculations? Here are mine: about 112,000 3GW wind turbines would be needed, based on 3GW wind turbines @30% capacity factor, 210K light vehicles, 12k miles per vehicle, and .35 KWH per mile.
Don't confuse capacity with actual output of a wind turbine. The actual physical output is 20% of capacty for the simple reason that the wind rarely blows at maximum (50-55km/hr), and the actual output is the cube of the windspeed. Cut the windspeed in half and you get 1/8th the output (20%).
As for turbines replacing gasoline, do it in joules per hour. I've posted already here for ontatio's gasoline consumption of 15 billion litrs per year (6x10^13 joules per hour) then divide by the capacity of a turbine then mulitply by 5 (the 20% actual) and you get 66,000 turbines. Since the US is 30 times the size of Ontario at least, that's 2 million turbines.
How many have actually been built in the US so far, I can't seem to find a definative number, but ontario is about 50-60 of them done, and as many on the board. (they take 2 years each to build, doing about 20-25 at a time).
That's my justification. Show where it is wrong.
Richard Wakefield
London, Ont.
No one is ahead of their time, just the rest of humanity is slow to catch on.
If you're going to try that, you'd better factor in the relative efficiencies of ICE and electric motors. An EV only uses about 0.1 to 0.2 KWh/km. An ICE at .07 l/km (7 l per 100 km) uses about 0.6 KWh/km, so EVs are 4 times as efficient.
If you're just looking at the thermal content of the gasoline you're going to get criticized. Trust me, I know :-)
" An ICE at .07 l/km (7 l per 100 km) uses about 0.6 KWh/km, so EVs are 4 times as efficient."
Well, that assumes a vehicle reasonably close to European efficiency. US efficiency is closer to .11 l/lkm.
"If you're just looking at the thermal content of the gasoline you're going to get criticized. Trust me, I know :-)"
Yeah :~)
So is it 4 times or 6 times, the difference? 4 times is what I've seen, albeit under ideal conditions (new batteries for example, older batteries require more charge and run less, and colder batteries require more charge and we get mighty cold here some winters). As time goes on for these vehicles then the required power will be more. Thus any production would have to take that into account. So even at 4 times efficiency, that's 1/4 of 66,000 1.5MW turbines. That's still a lot and still require decades to build. And does not include the output required to heat homes for example.
This is all academic. I only brought this up to expose the scale of the problem, so dithering about a few times the numbers is not going to change the premise of my basic argument. Which is we do not have the time, nor the resources to go on a WWII like campaign to build alternatives in an attempt to keep our high consumptive society running as is. That's the point. People bring out these alternatives as though they will save our bacon. They can't. They can't be scaled up in time even if they are scalable.
Now that does not mean we should not build them. I think we should get as many built as possible now, including ethanol and biodiesel plants. The problem is not the technology per se because the technology works. The scale problem is our shere numbers.
Once the crash happens, what ever smaller society emerges will thank us for building all this capacity for them to use and have at least some confort and ability to feed themselves.
That's why I also think we need to build railways, like we used to have them in the early 1900's, and build them damn fast. People in 100 years will need them and quite likely be unable to build them to the scale they need for a very long time. What we do now will shape the course of the next civilization.
It's also one of the reasons why I oppose trying to stop global warming. Money and time that will be wasted that could be used for the above mentioned.
Richard Wakefield
London, Ont.
No one is ahead of their time, just the rest of humanity is slow to catch on.
"People bring out these alternatives as though they will save our bacon. They can't. They can't be scaled up in time even if they are scalable."
Well, that's the basic point in contention here, isn't it?
I've provided a great deal of data to show that wind/solar can scale up, and are on the way to doing so very quickly. Do you have more specific, quantitative info?
Except that efficiency would not include the following:
The cars would have to be heated in winter driving, that will drain the batteries faster.
In the winter we have long nights, so the lights of the car would be on longer, draining the batteries faster.
There will also be loss in the conversion from AC to DC to recharge the batteries. And even new batteries take more energy to charge than they give back.
So even the 4:1 ratio will start to drop, especially in colder climates thus the capacity would need to be there to overcome those losses. Meaning more turbines.
Then there is the issue of storage. On hot muggy days when there is little to no wind for weeks on end, where would the power come from to charge the cars?
I still maintain that these alternatives have severe limitations that the public generally are not told.
The issue is still academic, we wont make it there.
Richard Wakefield
London, Ont.
No one is ahead of their time, just the rest of humanity is slow to catch on.
Oops - I just clobbered a lengthy rebuttal to this. The gist was:
1) Headlights consume about 100W, which represents less than 1% of the power consumption of an EV driving at 60km/h @ 150Wh/km.
2) Heating similarly requires less than 1% (50,000l of air can be heated by 30C using the energy required to drive 1km and a heat pump, and that represents roughly an hour of running the heat vents).
3) Canada's electricity mostly comes from hydro power, meaning it has tons of pumped storage already available, and has no storage concerns.
4) Wind turbines are ~100m tall, and wind is both stronger and more reliable the farther one gets away from the ground. Accordingly, concerns about lack of wind are largely overblown.
Also, battery charging efficiency is already taken into account - that's what "station to wheel" means.
Ok, for the moment, I'll conceed that your numbers are correct, and the US only needs to build 110,000 3MW turbines as someone suggested. So let's see if that is doable. If you could build 3 a day and that's from nothing, then manufacturing the components, transporting, then erecting the turbine and have it fulling functioning in just 3 days, it would still take 100 years to build that 110,000 turbines. Even if we could embark on something like the WWII effort and crank them out as fast as we can, there would be a huge lag time before it could get started. People would have to be trained, factories built to make the turbines and hundreds of cranes built to erect them. There is no way that may turbines can be built even in 20 years. We dont have 20 years!
Thus I maintain that even if it is theoretically possible for an alterntative to be scaled up, it can't be scaled up in time to meet the demand we have now and keep this party going. If we wanted to be serious about alternatives, we should have planned and built them 50 years ago.
But as I did say before, get as many built as we can now, as people generations now will kiss our tombstones that we did.
BTW, Ontario has to import electricity during high demand days from the US because our population is beyond our current production.
And 2, I once took a balloon ride and at 2,000 ft the wind was barely 20km/h and I asked the pilot and he said that is normal. In fact, it dropped to less than 10 at one point and he had to go down near the ground to get it at the 20 again. I've checked the maps of windspeed published for Ontario and it averages 20-22km per hour. On the hot summer days when a high pressure ridge comes through there is virtually no wind at all, even at the tops of turbines, which can last days and even weeks.
Richard Wakefield
London, Ont.
No one is ahead of their time, just the rest of humanity is slow to catch on.
Wind power, grid-installed, is about $1500/kW (nameplate), translating into $4.5M per turbine, or $495B for the set.
The US manufactured $1600B worth of goods last year, or over three times that amount.
I doubt it could be done in a single year, but 3% of manufacturing capacity each year for 10 years is by no means a stretch.
How do you know what the wind is doing 100m up?
Not to mention that turbines get placed in the most favourable areas, since long-distance power transfer is so efficient. I'm really not at all convinced that you're correct in asserting Ontario would see little or no power from wind for weeks on end.
I believe that Nuclear power can be scaled up faster than wind. But wind power is doing quite well and will be significant. Do not use back of the envelop guesses when you can look at actual build rates and actual projects. ie Building 3 a day blah blah. Multiple countries, multiple builders per country working at the same time. Can one builder make 2 million homes in one year ? No, but that was the actual US completion rate because you have a lot of people building homes.
73,904 MW total installations as of 2006
Which is equal to about 25GW of nuclear installation because of operating load.
Germany has over 18,000 turbines with avg size of a little over 1MW. the latest installations are 5MW and 6MW units.
By 2010, the World Wind Energy Association expects 160GW of capacity to be installed worldwide.
The 20GW build rate of the next 4 years would produce 330Gw additional in 15 years. After 2010 the size of new wind turbines will be 7.5-10MW and probably still getting bigger. The kitegen system could radically improve the situation. Winds are stronger and steadier at 800meter and up. Building on mountains and hills would provide access to even stronger and steadier winds.
Wind past and predicted by industry
http://en.wikipedia.org/wiki/Wind_power
MW of installed capacity
                2005   2006   latest
1 Germany      18,415 20,622 21,283
2 Spain        10,028 11,615 12,801
3 United States 9,149 11,603 12,634
4 India         4,430  6,270  7,231
5 Denmark       3,136  3,140
6 China         1,260  2,604  2,956
7 Italy         1,718  2,123
8 United Kingdom 1,332 1,963  2,191
9 Portugal       1,022 1,716  1,874
10 Canada          683 1,459  1,670
11 France          757 1,567
12 Netherlands   1,219 1,560
13 Japan         1,061 1,394
14 Austria         819   965
15 Australia       708   817
=========
http://advancednano.blogspot.com
The US is building about 3.5GW of wind in 2007, and that's about 40% more than 2006.
A 40% rate of manufacturing ramp-up is pretty sustainable for some years. If we kept that going for just 10 years we'd be at about 100GW per year!
Realistically, I think we'll stop at about 25GW per year (which would take about 6 years, at that rate), and maintain that for several years, and then taper off some. Solar will scale up by that time, and start to take over the lead. Nuclear will start growing again in about 10 years.
Logistic functions are often used to model the adoption of new technologies (e.g., link1 , link2), so I took the data on wind power capacity from 1997-2010 and fit it to a logistic (sigmoid) curve that assumed at most 5% of the world's current manufacturing capacity would be devoted to turbines.
A sigmoid turns out to be a very good fit to the data - the predicted capacity additions over that period differ from the input data by only 0.01%. It predicts capacity addition of 61GW in 2015, by which time total installed capacity should be 390GW, or about 10% of world electricity (including capacity factors and consumption growth). At that point the growth rate will have fallen to 16%, from 21%.
Fitting a sigmoid is very robust to changes in the assumed maximum rate. Changing the maximum to 2.5% of manufacturing (125GW) gives a result of 375GW installed in 2015, or 4% lower, whereas changing to 10% of manufacturing (500GW) gives 399GW, or 2% higher. Capping the maximum at 1% of world manufacturing, which is lower than the amount currently devoted to building power generation, results in 334GW installed, or 14% lower. Of these alternative maximums, the 5% maximum gives the lowest fitting error with the input data points (0.011%), 10% gives the next best (0.012%), then 2.5% (0.12%), and 1% (0.84% fitting error).
Based on that, the available data strongly points towards continued rapid growth in wind power under a business-as-usual scenario, with wind reaching 10% of the total installed power base by 2015, and 20% by 2020. Jerome a Paris had an article a while back arguing that electrical grids could take up to 20% of their power from wind with no changes, so beyond that is somewhat more speculative.
For what that's worth.
I consider this to be a fairly realistic model, given the assumption that no massive economic shocks occur, since it's based on fitting a standard model of technology adoption to the real-world data (with enough data points to make a good fit), and the results are very stable to changes in the parameters. Something like this would be an appropriate estimate for models of the future, although it may need to be modified if severe economic dislocation is indicated by the data or (more likely) assumed by the modeller.
The best-fit equation ended up being 250/(1 + e^(0.191524*(2020.883-Y))), which gives the number of GW of nameplate wind capacity added in year Y. e.g., plugging in 2010 for Y gives 27.7GW, as compared to the 28GW added in the original data.
Pitt,
I like your curve fitting and the idea about share of manufacturing capacity as a roof. There's just one detail, which I don't think affects the general argument, but puts things off few years.
390 GW of wind would produce close to 1000 TWh (conservative rule of thumb: multiply wind capacity by 2500 full load hours). World total electricity production was around 17 350 TWh in 2005, so it would be less than 5% of world total when consumption growth is accounted for.
Can you run the calculation again, I'm very interested in the results? I mean when we would get to 10% and 20%. And there's no 20% limit. There's just increasingly more integration costs, which at some point will start to include more intermediate-peak capacity besides costs from operating the power system in more variable mode.
Apparently my estimate of consumption was wrong, then - thanks for the correction.
You can easily calculate the amount of capacity added in any year just by plugging in the year to the above formula, so the amount installed by a certain year is just the sum of years before it. Advancing from 2015 to 2030 gives ~2600GW of installed capacity, which is 6,500 TWh; assuming 2% consumption growth, that'd be about 23%. 10% is hit in 2021, 20% in 2028, 1/3 in 2037, and 50% in 2066.
By then the assumption that at most 250GW is added per year is really a limiting factor. More sensible would be to put the maximum at 5% of current manufacturing capacity, rather than 5% of 2007 capacity, which would lead to faster growth. Slotting that change into the formula above results in 20% by 2024, 1/3 in 2029, and 50% in 2034. That's an estimate, though, since I haven't re-fit the curve (don't have the spreadsheet here).
It might make more sense to fit a curve to the installed capacity rather than to the yearly change of capacity, though, and if I remember I'll do that tomorrow. That would have a very natural maximum for the logistic - the current rate of electricity consumption - and so should give an interesting result.
Another alternative would be to fit a logistic to the proportion results - i.e., what percentage of electricity was generated by wind in that year. That's closer to the "technology adoption rate" paradigm that the references used logistic curves for, so might also be good. Either would be better than what I actually did. Oops.
Doing this yields the following equation for the fraction of electricity generated by solar in a given year: 1/(1+e^(0.17968*(2031.58-year))). I used 2500 hrs/yr to convert between kW and kWh (~28.5% capacity factor), and 3% annual growth in electricity consumption (based on EIA data).
It predicts 10% of electricity generation will be wind-powered between 2019 and 2020, 20% in 2024, 1/3 in 2028, and 50% in 2032.
Capacity added in 2032 is predicted to be 900GW, which would cost ~$1.35T today (~15-20% of current manufacturing). With an estimated 3% annual growth in manufacturing capacity (2/3 of recent GDP growth rate), that would represent 8-10% of manufacturing capacity, which IMHO is probably too much - I think it's about 2-3 times the level of manufacturing currently assigned to building generating capacity. Per EIA data, ~100GW nameplate capacity was added in 2005; at ~$2000/kW, that would be $200B, or 2.7% (based on my estimate of world manufacturing capacity of ~$7.5T), so my personal opinion is we wouldn't see much more than 5% of manufacturing used to build generating capacity in a business-as-usual setting.
Of course, I think it's very unlikely that a model as simple as this one would be at all reliable that far out, or that high into the buildout. A model like this is probably a reasonable indicator of where the trends are pointing maybe 10 years out, provided the current economic environment remains the same (which, of course, it won't).
Fitting a logistic to either the capacity-added-per-year data or the fraction-of-total-generated data gives ~2020 for reaching 10% of overall generating capacity, though, so I'm guessing that's a reasonable estimate, at least based on current trends. That'd represent wind generating ~2,700TWh, which would require (nameplate) capacity of ~1TW, as compared to capacity of 0.16TW in the last year for which we have an official estimate (2010). Doesn't seem unreasonable as a default assumption.
Thanks for trying it another way. My thinking would be to ask would US manufacuring grow substantially through technology export, wind or solar, owing to a favorable climate for industrial growth? If the US is exporting 30 or 50% of its domestic production, the fraction of total manufacturing would not be all that important. We have shifted so much of the economy to service, there is quite a lot of room for industrial growth. Rosie the Riveter is now Irene the Insurance Clerk, but a bit of single payer makes for lots of potential workers and a more competitive stance on exports.
Chris
I think wind industry won't be able to keep up the growth rate that GWEA has predicted up till 2010. After that they can do grow faster again when new factories are scheduled to come online, but until then there are too strict supply chain constraints, especially with bearings and gearboxes. Furthermore, the industry itself would like to take the growth more easy, due to the bad experience with failed gearboxes in the last few years (oh well, the gearboxes might have been ok, but they were put into more rough use they were designed to take). If you grow really fast, then you have more risk if your design has problems. Wind turbine manufacturers would also like to make money in a market that's not getting enough turbines... On the other hand, most of the players don't want to lose market share.
I think that you want to apply the sigmoid to the cumulative installed capacity. Applying it to the annual installation would yield, at the end, a costant rate of rapid addition of capacity. If there is a maximum need for electricity, then we should stop adding more capacity once that is reached. So the values you are fitting (annual additions) should go to zero. From your equation, it looks like it goes to 250. Seems to me you want to fit the time deriviative of your function or else fit to cumulative capacity. Maybe I'm misunderstanding what you did?
Chris
"Don't confuse capacity with actual output of a wind turbine."
I didn't. All of my calculations take "capacity factor" into account.
"The actual physical output is 20% of capacty "
Not in the US. It's pretty much 30%.
"As for turbines replacing gasoline, do it in joules per hour. "
That's not the right way to do it. Gasoline engines are about 15% efficient on average: the average US engine uses 6x as much energy, in joules per kilometer, as does an electric vehicle.
"How many have actually been built in the US so far, I can't seem to find a definative number, "
The US has about 13GW in capacity right now. Many of them are older, smaller turbines, so the number of WT's would be misleading, as no one will install small WT's in a wind farm these days.
OTOH, wind is growing fast. 20% of 2006 new US generation capacity was wind. At this point the US organization of utility System Operators has received interconnection requests for about 120GW of renewables (almost entirely wind). Again, only about 110K WT's, or 330GW of wind would be needed to replace gasoline in the US (3GW wind turbines @30% capacity factor, 210K light vehicles, 12k miles per vehicle, and .35 KWH per mile)....
For some context,that 330GW is 4x as large as the currently-installed amount of wind power (globally) and about 20x as large as the amount added (globally) in 2006, and the typical size of turbines (at least in Germany) is just over 1kW, although models up to at least 5kW exist.
Accordingly, the idea of building that many turbines is not at all ridiculous - indeed, 25% of that capacity is projected to be installed (world-wide) in the next four years alone, even in a business-as-usual setting. Were people to believe that wind power was an economic priority, one would imagine the construction rate would increase substantially.
(As an aside: Nick, do you mean 210M light vehicles? That's the current US fleet, and IMHO would take much longer to replace than the generation capacity needed to power them.)
"the typical size of turbines (at least in Germany) is just over 1kW"
Of new WT's? For new installations I would have expected 1.6MW mostly, with 3MW starting to arrive.
"do you mean 210M light vehicles? "
oops. Yes!
" would take much longer to replace than the generation capacity needed to power them.)"
Well, yes, in their entirety - there's always a long tail. What's really more useful is the median figure: 50% of miles travelled come from vehicles less than 6 years old.
OTOH, yes, I agree, I think the transition to PHEV/EV's is a more difficult problem than the electricity to supply them.
No, no - I'm just dividing the 20,000MW capacity by the 18,000 turbines already installed. You're doubtless right that the newer ones average larger.
Not to mention that 50% of miles travelled are almost certainly unnecessary. At least.
But, yeah - using the US vehicle manufacturing capacity, it'd take only about a year to build the wind turbines necessary to power those 210M EVs, but 10-15 years to build the EVs themselves, so energy availability isn't likely to be the problem.
As I noted in some of the links that I have already provided. The current largest WT that are being installed are 6MW and 5MW (GE makes one of them). 3MW have been installed for a few years.
10MW superconducting prototype should be ready in 30 months.
There is a 7.5MW development based on refinement of current technology.
There are radically different projects like kitegen which could achieve 20 times lower cost, 8 times less land area and 8 times less material. Would tap the 800-1200 meter wind which is about twice as fast and has 4 times the energy content per square meter and is more consistent.
http://en.wikipedia.org/wiki/Wind_power_in_Germany
More than 18,000 wind turbines are located in the German federal area and the country has plans to build more wind turbines. Germany is the world's largest user of wind power with an installed capacity of 20,621 MW in 2006. So the average size is a little over 1 MW.
Germany plans to add 15GW more wind power by 2020.
http://www.ewea.org/index.php?id=60&no_cache=1&tx_ttnews%5Btt_news%5D=42...
=====================
http://advancednano.blogspot.com
Nick,
Just a back o' the envelope calc. The point being that renewables have much lower output than their nameplate ratings suggest, say 25% of possible. Baseload plants like big coal and nukes have outputs approaching 90% of possible.
I think I used 25% for renewables and 80 or 90% for the rest. You are correct that lots of gas-fired generation has lower capacity factors because they are peakers or intermediate loaded.
Yes, the government is throwing lots of money at renewables through tax incentives and sweetheart deals. Developers are responding to the financial incentives. I think it is mostly a waste. In a freer market, very little of it would get built.
"renewables have much lower output than their nameplate ratings suggest, say 25% of possible. Baseload plants like big coal and nukes have outputs approaching 90% of possible."
Yes, but it's not that important. What is important is the $/KWH, E-ROI, and scalability, all of which are just fine for wind, and getting better quickly. FYI, the Nuclear Energy Institute gives 29% for wind, 73% for coal, 90% for nuclear.
"Yes, the government is throwing lots of money at renewables through tax incentives and sweetheart deals. Developers are responding to the financial incentives. I think it is mostly a waste."
Joseph, I understand your enthusiasm for nuclear, but given the latest incentives (and Price-Anderson) for nuclear, isn't that a bit of kettle, pot & black?
"In a freer market, very little of it would get built."
In a truly free market, with carbon priced in, no coal would be built at all. We'd have lots of renewables, and some gas. We'd have no nuclear, unless we decided to continue Price-Anderson. I hate to say that, because I don't want to start an argument, but, really nuclear is dependent on government - maybe PA is a good idea (if you feel nuclear is essential, than PA is necessary to prevent "freezing in the dark"), but you have to acknowledge it's importance.
More importantly, wind is now cheaper than natural gas generation, even without subsidies. That's part of the reason it's exploding.
Its good work and a good model, though I would love to see it as dynamic and be allowed to play with it.
One point, you are making the assumption in the population aspects that there would be even greater differentiation into have and have nots. Much of that comes down to your assumption of 'price'.
First, do you think 'price' will remain the arbiter of distribution?
Second, what is 'price' and 'value' in the world you paint?
Third, do you think those scheduled for 'population reduction' will take the news quietly? What price 'price' as the arbiter?
1. Yes, I think price will stay as the arbiter for much of the energy market, although some parts of it (like the world oil market under the influence of a net export crisis) could move to other mechanisms, such as F-18s and smart bombs.
2. I think "price" comes down in some sense to the reallocation of discretionary consumption as well as a traditional monetary definition. Value is tougher, as it varies from situation to situation. I'd say that the value of a commodity changes depending on how important it is to you, how much or little of it you have, and whether you can pay the "price" as defined above. Take the value of fresh water to a man on foot in the Sahara vs. a man on a canoe in Northern Ontario...
3. Of course those on the pointy end of the stick are going to object violently. I don't think it will make that much difference to the big picture because we don't have the technical means at our disposal to rival the effects of starvation and disease. And that includes thermonuclear weapons. A die-off like the one this model projects could not be accomplished by warfare - we don't have enough bullets. Warfare could trigger social breakdowns that would release the real killers, but I have my doubts whether even that would have a truly global effect.
Consider what might be called the 'non negotiable' model of population and energy development.
As we coast down the slope of oil supply, each country considers it standard of living and growth to be sacrosanct. Those with exports favour internal demand first, and even reduce exports to extend supply. Those with high tech military look to take control of producers. Those with numbers look to take control by medieval means. Others offer protection in exchange for oil. Still others seek other means such as aggressive development of alternatives, or more hidden approaches.
The end result is a swift stage of the game, as alliances form and are destroyed. We've got to assume some supply is destroyed here as well, making things even worse.
A stalemate is reached.
Governments turn inward and seek to reduce unnecessary usage at home - where unnecessary doesn't mean what those here would think. People are confined to their area, usage is cut and redirected. People are regimented.
People revolt, rerunning their own game of non negotiable with similar results. Regions fragment, scale decreases, a stalemate is reached.
At no point has 'price' in conventional sense been an issue. People have reacted to the change in circumstance by redistributing wealth (energy) in disregard to the 'market'. The movement from a high energy intensity to a low one has happened not in a smooth curve, but in a step. With that lower intensity, the future usage is curtailed, timescales lengthened and the opportunity given for something very new to grow.
It comes down to my problem with predictions that inherently expect 'business as usual' in some form or other - when the game changes ALL the rules can change. The least likely outcome is that the situation will stay the same as we know it. Social forces are more important than 'price'.
I agree that all of what you propose will occur in one form or another in one place or another. the problem with trying to make a quantitative projection based on such considerations is that they are all opinions. While they are interesting to read and think about, it's not possible to have any sort of objection based on analysis - objections all become some variation of "I don't f'ing think so!
This time I wanted to have a bit of fun with numbers and see if by using quantitative BAU as the foundation of the projection whether the outcome would pass a qualitative sniff test.
Don't be silly, that's not even true now. Just off the top of my head, Switzerland and Germany have substantial energy-conservation movements that are trying to convince people to adapt their lifestyles to lower levels of consumption. Plus the "buy local food" folks all over the place.
Bush Sr.'s "the American way of life is not negotiable" was in reference to a specific set of negotiations, and is not an overall mantra for the country. Without that level of intransigence, your apocalyptic fantasy falls apart.
Apocolyptic fantasy seems apt. I remember scolding an earlier post on this same kind of modeling. But, let's look at this plot:
We see a doubling behaviour over roughly 10 years between 2000 and 2010 but look at the time it takes to double from 2024: 16 years! If other sources of energy are declining, how can this possibly be right? In fact we are seeing doubling every couple of years in developed economies and this is likely to carry over to developing economies as scale brings prices down further. Renewables in this model never rise above the maximum nuclear capacity but this is clearly wrong because they'll achieve that is under 20 years at the present rate of growth, that is the line should already be off the scale by 2030, and there is little to slow them down until they reach three times that level. The added blue line is slightly less than 30% annual growth.
Remembering that the pyramids were built with somatic energy, and man tend to keep his tools, this study seems rigged to give an unrealistically dismal outlook.
Chris
Interesting the fact that I've posted here a repply that was censored. I imagine people are getting tired of my rants.
A pity.
When people splash nonsense with "gentlemantish" manners they get to have "guest posts", when people call for reason in not so stylish a manner, people are censored in comments.
I guess people enjoy more good-manners than the truth.
I'm this close to call this site a lost-to-cultists site.
I very rarely delete a comment, but you may have noticed there are several of yours missing. Abusive rants will simply not be tolerated. As you have already been warned, but continued to make highly inappropriate comments, and stated your intention to continue doing so, your account has been temporarily blocked.
It's usually unwise to project exponential growth too far into the future, since there's a maximum reasonable rate of construction.
That rate is pretty high, though. The US produced about 11 million cars in 2006, or somewhere in the neighbourhood of $200B of car manufacturing (@ ~$20k ea). Compare that to the roughly $20B spent on adding new electrical generating capacity in the US (@ ~$1500/kW), and it does seem like the manufacturing capacity exists for rapidly adding large amounts of wind power.
Careful - anything that is "clear" is more often a belief than a derived conclusion. In particular, extending current growth trends out 20 years is very speculative.
That being said, I don't see any reason why that level of growth could not happen - the manufacturing capacity is certainly there - so if there's a need for it, it'll likely happen.
I think the numbers of manufactoring that you present are very interesting and pretty much close to what I thought.
I believe the main constraints are political and bureucratic. The countries that resolve themselves faster will have a good advantage.
Yes of course Pitt but don't you see, people don't wish to ride to work on windmills:)
Think about it, they don't even want to wear sensible shoes.And again:)
LOL, but they surely will fight the windmills-:)
I would add that Morgan Stanley is much more in line with the blue line I added to fig. 11 than with the black line. Reading past a typo, they also stick their neck out to predict $1.60/W installed for solar by 2030. At 5 h peak equivilent of sun per day, on a 25 year warranty, that is $0.035/kWh delivered. Much lower than the current price of delivered electricity. If you decide to keep on using the panels for a century instead of a quarter centrury, you can expect 66 years of equivilent new use so your price is $0.013/kWh. The term "too cheap to meter" has been abused but you can surely see why the abuser is demading $25 billion in loan guarantees. They know their new plants will not be competitive and so they want to stick us with the construction cost without producing anything. These are bridge to nowhere projects.
Chris
At 5h/day, each watt will generate 5x365=1.8kWh per year, or 45 kWh over a 25-year lifespan. $1.60 / 45 = $0.035, but that doesn't take into account the cost of financing.
$1.60 now is worth about $11 in 25 years @ 8% rate of return. Using the earned income to reduce the accumulated debt, and assuming that electricity prices rise with inflation (2%), there will be the equivalent of 156kWh of earnings, meaning that each kWh needs to sell for $11 / 156 = $0.070 (in first-year dollars). Taking into account other costs such as grid infrastructure, that's likely to mean electricity prices in the range of $0.11/kWh.
That's still pretty good - the cost to generate is $0.044/kWh in today's dollars (2% inflation, 2030 start), plus grid and other costs. That's pretty competitive with conventional sources, and much better if externalities are considered, but it's not super-cheap. Even extending the lifespan to 100 years pushes the generation cost down only to $0.054/kWh in 2030 dollars.
The situation doesn't change an enormous amount with different rates of return on investment. 7% return only shifts the payback up by one year (@ $0.070/kWh), and 10% return pushes it back a year.
Do you really think people are going to finance $8000 for a 5 kWp system? Maybe, but I'd guess they would lend to themselves our of retirement savings which means they keep the the interest they pay. I'm pretty sure Morgan Stanley is working in today's dollars so you'd want to avoid projecting inflation onto the grid cost. But, I think you also want to compare the cost of delivered electricity rather than wholesale.
I think your point about taking into account the cost of grid infrastructure needs to be thought out fairly carefully. Currently this is done using connection fees; around $8/month for residential self-generators. As the fraction of self-generators moves to 30% the model for this may have to change because the benefits of self-generation in reducing the utilities' need to expand their own peak capacity and trunk transmission probably begin to be saturated at this point. It seems to me that there are a few choices. Self-generators might sweeten the deal by providing utilities access to onsite storage. Self-generators may simply leave the grid by relying on onsite storage. Or, large investments is coast-to-coast very high voltage transmission increase the value of self-generator sources and uitlities make more on sales of self-generator supplied electricity. Increased equatorial utility-scale generation may develop this transmission method along north-south lines by that point so that this will be the most efficient method. KSA is certainly investing in this direction. The big unknown here is the ultimate cost of storage relative to transmission. Very cheap storage eliminates the need for the grid where very cheap available power does not, I think. The latter simply changes the grid arbitrage model.
Chris
But they lose the investment income they would have earned. It works out to be exactly the same thing.
I guess you could count it that way, but then, if solar power beats all other investments why worry? If grid power costs you $0.10/kWh and solar $0.035, your rate of return is pretty high. So, it would be hard to find a foregone investment that compares. I think this kind of dithering applies more to current costs.
Chris
There's a much simpler way to calculate this: just calculate the payment required to pay off a $1.60 loan over 30 years at 8% interest (If you want to assume electrical price inflation of 2%, then I would think the simple approach would be to reduce that by 2%). Now, divide that by the number of kilowatts generated per year (5*365/1,000).
That works out to $.065 per kwh, so that's the cost of your PV electricity.
Now, compare that to the current average retail price of electricity of $.10-11, and it's clear that PV at that price (fully installed) would be a bargain.
In fact, PV below $2.60 a watt would be cheaper than average retail power, and could be expected to explode. Add in peak pricing of $.15/kwh, and the break-even is $3.70, which I believe Mdsolar's has claimed is achievable now.
If it's not now, it's mighty close.
It's simpler, but it doesn't give the same answer.
$1.60 @ 6% interest over 25 years is $6.87. Generated kWh is 1.825 per year, or 45.625 over those 25 years. $6.87/45.625 = $0.15/kWh.
The problem with that approach is it assesses compound interest on the money borrowed, but not on the money earned, so it'll overstate the cost substantially.
Perhaps I'm slow today, because it's not clear to me what you're doing.
Let's say we take out a loan for a kilowatt of PV, for $1,600, to be repaid over 25 years, at 6% interest. The loan payment (principal & interest) will be $125 per year: that's your annual cost. Now, you'll generate 1,825 Kwh's each year. Divide $125 annual cost by 1,825 annual production, and you get cost per KWH of $.069.
Does that make sense to you?
Okay, that makes more sense. It's basically the same as what I was doing, but with everything rolled into a flat loan payment.
Working from first principles, it was easier for me to do it with debits and credits accumulating, but if you have a loan payment calculator, your way's probably easier. Even if there are minor differences, such as from inflation, this is all back-of-the-envelope enough that they're functionally the same.
"if you have a loan payment calculator, your way's probably easier"
I just use a "pmt" spreadsheet formula :)
Hi Nick,
We claim to be profitable at $0.07/kWh, but remember that we are a startup so we could be wrong. It'll be much nicer to have money coming in on systems like that and be able to say that other systems are not subsidizing those. But for that you need a factory which is not built yet. Remember also that solar is subsidized with a 30% federal tax credit and it has accelerated depreciation as well. I think we have to do better than $4/Watt. Franchises will be opening is some markets in Q1 08 and will do some installations using panels from the market rather than from the factory. These will be used to exercise the monitoring software and workflow. They are in markets where some state insentives are available but the approach is cautious because there is concern that we could exhaust those an make things difficult for other installers who depend on them.
When we are talking about $1.60/Watt installed, I just don't see the point of financing over 25 years. Wouldn't you set payments equal to what the grid would cost you and pay it off quicker? I suppose if you bought a home with the equipment in place you might go for 30 years just to avoid the hassle of seperating the thing out but really, we are only talking about the cost of a high end stove and a fridge. I doubt you'd borrow more than three years for these with the first year interest free. I think the comparison with long term financing makes sense when solar is dicey compared to the cost of grid electricity, (can the payments equal the electric bill?) but when it costs no more than a sort of usable used car, why would financing be a big issue? A lot of items like that are bought for cash.
Chris
"When we are talking about $1.60/Watt installed, I just don't see the point of financing over 25 years. "
The use of a loan framework is just for analysis purposes. In order to evaluate the $/KWH (or, indirectly, the $-ROI), you have to set the term of the analysis to equal the life of the investment, in this case the panels.
Now, they will probably last longer than 25 years - I used that because Pitt The Elder used that. I would use 30, as I think that's a good balance between performance deterioration and the overall much longer life of PV.
" I think we have to do better than $4/Watt."
So you expect to beat $4/watt, fully installed?
That is my calculation of what is needed for me to get paid on a $0.07/kWh rate system. The company has stated that each system will be profitable, not aggregates and that is our floor price. The estimated at the gate cost of the panels is $1.53/Watt so you have to do 16% sales, labor, inverters, and franchise overhead with what is left. Inverters should be in good shape because Rob Wills has a lot of experience there. The main trick is getting the labor to flow well. The modular design should help along with labor saving equipment that is hard to justify in lower volume operations. When I estimate all that it looks feasable but very tight. But it is important to make market penetration as broad as possible because reducing the panel cost needs a big factory that runs all the time.
The first installs are not going to make this limit. There will be a high cost for panels and learning curve issues but the initial markets are selected to compensate for this.
Again, I think that the loan framework makes sense when solar is a close call (as here) but once it is a complete nobrainer I think that framework gets in the way of understanding what actually happens. If solar is THE cheapest option, you'll only go with something else if solar is not an option for you.
So, knock on wood. I think this is going to be an interesting ride.
Chris
Sorry, but two things:
1) Don't confuse a green movement for substantial change in energy consumption. If anything it's the mix that's changing, not the level. Also don't forget the gas imports from Russia - turning off that tap would freeze many countries in one winter. In general I think the EU game plan is less confrontational than most, but even so the breaking point is much closer than you seem to assume.
2) You make the mistake of ignoring human nature and assuming people will accept significant decline, even imminent death, with a fatalistic shrug. Its not intransigence, its survival. If they break today to keep their SUVs, or tomorrow to keep their heat, at some point they do break and they do reorientate power structures to a stalemate balance condition.
It's simply not credible to assume oil export X will continue as it has before while oil importer Y collapses and millions die. The pain gets spread around, no fantasy there.
The movements I mentioned were explicitly about reduced consumption.
Even if true - which is doubtful at best - what does that have to do with what I was talking about? Are you suggesting Russia would cut off Europe's gas in the middle of winter, and the Europe would go to war over it?
Why on earth would Russia want to do that? And do you really think Europe would go to war rather than put on sweaters and share apartments? Do you have any evidence to back up your speculations?
Uh, no.
My contention is that people won't go to war over minor shortages - those seen during war-time rationing, for example. By contrast, you seem to be assuming they'll go to war - which entails voluntarily accepting substantial suffering - to avoid any reduction in their lifestyle, no matter how trivial. Choosing great suffering to avoid trivial suffering seems remarkably counter-productive, and I have yet to see any evidence that people would do such a thing in this context.
In other words, I'm not "ignoring" human nature; I just don't think you know what it is.
You're quite right - your assumptions about collapse and dieoff are indeed not credible.
Conservation only goes so far. Just wait and see how the German population likes having the lights go out as their leftist government shuts down all their nuke plants.
Once things become uncomfortable or worse, unlivable, due to conservation and belt tightening, the public will revolt.
Besides the "buy local food" is highly limited. In places where there is only one short growing season the population is supported only by massive importation of food from tropical regions. Places like Southern Ontario, where I live, simply cannot grow enough food in the summer to support the current population here. Nor would the population take too kindly to eating only stored and preserved foods for 10 months of the year.
Richard
London, Ont.
No one is ahead of their time, just the rest of humanity is slow to catch on.
First off, thank you for this painful and unvarnished look at our current trends. You're putting yourself out there for some cheap shots by making huge extrapolations about renewables, etc., but somebody has to get the SWAG ball rolling.
For me, this is the story:
"The net oil export crisis may well be the defining geopolitical event of the next decade."
We should hope with all our might that this statement is true, because otherwise it means that some even more apocalyptic event has shoved PO off center stage.
Two points:
Warfare can most certainly kill off people by the billions, if need be. The tools are pneumonic Plague and pulmonary anthrax. It hasn't been necessary in recent wars, so the toll on the IP's (indigenous population) has been declining since the Thirty Years' War. But when food and water become more dear than slave labor, the function and purpose of warfare can swing back overnight.
And I don't want to quibble about such a large-grain view of energy, but where is (nonrenewable) biomass? Doesn't much of the dollar-a-day world depend on hand-gathered brush for cooking and heat? Surely that resource must have already peaked in India, for example.
On future food
http://advancednano.blogspot.com/2007/07/aquaculture-meat-factories-and-...
Aquaculture - fish farms are already huge.
High rise greenhouses/urban aeroponics
Roughly 150 such thirty story buildings, Despommier estimates, could feed the entire city of New York for a year.
The promoters of vertical farming were noting that there were enough abandoned buildings which could be converted to the purpose of food supply.
http://www.msnbc.msn.com/id/21154137/
Cloned meat would guarantee the copying of the highest productivity animals. Those that are most efficient at turning feed into meat or milk
Stem cell meat factories, Cultured meat isn't natural, but neither is yogurt
http://advancednano.blogspot.com/2006/06/other-tech-test-tube-meat-event...
==========
http://advancednano.blogspot.com
GliderGuider, I hate to keep getting Medieval on you, but I wanted to comment on
"A die-off like the one this model projects could not be accomplished by warfare - we don't have enough bullets."
At the battle of Marignano on Sept 12, 1515, 18,000 men, mostly Swiss pikemen, were killed in a single day by crushing and cutting weapons. My point is, while disease will kill more humans, a lack of bullets won't slow some traditionsl techniques for population control.
PLAN, PLANt, PLANet
Errol in Miami
In Rwanda 800,000 were killed in 100 days with machetes. Warfare is a lousy tool for reducing population directly, though. Just to bring our net birth rate of 75,000,000 per year down to zero through warfare would require 100 Rwanda-equivalents per year. And that would just stabilize the population.
The real population-reducing effects of a modern non-biological war would come from the disruption of electrical supplies and food distribution networks. This could be done through hitting transportation nexuses and electrical distribution points.
Of course as others have pointed out, if you really want to reduce population through warfare you go biological.
Are you proposing to do such a thing?
Did this happened during the Great Depression?
Where are your sources on this?
Past references? (spare me on Rome)
...
Exactly.
"we don't have enough bullets"
Yep. The average number of bullets for a single kill in most modern warfare is somwhere around 40,000. That's 40,000 rounds fired to get one kill. We need less Miniguns, not more.
Richard
London, Ont.
No one is ahead of their time, just the rest of humanity is slow to catch on.
With the prospect of 150 million deaths per year can anyone seriously believe that taking up arms will be overlooked? That is only one of the motives for war like human behavior that this article illuminates.
First thought: I'm glad I don't have kids. At least I don't need to worry about what they would have had to go through. Furthermore, I feel that I am at least a little less to blame for causing this horrific mess.
Second thought, and a selfish one, please forgive me: I'm glad that I'm looking at a remaining lifespan of only 2-3 decades at most. It looks like I'll be gone before I see the worst of it.
Third thought: With regards to renewables (and I would include hydro with those), given the dire prospects we are facing, rather than just projecting the trend lines forward, wouldn't a better approach be to determine what is the maximum possible level we might have any reasonable hope at all of reaching, and work backwards from there? I am certain that we are not going to be able to replace fossil fuels on a 1:1 basis, but neither do I believe that it is necessary to do so. Cut out all of the waste and junk that we can do without, and get more efficient with what we absolutely still need, and the amount of activity that needs to be supplied with energy drops to a fraction of present levels - a fraction that we might feasibly be able to supply with renewables. While it is important "reality therapy" to confront people with the stark future that we may be facing, it is also important to show what positive actions are within the realm of possibility.
Fourth thought: The only problem I have with the population modeling is that human beings - both individually and collectively - have a way of behaving in unpredictable ways that cannot be modeled. For example, what model in the 1950s or even mid 1960s could have anticipated China's one-child policy? Can we be sure that similar policies will not be adopted by other nations in the future? Furthermore, given the amount of wastefulness inherent in our energy use (not just in terms of inefficiency, but also in terms of use for things that do nothing needful for the support of human life), I would not be so sure that a decline in energy supply will inevitably translate into an immediate and proportionate population decline.
Ultimately, humankind must adapt to a sustainable economy. It is quite doubtful that a sustainable economy can support a population of 6 billion, 7 billion, or more. We will most likely have to transition down to a lower population level. I don't pretend to know how low that ultimate population level will be, or how long it will take to get there. It may still be just possible to make the decline a little slower and a little less drastic.
Regarding the modeling of renewables, I started out using the approach you suggest for both hydro and other renewables, but I was uncomfortable with how indefensible that approach was. It starts from an opinion, and works backward through more opinion. I felt that there was enough opinion in the piece already, and I wanted to use a quantifiable basis for projection wherever I could. Besides, I was seduced by those nice tight R-squared values...
Ultimately, neither approach changed the outcome by much.
In other words, "why assume 'business as usual' for renewables, even in the face of massive crisis?"
There seemed to be no effort to replace lost energy in the model, like it was about a hypothetical humanity that didn't even care whether it lived or died. Without explicitly considering replacements and other mitigation efforts, the model's results can't be taken as at all realistic.
A similar study was posted in September at Energy Bulletin and The Oil Drum:
Global peak energy:
Implications for future human populations
by Chris Clugston
The conclusions appear to be similar:
...The maximum supportable worldwide human population level will peak between the years 2025 and 2030 as well, and decline continuously thereafter—assuming the continuation following global peak energy of the historic relationship between the total amount of energy consumed by human populations and corresponding population levels and material living standards.
Energy Bulletin / The Oil Drum
The discussion that followed at The Oil Drum is probably relevant to this paper as well.
Bart
Energy Bulletin
Yes, Chris and I have exchanged emails. There have been a few TOD articles on this theme over the last year.
GliderGuider -
I was struck by how closely your peak dates match - similar assumptions?
It might be useful to add links to other similar studies. One study is easily dismissed; multiple studies pointing in the same direction are not.
Bart / EB
Nuclear energy
You do not take into account powerplant operating extensions, power uprating and looking at the historical build rate which peaked in the USA at 12 reactors in one year in 1972. Worldwide the number of nuclear plants completing previously peaked at 24 in one year.
In the USA nearly 50 reactors have been granted licence renewals which extend their operating lives from the original 40 out to 60 years, and operators of most others are expected to apply for similar extensions. In Japan, plant lifetimes up to 70 years re envisaged.
Worldwide 8-10 reactors will be completed in 2010-2013. The rate of completion is increasing. New reactors are increasing in size to 1.3-1.6 gigawatts each.
Power uprating up to 20% of existing rated power is standard. There is technology from MIT (donut shaped fuel, nanoparticle additives to the water) which can allow 50% power uprate to existing and new reactors.
The current orders have not fully considered new climate change bills like the one before congress which will increase the cost of coal plants. The EIA projects that nuclear and renewables could triple by 2030 in the USA with the adoption of one of the climate bills. You use EIA data so why not the EIA study ?
http://www.eia.doe.gov/oiaf/servicerpt/csia/index.html
Latest on climate change bill in the USA
http://advancednano.blogspot.com/2007/09/coal-compared-to-green-measures...
The EIA projection analysis of the McCain/Lieberman bill which is similar to the Lieberman/WArner bill which is the current reference bill
http://advancednano.blogspot.com/2007/08/more-on-mccainlieberman-climate...
Why are you looking at made up guesses when you can look at actual projects.
The global nuclear reactors that are expected to be completed by 2013 have names, locations and are being worked on right now.
http://www.uic.com.au/nip19.htm
Power uprating for the US nuclear power plants over the next 5 years have reactor names, percentage amounts. The Completion of Watts Bar 2 is on a 5 year timeline.
The information hydro work in China is known by location and amounts.
========================
http://advancednano.blogspot.com
One thing I did factor in (but didn't mention in the article) is rolling 10-year life extensions for ten percent of the installed reactor base.
I'll look at adding in power uprating, thanks.
As I indicated 50% and increasing with extensions to 60 years already.
http://www.uic.com.au/reactors.htm
The EIA projection for the McCain/Lieberman bill (a climate bill is pretty much a slam dunk by 2009)
http://www.eia.doe.gov/oiaf/servicerpt/csia/execsummary.html
Projections for 2020 and 2030.
On the renewables side
Kitegen project, up to 5 gigawatt wind generators, order of magnitude lower cost and land usage and 8 times less material (concrete, steel)
http://advancednano.blogspot.com/2007/10/kitegen-follow-up.html
10 MW superconducting wind generator (30 month project) Largest existing generators are 6MW.
http://advancednano.blogspot.com/2007/10/american-superconductor-develop...
================
http://advancednano.blogspot.com
So with extensions to 60 years and 70 years for most reactors. Then only 10% of the reactors which are smaller and inefficient nuclear reactors get decommissioned. The reduction in capacity is offset by power uprating. Then the new plants add to the capacity. So there is no dropoff in nuclear generation and with climate change bills the growth in nuclear and renewable power accelerates.
Up to 3700 billion kwh (nuclear and renewable in the EIA projection, S280 no international) for 2030 out of a total of 5300 billion kwh.
The uranium reactor component production is being increased. Areva and others are setting up other suppliers for reactor vessels.
100% funding of loan guarantees up 80% of any carbon reducing power source (nuclear and renewables)
http://advancednano.blogspot.com/2007/10/pro-nuclear-ruling-in-usa.html
thermoelectronics could increase overall efficiency
http://advancednano.blogspot.com/2007/10/thermoelectronics-for-cars-truc...
Massive adoption of electric bikes and scooters in Asia will reduce demand for cars while maintaining efficient mobility especially with folding bikes combined with transit
http://advancednano.blogspot.com/2007/08/clean-vehicles-in-india-and-chi...
Constructing a lot of nuclear power plants is not constrained by material
http://advancednano.blogspot.com/2007/07/constructing-lot-of-nuclear-pow...
=================
http://advancednano.blogspot.com
advancednano, thank you for quantifying everything. My intuition is that these numbers are correct. I'll spend some time verifying them.
GilderGuider, while your projections for Oil and Natural Gas, are likely correct, I'm by no means convinced your projections for Nuclear and Rewnewables are right.
There are a variety of advanced solar projects that could maintain the 50% year-on-year growth we've seen in solar until the penetration rate gets to 10% at least.
Political opposition to nuclear is limited to Western Economies that have other alternatives and if these don't pan out, nuclear will be (re)developed there.
For example, France will maintain it's nuclear investment. If Germany finds itself with blackouts in 2020, the people there will either build nuclear (or reopen their prematurely closed ones) or migrate to France.
I think the predominance of political opposition to nuclear power in the West will turn around before 2010. All the momentum that advancednano has documented is building before there is a widespread understanding that we are peaking in all fossil fuels. All the Republican presidential candidates in the US are now for a significant nuclear buildup.
Once the majority of people in the west really appreciate the crisis we are facing, they will favor massive building of all sources that can really address the problem, well beyond the most aggressive cases documented above. Today this means nuclear, wind and solar. I do recognize that there will still be vociferous opponents.
Or just buy from France, like Italy is doing.
--
Just remember the Golden Years, all you at the top!
advancednano,
Sure, FPL has started the application process to add two more reactors at Turkey Point in Southeast Florida, so I'm sure it's now on the happy-face list.
Turkey Point is sited to use seawater cooling. A 5 meter rise in sea level will put it under water. I wonder who the hell is gonna decomission that hot piece of $#it when the ecomony is rapidly contracting and waves are battering the containment building. There is s cold hand on my heart, accompanied by a feeling that part of the human legacy will be a bunch of nuclear plants being knocked apart by waves and earthquakes while being scavenged for metals by descendents who don't even know what the hell it is (was).
Whom the Gods would destroy, they first make insane.
PLAN, PLANt, PLANet
Errol in Miami
I'm not anti-nuke, but I am anti-poorly-sited nuke.
We need to have a tougher set of siting criteria before we get going on this ramp-up of nuclear capacity that everyone knows is inevitable. For a start, I would suggest at a minimum:
Rule 1: Just because a utility wants a nuke doesn't mean it automatically gets one within its service area. It only gets one within its service area if there is an acceptable site within its service area.
Rule 2: All new nukes must be built far enough away from active fault lines, volcanoes, coastlines, and other hazard areas to assure that they will not be damaged by any natural disasters. Distance from coastlines will be calculated in terms of worst case global warming sea level rise projections, plus an allowance of at least an extra 100-250 ft in elevation to allow for storm surges and tsunamis.
Rule 3: All new nukes will be built well DOWNWIND and DOWNRIVER of any major population center.
Rule 4: No nuke will be built at a location that is too close to a natural "bottleneck" for land or maritime transport.
Rule 5: No nuke will be built at a location that puts its water supply needs in excessive competition with the water supply needs of area agriculture, industry and residential populations.
To build ANY nukes in locations that violate one or more of the above criteria is shear insanity. There must be plenty of potential sites that DO meet the above requirements, so there is no excuse to not limit new nukes to those locations only.
I would propose two refinements to your model.
First, most nuclear capacity has a 60 year useful life and maybe longer. Small prototype plants (say, 60 MWe) have been shut as uneconomical but commercial, full sized plants routinely have their initial 40 year licenses extended to 60 years. New plants are being designed and licensed for 60 years. We might even do better given the motivation.
This won't change the conclusions, just mitigate them a tad.
I'd also appreciate an idea of what ramp-up rate for nuclear would really make a difference. From that, I could estimate the resource requirements to support it.
My second point is that alternatives to oil exist as described in the SAIC report we all were discussion a couple of years ago. I did some rough estimates that suggested we could stabilize oil production with a 4% field depletion rate by investing at about double the rate of current global E&P efforts. That would require maybe $500 billion a year on SAIC's alternatives.
Of course, I will continue to argue that almost all alternative "renewable" energy sources are closer to energy sinks than real productive assets.
"just mitigate them a tad."
On the other hand, I think it is reasonable to suppose that operating licenses on all major nuclear power plants will, after a great deal of hand wringing, be extended and re-extended until after the great collapse. The effect of regulatory relief to distressed electrical generator companies will be the aggrevate the problem.
http://www.reuters.com/article/politicsNews/idUSSHA31210120071016
Uranium prices
http://www.uxc.com/review/uxc_Prices.aspx
http://www.iht.com/articles/2007/03/28/business/uranium.php
Looking out to 2100
4 billion tons of Uranium in seawater. 1 kilogram from a japanese trial collected.
http://jolisfukyu.tokai-sc.jaea.go.jp/fukyu/mirai-en/4_5.html
Out to 2100 look for complete burn through plants, increase usage from 0.5-2% of fuel to 100%. Molten salt reactors etc...
http://www.google.com/search?q=uranium+seawater+japan&sourceid=ie7&rls=c...
==============
http://advancednano.blogspot.com
Very impressive contributions to the debate.
Glider:
Please clarify your reasoning on the population in 2100. I see how you estimate the carrying capacity of Earth to be 40% less than what it would have been had there not been an overshoot. But where do you get a defensible number for the unperturbed carrying capacity? You seem to equate it to the population that would have existed in 2100 had there been no perturbation. Why? Or is there another reason?
www.census.gov/ipc/www/worldhis.html contains a useful table of historical estimates of total world population. Linear interpolation in this table indicates that world population was 1 billion around 1830. How this relates to the current situation is not clear. Surely advances in human knowledge would justify estimating the carrying capacity as vastly greater than the actual population in 1830.
Or maybe use for comparison, 1915 when world population was ~1.8 billion (equivalent to unperturbed estimate for year 2100). Based on reasoning in your presentation, could one reasonably suppose that, after an undershoot to 1billion, world population might stablize at around 1.8billion as the ecological damage heals?
The population baseline shown in Figure 14 is comes from a simple division of the total energy available over time by a SWAG of the average per-capita energy consumption at that time. The 2100 value for p-c consumption is 1.0 toe/yr.
The growth in human knowledge would enable a larger population, but the underlying ecological damage would more than counterbalance that, IMO.
Regarding the healing of that ecological damage, how long might it take for the oceans to repopulate, extinct species to reappear, topsoil to regain its lost fertility, the aquifers to refill, the glaciers and icecaps to re-form and the global temperature to drop enough to alleviate the droughts and flooding? That's a forlorn hope in any realistic time frame, I'm afraid.
I've been here at TOD for quite some time, but believe me when I say this, I've never seen such big BULLSHIT sprayed so thin in here for so many words such as in this "essay".
Spare me with this Die-Off rethoric A L R E A D Y ! !
It's a bit late in here, so I'll have to postpone my pick on pick analysis, but it won't be polite.
Like some scientists would like to say:
It's not even wrong.
One of the reasons I tried to lay out my assumptions as clearly as I could was to give those with differing views an opportunity for substantive and reasoned rebuttal. I'll look forward to reading your detailed commentary.
A reasoned rebuttal would require a reasoned post. As this one is absurd, you should allow others to respond in a manner befitting the post instead of deleting comments.
If the situation is hopeless as you portray, then why bother to write about it? If you really believed what you wrote, then you wouldn't even bother to write it.
Maybe you would stand by and do nothing while the world fell apart around you, but luckily, there are many people who won't. Once you understand this, you will understand why your post is worthless.
GliderGuider didn't delete your previous comment - I did, as Editor, because it fell well below the acceptable standard of discourse for this site. Please comment in a respectful manner.
Writers who point out that we are facing very significant challenges in this century are not cheerleading for the downfall of humanity, nor wallowing in hopelessness.
Sensibleenergy, I suspect if anyone is standing around doing nothing about the situation it is people like you. How does cheerleading about possible technical fixes help solve the problem unless you yourself is in active research? Even if you did want to actively help humanity how would you do it? Become politically active? That sure works in a society where a person such as Bush gets elected, fundamentalist senators thrive, and even mainstream candidates cannot openly talk about our future problems without fear of becoming unelectable because the “marching morons“ cannot comprehend the message and want to hear good news. Is it any wonder the founders of the US had a great fear of the “masses”? Better read your history and discover the iron fisted tyrant is not an anomaly; in fact peaceful functioning democracies are much more rare. It is trying times such as the ones we will see that will make these tyrant monsters more commonplace. What is ironic is that it is the doomers that are making preparations, albeit for themselves and not for the benefit of others who would derail their preparations or make them extremely difficult. So go ahead, shout your “solutions” on this board and others hoping that the deaf ears of most society will hear them, enact them, and stop their wasteful ways; I’ll just continue farming my land with organic methods and low usage energy and just maybe be able to preserve something worth saving the parts of humanity that haven’t caused this problem in the first place.
I don't think I cheerled any technical fixes. I don't have any vested interest in any energy source, although I do help provide one. Yes those of us who actually provide energy will continue to do so. But providing energy won't fix the problem, will it? Because energy is the problem, right? People using energy, lots of people using lots energy. Oh the horror.
Hi SensibleEnergy,
I'm having a problem understanding you. Do you accept no limit to the production and use of energy?
Of course there are limits, but we are nowhere near them. It is an easy exercise to show this. It has been done repeatedly on this site, but everyday the doomers pretend like they have never seen it before. While the doomers believe that the worlds population needs to fall drastically to have enough energy, I believe that the world needs lots of energy to become stable. By lots, I mean about half the American per capita energy usage for the entire world. I agree with a lot of the solutions proposed on this site, but this doomer post is absurd.
Hi again,
In about a hundred years we have used resources like there was no tomorrow. Many of our mineral resources (see current article on TOD) are peaking, our forests destroyed and it looks like if we want to eat fish in the future we'd better can some now. Our agricultural base has been badly eroded and we have been fighting over the remaining oil. All more energy will do in the quantities you suggest is to continue as we have been doing. I do not think that 'doomers' think in terms of: the population needs to fall, merely that it will fall. The world has an economy of its own and looking at the world I think we have reached its limit.
What I think you and I should be doing is to move ourselves and those about us to a lower energy lifestyle now, in order to preserve our resources for current and future generations . I think there will be a future if we do not use everything up now in one big glorious party. We have a fire burning up our resources and throwing gasoline on it will not help. That's my opinion, maybe somewhere in between yours and mine we will be both right, eh?:)
"Many of our mineral resources (see current article on TOD) are peaking,"
Actually, if you read the comments, it becomes clear that almost all of them, like mercury & lead, peaked because better substitutes became available.
Okay, will do, blame it on paper conservation, I just copy the articles to read at night. Can I amend that, for the moment to 'one day all that stuff will run out due to problems at the pump'?. Meantime I think I am on fairly Solid Ground with the fishes:)
" I think I am on fairly Solid Ground with the fishes:)"
Yes, I think so, especially because of acidification of the oceans. Loss of food from the ocean will be a big problem.
OTOH, can't we reduce our need for "primary" food production by about 90% just by becoming vegetarian and swearing off various cash crops like tobacco, coffee, coca...?
Hi Nick it looks like that 'discussion' comments of yours and mine have gone missing but I thought I would get back to you anyway to say that I found a couple of population figures.
Bombay runs about 20.1 births per thousand while the country as a whole is 22.69 per thousand. I couldn't find anything that would separate the urban from countryside.
This would indicate to me that it is not even prosperity but a need for security that could be the prime driving factor in population decrease.
_____________
Stoneleigh if you have deleted comments between Nick and me, would you let mew know the reason, if not then I guess it was a glitch in the system? Thank you.
hhmmm.
Well, urban areas in India are more prosperous than the countryside.
You may be right but here is something on Bombay (Mumbai) and if this is prosperous I would hate to see the countryside. I would imagine that the countryside is where lot of Bombay hailed from?
http://www.megacitiesproject.org/network_mumbai.asp
I think that while Socialism a la the Soviet union has come undone or failed as some would say, it was our last best chance. It failed not only from within but largely because it was feared by way of its ideas of the communal rights trumping individual rights and so was fought by the capitalist west from it's inception, well before Stalin and his lot.
It also was handicapped by its losses during WWII of 20 million citizens as well as much infrastructural loss. Its major antagonist the USA came away relatively unscathed and richer for that war experience. Oops sorry Nick got sort of carried away there, but I guess you get my drift? That if we look after each other and share the food pot it might be possible to reduce the population? Violins enter, choir sings ..."to dream the impossible dream...."
"An estimated 55% of the city population live in slums"
My understanding is that about 25% of the population of india are considered middle class or better. The rest are living pretty hard lives...
.
Bombay's slums are pretty notorious, even among Indians. By contrast, consider Madras:
"The city has the fourth highest population of slum dwellers among major cities in India, with about 820,000 people (18.6% of its population) living in slum conditions."
i.e., a city with pretty bad slums has a proportion only 1/3 as high as Bombay. The article indicates that the total slum population of India is ~16M, meaning Bombay - where about 40% of India's slum-dwellers live - isn't a representative example.
If the entire world used half the American per capita uses then the population would continue to climb. The whole point of the orginal article is that the planet is over populated now, not ten or even twenty years from now. It's over populated now and the only thing keeping us afloat is the energy and resources we consume at an ever increasing rate.
To claim that there is no problem now, and that we can just keep finding and refining energy usage to more people, begs the most important question of all. How far up does the population have to go before you agree we are now over populated? 9Billion? 12Billion? 24Billion? In 100 years it could very well be 24billion.
Those of us "doomers" as you call us, see that the current trend is unsustainable, let alone having more in the future. Because we see the other issues, not just energy, that have a hatchet over our heads. Soil depletion, fresh water deplesion, deforestation, depletion of the fish stocks, unsustainable debt economics, and for those who want to include it, climate change.
What is coming is the "perfect storm" scenario when a bunch of problems come together to magnify themselves to the breaking point. As many have noted, all species go through this over shoot. But what has not been explained is how that often gets triggered. In most biological systems the population can take some of the environmental changes for some time. Bend with the wind as it were. But at some point, there is a breaking point where the population crashes, often hard to a very small number of remaining individuals (when speciation happens). The biological term for this is Punctuated Equilibrium.
We will follow the same path. We will soon be hit with some trigger that will start the punctuated event. One scenario I see is a very prolonged cold winter and part way through natural gas supply runs low. This would freeze tens of millions. The economy would collapse without natural gas. Each winter so far have been warm enough to stave off such depletions, but from what I've read we've come close a couple times.
So you can continue to deny and take a wait and see, or we can participate in some form of either personal action, or trying to get a national action program going.
I fully agree with Darwinian. The worst thing that could happen, in the long run, is no peak oil.
Richard Wakefield
London, Ont.
No one is ahead of their time, just the rest of humanity is slow to catch on.
All serious population projections (e.g., UN, US Census) predict that the population will level off at around 9B sometime this century, and then will decline gradually from that level.
So, basically, your fundamental assumption here is wrong.
"see that the current trend is unsustainable"
I think most trends are. Saying a trend is unsustainable is not the same as saying that the current system is unsustainable. There are two kinds of inifinity
You can continue a series as long as you like.
or
You must continue the series forever.
Whenever doomers talk about trends they invoke the second kind.
So what do you see as the limiting factor that would prevent a population of 9 billion using 1/2 American per capita energy use ?
That's unfair. Even though I disagree with almost all of his assumptions and conclusions, his article was reasoned. It's much more useful to calmly point out the flaws in it than to be insulting.
21 weeks is not all that long.
YNTFABOSAWYMO..get it?
In 2006, the US produced 53% as much oil as at its all-time peak in 1970, and in 2007 is running 15m bbl ahead of its 2006 production through July, so I don't see how you're saying it's lost 2/3 of its production capacity.
Also, that decline rate - 47% over 35 years - is 1.8%, not 3%.
It's possible you're referring to the lower 48 states of the US rather than the US as a whole, but then that should be stated clearly.
As shown in the example of China - which consumed 0.75toe per capita in 2001 - the claims of 15th-century agriculturalists using 0.75toe are either dubious or not comparable.
Even in 2001, China was an industrial powerhouse, with a burgeoning high-tech industry and hundreds of millions of relatively-affluent urban residents. While one certainly can't discount the hundreds of millions of poor farmers, China in 2001 is an existence proof that the level of energy consumption cited for "agricultural man" is enough for modern industry.
So, in particular, there's no indication that energy consumption below 1.0toe will lead to the massive dieoff you predict. Chad, for example, has consumed only 0.01toe per person for the last 12 years, but has seen its population increase by 50% in that time. Accordingly, it is a known fact that large populations can survive on vastly lower energy consumption levels than 1.0toe.
Your first link on topsoil depletion claims this, but USDA data shows that per-hectare farm output in the US has been steadily increasing, and climbed about 30% in the 15 years leading up to 2004.
Neither of your topsoil links are good about citing sources for their claims, and some of their claims contradict available evidence; accordingly, they're not reliable sources. The sole source for your second link, though - http://home.alltel.net/bsundquist1/se0.html - does provide a substantial number of references, and would be a much more reasonable source to cite.
If you start with the belief that modern civilization is inherently destructive, of course you're going to get the conclusion that it's doomed. It won't be a very useful reasoning process to anyone who doesn't share your initial assumptions, though.
No, we're staring at the results of your personal assumptions.
If they're not correct - and I haven't found your arguments convincing that they are, given your under-counting of non-thermal energy sources (10toe of electricity = ~25toe of coal), your drastic over-estimate of the energy needed to survive (75x more for 15th-century men than Chadians?), your reliance on pessimistic sources with dubious credentials (e.g., the previously-discussed coal report), and your model's apparent lack of any serious effort by humanity to replace its dwindling energy supply with alternative sources such as nuclear/wind/solar/conservation - then all of your conclusions fall away.
That doesn't mean life will be all happy roses forever, of course, but it does mean your massive dieoff is unlikely to come to pass.
Pitt, I thank you sincerely for your comments. And I'm sure Roger Connor does too :) Please keep up the good work!
Regarding Chad:
Where do you get the 0.01 TOE energy number from?
WIKI facts:
Population is 10 million, only 2% have access to electricity, only 45% have access to safe potable water, most are subsistance farmers that are being affected by the persistant droughts (look at Lake Chad's size decreasing by over 70%) and the main energy for most of the population is from wood and dung, and nearly all of the oil that is produced is exported. Without imports of food, would the ten million population be reached in 2005? Probably not.
Note average lifespan is 47 years in Chad, the fifth poorest country in the world.
Mark in St Louis, USA
EIA per capita energy consumption data. Their per capita table is in million btu, so divide by 40 to get toe.
Food imports provide 4% of food consumption in Chad.
I'm not saying it's a fun place to live; I'm saying that they're alive, notwithstanding their consumption of 50-100 times less energy than that assumed for a 15th-century European agricultural man.
Accordingly, I'm saying that the minimum energy required to support large populations is much smaller than has been assumed. Heck, India consumes less than half as much energy per capita as that theoretical "agricultural man", but it supports a powerful high-tech and manufacturing industry, complete with a space program.
I don't know where these numbers come from, but this is plain utterly silly.
What did the French peasant in 1450 do with all that energy?
The article you're commenting on right now.
My question exactly.
The only thing I can imagine is the fact that France/Europe is in what we call a "temperate" zone - meaning it can get very cold there. Someone living in France needs much more energy to live than someone in Chad.
Middle Europeans used horses to pull heavy deap plows. (2x more efficient than the ox.) Horses were fed Oats (biofuels!-). Plows needed the smith. Every village had a smith (input = wood) AND a mill (usually water/hydro, but also wind). European agriculture was *very* energy intense.
Sorry, don't have the numbers to support this.
Hello,
I am normally respectful of my Elders. Mr Pitt, I am sure many would agree, is quite the learned person. However when he types
"If you start with the belief that modern civilization is inherently destructive,of course you're going to get the conclusion that it's doomed."
Are you for real? Have you just arrived from a Galaxy far far away? All your bluster and ridicule of this mans work. Please, oh Please, could you post one of your seminal works? Or are ridicule and pettiness your forte? From much of what I have read I expect so.
f3
"If you start with the belief that modern civilization is inherently destructive,of course you're going to get the conclusion that it's doomed."
Is this statement wrong? Conclusions usually follow one's givens. Wrong givens, wrong conclusion. Implied in Pit's statement is that he does not see modern civilization as inherently destructive.
Do YOU?
Cheers, Dom
I'm looking for wriggle room that might allow for a slightly less drastic die off. What fraction of your renewables estimate is due to biomass? It seems to me that this energy source has two features:
1. it is not necessarily dependent on high level technology.
2. it has the possibility of actually mitigating global warming (without demanding high technology)
But honestly, I can't see how these two effects really change things much.
Also, what is 'SWAG'? (used in your response to my earlier post)
I think we will use a whole lot of biomass. As in, "Cut down every tree in sight and burn it." That may mitigate one problem, but creates a host of others. Similar considerations apply to using purpose-grown biomass. That amounts to mining the soil for energy, and eventually entropy bites you in the ass. Terra preta is a great idea for carbon sequestration, but using biomass for fuel strikes me as being an EROEI and ecological loser from the git-go.
SWAG is a "Scientific Wild-Ass Guess".
"Cut down every tree in sight and burn it."
This is what happened on Easter Island according to Diamond in a recent article in Science. But I was thinking of the possibility of a more rational and measured response, like maybe creating more pasture land and growing horses and oxen, etc. And then thinking about how much good effect each plausible response might have.
The broad outline of your argument seems surely correct. Carrying capacity is a valid ecological concept. Applied to homo s., it surely implies a world population less that the current 6.6 billion and more than world population that existed some time in the distant historical past. So we are currently in a state of overshoot.
This unproven assertion is repeated in doomer die off threads more often than I can count. Its total garbage.
OK, I haven't proven it. Its just a guess that I thought might further the discussion. I was trying to get at some discussion of what might be the effect of changes in the input numbers to the model. Glider argues for 1 billion. I think some of his reasoning about renewables might be improved upon. Renewables is small enough in his estimation that getting it lower hardly matters to the conclusion. Only if its larger will the conclusions change.
Of course if you can develop a good argument that carrying capacity is really greater than, say, 60 billion, well more power to you! That would really change the outlook for the future! But remember, we're talking about carrying capacity after the oil is pretty much gone.
There's no reason to assume nuclear power alone can't be expanded to meet the energy demand of all of industrial civilization for the next several millinea. The only reason to assume it wont is because something (wind, solar, fusion, whatever) will do it better.
This has been explored in several essays, notably "How many people can the earth support." by Joel Cohen. The question has different answers depending on the choices you make and the technology avaliable. I would assume that the population supportable by subsistance farming is at the very least 2 billion, given that's what it approached in 1900 before mechanization of the global crop farming. With high technology climate controlled hydroponic greenhouses you could easily support hundreds of billions of vegetarians. The notion that we're periliously close to collapse is ever popular but not particularly likely in my view and we have no reason to believe it. That its taken as a forgone conclusion as a premise in an argument speaks a little about the credibility of such arguments.
Dezakin,
The agricultural technology in the US in 1900 was not sustainable long-term:
Whale oil, which had already peaked and crashed, was replaced by petroleum, which will....
A huge amount of steel (produced with coal and high-grade ore) was already in use for horse-drawn rakes and harvestors, coal-powered trains and rails, and steam tractors
Yields were already being goosed by guano (thousands of years accumulation run through in a century) and potash (from burning off Northeastern forests)
Despite the above techniques to increase production, Americans still ate Passenger Pigeons to extinction, wiped out the bison, and started the process of overfishing cod
If the world could have supported two billion with 500 CE technology, the world population would have been two billion in 500 CE !
PLAN, PLANt, PLANet
Errol in Miami
"...no reason to believe it?"
None?
Spent much time in South Asia?
and
This sort of statements always makes me slighty dizzy - has everybody else than you missed something? Even the Joel Cohen you quote seems to say that 5 billion is just possible sustainably.
And your assertions about nuclear are outright ridiculous. I think even the nuclear industry wouldn't make such claims sincerely. What facts are they based on?
Davidyson
Me, it used to make me laugh, but it wears out pretty quickly.
Both the things you quote are so infinitely braindead, it's hard to come up with an answer. But not to worry, people like Dezakin offer no proof for their statements anyway. It's easier that way, or so I hear.
That is one of the emptiest things I've ever seen. You tap a skull and ask if anyone's home. But, as I said, no proof, not even any kind of reasoning, just a big hole.
And the sweetheart tops it off with hydroponics. He has no idea what that is. Feeding billions with no soil.
We have this noise factor here at TOD:Canada, loonies who leave the closet to be here. It's striking that there's a handful that used to show up in other threads, and after a long pause decided to honor us with their presence.
No, really, look:
He can't poissibly be talking about us, that's clear.
Dezakin is looking ahead towards our conquest of Mars
He simply has a different view on Uranium, based on facts and not assumptions. Current stocks and resources are some 10 Mtonnes, but only considering for a price. If price doubles, (which already has) it has been proven that uranium will probably be tenfold. This has yet to be proven, but it is not a wild card at all.
We are passing through a bottleneck though, and not an easy one.
Well, there are other views on uranium supply, based on facts and not assumptions, like the Energy Watch Group study on this topic.
(http://www.energywatchgroup.org/fileadmin/global/pdf/EWG_Uraniumreport_1...)
Also, Uranium supply is not the only issue, as you know but choose to ignore. There's proliferation, safety issues in the whole supply chain, nuclear waste "management", and the net energy question.
Cheers,
Davidyson
Cut the crap. Are we really choosing between total mayhem in our energy industry and "safety issues"? If total mayhem happens, you'll have your safety issues all bend over.
Now this would almost make sense if you had adressed all the other issues, too.
If the choice were simply between nuclear and mayhem, I would support nuclear, sure.
But I think it isn't. I think it's a choice between mayhem, nuclear mayhem (which likely means immediate mayhem just in the developing countries and possibly later mayhem in the developed world, as reserves peak) and controlled reduction of energy use, mainly in the western world.
One thing I do not understand is how you can talk about peak oil being solved by nuclear ignoring completely that a huge number of countries just doesn't have the industrial base to support anything like nuclear technology. Look at Iran. They have some of the smartest people in the world. They have lots of money from their oil production. Still, they don't have nuclear (yet), the Busheer reactor has been built by the Russians!
So for whom could (very theoretically) nuclear be the 'solution'?
Cheers,
Davidyson
Hah. The primary data comes from the infamous storm/smith report. Funny funny.
You know, where they got their results from uranium resources by using pseudo-scientific mathematical models that were in direct opposition to the university of melbourne analysis which actually made measurements of mines and plants in operation. Facts, not assumptions huh?
Well, you can discuss about aspects of these studies.
But it really strikes me that some people with the best intentions come to the conclusion that uranium will peak in 50-80 years at today's consumption level while others assert it will last for centuries at almost any rate of nuclear buildup.
Something's dead wrong here.
Given that there are similar claims about oil from both sides (imminent peak vs. oil will last forever), and I know which predictions I believe in this case, I would demand some pretty convincing reasoning to believe the "infinite uranium" story in the other.
Cheers,
Davidyson
FWIW, as best I can tell Peak Oil is pretty unusual.
Minerals, like uranium, have much smoother distributions of ore concentration. IOW, oil & gas pool up nicely, ready to be sucked up until it's suddenly pretty much gone. OTOH, minerals come in .5% concentration, then a bunch more in .4%, and so on. Sure, there are concentrations where plumes of magma or water deposit them, but they just don't concentrate the way oil does.
I have a hard time believing uranium will run out. I see pesky problems with nuclear, especially long construction lag times & weapons proliferation, but I'm sure we'll use it as much as necessary.
To mine the uranium requires a concentration that is profitable. In Ontario, around the Bancroft area, there a number of old uranium mines and more deposits that have not been mined much. Most are way too small to be mined economically. Their mode of deposit is all hydrothermal. Hot circulating fluids picked up the uranium minerals in volcanic intrusions and deposted them in concentrates. (in 1988 I published a paper in a geology journal where I discribed how these deposits formed some 900 million years ago).
The Elliot Lake depost, which was a sedimentary deposit, has all been mined out. It was the primary source of uranium for Ontario reactors. It's now a retirement community. There are still significant deposits in Canada and Australia, but they seem to the the biggest, save the one natural reactor in Africa, too hot to mine.
There is some research that is trying to see if Thorium can be used as a fuel, it's much more abundant.
It's the time factor that is the issue with any of this. Do we have the time. I've been seeing some news reports that the Bank of America is in serious trouble due to this mortgage meltdown. Some of our banks up here in Canada too are in trouble, one newpaper report put it at a possible $150billion loss.
Richard Wakefield
London, Ont.
No one is ahead of their time, just the rest of humanity is slow to catch on.
The flaws with the Storm/Smith study are examined pretty well here. Basically, these guys did their own study based on the actual inputs to an actual reactor, and found that Storm&Smith's calculations didn't match their observations at all, and were invariably grossly pessimistic.
The study you cite is quite deceptive. It counts enrichment together with power production. France devotes the output of three reactors to enrichment so the EROEI is less than 7 where they give 93. This study should not be relied upon.
Chris
Do you have a reference for this?
Given that we're discussing dodgy numbers, you'll forgive me for not believing unsupported assertions.
EDIT: upon reflection, I disagree with your reasoning, and here's why:
Consider the world as consisting of two parts, "the power plant" and "the rest of society". Society spends 1 unit of energy to produce a chunk of fuel, and hands that fuel to the power plant. The power plant then hands back 90 units of energy.
Did the power plant burn that fuel to produce 90 units of energy, or did it burn it to produce 100 units of energy and spend 10 of them refining the fuel? Fundamentally, it doesn't matter from the point of view of the rest of society - it spent 1 unit of energy to obtain 90 units of energy - and so the most reasonable way to think of that process is that it has a 90:1 energy return.
No, you are being intentionally decieved. Reread your link. The number 93 is just the tell. They are attempting to hide carbon emissions. Suppose society hands you a kWh of electricity and you use it to cook your breakfast. Are you then saying that because you did not burn the coal, no emission resulted? France could displace a great deal of European emissions if they did not use so much power for enrichment. This group hides this in their accounting because they want to attempt to discredit earlier work by dishonest means.
Chris
What do carbon emissions have to do with anything?
I'm really not sure what you're referring to, so it would help greatly if you would explain what you mean in detail and refer to the specific parts of the link you are talking about.
Go to the section on emissions. This is where they make the EROEI=93 claim. They need that to hide emissions.
Chris
Oh come off it. Your entire thesis rests on gasseous diffusion enrichment plants in France with production levels far above and beyond that required for domestic civilian power production; Military enrichment requirements and export be damned. It has nothing to do with the energy return on a modern nuclear power regime, all of which use centrifuge enrichment. You accuse of deception with statistics and then pull this fast one. And you still dont cite any sources.
And then you dont even need high energy returns because you can run much of the fuel cycle off on nuclear power anyways; They do that in France with the aging gasseous diffusion plants you're talking about.
If you want to continue down the line of attacking nuclear power on energy sustainability issues, you wont find a lot of credibility.
Hardly. You are making excuses for the inexcusable. The method of enrichment makes no difference to their calculation because they have hidden an energy input. They do this to hide carbon emisions, find a different result by that means and then say earlier honest work is wrong. The earlier work may or may not be correct, but faking a calculation to attack it is completely dishonest. The source should not be cited as in any way valid.
Chris
http://nuclearinfo.net/Nuclearpower/TheScienceOfNuclearPower
The following table displays the source and the amount of energy required to produce 1 KW-Hr of electricity from the Forsmark power plant. The table includes the energy used in construction of the plant, mining the Uranium, enriching it, converting it to fuel, disposing the waste and decommissioning the plant. The Forsmark plant is assumed to run for 40 years. There is an additional 0.026 grams of Uranium consumed in generating this one KW-Hr of electricity. This 0.026 grams includes the Uranium used to generate power at Forsmark and the Uranium consumed by the French Nuclear Power plants that produced the electricity that enriched the Forsmark Fuel.
Energy Source Contribution by mass Conversion to Energy Energy Contribution
Coal 0.467 grams 0.00676 KW-Hr/gram 0.0031 KW-Hr
Crude Oil 0.32 grams 0.011 KW-Hr/gram 0.0035 KW-Hr
Lignite 0.234 grams 0.0038 KW-Hr/gram 0.00089 KW-Hr
Natural Gas 0.115 grams 0.015 KW-Hr/gram 0.00173 KW-Hr
Hydro-Electricity 0.00146 KW-Hr 1 0.00146 KW-Hr
Wood 0.041 grams 0.0042 KW-Hr/gram 0.00017
Total 0.0107 KW-Hr
OK, for start, France is currently building a centrifugal enrichment plant to replace the gaseous diffusion technology. This will release 3 GW of power for the European grid.
Secondly, the INPUT to the currently deployed gaseous diffusion technology is Uranium. The effect is to increase the amount of Uranium required to generate the electricity within France. How much energy is required to mine that Uranium then?
Less than 1/100th the energy gained, including the diversion of approximately 6% of the Uranium output required to run the gaseous diffusion plant.
The factor 93 is valid.
You need to go back to math class. This text may be a little too advanced for what is going on here.
I would recommend you join him, as you can't understand the energy return of nuclear power.
Please demostrate that enrichment does not require energy inputs.
Oh wow, lookie at the strawman.
Hey, while you're at it since you're a fan of solar power, by your calculations solar power never has positive energy return since the founderies that make the crystalline silicon take far more energy than the solar cells they yield ever will produce.
Now I imagine you're having a moment of confusion as you protest that these founderies spend a good chunk of their manufactering capacity on semiconductors that have nothing to do with solar cells, but hey, by your accounting its all the same right?
But go ahead and build a mountain of incredible lies over and over, really no one will notice.
Are you completely bamboozled here? There is one born every minute but why don't you just look at what you are defending?
As opposed to your reams of evidence regarding Uttar Pradesh? Oh, wait, you offered none, and it turned out you were totally wrong.
Or, for all that, how about your reams of evidence showing why nuclear power can't be massively scaled up? All you've offered is insults and assertions, neither of which are useful. If you're so insistent on people offering proof, how about you start?
No, proof is elusive outside of mathematics, but I do have evidence that nuclear is sustainable for millenia. Its been discussed here many times. I can give yet another cite if you like.
Sure; Its done on a large scale today with high value crops. This is simply a question of wealth and productivity. I dont imagine we'll need to resort to such massive engineering because its reasonable to assume that the population will peak at some 12 billion simply because of falling fertility that resulted from industrialization of the developing world.
Its a simple thought experiment on the possible; I find it plausible that hundreds of billions could conceivably be fed with vast infrastructure investments, but that doesnt mean I find it likely. Go on and build some more strawmen if you're so inclined however.
What is the maximum potential sustainable carrying capacity of the earth? That is a very big and very important question. I'd like to see more discussion of it.
When referring to the earth's population in 500 or 1900, it must be remembered that people then didn't know as much as we know now. For example, we DO know how to manage fisheries or forests for maximum sustained yield; back then, they didn't really know how to do it. Our failure to do so now is not due to a lack of technical know how, but rather to a lack of political will.
Even if it were to be clearly established that we have "overshot" our carrying capacity (and we might very well have done so), and while some degradation might then be inevitable, it is not clear to me that we are powerless to prevent or reverse all of the degradation.
We can't bring extinct species back from the dead (unless the Jurassic Park scenario becomes reality), and we won't be reversing global warming for centuries. But that doesn't mean that there is nothing we can do to reverse SOME of the damage, and restore some of our carrying capacity. For example, if we really were to get serious about regulating oceanic fisheries, we could give fish populations a rest and allow them to rebound to maximum sustainable yield levels.
I'll give you a couple of examples of human nature.
I read this recently.
Do you know the story of the North American Passenger Pigeon?
By anyone's estimation it was the most abundant bird on earth, its flocks 300 miles long, numbering in the billions and darkening the sky. That was in 1800.
Humans found them delicious and began slaughtering them, boxcars stuffed with them arrived daily in New York and Boston.
When they found out they were diminishing in number it sent men into a greater frenzy of slaughter, they harvested lest they were all gone before they got their share.
By 1900 there were none left to slaughter.
In 1873 over 750,000 buffalo hides were shipped on the Atchison, Topeka and Santa Fe Railroad alone, and it is estimated that over 7.5 million buffalo were killed from 1872 to 1874. That continued until there were 7 pure buffalo remaining.
From the book........quote
"The postmortem of The North American Passenger Pigeon is so fertile with portents that just a brief glance warns-screams in fact-that anything we consider limitless probably isn't".
Alan Weisman: The World Without Us
My blood chills and I despair when I think about it.
If we had learned nothing at all from the experience - if there were NO endangered species laws, NO wildlife refuges, NO hunting regulations -- then I would share your dispair.
It might all end up being too little, too late. We'll see. The capability of the hman mind to actually learn things, and to apply that learning to change things, might be the only thing that might enable the human species to escape its otherwise inevitable extinction.
How about "assume people will attempt to replace the energy sources they're losing"?
The US currently produces about $200B of cars annually. At $1000/kW for grid-connected wind power, that level of manufacturing capability could crank out somewhere in the neighbourhood of 200GW of wind generation capacity in a single year. When you consider that the total generating capacity in the US is 1000GW, that's a pretty substantial amount. Taking into account a capacity factor of 20% for wind and 80% for existing sources, that represents 5% of the US's generating capacity replaced per year. That would require a lot of retooling, of course, but probably not more than was required in WWII to convert manufacturing to cranking out war materials.
So if you're looking for a way to avoid a big dieoff, try thinking about a crash program to build wind, solar, and nuclear power sources, as well as electrified transport. Fundamentally, there's no reason we can't replace the large majority of our fossil fuel use in relatively short order.
Of course people will attempt, but will they succeed? Your scenario seems to me to need a some substantial number of decades to get done. Do we have the time? For the whole world, not just US? I'd like to be convinced, but I guess I lack your faith in mankind.
Why?
The US retooled its factories for wartime production within a year or so; why would it be unable to retool a substantial fraction of its factories within the same time now?
Based on Nick's calculations (below) and roughly half of US energy consumption going to electricity, it would take just 10 years of production from retooled car factories to totally replace the current (tremendously wasteful) level of US energy consumption with wind power. If the US was willing to live with the same level of energy consumption as Western Europe (half), and taking into account the already-existing non-fossil-fuel sources (15%), it would take only 3.5 years of production at this scale to create the necessary generation capacity. The total manufacturing capacity of the US is more than triple the car-manufacturing capacity Nick used, meaning that - assuming full retooling - that level of generation capacity could theoretically be produced in a single year.
Obviously, it's not that simple, since retooling is non-trivial, shortages would occur in super-rapid production, and wind power above a certain level needs lots of pumped storage, but as a back-of-the-envelope calculation, it shows that drastic changes can be made very quickly, and assumptions that any changes must necessarily take decades are simply unfounded.
"The US currently produces about $200B of cars annually."
I think the relevant figure is production capacity available to US consumers, which is at least 20M vehicles. 17M were sold in 2006, so that's conservative. The average price was $27K, so we're talking more like $470B.
"At $1000/kW for grid-connected wind power, that level of manufacturing capability could crank out somewhere in the neighbourhood of 200GW of wind generation capacity in a single year. "
Prices have risen. That's almost entirely due to a scarcity premium, of course, but the $1/watt figure is from 98, so I'd go with at least $1.20, and perhaps use $1.50 for the short-term.
"Taking into account a capacity factor of 20% for wind and 80% for existing sources, that represents 5% of the US's generating capacity replaced per year. "
The average capacity factor for wind is about 30%, and the US grid is less than 50%: 440GW of average consumption, and about 950 in capacity.
So, that gives us 300GW of potential wind production, providing about 20% of average KWH production. In a single year.
Not bad, not bad at all.
All right Nick, is it going to happen or not?
If you say it will happen now tell us how, when and who.
If you can't show it then STFU.
If you believe what you are saying you must have the answers, if you don't have the answers why should I listen to you,
I can make up my own stories about what we can do.
"All right Nick, is it going to happen or not?"
It's already happening. 20% of 2006 new US generation capacity was wind. At this point the US organization of utility System Operators has received interconnection requests for about 120GW of renewables (almost entirely wind). We certainly have enough coal & nuclear to get us through the transition.
I really don't think we need to be concerned about adequate supplies of electricity (especially in the US - I'm not quite so knowledgable about the rest of the world), which I think is the question being addressed here.
That wouldn't mean 80% of new generation was not.
So explain to me the big rush to renewable energy.
Why is it not 100%?
"explain to me the big rush to renewable energy.
Why is it not 100%?"
Good question. The biggest reason is "capex lag": the time it takes to invest capital in manufacturing facilities and expand them. Right now wind turbine manufacturing is expanding about 40% per year, even though demand is much higher, so that's how fast wind power can expand.
Why didn't it expand earlier? Basically, really, really cheap fossil fuels, combined with the evolution of wind turbine technology. Only recently did the lines of natural gas cost and WT cost cross, and wind became cheaper.
Of course, enlightened public policy would have anticipated the need for wind, and accelerated it, but the US hasn't had that at the federal level for the last few years...
That depends on the economics and politics of the situation, and it's absurd to demand that Nick tell you what those will be. He's shown you that it's possible, which is enough.
Yeah, but you can't back 'em up with evidence; Nick did.
There are a number of basic problems here, but the worst relate to renewables - let's deal with just one:
First, "While this approach doesn't take into account the varying efficiencies of different sources like oil and hydroelectricity,
I'm glad the efficiency problem is noted, but
"it does provide a well accepted standard for general comparison.".
This is just not true. It's accepted for comparison of Fossil Fuels, but NOT for comparison of FF's to renewables.
The US uses 39 quads of primary FF to generate 13 quads of electricity - That's 3 to 1!. The average light vehicle uses 1.6 KWH equivalent, and the average EV uses .35 - that's 4.5 to 1!!
So, projections of the contribution of renewables are likely to be off by between 3 and 4.5 to 1!
Actually, the only way hydro accounts for 6% of energy is if that factor of 3-4 is already included. So I think glider's right on that issue.
"Actually, the only way hydro accounts for 6% of energy is if that factor of 3-4 is already included. So I think glider's right on that issue."
Excellent point. I went back and looked at the BP data that GG used for hydro and nuclear, and it turns out GG used the wrong conversion factor!
BP used 4.5 MWhrs per tonne equivalent of oil, which is what I would also aruge is roughly the correct thing to use. So, it turns out BP agrees with me, and GG's figures for renewables should be 2.7 times larger than they are!
GG, are you reading this?
Since I think EVs are nothing more than a convenient distraction, their relative efficiency is moot. I suspect that over the next 30 years much more electricity will be used for resistance heating to replace natural gas than in transportation to replace gasoline.
I'm using BP's figures, which are presented in mtoe. Who am I to argue with "Beyond Petroleum"?
"Since I think EVs are nothing more than a convenient distraction, their relative efficiency is moot. I suspect that over the next 30 years much more electricity will be used for resistance heating to replace natural gas than in transportation to replace gasoline."
That’s two assumptions: that PHEV/EV’s won’t take off, and that electricity will be used for resistance rather than heat pumps. I find those assumptions astonishing. I would think they would invalidate your analysis completely. What are they based on??
"I'm using BP's figures, which are presented in mtoe. Who am I to argue with "Beyond Petroleum"?"
You didn't use BP's figures for renewables, you used the EIA data adjusted by 12 MWhrs per MTOE, which is the wrong number. BP uses 4.5 MWhrs per TOE for nuclear & hydro, not 12, and I’m sure they’d use 4.5 for renewables as well (see the Definitions sheet, row 64 - the 38% they mention is 4.5 divided by 12, which gives .375, rounded up)
You need to adjust your renewables chart to be 2.7 times larger.
Don't get your knickers in a twist, young fella.
If you download the model data from my web site, you'll find that for nuclear power I used the conversion factor of 4.42 MWh/toe. It's on the "Nuclear Power" worksheet. I calculated this value from the BP data.
For hydro I used BP's Mtoe figured to start with, which you can confirm by correlating the y-axis values of Figure 8 with the values in the BP workbook.
For renewables I did use the industry standard conversion figure of 11.63, while the EIA has used 4.42, as I discovered when I looked up their table Gross Heat Content of Solar and Wood and Waste Electric Power, 1980-2005. That does change the picture for renewables, leading to a projection of 800 Mtoe by 2050 and 1040 by 2060, for an average growth rate of 5% pa over 50 years. Thanks for catching that.
That change raises the final population number to 1.4 billion by 2100.
To put this 5% growth into perspective, over the last 40 years hydro power grew by an average of 4% pa, oil averaged 2.3%, natural gas averaged about 3.5%, coal averaged 1.8% and nuclear power averaged just over 10% pa since 1970. Total energy growth over the last 40 years, not including renewables, was 2.5% per year. So wind and solar need to maintain double that rate for over 50 years, in the presence of a depleting fossil fuels...
Now it is clear what your misunderstanding is. You think that growth is limited to the way other things have grown. Many have noted that there is a serious problem with assuming no substitution, but now I think I understand why.
Wind and solar are very different from the other sources you are considering. Disregarding that growth in your comparison sources is demand growth, not a supply limited thing, so they need not have been limited and thus your assumption that these are useful guides is flawed, wind and solar are manufactured. This means that it takes much less effort to grow the energy supply. The existance of a manufacturing plant implies energy supply growth. It keeps on churning out energy generating equipment year after year. One dam means a flat energy supply, one solar or turbine factory means a growing supply. If you build another dam, you get a higher level of energy supply but if you build another factory, you energy supply starts growing faster. Growth of energy supply is built into renewables where it is not with other sources.
This is the disconnect. You feel that energy is energy and it all has to behave in the same way. Those of us who have looked into what is actually happening with renewbles just know they are different. We're figuring, since you are looking at energy, you'd grock this too. The end state of the renewable energy business is a glut of energy because the factories will be bought to produce planels for a tax writeoff for some other business segment. You'll have Coke giving away 250 W panels if you turn in 100 coke cans because it promotes their soda sales and beats out Pepsi and maybe people will see the Coke logo on your roof and get thirsty. This is also why renewables are growing so fast. Everyone know that market share is going to be key so it is very competitive to get in early because you need to ride the exponential growth to be a player. Here, finally, is where overshoot may be properly applied. Energy supply is going to exceed demand by a very large amount and it will be very interesting to see who blinks first and says, you know, we need to close the factory.
So, here are some better assumptions. Assume 35% growth for wind and solar. Assume 5% of production gets distributed to the developing countries in socially conscious ways so that each 40 watts leads to a girl finishing 10th grade every 17 years. Apply that to your population model and see what happens.
Chris
No, you are the one not "grocking" this. You are making a claim that is not supported by any other energy changeover in history. In order to make extraordinary claims, you must provide extraordinary proof. This proof remains lacking for renewables. You can hope that you are right but that does not make you right.
"The greatest shortcoming of the human race is our inability to understand the exponential function." -- Dr. Albert Bartlett
Into the Grey Zone
Hahumm. You're the one defending that mankind will be 5 billion less than now in less than a century, and for that you're assuming mankind will do nothing to counter our energy crisis, and renewables will just be plotted as a continuous line just as if nothing happened to FF.
You're being ridiculous.
And pathetic.
Stop asking for others to make "extraordinary" claims, you're the one who's doing that.
Further ad hominem or otherwise abusive comments will be deleted.
Ok. Alright. I'll refrain saying that people are BEING ridiculous.
Next time, I'll just say they are saying ridiculous stuff.
Same thing, and it isn't ad hominem. I haven't anything against anyone in here. I only have against the reasonings.
Which are ridiculous and pathetic.
A die-off scenario CANNOT be ruled out. Point. Your criticism well taken. But you seem to rule this out. It CANNOT be ruled out.
True, but largely irrelevant - his point was that changing to renewables is different from any other energy changeover in history, and so should not be assumed to behave in the same manner.
The fuel costs of solar/wind are zero, suggesting that - of all prior energy sources - nuclear (with trivial fuel costs) may tell us the most about growth potential. Nuclear has massive regulatory and safety issues that are totally absent from solar and wind, though, suggesting that the latter two are capable of growing much faster than the historical rate of nuclear growth.
I don't agree with mdsolar's predictions for the renewable industry, but I do agree that 5% growth is absurd, particularly in the face of an energy crisis. Think about it this way:
If the world wanted to increase production of renewable energy sources by 20% per year, what would stop it?
If you can't answer that, you can't reasonably assume that renewables will play only a minor role in the future.
Just so we have some data on energy changeovers in history.
The energy usage is scaled to 100%. So there is a massive increase in the amount of energy being used, what is charted is the change in the global energy mix.
BTW: for those who were claiming that no evidence was provided on scaling up nuclear, please read my comments to this article and see that I have provided plenty of evidence of the scale up that is happening and how passage of climate change bills in key countries will cause an accelerated changeover to nuclear and renewables.
Diagram of energy changeovers going back 157 years. (to 1850)
From a peer reviewed paper from Japan, which proposes a changeover to thorium nuclear fission and what it would entail.
http://www.energyfromthorium.com/pdf/Furukawa_ICENES2007.pdf
=============
http://advancednano.blogspot.com
So you are reduced to arguing that it will happen because it has to happen (in your opinion). Pitt, you are arguing for a rate of change that has never occurred before. Yes, this form of energy is different. Every form of energy has presented differences than the last form. This causes unexpected side effects but even so, we have no historical examples of the rate of change you are proposing for a period sufficiently long to allow a given form of energy to become a major component of our society. If I were making claims that ran counter to history in some other context, you would be among the first to demand proof that my claim was true. My request here is no more than you have demanded from others on other occasions.
"The greatest shortcoming of the human race is our inability to understand the exponential function." -- Dr. Albert Bartlett
Into the Grey Zone
"we have no historical examples of the rate of change you are proposing for a period sufficiently long to allow a given form of energy to become a major component of our society. "
Are your sure? I don't have the time right now to dig up the data, but I suspect that oil has several times grown at similar rates. If you have time to dig up such data, it might be helpful. Don't forget that we have several decades to do this in, so the current growth rates of 30-40% don't have to be sustained for very long. We could do that for 6-8 years, then settle down for a gradually falling growth rate for 30 years. Or some variation on this.
Don't forget, wind/solar are better than FF's: they are non-depleting, and they are manufactured: once we build a wind turbine industry that is installing 50GW per year, we can just sit back and watch gasoline, coal & gas gradually get replaced. Such an industry would be less than 20% as large as the car industry, for example, and not relatively difficult to ramp up.
You seem to be missing the point. While every single energy conversion has enjoyed brief periods of high growth, the sustained long term growth rates that led to such energy sources being large contributors to society have always taken several decades to achieve that end. It doesn't matter if the initial growth is 100% per year if it is only for 3 or 4 years. The longer term problem is that we must stay ahead of the decline curve. My contention is that the business as usual mindset will not accomplish this goal and that to achieve this goal we need to adopt a crisis mindset.
"The greatest shortcoming of the human race is our inability to understand the exponential function." -- Dr. Albert Bartlett
Into the Grey Zone
"The longer term problem is that we must stay ahead of the decline curve. My contention is that the business as usual mindset will not accomplish this goal and that to achieve this goal we need to adopt a crisis mindset."
Oh, I agree. My point is that is possible for wind/solar to provide sufficient energy, and that there is substantial progress being made towards that end.
Actually, I'm not so worried about sufficient electricity to handle PO. We could power 3/4 of our current light vehicle fleet with our current grid. The real problem is getting PHEV/EV's on the road quickly enough, and converting to low CO2 power to handle climate change.
Again, PHEV/EV's can do the job, and there is some progress being made (e.g., the Volt), but I agree strongly that it isn't fast enough: we need a serious dose of urgency at the federal level. Maybe we'll get it January 21st, 2009...
Be careful what you wish for, you might get it ;-o
Chris
duplicate
duplicate...
This is my comment from October 13th Drumbeat (it is about US production):
"Nuclear had average production growth of 36.5% when going from 1.7 TWh to 273 TWh over 20 years. Natural gas did it slower over longer period of time and coal as well. One reason why nuclear was able to have so big growth numbers is probably that the manufacturing capability for most parts was there already, since turbines and generators were being made for other steam power plants."
There's no reason why wind or solar could not do something similar. Especially solar manufacturing can be highly automated and ramped up. Wind too, but wind turbines need longer supply chains, which probably slows down growth to some extent. Wind also has more construction and siting involved. Still, I believe it's possibly to maintain close to 20% growth rates if the investment environment is good for wind. 20 years at 20% would make wind too big. About ten years would take it to be the biggest source of new electricity production globally.
duplicate removed
Where did you get that idea?
I'm arguing that it can happen because the required manufacturing capacity already exists. Whether or not it will happen depends on how the future unfolds.
And we have no historical examples of the rate of change people are proposing for peak oil, either, so are you arguing that that can't happen either? A rapid change hasn't happened before in large part because it wasn't needed before. Since the assumption is that peak oil will cause the first-ever (in modern society) rapid decrease in existing energy resources, it makes no sense to assume that the response to that unique event will necessarily be identical to previous responses to quite different events.
I argue that wind power is capable of rapid increases - there's more than enough manufacturing capacity - and that it's likely people would attempt to effect a rapid increase if the alternative is misery and death. Which part of that do you disagree with?
I didn't argue that it cannot happen. I said that I do not see it being possible with a business as usual approach based upon historical data available for other energy sources. What you are saying is that we will recognize the crisis and respond in a timely fashion that ends up producing the desired result. Yep, that may happen. And it may not. And until I see our society deliberately choose to try to succeed, I am going to go with what the history books tell me - that societies that do not deliberately choose to succeed normally collapse.
I don't think our opinions are that far apart on this, Pitt. You are implying a crisis mindset and I am saying that without the crisis mindset we cannot reasonably expect to get there from here. So... where is the crisis mindset? I don't see it yet.
"The greatest shortcoming of the human race is our inability to understand the exponential function." -- Dr. Albert Bartlett
Into the Grey Zone
Perhaps not; however, my view is that it really doesn't need to be that much of a crisis mindset.
I don't find the arguments that fossil fuels are going to crash at enormous rates of decline to be credible, I don't find the dire predictions of war and strife at the drop of a hat to be credible, and near as I can figure[1] it would take only a year or two of world manufacturing output to replace the energy derived from fossil fuels, so I really don't see the situation as nearly as dire as a lot of people here do.
Based on the evidence I've seen, peak oil is - for rich countries, at least - less a question of survival than of comfort. Converting to an infrastructure based on renewables isn't that tricky, at least conceptually - the technologies required all exist already, with the possible exception of airplane fuel - but the faster we have to do it, the more disruptive it will be. It may only take a single year of industrial output to build the required infrastructure, but that would be an enormously disruptive and unpleasant year. Changing over the course of 50 years, though, should be pretty painless. The question of peak oil, as I see it, is where the situation will fall on that spectrum.
So it may well be that our only difference is in our opinions about how difficult of a problem peak oil poses; that may be a substantial difference, though.
[1] 100 quads/yr = ~10T kWh/yr (electricity-value, not heat-value) / 2M kWh/yr per MW wind @ 24% capacity factor = 5M MW wind @ $1.5M/MW = $7.5T = ~1yr of world manufacturing assuming that the proportion of manufacturing to total GDP is similar to the US.
Consider wood to coal: In both cases you had to either chop the wood or mine the coal. No difference. Now consider depletables to renewables. Once you have your renewable generation in place, you just kick back. Very different. In fact, once you've broken into a growth market, you are always tilting growth steeper because plants continue to produce more capacity, very very different. And, the market exists because there is high energy demand created by the use of depletables. So, because their price has to rise (they have scarcity built in) renewables can't help out competing them even if they didn't get cheaper all the time, which they do.
Chris
I worked in telecommunications R&D for the twenty years leading up to 2001. For the last three years I was working for a high profile fabless semiconductor company whose P/E was 240. I heard the argument that "This time everything is different" right up till the day the industry crashed. As a result I'm a little skeptical about claims that industrial enterprises can maintain very high growth rates over long periods of time.
The idea of maintaining a 35% growth rate over decades is very difficult to accept. That requires not just an existing factory base continually churning out turbines, but a constantly expanding base of factories (otherwise the percentage growth would slow over time since each individual factory's capacity is essentially constant). The number of factories would need to double every couple of years.
Current global wind capacity is about 90 GW according to the WWEA, which projects a 21% growth over the next 3 years (http://en.wikipedia.org/wiki/Image:Wind_2006andprediction_en.png). Let's assume we meet that objective, and then get really serious and at the end of 2010 with an installed capacity of 160 GW we ramp up the growth to 35% as you expect. Let's sustain that for 20 years. and see what happens.
Well, at the end of 20 years we have an installed generating capacity of 65 TW! Pretty damned impressive, when the world's current generating capacity is only about 2 TW. Hell, in the last year alone we would have added 17 TW of capacity. Assuming an average turbine size of 2 MW, in te final year we'd have built and installed 8.5 million turbines!
Heck, even after 15 years of such growth we'd be manufacturing and installing almost 2 million turbines a year. OK, let's say we can do that. Now assume a factory can build and install one turbine a day, or 365 turbines a year. At the end of year 15 we had 1300 such factories world-wide. In the next year they produce another 485,000 turbines, but to meet the growth rate we need to build another 450 such factories. And the year after that we need to build 600 factories, and the year after that 800 and the year after that 1100. Three factories a day to maintain the 35% growth rate. In an industrial environment that's hamstrung by falling oil and gas supplies...
It's patently absurd, which is why I didn't put a projection like that in my model.
A trend is a trend
The question is,will it bend
Will it alter its course
Through some unforseen force
And come to a premature end
Seriously, what is your deal with trends? You write as though they are things in and of themselves. Oh, there's a trend, look at it go! That thing is gonna go until it runs into a brick wall!
You're right, we would continue building wind turbines way past the point of supplying all the worlds energy, I mean it is a trend after all.
I'm simply responding to all the "Look, wind is growing at 30% a year!" posts that themselves don't postulate any upper limit. Then I put an inflection point due to external circumstances (peak oil, no less!) into my projections and catch criticism.
I'm coming the the conclusion that the projection of renewables is as much a religious debate as a technical exercise. It's heavily influenced by one's worldview and perception of human nature.
My belief is that we will hit a plateau with renewables that's somewhere around the same level as nuclear and hydro, and that all three sources will suffer because of a loss of global industrial capacity due to oil and gas depletion. The advocates for renewable energy sources like wind and solar appear to feel they will supply a lot more than that. So far the main reasons I've seen amount to "Because they can" and "Because we'll need it". Neither of those is persuasive to me in the face of Peak Oil and especially the net oil export crisis.
"The idea of maintaining a 35% growth rate over decades is very difficult to accept."
You also just proved that we don't need it.
But why is such growth difficult to accept? I admit that it is logistically nearly impossible - you need land and good places to put your windmills, you need grids and superstructure, etc..
But remember Moore's Law that chips whould double capacity every two years? (..that the number of transistors that can be inexpensively placed on an integrated circuit is increasing exponentially, doubling approximately every two years. wikipedia) Would you have believed that 40 years ago?
When society begins focussing on ONE THING, like they were doing with computing over the last decades, a lot can change..
---------
Just remember the Golden Years, all you at the top!
Wait a moment. You're saying that "we need A" and "we can get A" doesn't suggest that we might actually obtain A?
Let's consider this situation in a more neutral context:
1) I need breakfast.
2) I can get breakfast.
Is it not reasonable to assume, based on those two points, that I am in fact likely to actually go and obtain breakfast?
If you're willing to grant that something is both needed and obtainable, I don't see how you can rationally assume it won't be obtained. That's a very strange assumption, and it needs to be very clearly explained and supported before it makes any sense.
I think you'd have much better luck attacking the notion that producing the required level of renewable power is possible; as it stands, your objection reads as "because it just won't happen", and that is really not at all persuasive.
Your analogy is flawed.
I wasn't totally clear in what I meant by "Because they can". By that I meant that it is technically possible. However, no technical project proceeds without funding. Since there isn't enough capital available to fund everything humanity might want to do, we allocate the available capital among competing priorities. I believe that other priorities like building weapons and trying to secure fossil fuel supplies (among many others) will by and large out-compete windmills.
I'd see a more complete analogy as:
1. I'm a hungry alcoholic.
2. I have enough money for either a bottle of wine or breakfast, but not both.
It's reasonable to assume I go to the liquor store instead of the restaurant.
Logic would suggest that money would flow towards the cheaper and more stable projects.
That's precisely what we've seen in recent history: when fossil fuels were cheap, money went towards fossil fuel plants. When they became more expensive and unreliable, money flowed towards nuclear. Fossil fuels became cheap and reliable again, so power money went back to them. Then wind became cheaper and fossil fuels more expensive, so now money is flowing towards wind.
That latter trend - of wind getting cheaper relative to fossil fuels - is only going to accelerate in your scenario, yet you make the assumption that people are going to redirect money away from the cheap option and towards the expensive option, in utter defiance of observed human behaviour over the last 50 years.
Why? What possible reason do you have to make that assumption? How can you possibly expect anyone to consider that a valid assumption without massive justification on your part?
That's an enormous assumption, and not one that you can possibly expect people to accept without substantial justification, which you haven't provided.
Until you correct that, your model reflects nothing more than your personal opinion, and can be utterly dismissed simply by saying "I don't agree with your assumption regarding spending priorities". It's an utterly fatal flaw.
Any model like this is strongly flavoured by the opinions of its author. I made that clear in the introduction, and people who don't agree with my assumptions are free to reject the conclusions. I have no problem with that, I'm not trying to convince the world that I have a perfect vision of some ineluctable, preordained future.
That being said, here's how I expect things to play out (and this will be reflected in a update of the paper over the next week). I apologize off the top for introducing a new element into the discussion, but as I've absorbed the comments that have been made about renewables in this thread, my thinking about why I expect limits to kick in has clarified.
I believe the net oil export problem is going to cause two events in the near-to-mid term (say within 15 years). The first is a massive increase in the price of oil on the world market. The second, which follows on from that, is a global depression. That depression will be exacerbated by the destabilization of the US dollar and possibly the Euro.
In other words, I believe that there will be an inflection in the world economy caused by the rate of change of supply on the international oil market. This inflection might be avoided if all we had to worry about was the world oil supply declining smoothly at 4% per annum. However, a plunge in market supply coupled with a spike in the market price to multiples of the current price, all happening over a just few years (or potentially months) will have a qualitatively different effect. From what I now understand about the behaviour characteristics of net oil exports I do not believe such effects can be avoided.
That depression is going to sharply restrict the capital available for new energy projects. Much of the available money will go into maintaining existing infrastructure instead. Added to this is the fact that maintaining business as usual (i.e. ensuring the continued flow of profits to the current corporate players) requires that the underpinnings of their existing businesses be maintained. In some cases those business models will include windmills, but in a most cases they won't. That means that government support and funding (which will be massively constrained by the ongoing depression) will flow almost exclusively to those industries that constitute their current political base.
If that happens, it will be up to private investment to support the production of windmills. Two things will act to constrain that investment - the first is demand destruction due to the depression, the second is that private investment will be hit hard by the depression as well, and the money will dry up. Those two factors will conspire to take the wind out of the sails of the wind industry.
If you do not believe that the loss of global oil exports and the international chaos that would generate has a high probability of triggering a depression or a long-lasting and ever-deepening recession, then feel free to reject the conclusions entirely. As I said above, I don't feel I need to convince everyone.
GG, what did you think of my argument that there is a limit to falling exports? I'll repeat it here, if I may:
There is a limiting factor to falling oil exports: export revenue.
OPEC countries like KSA couldn't possibly stop all exports: they'd collapse economically and politically immediately.
Now, rising oil prices will buffer falling exports, but exports will remain high enough to stabilize export income near current levels - you can depend on it. If exporters have to raise domestic fuel prices (like Mexico) or ration (like Iran), so be it.
Wouldn't you agree?
I'd say that in some cases that will definitely apply, and in others it won't. A lot depends on the specific pressures the country faces, and the threat of revolution its rulers face.
I'd expect to see a behaviour shift over time. Something like, at first the country will let exports fall to keep its people supplied and happy. Then as the drop in revenues begins to threaten the national treasury the wishes of its citizens will increasingly take a back seat, and exports will be supported. Such a country would also need the export revenues to fund the increase in police and security forces they will need to control an increasingly discontented citizenry.
Eventually the question will be asked of the citizens, "Which shall it be, money or fuel?" To which they will resond, "Neither!" And TSWHTF.
Other variations are possible. A government could be so close to the line financially thet they will disregard their citizens from the git-go. Or they may not have the option of nationalizing their oil due to pressure from the international finance community (read Naomi Klein's "Shock Doctrine" for insights into how this works), so they have to let the IOCs keep exporting - think Nigeria here.
That sounds fairly reasonable.
On the whole, I think that cheap fuel will be less important than the various things that export revenues support, such as low/zero taxes, jobs, education subsidies, etc.
At the moment, most of these governments aren't forced to make a choice, because prices are rising faster than exports are falling, but when net revenues start to fall it will be different, like in Mexico and Iran. Further, I should think that some governments will act at some point before that crunch point, in order to maximize revenues.
I agree, it will put governments in a difficult place, with hard choices, but the clear choice for any sensible government is to take the revenue, rather than subsidize the incredibly wasteful FF consumption of some of these countries. KSA is running ads reminding people to not do things like spilling fuel at gas stations....
Such as the full price of oil being passed on to the citizens of an oil-exporting country.
That's already the case in a number of major exporters (e.g., Norway and Canada, and Russia and Mexico have prices that largely or wholly reflect oil prices), and that should allow oil markets to behave in a more orderly manner than if the consumption of all exporters was shielded from price increases.
Both my "variations" amount to exactly that - the citizens pay the world market price. It's just for different reasons and under different circumstances.
I disagree with basically everything you assume.
1) I don't share your assumption that global oil exports will collapse rapidly and catastrophically; I think they'll fall more evenly.
2) I don't share your assumption that reduced oil exports will cause international chaos; I think they'll cause high prices.
3) I don't share your assumption that the result will be an ever-deepening recession; I think growth will be slowed.
4) I don't share your assumption that people would avoid putting money into other energy sources to replace the dwindling oil supplies; I think people will consider energy supply to be a high priority, and that investment in non-fossil sources will continue to increase as an economically-preferable source.
Allow me to sum up your argument as I see it:
a) Oil supplies will crash.
b) This will destroy the world economy.
c) With no economy, the crash cannot be prevented.
You're not going to convince anyone with that argument; unless someone already agrees with you that it's all going to come crashing down, none of your assumptions are at all reasonable without justification, and you provide none. To me, it seems terribly circular: we can't prevent the crash because the economy is crumbling because we're crashing because we can't prevent the crash because...
What you've made isn't a "model"; it's simply a detailed story of how you personally believe things will happen. It's based wholly on your personal opinions, and was constrained from the start to end up concluding that they were correct.
Frankly, it's nothing more than a scifi story in numerical form, every bit as much as calculations extolling the wonders of building massive numbers of space elevators are. Without evidence, it's a flight of fancy.
Well, there you go.
As much as you'd not care to admit it, your worldview influences your interpretations every bit as much as mine does. Your inability to accept the "idea of of crash" speaks much more to personal conviction than it does to dispassionate objectivity. In this case that represents an an unbridgeable divide.
I've made it clear from the start that the model was influenced by my personal opinions. And yes, it is a model. It's not world3, but the world of models extends much further than than differential equations.
http://www.psychstat.missouristate.edu/introbook/sbk04m.htm
You would simply rather I had used a different type of model, with a different representation of the universe under consideration.
...doesn't exist.
You're making assumption, and it's another unwarranted one. A crash is certainly possible, and I'm certainly willing to accept it as probable if the available evidence points to that conclusion.
It doesn't.
The available evidence points to the conclusion that crash and collapse is unlikely. Not impossible, of course - human behaviour is pretty hard to predict - but not likely, and certainly not a foregone conclusion.
You, by contrast, have been presenting a crash as a foregone conclusion. The inability to accept the possibility of alternatives here is yours, not mine.
OK then,
What sort of evidence would convince you that an inflection event that would trigger a globally significant loss of population was likely (>50% probability) within the next 20 years?
You are predicting population loss based on falling energy production from all sources combined happening first.
You have not proved that the first step (falling energy production) will happen. Currently energy production is increasing.
Then you can try to prove the next steps. Declining energy production causing paralyzing financial circumstances. And that causing a die off. I doubt each step.
The first step is I have provided a lot of information about the nuclear buildup and how much can be produced from nuclear. I have done the same for wind. I have also shown that there are significant electrical vehicles being produced in China. There is also the superconducting motors and thermoelectronics which will increase industrial and transportion and transmission efficiency. Climate change bills passing would also rapidly accelerate the shift. So the first step declining energy production looks like it does not happen. If it does not then none of the rest needs to be talked about.
=====
http://advancednano.blogspot.com
I would accept observational evidence of polar ice melt trends leading to the rise of ocean levels by a sufficient level to swamp a large % of world population - moving that many people, and losing that much fertile land, would likely cause sufficient chaos as to significantly increase mortality.
I've researched energy, and any kind of normal change, like PO, wouldn't qualify. Any kind of normal change can be handled by adaptation. An extreme example is the kind of response we say in WWII. I think you greatly underestimate the kinds of short-term conservation efforts that are possible. For instance, mandatory car-pooling in the US could reduce commuting gasoline useage in the US by 60%+ in 3 months.
Chaos and collapse involves the assumption of an irrational response. An irrational response is certainly possible, but I don’t know how you provide evidence for it, unless perhaps you do a very sophisticated econometric analysis, and even then I don’t know how you would model discontinuities like a complete loss of faith in the world credit markets, or countries going to war.
The sudden loss of ME oil would certainly be a very big stress on the system, but on the whole I'm much more worried about climate change than I am about energy availability.
Don’t get me wrong: I think the world in general, and the US in particular, ought to address energy in a much, much more urgent manner. The US is at war, indirectly but certainly because of oil; the US is suffering great long-term economic harm because of oil imports; and fossil fuels are causing climate change.
I just don’t see likely economic collapse because of energy availability.
That would depend entirely on what the theorized event was.
The problem in this case is that you're making assumptions about human behaviour, which is always tricky. To back those up, I'd expect references to social psychology research on the behaviour of groups in similar situations, as well as to sociology and political science for the same analysis of nations. That's a pain in the ass, but justifying assumptions about human behaviour is really hard.
Similarly, any claims about the effects of certain situations on world or national economies should be backed up with economic analysis, especially when it comes to claims that something will cause a recession or destabilize an economy.
I'd also expect an examination of how much energy is used for different parts of our current civilization, how much is necessary for those parts, which of those parts are necessary, and how likely people are to be willing to raise hell rather than make sacrifices (again with the psyche). You had a little of that with the Renaissance Agricultural Man, but the numbers from your source don't sound at all credible, especially when compared to present-day humans in other countries.
Basically, I'd need to see a series of steps laid out, and then have each of those steps explained and supported to the extent that it became at least plausible. For example:
1) Saudi Arabia and Russia run out of oil.
2) World exports fall at 5mb/d per year.
3) The world economy cannot cope.
4) Collapsing economies trigger others like dominoes.
5) Manufacturing capacity plummets rapidly.
6) Energy generation crashes.
7) The level of energy/fuel remaining available cannot support farming at necessary levels.
8) Whole nations collapse and war as millions starve.
Each one of those steps would have to be justified to the extent that a skeptical observer would consider them to likely. Skeptical observers will not take your word for it, and will likely want you to cite peer-reviewed research that supports your claims. (It doesn't have to be yours, of course, but you have to be very careful that it supports your claims and it not particularly controversial.)
The hard part is in questioning all of your assumptions and assertions, and finding evidence for them. I find plenty of cherished beliefs turn out to be false when I go looking for evidence to support them, so I try to do so often. For example, I didn't realize how small the energy supply problem was in comparison to world manufacturing capacity - I'd assumed it was much larger - but based on that research I now realize that a great many doomers grossly underestimate how much the world can manufacture in a year.
In general, the more reliable numerical data you can find to support your argument, the better. Something like "ocean pH has been measured every day for 50 years, is declining at an accelerating rate, and will pass the threshold where plankton cannot form shells within 10 years at current rates; see authoritative and unquestioned data on ocean pH , with authoritative and unquestioned data on minimum pH for shell formation and unquestioned data on the effects of failing to form shells " would be compelling, and would likely convince me there was a serious change in the offing within the near future. Contrast that with "ocean pH is rising and soon the plankton will all die and we're all doomed!"
The latter is opinion and assertion; on the internet, that's worth nothing.
Thanks for your input on this thread, Pitt. It has been extremely helpful, and have in fact moved my personal yardsticks quite a bit. My overall response is at http://www.theoildrum.com/node/3091/252268?page=1
And thanks to you for being open-minded enough to listen - based on your "closing remarks", you're unusually willing to reconsider your viewpoint, which is always a good thing.
And thanks for being patient enough to not get too riled at my occasionally-more-snarky-than-necessary responses. It ended up being an interesting discussion you started!
I think there are a number of scenarios:
India failing to show restraint as Pakistan falls apart. India will likely face serious provocations as this happens. A war that puts the carbon in ten or so large cities into the stratosphere as soot leads to starvation owing to reduced growing seasons for several years.
Serious drought in the US Mid-west and Asia simultaneously.
Pandemic flu or more virulent AIDS.
Wide spread persistant crop blight or overwhelming parasites.
These could lead to large population loss in the next 20 years.
Our larger risk is ecological collapse brought on by too rapid environmental change, but in 20 years we find out if this will occur, we don't see a big effect on population by then. Your fossil fuel use projections tend to support the idea that we will see this, but trends in preventing new coal plants from getting licensed in the US, moves towards greater energy efficiency and greater international interest in lowering carbon emissions suggest that these projections may be too high.
Chris
It does help, however, to have the model be quantitative, with explicit assumptions.
Furthermore, one hopes that the model will be dynamic enough to do more than just make one's existing ideas explicit: one hopes that the model, once operating, will actually tell us something new and surprising, that challenges our intuitive world view. And, then, we have to be open to changing our ideas. Once has to follow the evidence, wherever it takes us. If a projection goes where we don't expect, do we accept it, or tinker with the numbers until we get the result we assumed to start with?
I'm afraid that some people who see a collapse, actually think it would be a good thing, a return to a primitive non-consumer paradise (or perhaps simply a reprieve for a beleaguered planet), and therefore predict a collapse, and all the required antecedents, such as a lack of response to energy problems, or financial instability. Kunstler is a very clear example of this: he hates cars & suburbs, so he predicts their collapse - it's as simple as that.
Now, as to overwhelming financial negative feedback loops: no question they’re possible. But the likeliest scenario? I don’t see it, and I think you’d need a much more sophisticated model to begin to be able predict such a thing with any confidence. One can warn that they are possible, and responsible decision makers would take that as a mighty important risk to avoid, but that’s a very far cry from assigning a high probability (or calling it certain). That would need a LOT of work to do with confidence.
Finally, I think that the more you learn about renewables, and electrification, the more you’ll realize that they aren’t as hard to do as you think. That’s the bottom line: these solutions to peak oil just aren’t that hard to do - not that expensive, not that time consuming. By far their greatest challenge is capex lag: that’s certainly a problem, but again, if you analyze it, as I have, I think you will come to agree that it’s not an overwhelming difficulty.
I was amazed when I read someone here write "I'll be happier as a subsistence farmer." I truly doubt that person knows anything about subsistence farming, or drought, or early frost, or gnawing hunger.
It's not that hard to hike off into the woods and actually be a subsistence farmer, at least in North America, so it seems to me that that person didn't actually want to be a subsistence farmer - else she would have been one already - but had simply made up a fantasy version of it to pine for. Like the standard "when I win the lottery" fantasy, but weirder.
In doing the research for the posts in this thread, I was very, very surprised to see the results of my calculations on wind power. I thought replacing the world's energy supply would take much more effort than that, but a reasonable estimate really does seem to be 1 year of global manufacturing capacity.
I'd hate to approach this kind of thing with a closed mind - that would take all the thrill of discovery out of it!
Pitt you're missing a key element. Debt. Debt of governments, Debt of companies and personal Debt. Much of that debt is not held domestically (Canada's over all debt is about half held domestically).
The other key element is that the entire system is intertwind and interdependant. As soon as a threat starts to unravel, it has far reaching consequences. The current mortgage meltdown (which is just beginning) is a great example. A Bank in England facies bancruptcy, people lined up in the streets to get their money out, because that bank held too much of this type of mortgage debt. Same for another in Germany. Some Canadian banks maybe on the hook for $150billion by the end of this year. How many bank CEO look in the mirror each day and ask how the hell they are going to get out of this mess, one they themselves created.
So once disruption in oil starts, once the price goes over some threashold, it will start a domino effect throughout the economy. Once market confidence drops, and people start to panic over the health of their wealth, you will see shifts as they start to bail out of one thing and into another (currently happening with oil as investors bail out of the US dollar). That drives up the price of the commodity being sought after and drops the price of the item they are bailing out of. Things like this often get out of control and billions can evaporate in the wink of an eye.
Once that starts, and debts can't be paid back, you'll see even more bail outs and the ball keeps growing.
Higher oil prices will trickle down to higher prices for other goods, like food. That will squeeze out remaining avilable income for other things. Add to that the possibility that the Fed will raise interest rates to try and curb that "inflation" in prices, then look out. Now you will have a double hit. Defaults will skyrocket, people will loose their homes, loans will be called in and the ball starts to roll faster and bigger.
Yes it's a scenario, and no I have no specific insights or evidence to back it up. Only the ability to see that things can very easily turn in the wrong direct and easily get out of control. It's happened before, but not to the scale this one can take on.
Richard Wakefield
London, Ont.
No one is ahead of their time, just the rest of humanity is slow to catch on.
That sharply limits your ability to influence people's thinking on how probable your scenario is, then. You think it's likely, but it seems like most of the world's financial system thinks it's unlikely, so why should anyone trust your beliefs over theirs on financial matters?
Without evidence, all anyone has is opinion, and opinion isn't terribly compelling.
It seems to me that a lot of irritation and heat in this post has occurred because one set of people intuitively regard Glider's model as a scenario while others are looking at it as though it were a candidate theorum.
As a candidate theorum it definitely fails. More importantly, the disconnect caused by two sets of people operating with vastly different requirements for "proof" is huge.
I'm in the scenario camp. I am persuaded that, oblivious, the world is drifting toward unparalleled catastrophe. I am persuaded that the world economy will not cope well with the possibility that total energy may peak and decline. I am definitely persuaded that countries are not much more likely to cooperate to deal with the problem than they are to deal with climate change or any other problem of our common wealth.
Of course, it is important that Glider's concepts, numbers and calculations are sound so much of the input from Pitt, mdSolar et al is helpful.
I don't think, however, the Glider is trying to prove to anyone that he is writing flawless future history. I think he's saying that, given a series of assumptions, his is a reasoned and reasonable scenario for what may happen.
I have a stronger critisism than details: One should not present Malthusian calculations at all. When speaking of human populations one needs to look at human choices first. One needs to acknowledge the roles of freedom and dignity. So, one first adopts a range of demographic models that include factors like immigration, emmigration, education and advances in medicine and take these as given. At that point one can bring in information about energy or agricultural productivity and say what the per capita availability of these things will be under the model assumptions. This is then useful to inform people about how their population related choices will affect how they are going to live. For example, ensuring the education of every girl through college appears to reduce fertility below the replacement rate. Imigration to places where this level of education is, in principle, possible has an effect on overall population. Efforts to build up educational institutions in regions where this has not yet been a possiblity also have an effect. Thus, one can construct a population curve that does not look all that different from the Mathusian curve used here and say that these choices on the population side lead to a roughly constant per capita rate of energy use based on the energy production assumptions. One can show that different choices, such as providing food aid but foregoing educational assistance suggest a different population curve that has falling per capita energy use.
My largest objection is thus an ethical one. Adopting Malthusian methods so insults human choice and dignity that it is directly harmful and must be avoided. Much of the math can be carried out in a somewhat similar way, but it cannot be presented the way it has been presented here. One must, as the Club of Rome has done, provide a sustainablity model, which starts from the ground of respect for human beings. If that sustainability model seems to strain credulity as to the possibility of it occuring, it is OK to say so, but it has to be there as the key model from which others vary.
The technical critisisms on renewables are of much less importance than this fundemental critisisms.
Chris
A note to support Glider in re. inflection:
Peak Oil theory makes use of the 'logistic equation', which is also know as the 'Verhulst equation' after its inventor.
Verhulst invented his equation in response to the writings of Malthus. His equation became the accepted way to build a 'limit to growth' into any model that is predicting exponential growth. Glider could have made use of the logistic equation, but I think he believes that the coming limits to growth will be more hard and sudden than is represented by Verhulst equ. Can anyone provide a rational argument that they won't be pretty much as he guesses? i.e. different enough to change, by themselves, the expected results?
My experience with building models of electronic circuits is that limits to signal size are usually vastly harder and faster than Verhulst. I see no reason to stick purely to exponential, or purely to Verhulst, when we surely believe there is a limit and we can only guess at what will cause it and at what point it will become manifest. He did explain what he was doing in some detail.
I think, OTOH that if one were to postulate a much slower decline of technological civilization, one might get a much less 'doomer' view. But if one does such an exercise, it is important to state very clearly the optomistic assumptions. I, for one, am very sceptical of technological 'happy talk'.
Their is nothing intrinsically wrong with the technological happy talk. I'm sure that Nuclear/Wind and more coal and even biofuels will be used extensively in the future.
The issue is how will the economic and political landscape look as we make this changeover. If its a suddenly enlightened humanity that works hard to not only switch to renewable but underwrite the switch in the poorest countries and also aggressively works to solve the population problem etc etc. The with a huge amount of work and commitments we might transition without major problems.
A more realistic scenario is that renewable energy and nuclear power will be reserved for the wealthy and the technoligist community needed to support them.
This means the income distribution in the first world becomes more like the second and third world i.e the Brazilificaiton of America.
Only now its much worse since the poor will be pushed into subsistence farming on soils depleted of all nutrients with out the money to buy fertilizer etc.
To repeat wind turbines will not solve our problems they are not and have not been technical issues for at least 70 years. We could have moved to renewables 70 years ago and transitioned to nuclear off coal 50 years ago.
I've not seen one of the people that claim technology will save us address the real issue unless they are all wealthy then I can see why they are not worried.
"To repeat wind turbines will not solve our problems they are not and have not been technical issues for at least 70 years. We could have moved to renewables 70 years ago and transitioned to nuclear off coal 50 years ago."
Not easily. Renewables were much more primitive, and fossil fuels were so, da--, cheap!
You've got a point though. Utility size renewables, like CSP and wind, or nuclear, won't help Africa that much. Cheap PV, on the other hand, holds out a great deal of hope.
This is correct. 5% of our new production will be going to development NGOs and NGOs are already working with salvage PV though there is less and less of this owing to the silcon shortage. Also, we expect to sell equipment we take off of roofs at a discount in developing nations. It makes more sense to put up fresh systems than to reuse old ones in the US market because it is better to avoid the cost of repair during a contract. The difference between a little electricity and none at all is enormous, and the difference between a daily dose and a very intermittant grid is also large.
I'd also note that rural electrification displaced quite a bit of wind. In one case I know of, the family stuck with their wind system even though the power lines came through until lighting took the system out. Why not? It was paid for already. The mess in the basement where the batteries used to be took quite a lot of cleaning. At that time, they were made of glass. Small wind can also be a development aid as it was here.
Chris
This gets back to my suggested approach:
1. Figure out what the maximum sustainable carrying capacity might possibly be.
2. Figure out realistic population, per capita GDP, and per capita energy consumption levels that are sustainable given that carrying capacity.
3. Figure out how much of an installed base of a renewables infrastructure is needed to supply the needed energy.
4. Plot an "S" curve from here to there to determine the total increase in the installed base of renewables infrastructure needed.
5. It should be an "S" curve because as production approaches 100% of the needed capacity, it should shift from build out mode to repair and replace mode. Infinite exponential growth is not a necessary precondition to make the necessary financial investments economic; all that is needed is a known game plan per above, the pricing and profit margins and interest rates can be set at levels that will provide an acceptable rate of return to the investors.
Your examples of exponential growth are apt I think. The cost of semi-conductors is still falling. We are making more in the way of chips and such than we actually need but the newer factories are able to compete on price (see for example TI's LEEDS plant) so they keep on churning. The whole thing now is marketing. Vista need more memory and new cards to implement its DRM so you need to replace your perfectly good computer. Cell phones need to be cuter or have more features because there are plenty of ones that can send or receive phone calls.
So, this is where a consideration of overshoot would be appropriate. You have no idea what the carrying capacity actually is so your population ideas are simply an offense against humanity. But, you can apply the idea of overshoot to a market without straying on to dicey moral ground. The interesting thing is that manufactured energy behaves differently from one-off energy investments so that the modelling should pose some nice challenges. Enjoy!
Chris
But neither did you put a reasonable projection in your model.
Current generating capacity is 2TW - or about 1.5TW including capacity factor - so let's assume we want to be able to replace 10% of that per year to be able to keep up with fossil fuel declines.
10% per year is 0.15TW per year is (@ 20% capacity factor) 0.75TW nameplate capacity per year is (@ $1000/KW; see link above) $750B per year is about 1.5% of world GDP.
For comparison, the world produced 70 million motor vehicles in 2006; at an estimated $20,000 each, that's $1400B of manufacturing, or twice what's needed for that level of wind production.
So what does your model say if that kind of effort to replace energy is assumed?
Well, how much money is invested in fossil fuel E&P, and in FF generation?
Several $100B? Just redirect it...
Are you Paul Chefurka?
Yes.
Electric heat pumps will replace NG space heating. Maybe ground source heat pumps at that. Resistance heating can be used economically for spot applications though.
60 million electric bicycles and scooters in China already.
20-30+ million being added this year and in each year going forward. Increasing the speed and range of 400-500 million bikers in China. Allowing a bike to car ratio to be far less than the USA and most of Europe. Expect a situation somewhat like Taipei, Taiwan. 5 to 1 ratio of scooters to cars. Roads unable to handle the cars which could be built.
superconducting power grid
http://advancednano.blogspot.com/2007/05/secure-superconducting-power-gr...
Superconducting motors
http://advancednano.blogspot.com/2007/04/follow-up-superconducting-motor...
The thermoelectronics mentioned and linked to in my comment above will all increase the efficiency of power usage.
===========
http://advancednano.blogspot.com
Ok, several major complaints about this.
First, your first figure is nonsense. Energy, GDP, and population have indeed all being going up, but that's about all you can conclude from a figure where the (logarithmic!) vertical axis is scaled so that they are all almost flat. In fact, the percent increase in population from your figure is the least, increase in energy is next, and increase in GDP is far more. They're really *not* that closely related. Rescale the vertical axis to only show the range 2000 to 10000 and we'll get a better picture.
Second, assuming population will exactly track energy use through some ratio is just obviously wrong. People don't die just because there's a little less energy to go around. Right now the fraction of the world at poverty level is the lowest it's ever been - 15% or so; there's an awful lot of room for economic tightening before death will intervene. You need to read Malthus' "Essay on the Principle of Population" to see the sorts of constraints that in reality lead to increased death rates like the Irish potato famine, plague, or droughts in China of the time - nothing that's been proposed in this essay will cause anything like the death rates you talk about. The only thing that could do it is large-scale war over remaining resources; that's possible but still unlikely to cause that level of death and destruction.
Third, making single-scenario projections is I suppose a good way to get some sort of look into the future, but every number you quote should have error bars or be considered as part of an ensemble of scenarios to have any sort of predictive power. What's the uncertainty on your population estimates? You don't know because you haven't worked out realistic ranges for the input scenario numbers.
Fourth, when you average over a number of different growing technologies - as you acknowledge to some degree you are doing for renewables - you are always underestimating the long-term potential. At some point a new technology will reach an economic tipping-point that makes it actually cost-effective on large scale, and then (like the internet in the late 1990s) it explodes and its scale after "explosion" bears little relation to its previously small scale beforehand. No renewable technology has reached that tipping point yet, but there's no physical reason why they can't as alternatives grow more costly.
And that pretty much negates the entire argument.
"No renewable technology has reached that tipping point yet, but there's no physical reason why they can't as alternatives grow more costly."
Actually, in the US, in some locations, wind is cheaper than natural gas for generation, and solar has reached parity with retail electricity rates. As wind & solar get cheaper, and gas gets more expensive, those areas will expand.
I think we're already at that tipping point.
Peak Coal in 2025 and 1% decline in 2100 implies a 75 year plateau. I doubt that production can be sustained as declining EROEI, climate change and radical environmentalism makes life unbearable for the industry.
I'd like to see a similarly wide ranging anti-doomer prediction (if one exists) so we can judge which looks more plausible.
It would look so different you would even be more confused.
Second,
"This technique has a couple of shortcomings. First, it aggregates all renewable energy sources: geothermal, solar, wind, biomass etc. Because some of these sources are still in their infancy, it is possible that they may exhibit higher growth rates in the future, thus making the projection too conservative."
This is an extraordinary understatement. This aggregates stagnant sources with fast-growing wind/solar. This heterogenous group is growing 4% per year, and wind/solar are growing 30-40% per year. This is an error of about 10 to 1!!
This really is indefensible. You wouldn't aggregate coal, oil & gas in one projection, and expect anyone to take it seriously, would you? This is a core part of your analysis, and it just doesn't work.
Part of the problem is that EIA data is old: 2005 data is 2 years old, at this point, and the "breakout" of wind isn't visible yet. 20% of 2006 new US generation capacity was wind. At this point the US organization of utility System Operators has received interconnection requests for about 120GW of renewables (almost entirely wind). Only about 330GW of wind would be needed to replace gasoline in the US (3GW wind turbines @30% capacity factor, 210K light vehicles, 12k miles per vehicle, and .35 KWH per mile).
It may be difficult to identify where wind/solar would plateau, but you have to do your best - this just is inadequate as the basis for anything close to "scientific".
"My belief is that we will hit a plateau with renewables that's somewhere around the same level as nuclear and hydro, and that all three sources will suffer because of a loss of global industrial capacity due to oil and gas depletion."
This really is circular. If renewables provide sufficient energy, they provide sufficient energy.
"The advocates for renewable energy sources like wind and solar appear to feel they will supply a lot more than that. So far the main reasons I've seen amount to "Because they can" and "Because we'll need it"."
And yet the OP analysis doesn't provide any basis at all, except for the deeply flawed projection of inappropriate data discussed above.
I understand your point about the tech bubble, but it's worth pointing out that 1) companies went under, but telecom & IT sales recovered and started growing again relatively quickly, and 2) renewables are entirely different: the tech bubble was based on almost no income: just look at that EP ratio. OTOH, wind projects are now well justified economically from the get-go with high oil & gas prices - that's one reason it's growing so quickly (of course, wind turbine prices have jumped, to ration supply, so there are some marginal projects that are pushed out of the realm of economic justification, but that's temporary until wind manufacturing catches up).
Please reply. I know you've discussed the difficulty of this issue elsewhere, but given our success in resolving my first point; the credibility I hope that established for me; and the importance of this point, it's worth pursuing. Otherwise, as you note, it appears to be an argument of arbitrary assumptions, with the assumptions with which you enter dictating the conclusions reached.
Certainly breaking out wind, solar and biomass would be a good idea. My initial instinct was that "renewables" wouldn't amount to a hill of beans. They still may not, but it would be good to apply appropriate assumptions to each. Just as I want to tighten up my analysis of nuclear power, it would help the presentation. And it would help differentiate my beliefs from the data.
The discussion has been very useful in terms of giving me ideas for improvement. I'm toying with the idea expanding this into a triple scenario - the same thing, only with three sets of assumptions: War/Depression/Economic collapse, Business as Usual (close to what I have there now) and Technotopian Buildout. Doing that along with tightening up some of the data might give people something useful to sink their teeth into.
That's great.
I take it that when you say "breaking out wind, solar and biomass" you mean each would get it's own analysis. I especially don't have much enthusiasm for the growth prospects for biomass - I think it might provide perhaps 15% of today's liquid fuels, if on the one hand we do it properly (with return of needed minerals to the fields, etc), and on the other hand work really, really hard at it, but I don’t see biomass for electrical generation growing anytime soon.
FWIW, I do think that the potential of biomass for a niche role in electrical generation(perhaps 10-15%) would be an interesting area for analysis in the very longterm, as biomass is much, much more efficient for generation than it is for liquid fuels. Again, I wouldn't include it in near-term projections, as I don't think it will happen quickly, but in the very long-term, when you're considering how to eliminate FF's entirely, I suspect it will be very useful for that niche as a backup to help buffer the variance of renewables.
oops. "just look at that EP ratio" should be "just look at that PE ratio".
The one problem I see with your proposal is it suffers from the same problems that models of the arctic melting it does not correctly handle feedbacks.
With feedback conditions one would expect for example or efficiency of extraction would decrease. For example Iraq the rate of oil production is well below remaining reserves. We can expect that as your scenario progresses the ability to maximize extraction of fossil fuels will degrade with time because of above ground factors.
So how might feedback effect your equations. If you use the Arctic as and example many prediction put the complete melting of the Arctic at 2050 instead it looks like this will be true by 2015.
So a conservative estimate of feedback effect is to predict that it would cause us to hit your endpoint of 2100 by between 2025-2050.
Considering its 2007 now this puts us effectively falling off a cliff within the next few years in both population and energy extraction as feedback loops grow.
What this means is your way off on your estimates of energy extraction post peak probably between 50-90%.
You population decline would also need adjustment. And with this rapid of a drop a pretty big overshoot at the bottom is reasonable so the end population by 2050 is probably less than a billion. Especially if you include global warming effects which will drop the absolute food supply available.
So focusing on food we could expect that our ability to product food will itself decline at say 5% or more a year from global warming, oil/fertilizer costs, water shortages.
Also as the population dies out in certain regions the ability to even produce the land and efficiently get food to market will degrade. What this mean is agricultural regions revert to subsistence farming and simply are not able to produce excess and get it to more distant markets.
Great work by the way but it suffers exactly the same flaws that the global warming models suffer so in my opinion it over optimistic to the point that its completely unrealistic as far as timing goes and you conclusions will play out over a much shorter time interval 25-50 years with the equivalent decrease in energy extracted.
What do others think about memmel's point here? Do "feedbacks" need to be better factored in? Would there also be feedbacks which would move the projections in an optimistic direction, perhaps balancing out those that move them in a pessimistic direction?
Are the feedbacks that would apply here too ambiguous and unpredictable to bother with in any significant way?
- John
http://growthmadness.org/
The argument quoted in the next paragraph is apparently intended to support an unrealistic assumption of very slow growth of renewable energy sources:
“Of course, the real world is full of unexpected constraints and unwarranted optimism. One such constraint has shown up in the field of biofuels, where a realization of the conflict between food and fuel has recently broken through into public consciousness. One can also see excessive optimism at work in the same field, where dreams of replacing the world's gasoline with ethanol and biodiesel are now struggling against the limits of low net energy in biological processes.”
This assumes that ethanol and biodiesel were developed to be energy sources. This is clearly not true: they were agricultural subsidies, and largely still are. You would agree, wouldn’t you? Therefore, if they become important sources of liquid fuels, or of net energy, it would just be a lucky accident. If they fail, it’s not a failure of a well intended energy program. Therefore, it’s not an example of unexpected problems in energy programs, right?
This is said often. It would be nice to put this error to rest once and for all.
Actually no, I wouldn't. They've been sold to the world as environmentally responsible replacements for petroleum. As far as I can tell, subsidies were put in place to stimulate development, but became the primary reason for the program once the producers figured out they were what was gilding the egg, and are the only thing that has kept it going now that the ecological issues have surfaced.
The idea that the push to biofuels was not at least initially an energy program is one I've never heard from anyone but you.
" "This assumes that ethanol and biodiesel were developed to be energy sources. This is clearly not true: they were agricultural subsidies, and largely still are. You would agree, wouldn’t you?" - Actually no, I wouldn't. They've been sold to the world as environmentally responsible replacements for petroleum."
They've always been sold that way, but (almost) no one has believed it for a second until the last few years. Now, of course, some people are really hoping it will perform, but ag subsidies are still the most important political force supporting ethanol: farm income has close to doubled in the last couple years, entirely due to ethanol, and it would be political suicide for a politician to try to touch it.
"The idea that the push to biofuels was not at least initially an energy program is one I've never heard from anyone but you."
Wow. Really? Haven't you heard of the "Ethanol Pledge", taken by all politicians in Iowa to maintain ethanol subsidies? Ethanol hasn't survived the last 30 years because it did anything for energy, it's because it was near and dear to farmers and food processors, especially ADM.
OK, here's some background info:
http://www.grist.org/news/maindish/2006/12/06/ADM/index.html
Does that help? If it doesn't convince you, please say so, because it really is true, and I hate to see people laboring under a misconception, especially when it affects their analyses.
Nope, that's convincing. I hadn't realized that corn subsidies went that far back. In that context, ethanol was obviously just another marketing tool to make sure the gravy train kept rolling. That makes ADM look even more morally bankrupt than I already thought they were - they knew corn ethanol would ruin the world, but they just didn't give a flying fig as long as the cash kept rolling in.
Thanks.
You’re very welcome!
To reduce population over a 75 year period from 7 billion to 1 billion means roughly 220,000 more people die each day than are born. Just reducing the birth rate won't fill that gap.
But it won't work that way I'll repeat my link.
http://www.adn.com/life/story/4430739p-4420683c.html
Its more like 500 million to 1 billion the first few years.
The key point thats being missed is regions will effectively have no access to oil products fairly shortly and food imports will stop soon thereafter. So thse society quickly collapses during the initial disruption few crops can be successfully planted and raised so food production initially plummets.
And the real killer various diseases set in. Once the epidemics are going strong the region will be isolated in attempt to prevent spread of disease. We have a high probability the new infectious diseases will emerge that are resistant to current treatments under these conditions.
The majority of the population will actually die from disease followed by starvation followed by war.
I think whats missing from this paper is how the carrying capacity actually collapses once the society becomes dysfunctional and the web of outside aid stops.
Imagine Africa or India with no oil and no external food aid. Or for Americans imagine Katrina/New Orleans and no one came to help. This is the sort of trigger condition that sets off the collapse.
Eventually of course Americans will turn their backs on other Americans I fully expect the Los Angles area maybe even all of Southern California turned in to a sort of forbidden zone and the flow of water south stopped.
A good excuse will be a quarantine for real or fictitious reasons. And I would not be surprised to see the use of biological warfare to hasten collapse in certain areas.
Potentially followed by neutron bombs to cleanse a region.
Man, what a program. Which party are you on? I wouldn't want to vote on you.
This is just a bunch of poorly researched assumptions how much energy one could get in the future and then some simple calculations how much population one might expect to have with that amount of energy. What makes it even worse is that lot of the assumptions are not believable at all like some commentators have kindly pointed out. I don't see any actual modeling done here. Not that modeling would make it any better, especially since what you get out of model is very much dependent on the assumptions you put in.
In one way it is a great piece though. It is interesting to see who buys this as credible analysis and who does not.
Just one point on more general level. Even though we might see big trouble when the growth economy starts to face the limits of fossil fuels and it might not be able to ramp up renewables as fast as needed, the resource base for renewables is vastly larger than what we currently use as energy. At some point, possibly after a time of turmoil, solar power and wind turbines are produced in quantities that make up for the loss of fossil fuels. It might currently take slightly more resources to get the same output, but both of them have a great EROEI even when combined with some methods to alleviate for their variable production.
In the long term I'm much more worried about the effects of climate change and population growth combined with problems in food production that are due to exhausted phosphorus mines, land constraints, dryness, erosion and contamination.
The wedge model is well known and understood your welcome to show how we are going to get out of the situation we are in without serious problems. And I'd love to see how we can magically handle the fact that a degrading system tends to lead to more collapse.
Whats presented here is nothing more than a slightly expanded version of the simple carrying capacity model used to analysis population growth and collapse in animal populations.
http://www.adn.com/life/story/4430739p-4420683c.html
You really don't need a complex model.
This is an unbacked emotional assertion. If you are going to criticize then provide your evidence, if you possess any. I am fairly certain that honest criticism of the model in order to improve it would be welcome by GliderGuider. But so far you have presented zero evidence. Please back up your assertions.
"The greatest shortcoming of the human race is our inability to understand the exponential function." -- Dr. Albert Bartlett
Into the Grey Zone
I admit that there's a streak of emotionality, but you miss the argument. I claim that the author has just come up with some numbers how much energy might be available and at what time-scale. The numbers are poorly researched and in the next sentence (that you didn't quote) I say that previous commentators have pointed out those problems. I don't see reason why I should go over them again. I also say that the author has apparently suggested a simple correlation between population and energy - an assumption which has been pointed out to be very dubious in the comment thread.
The difference between this and the world model from 'Limits to Growth' of Meadows et al is that here the author has drawn the timelines of energy usage himself. Meadows et al were making assumptions about resource, population growth and land use limitations, but then let the model sketch out the future trajectories. In here the author claims that this is a 'most likely future scenario' whereas Limits to Growth was an exercise to make the futility of infinite exponential growth appear as dum as it is.
I'm ready to admit that real models won't give you correct answers either, but at least they have some level of credibility. There's few of them out there, with the ones that deal with energy one should have a look at MESSAGE, IMAGE or Global TIMES. While one can disagree with some of the assumptions they have (and therefore the results as well), at least they do multiple scenario runs with a model that has lot of endogenous variables. The level of detail is something quite different from the exercise presented here.
Exactly. Thank you.
Interesting work.
I agree with the assumption that we are in over shoot regarding recources for carrying capacity of the present population.
Without any scientific numbers, i am a little sceptic though about the big impact of lesser available energy to carrying capacity.
If i take the only example that i know farely well is my own country. During WWII Sweden was practically blockaded. We had rationing on almost everything. Our electrical energy came mainly from hydro, we had no nuclear power. Still we managed(as Switserland did).
Today we have built more hydro power, and we have nuclear power together with a little renuvable like wind power.
The proportion now is about 50% hydro and 50% nuclear.
Why couldn´t we reduce our energy/capita to the level we had during WWII. And that would be a substantial reduction(have no numbers).
One problem is that we were 6 million people then, and we are 9 million today, and that gives the question if we can feed those extra 3 million from our soils?
But regarding energy, i don´t believe that is the biggest problem. And i don´t believe that population curves have to exactly follow the energy curves. We can easily cut down on our energy use with some hardship.
Well that,s only some humble non scientifical thoughts.
Hi Swede,
You might be familiar with a 1966 film by Henning Carlsen Called 'HUNGER' -Danish, Norwegiann and Swedish dialogue (I don't know about that but the subtitles here are in English)
If you know of it I am sure you can tell it better than me . The actor who carries it Per Oscarsson is brilliant and really puts across the feeling of a starving artist (writer). No MGM about this one. Photography B/W and spot on.
Let me know if you have any favorites maybe they have crossed the great barrier ... no not the ocean:). Found this quite by chance in the local Library.
Hi CrystalRadio
Good to here from you, i hope you are well and will prosper in this coming megacrisis.
No i have not seen that film, though i know that Per Oscarsson is a brilliant actor.
Sorry i have no favorites due to my overall lack of film interest. I see what happens to be appearing on TV. I like good films though, like "a few dollars moore" with Clint Easton, but that perhaps is not on your mind??
Best regards Kenneth
Hi again Swede,
I too enjoyed 'a few dollars more' but I just don't let on. :)
About agriculture and your increased population. If you, unlike us, haven't devastated the land with bad farming practices then there are many things that have been developed since the war that can make up that shortfall I think.
One innovation that will be of great benefit is that of garden polyethylene. I am using it for not only greenhouse but, with the overly generous amount of rain we get here in British Columbia, to shed rain from the garden to keep the fertility from washing away.
Many new innovations in standard glass green housing and in inexpensive irrigation, very simple things but important improvements since WWII. I am sure you can think of many things that are better now.
One thing I do wonder is how well your people have kept their individual gardening skills, here where I live hoes and spades are rusted and rotted, but the feed-an-weed lawns flourish. Much education will be needed here, but then we have the Internet to use for that ... for the moment anyway.
I do not have any doubt that you will be able to prosper in that megacrises. But good luck anyway.
I've been reading TOD for over a year now, but this article has upset me enough that I finally registered to reply.
I work in the field of wind energy, and the notion of renewables reaching a peak then declining makes no sense.
A more sensible model would be a saturation model, were renewables are modeled to grow rapidly (maybe 25-30% p.a.) until a plateau is reached. What is critical is not so much estimating the rate of growth but rather the level of the plateau.
Maps are available for wind and solar energy potential. By applying a production factor in terms of KW-hr/km2-year taking into account typical efficiencies, the % of land really usable, etc, you could guestimate the production plateau for wind and solar. Maybe a similar approch could be used for geothermal & wind energy.
Your over-all argument is circular: you say that renewable production will decline because of declining manufacturing capacity, but that capacity is declining because of energy shortages, partly because of declining production from renewables.
In the next few days I'll look at some of the wind farm projects I've worked on and calculate some KW-hr/km2-year ratios for real power production.
Regards
Two comments.
First, as any new technology, alternative energies potential as a replacement of traditional energy is being underestimated here. It is the failure of imagination, the pieces of the puzzle not yet discovered that gets left out and therefore missed altogether.
Second, to the naysayers of the population problem. Historically, human population has remained in a malthusian trap until the industrial revolution. That the introduction of coal, oil and gas to the system has contributed to the current population boom is not that much of a stretch. The other thing to realize is that for many areas in the world today the decline of available traditional energy is leading to declines in population today. Many of the poorest countries are operating without oil, gas, electricity and their populations are not rising and in some cases declining. Many of these areas are so bad right now there is no way to accurately predict what their populations are today, but they are lower than the official numbers. Zimbabwe comes to mind on this. Their population is likely under 10 million, but continue to be reported as anywhere from 13 million to 15 million. Somalia and Sudan are two other such locations. In the absence of energy and in the face of global warming, these societies are being obliterated. Darfur is described as genocide, but it would be truer to call it ecocide. Humans fighting over vanishing resources. That is one of the cautionary tales of Africa as we watch, humans do not just lay down and die in the face of scarcity - they fight each other all the way.
Did God just tell you that or I just have to swallow your words for it?
Oh, right.
Yes, it is a very troublesome report. I wonder how much energy they are consuming, and how much we, in the civilized earth, will be consuming in 20 years, 30 years. Will it coincide? I guess not. Humans are also not only fighting over vanishing resources in these regions, as a regional unpeturbed event, it is a major money struggle that has international implications. Darfur has oil.
It is also a ethnic and religious conflict, just like in Jugoslavia.
But the worst case scenario is 500 000 deaths, and not the millions you would like it to be. This would mean a 10% deaths in 3 years. Mad Max? Totally. It is even according to this 3% death toll scenario this thread defends.
Will it scale throughout the world?
No.
Why not?
Because these local genocides and ecocides have happened for MILLENIA.
And so the red herring that Darfur ought to be, is not.
Touched a nerve. I don't think you have any background in this area have you.
I think the most readable discussion is found in the book A Farewell to Alms, by Gregory Clark, there is the Malthusian Trap, there is a fairly well known simulation using Malthus' inputs to his paper done in 1989 by Clark and McGinley. This was not out on a limb stuff. The rise and fall of population from 100,000 BC to about 1800 followed MALTHUS. Remember he was writing in 1798 and just observing a historic trend.
There was no precedent of the impact on population from something like oil, and the impact on population and well being is therefore built upon this added source of energy. But it is not a divergence from Malthus, because his premise was that new technology could support greater population, but that the well being of each person would not improve. This actually is true for most of the world, where each technical advance is met by population.
The uniqueness of the last 200 years is that the technical advance in the devoped world was met by LOWER fertility.
As far as population pressures in the developing world, it is like peak oil. The press will attribute the population pressures to everything but what it is, resource competition among where a group of people are falling below subsistence level. Darfur is the perfect example. They don't need oil, they need water which is a conflict by herders and planters over the resource of water.
Congo is a country where perhaps six million have died. A researcher in Zimbabwe has estimated the actual population on the ground at seven or eight million, not 13 million. Two million are known to have emigrated to South Africa which leaves four million unaccounted for. yet the population is still reported anywhere from 13 to 15 million people.
You can attribute the 'cause' to what you want. Ineptness is as good as any. I think in Malthus' treaty inept government was attributed with the greatest single cause of declines in subsistence for populations. The fact is that the absence of oil has left Harare without electricity as is the case for over half the countries in Africa. The price of wheat going over $9 per bushel has meant that many of these areas have been getting only 1/3 of their grain allotments from Aid agencies.
One must also remember that the technology supporting population in Africa is the West, and with higher prices we can do less.
But I guess we will see who is right in this matter. The peak oil naysayers have been around since the beginning, and now we must contend with the population tied to energy naysayers.
Name some.
Name some, and provide evidence that their population decreases are due to energy decreases, rather than some other cause, such as rampant corruption and mismanagement of the economy leading to massive emmigration (Zimbabwe).
The only regions I'm familiar with that have declining populations are Western Europe (no energy problems), Russia (major energy exporter), Japan (rich but old), and a small number of sub-Saharan countries with protracted wars and/or jaw-dropping levels of corruption and mismanagement. There are certainly countries which are having energy problems, but the ones I'm familiar with (e.g., Bangladesh) still have increasing populations.
The recent population report from the UN has stated that populations will be declining in 50 countries around the world by 2050, and perhaps as early as 2030 (including China). Also when China passes into decline, according to the UN, global population would begin to decline. The rapid declines in fertility is surprising anyone who studies it. Countries like Brazil and Mexico now have fertility levels that have fallen to or are approching replacement levels. Zimbabwe fertility has collapsed from 6 to 3. Botswana's population is decline today. South Africa's population is forecast to begin declining within ten years. Fertility is usually highly resistant to change, with behaviors being a culturally maintained in regions, and the declines are mystifying. I would argue that declining available energy per person, falling food levels around the world on a per person basis and a declining sense of well being impacts population. What a concept. Who could possibly imagine that if you have no energy, No oil, no electricity, no food that fertility goes down.
It is the folks who say everything is fine and will keep on growing who need to explain to me how things can continue as they are when the quantity of available oil falls by half, natural gas and coal by 25%, where global warming decimates food production, and rising temperatures contribute to rising tides of disease with an ever greater spread, how that would NOT impact human population. It simply does not make sense. Just the fabled graying of the human population makes us vulnerable. Older people would be more susceptible to almost anything that came along, and eventually our gray population passes on and rising death rates in the face of lower fertility.
There is something called demographic momentum so nothing happens overnight, but I don't see anything in the discussion here or the graphs suggesting catastrophic decline, but a 100 year transition.
So for everyone who have their shorts in a bundle here, just remember, 10 years ago you would have had your shorts in a bundle over something called peak oil.
Humans can, it is beasts that can not!
I doubt many here have missed many meals and fewer that have gone hungry. The closest this continent has been to real hunger is the Great Depression, but I think that was bad enough in spots, yet what I have heard of it tells more of cooperation than fighting, but then what do I know, I missed it too and maybe it was nothing but mayhem and cannibal stews. Geez, this spell check knows HUNGER! I spelled cannibal as cannible and the damn thing just kept coming up with HUNGRY. No kidding!!
There's no evidence for population decline in Zimbabwe, Somalia or Sudan.
If you could propose a realistic plateau given technical, logistic and capital constraints I'd love to hear it. Projecting the growth of renewables seems to be one of the more contentious aspects of speculating about our energy future.
In comparison it's interesting how few comments there have been about my projections for fossil fuels.
Glider Guider
OK, then i will make a comment about your projections for fossil fuels.
The part that startled me most in your essay, was the projection about export oil. The picture says, that the amount is ZERO year 2013. That gives us only 6 years left. For me this sounds totally unbeliveable, but on the other hand i am ceartainly not in the know of theese matters. I read TOD and other sites, but don´t do any own resarch.
I would appreciate if you could tell us more about how you are so pessimistic in the export oil matter.
That graph is primarily useful for its shock effect, and to hammer home the point that the considerations that apply to the 38 mbpd of oil exports on the international market are qualitatively different than those that apply to the 83 mbpd that we usually talk about around here. The message is that those exports can go all the way to zero under the right conditions. The fact that a simple trend line laid over the existing data makes this point so clearly is a happy pedagogical accident.
Like all other trends this one will not play out undisturbed. If the trend has any validity I expect that by the time global exports have dropped by 25% (say to 30 mbpd) we will see major geopolitical actions on the part of the major industrialized importers like the USA, China, France and Germany. Some of this may involve plain mercantilism, some of it may be economic warfare, some of it could be outright military action. If the big players manage to secure their supplies it will be at the expense of the small importers (who won't necessarily have small populations). That will push them further down the energy ladder and perhaps in some cases off the bottom rung.
This could happen in a world where the total oil supply has declined only by 10 or 15%, well within the range that the optimists feel can be mitigated.
There is a limiting factor to falling oil exports: export revenue.
OPEC countries like KSA couldn't possibly stop all exports: they'd collapse economically and politically immediately.
Now, rising oil prices will buffer falling exports, but exports will remain high enough to stabilize export income near current levels - you can depend on it. If exporters have to raise domestic fuel prices (like Mexico) or ration (like Iran), so be it.
Wouldn't you agree?
Once can specuate that there should be some oil being produced domestically for a while after the crash, and while the crash is going on. I think the question will be significance to the entire remaining population. Clearly once the dust settles there will be some oil extraction going on, but the degree of volume and the importance to all of "society" will be questionable. For the sake of argument one can easily argue it will essentually be zero or near to it for North Americans.
The Middle East I suspect will continue to drag out what they can for their own use, I highly doubt they will export much, unless they are conquered.
Richard
London, Ont.
No one is ahead of their time, just the rest of humanity is slow to catch on.
OK, here's a few facts from memory (I was too busy to check the stuff at work today):
If you divide nameplate capacity by the spacing between turbines squared, you get a theoretical power density of 12,500 kW/km2. The average capacity utilisation rate for an average hub-level wind speed of 7 m/s (typical for most areas where wind farms are installed) is around 30%. Because of mimimum spacing requirements from roads, houses, etc. & availability of reasonably level ground in hilly areas, the usable area is around 10% to 20% (lets says 15%). So multiplying all that together with 365 days and 24 hours you get (with rounding):
12,500 kW/km2 x 30% x 15% x 365 x 24 = 5 x 10^6 kW-hr / year / km2 of potential power production in areas where average wind speeds are around 7 m/s.
You can download wind resource maps from various sites. Here's one that I find interesting for the US: http://rredc.nrel.gov/wind/pubs/atlas/maps/chap2/2-11m.html. Notice how North Dakota has an interesting wind potential. If approx 80% of N Dakota has an intersting wind potential, and the area of N Dakota is 183,000 km2, then the potential wind energy production from North Dakota alone would be 730 x 10^9 kW-hr/year. In 2005, total US electricty production was 4055 x 10^9 kW-hr/year, so wind energy from North Dakota alone would be sufficient to supply 18% of the US electricity supply.
However this is very conservative because in North America, in any case, by far the most interesting wind resource is offshore, especially off the coast of Eastern Canada, as this map shows: http://www.windatlas.ca/en/maps.php
The current cost of wind energy is running at around 10 cents/kW-hr. Of course if we want a penetration over 10% we would need to invest more in electricty transport networks and large scale water pumping schemes, so the real costs wopuld probably be double this.
One of these weekends if I have the time I'll try to do a similar calculation that I did for North Dakota, but for the world, including shallow offshore areas near the coast, but I think that my North Dakota example shows that very large amounts of power can be generated using wind.
Now when you add to that Solar power in the SW USA, geothermal along the Pacific ring of fire and hotspots like Yellowstone, tidal power in coastal areas + still undevelopped Hydro potential, especially in the Canadian Shield, I'm convinced it would be possible for North America at least to one day produce as much electricity as we do now all from renewables. The real question is not if its technically possible, but how much will it cost and how fast can we invest in these new systems, in particular can we ramp up production of renewables as fast as the fossil fuels are depleted. Personnally I'm very optimistic, although we're going to have to accept that 20 or 30 years from now we'll probably be paying 2 or 3 times what we do for energy than we do now (in real terms). People will just have to tighten their belts and adapt, but that's a far cry from 75% of us rolling over and dying, which is what your study concludes.
Regards
Absolutely.
While I would add that there are also capacity-based limits to the level of growth, we could replace 10% of the world's generating capacity (actual, not nameplate) in a single year by using about half the manufacturing currently devoted to building cars (see above), it's not clear that that will be a significant limit.
Do you have any ideas on how to build a reasonable model of the future of wind power, given the assumptions on fossil fuels that the author has made?
The most important aspect of that plateau is that it would only exist in the exact moment no more energy would be required.
For if there are some limits to water dams and geothermal (though geo has a lot of potential, it is only very expensive), I can't see many limits for solar panels, wind turbines, wave generators, and the likes.
So, in terms of energy speaking, I don't see a limit, only a difficult bottleneck that has to be passed through.
The hard limit on solar, wind, etc. is when the energy required to maintain the system is equal to the energy produced by the system. Assuming that it is even possible for a renewable energy system to produce enough energy to create itself.
--
Jimfive
I'm not quite sure what you mean. In any case, the E-ROI of wind and solar are more than high enough.
I'm talking about maintenance and diminishing returns. At some point the manufacturing capability will no longer be producing new generation, it will be repairing/replacing current generation. At some even further point, it won't be possible to create new manufacturing facilities because too much of the current facilities' output is required just to maintain the system.
That is the hard, theoretical limit on any type of infrastructure creation.
If you prefer an analogy, think of roads. The first 10-20 years of road building is easy, you can build a lot of roads for your money. But then the roads start needing repair and eventually the repair costs make it impossible to continue both building new roads and repairing old roads. At that point, the milage of usable roads stops growing.
JimFive
"At some point the manufacturing capability will no longer be producing new generation, it will be repairing/replacing current generation. At some even further point, it won't be possible to create new manufacturing facilities because too much of the current facilities' output is required just to maintain the system."
First, wind and solar have very, very low maintenance costs, lower than existing generation.
2nd, Let's be clear on E-ROI: wind & solar put out 20-50 times as much electricity as is required to build them, and they require even less energy to maintain.
3rd, you said: "The first 10-20 years of road building is easy, you can build a lot of roads for your money. But then the roads start needing repair and eventually the repair costs make it impossible to continue both building new roads and repairing old roads. At that point, the milage of usable roads stops growing."
I'm not familiar with any examples of what you're talking about. I'm not convinced that roads are a good analogy for electrical generation plants, but let's assume for the moment that they are:
I've seen plenty of examples of municipalities complaining about road maintenance costs, or having difficulty with rising asphalt costs that make their previously planned budgets inadequate, but I've seen no evidence in the US of road systems that were planned for a certain size, but couldn't be built because maintenance costs became too high. Could you elaborate, and provide real-world examples?
I think you are worried about this being some kind of perpetual motion machine. It is not. The Sun provides the energy. One of the problems for renewable energy is that the benefits are so long term. The copper mined to make the coils of a generator in a wind turbine stays mined. It can be reused over an over again as a turbine is refurbished or recycled. We pay the up front cost for centuries of use. Similarly, the towers will last long past the period of time over which they are financed. We're giving huge freebees to the future. For solar, part of the cost is in purifying silicon. But once it is purified, it stays that way. Solar power thus gets cheaper with time because it only takes about a third as much energy to recycle a solar panel as it takes to first make it. So, a renewable energy system acts quite differently than the current system. Instead of grabbing the easy stuff first, we do the hard thing first. Instead of having more and more difficulty in obtaining energy as with oil, it gets easier and easier to harvest energy. It probably takes about seven generations to reach an asymptote of prosperity as these benefits are realized. But then, it is foolish to attempt to look much further than this. The seventh generation will have had time to consider energy issues at leisure to decide if they are of any great concern.
Chris
Yea, I really want to see the actual numbers not the "capacity" numbers, but the actual output these windfarms produce. My understanding is at best 30% of capacity. Correct me if I'm wrong, but the capacity of a wind turbine is maximum at 50-55km/hr. Drop the windspeed by 50% and you get 1/8th the output (20%) because the energy in wind is to the cube of the speed.
Now as for total requirement, I did a quick calcuation on this. Ontario uses 15 billion litres of automobile gasoline per year. How much electrical generation is needed to replace that? It's a good indicator of how one needs to scale up alternatives like wind or solar. That 15 billion liters per year is 6x10^13 joules per hour. Now each nuke reactor is about 515MW (million joules per hour), so simple division. Include 20% line loss and you get at least 40 reactors more than the 12 we now have. Even if we could build 2 plants at once, that's 50 years to build. And just think of the massive amount of resources to build them.
So the scale of the requirements of alternatives is starting to show. But it gets worse when you look at things like wind power.
To replace that 15 billion liters of gasoline with just wind power would require 66,000 of them!! That would take us 300 years to build! Plus all the resources required to build and transport them into place.
Now granted wind turbines would not be used to replace all the gasoline used. But all that gas is not all the energy from fossil fuels either. And any mix of alternatives would have to add up to the total energy we consume in fossil fuels.
Solar panels are no answer either on a large scale. That farm in Sarnia Ontario is 1000 acres of solar panels enough to supply 7000 homes. But Canada has 250,000 immigrants each year. That set of panels will get swamped by new users connecting to the system in less than 60 days.
Thus it is very clear that alternatives can only supply a tiny fraction of our energy needs. Though in the future, post crash with a smaller, much smaller population, such panels and turnbines will be a godsend, saving their bacons. But only as long as they have the resources to keep them going. I suspect an all out effort to keep the power going will be number two priority after food.
Richard Wakefield
London, Ont.
No one is ahead of their time, just the rest of humanity is slow to catch on.
Let me repeat my earlier comments:
"The actual physical output is 20% of capacty "
Not in the US. It's pretty much 30%.
"As for turbines replacing gasoline, do it in joules per hour. "
That's not the right way to do it. Gasoline engines are about 15% efficient on average: the average US engine uses 6x as much energy, in joules per kilometer, as does an electric vehicle.
"How many have actually been built in the US so far, I can't seem to find a definative number, "
The US has about 13GW in capacity right now. Many of them are older, smaller turbines, so the number of WT's would be misleading, as no one will install small WT's in a wind farm these days.
Again, only about 110K WT's, or 330GW of wind would be needed to replace gasoline in the US (3GW wind turbines @30% capacity factor, 210K light vehicles, 12k miles per vehicle, and .35 KWH per mile).
OTOH, wind is growing fast. 20% of 2006 new US generation capacity was wind. At this point the US organization of utility System Operators has received interconnection requests for about 120GW of renewables (almost entirely wind).
"Solar panels are no answer either on a large scale. "
What is important for wind/solar are the $/KWH, E-ROI, and scalability, all of which are just fine for wind, and getting better quickly.
Solar is about 10 years behind wind in ramping up. Right now it's fairly small, and slightly too expensive, but realistically I expect it to be a standard item on all new roofs fairly soon. California is doing that, and the rest of the US will follow.
Roof top space is more than adequate to replace US generation with PV. Of course, I expect a fair amount of wind and CSP as well, but that's on the utility side.
I've been to a house that is set up on solar panels. He had 20 of them (at $1000 each) and 30 batteries (at $300 each) and he had to segragate the electrical panel so that only 20% of the electrical usage was on the panels. The rest on the grid (the big consuming items like the fridge and stove were off the panels). That's a lot of money for a small portion of output.
Also realize that the panels actually have to power not just the home but recharge the batteries. It can't do both. That means you have to have more panels just to charge the batteries. Than meant for this guy only 10 panels were actually used to power his house (20% of it).
Plus, those of us up here suffer short days in the winter. I have a passive solar greenhouse. Works wonderful when the sun is out. Even in the winter of -20C the greenhouse got above 30C inside. But the big problem was the number of sunny days was less than 17% of the whole time during the winter months (I tracked it every day from november to april). The rest of the time it was either dark or cloudy (7 weeks of it non stop dec to jan).
In the Long Emergency the author talks about his own experience with solar panels. He had 6 weeks of no power due to cloud. And then only very few electrical items could be powered.
the other draw back with solar is the batteries. They have to be replaced every 6-7 years at currently $300 each. That makes the whole system suspect for if one cannot replace them in that time, due to events we think will unfold, your screwed with a worthless, expensive, solar array.
All this technology sounds great in theory, but when it is actually put into practice there are severe limitations, many of which cannot be overcome. But few are willing to boldly point them out. Seems there is some sort of "politically correct" gag on limitations to alternatives.
Richard Wakefield
London, Ont.
No one is ahead of their time, just the rest of humanity is slow to catch on.
1st, there's less sun in Ontario than in most places in North America (though you certainly can go further north!). It's not the first place I'd put PV.
2nd, Canada has pretty cheap electricity, so that's another hurdle.
3rd, PV is still pretty expensive, in part due to a temporary scarcity.
4th, being off-grid with batteries is much, much more expensive than a hybrid PV system attached to the grid.
For all of the above reasons, I would never expect an off-grid PV system in Ontario to be anything like as cheap as grid power. That will change eventually, but not real soon. The best place for solar to start is, of course, places like the US Southwest, providing grid-attached peak power using time-of-day pricing. That will be cost-competitive without subsidies very soon, and the rest of the continent will follow gradually.
5th, I would never suggest that our future is 100% solar power (at least not for the next 30 years). Wind is larger and cheaper, and it's slightly stronger in winter and at night, and so provides a nice synergy with solar.
15B litres of gas is 500M GJ, or 140B kWh. Taking into account the 6:1 efficiency difference between electric cars and gas ones, that's about 24B kWh of electricity.
At a capacity factor of 30%, a 3MW wind turbine will produce 8M kWh/yr; accordingly, we would need 24B/8M = 3,000 3MW wind turbines, which is 24,000MW of nameplate capacity. For comparison, that's about the amount expected to be installed by the world every year between now and 2010, assuming business-as-usual.
Replacing fossil fuel energy with renewable energy is substantially more plausible than you appear to believe.
There's 158,237,172 joules per gallon (Imperial) (http://www.onlineconversion.com/) and 4.55 ltrs per gallon, that's 35,000,000 joules per ltr. 15 billion liters times this is 5x10^17 joules.
15 billion litrs per year is 1.7 million ltrs per hour which multiplied is 6x10^13 joules per hour.
A 3MW turbine produces at capacity 1x10^8 J/hr which means at full capacity 5,500 turbines are required, including 20% line loss that's 6,600 turbines. At 20% capacity that's 5 times that or 33,000 turbines. Big discrepency with your numbers (I've got mine on a spread sheet in front of me.)
For a 515MW nuke reactor means 40 reactors for the same gasoline. With 3MW turbines it would require 171 turbines for each reactor at full capacty, or 860 at actual capacity to replace 1 reactor. Times 40 gives 34,000 turbines. Same number. Sorry but yours has gotta be wrong somewhere (don't miss that there's 3.6x10^6 J/KwH). Do we have a chemist or physicist to check these numbers?
Even assuming the 6:1 ratio is actually possible, that 33,000 turbines drop to 5,600. Still at least double your calc.
Where does the 6:1 efficiency come in? 80% of the fuel in a car is used to overcome friction road, air and mechanics. The rest is to get from a to b. The friction will be the same, the only difference will be the mechanics. I'd like to see the efficency of 6:1 documented.
Also, you are using wind turbines of 3M, none here in Ontario are larger than 1.5, so you are assuming all twice as large turbines. Also building 3,000 world wide is a far cry from a single province like Ontario having (by your number) to building 3,000, at a cost of $6B. At the rate they are going up would still require more than 50 years to build that 3,000 (the 24 recently built near here took 2 years, not including the approval time.). Even with your numbers the US would have to build at least 30 times that for 90,000 turbines, and even if the US could build every 3,000 a year the world is trying to, would take 30 years.
These numbers of yours are assuming the 6:1 ratio (if the ratio is still 1:1 that's 6 times your 3,000, it could even be worse than that once the practical application of it gets going), does not include 20% line loss (mine does) nor downtime for repairs which requires back up turbines.
If we have to rush to build all this capacity, world wide, it looks to me that there will be competition for getting the resources and building turbines. Even if a full out war effort was attempted there is no way the US would be able to build the number of turbines required.
This does not include the batteries, billions of them, required to store the power to run the cars. From what I have seen posted TOD we have reach peak lead. There may not be enough lead left to do all this.
Thus my premise stays, even with your numbers, we will never be able to build them fast enough. Using the numbers I have it's impossible.
Richard Wakefield
London, Ont.
No one is ahead of their time, just the rest of humanity is slow to catch on.
"Where does the 6:1 efficiency come in? 80% of the fuel in a car is used to overcome friction road, air and mechanics. The rest is to get from a to b. The friction will be the same, the only difference will be the mechanics. I'd like to see the efficency of 6:1 documented."
Are you familiar with the Carnot limit? The idea is that the efficiency of a thermal engine like an ICE is limited by it's operating temperature. The very most efficient heat engines, like some gas turbines, operate at 60% efficiency. Diesel can get 40%. Gasoline engines can get 30% (like in a Prius), but their average efficiency in the US is about 15%.
In the US, WT's get about 30% capacity factor, and line loss is about 7%. Are you sure new WT's in Canada are so small?
"Are you sure new WT's in Canada are so small?" Yes. They just finished building some 24 turbines about an hour from me in Shelbourne Ontario. They are all 1.5MW and it took them 2 years to build at a cost of $1M each. I've gone by them on hot summer days when a high pressure ridge grips the area and they just sit there doing nothing.
BTW they were made in Denmark, shipped to Halifax and TRUCKED to Ontario. Nice energy consumption there.
Richard Wakefield
London, Ont.
No one is ahead of their time, just the rest of humanity is slow to catch on.
Yup.
Yup.
Nope.
As has been pointed out a few times, electric vehicles are much more energy-efficient than gas-powered ones. The number being thrown around is 6 times as efficient, so replacing those 15B litres of gas would take the joule-equivalent of 2.5B litres of gas, or 920 turbines running at full capacity.
They don't run at full capacity, of course, which is how I got the figure of 3,000.
"Transmission and distribution losses in the USA were estimated at 7.2% in 1995, and in the UK at 7.4% in 1998."
So call it 3,200 turbines.
That's simply false. Energy efficiency comparisons are easy to find; for example:
"Tesla Motors indicates that the well to wheels power consumption of their li-ion powered vehicle is 0.215 kwh per mile. The US fleet average of 23 miles per gallon of gasoline is equivalent to 1.58 kWh per mile"
Of course, that substantially overstates the energy consumption of the electric vehicle, since that assumed the electricity was generated by burning fossil fuels. The station-to-wheel efficiency, which is what we're interested in, is 155Wh/km, or about 10x lower than an average car. That was on the EPA highway cycle, though, so real-world performance will be somewhat less; for gas-powered cars, the EPA cycle is usually optimistic by about 10%, which would bring it down to 9x as efficient.
So 6:1 is probably a conservative estimate.
At $1500/KW x 3,200 x 3MW, I get $15B, which is 2.6% of Ontario's GDP. I don't see why you're saying this is impossible.
What is your evidence for this assertion?
You were talking about replacing energy, not replacing gasoline. Two different things - as I've mentioned elsewhere, the problem of replacing cars is about 10x as big as the problem of replacing energy.
Not that either one is too difficult, given a reasonable amount of time.
We haven't - see my posts in that thread. It is virtually certain that lead production dropped due to dropping demand.
You keep claiming this, but you offer zero evidence to back up your claim. The required level of manufacturing for Ontario's wind turbines is only 15% of Ontario's yearly manufacturing output, so it's by no means an impossible task when spread out over a number of years.
Based on that, I see no reason to consider your insistence that it's impossible to be at all credible.
Because the province is in debt to the tune of $100B and its second largest payment after heathcare is interest payments. The province pays almost 45% of it's income on healthcare. They just raised our taxes by $900 per worker per year to help pay for that. They are not even sure they can afford to build $10B in a new nuke facility, they have to because the province is currently subsidizing electrical importation from the US, let alone the costs of building so many turbines.
As noted before all the turbines are built in Demark and shipped then trucked to their sites. There are no plans to build them here, not yet anyway, until they prove their worth, if possible. the last batch of 24 took 2 years to build, and BTW was subjected to the NIMBY syndrom.
So no it's not possible for Ontario to build but a handfull of turbines every few years. It might sound simple in theory, but in practice it's not.
Richard Wakefield
London, Ont.
No one is ahead of their time, just the rest of humanity is slow to catch on.
J per gal 158,237,172.00
Ltrs per Gal 4.55
J per Ltr 34,808,000.88
Ltrs/yr in Ontario 1.50E+10
Ltrs per hour 1,712,328.77
J per hour 5.96E+13
ltrs per sec 475.65
j per sec 1.66E+10
J in kilowatt hour 3,600,000.00
nuclear power plant MW 515
" K watts 515,000.00
J in I hour 1.854E+12
plants required 32
Just for loss 6.43
Wind Turbine MW 3
" K watts 3,000.00
J in I hour 1.08E+10
plants required 5,519
just for loss 1,104
Thus total turbines 6,623
Due to 20% capacity x 5 33,113
If there's a flaw in my numbers please find it.
Richard Wakefield
London, Ont.
No one is ahead of their time, just the rest of humanity is slow to catch on.
Most current plants are twice that. New ones are three times that.
Not the Candu. That's its output.
Richard Wakefield
London, Ont.
No one is ahead of their time, just the rest of humanity is slow to catch on.
Q: is it correct about 20 000 kilo-calorie per day?
I think it should be 2000 kcal per day per person.
Martin
Yes, 20,000 is correct. That's non-food energy - wood and dung for fires, water power, animal power etc.
I am surprised it was so high around 1400 but probably if fire (wood )is included then maybe it is possible.
Martin
I find this post frustrating on many levels. Others have made very good points. One point I'll make is that I find it extraordinary to believe that humans won't learn from mistakes at the level of a 6 billion person die-off when various small extrapolations of existing technology can provide vast amounts of energy.
Nuclear, solar, wind have vast potential for scale up. I have my own opinions about which is likely to contribute more in aggregate in the long term but it is clear different countries will pursue different options and the countries that choose wrongly will likely learn from their mistakes.
We have had the technology to live a sustainable clean life in the US and export this lifestyle to the rest of the world for at least 50 years if not more.
We did not do it.
The reason we will in general perish is the reason we are facing the problem of a massive die off in the first place.
No one who objects to the scenario presented here is considering how the greedy ruthless human will respond to the coming crisis.
My answer is the same way we have to date driving around in SUV's while millions starve and die of Aids in Africa.
The only difference this time around is that the infrastructure is collapsing as we continue to behave exactly as we have to date.
To do any different requires a major change in how humans act and we can see from how global warming has been handled that this won't happen.
My position is that humans will get worse as conditions worsen WWII bears out this assertion. If you assume this then you realize that groups and nations will act aggressively and proactively to cause the failure of other groups. And as time goes on then ends will justify any means. Human life will not only be cheap but in general a living human would be a burden.
We probably will have a civilization based on wind/solar/nuclear form but it will be a lot smaller population benefiting than our current civilization and the political climate will be closer to Nazi Germany or Stalinist Russia. Democracy cannot survive.
Understand we got ourselves into the current situation because of our nature and political/economic arrangements.
Windmills won't fix this.
I agree, human behavior is the missing element in the discussion. This is the key to understanding the depth of the reactions and the degree of polarization here.
Some people believe that man is a rational, perfectable creature whose actions are primarily driven by his neocortex. Others believe that man is more limbic, bound by his biological heritage and conditioning. While neither is wholly true, any attempt to predict human response without taking into account both those influences is doomed to failure.
I see people like advancednano or Pitt the Elder as belonging mainly to the former camp. You, Darwinian and I are representatives of the latter. These are powerful psychological forces that inevitably shape our understanding of the world and our beliefs about its future.
The high probability outcome is of course somewhere in the middle - a planet of creatures that strives mightily to survive, but struggles with both internal and external limits. And in the process we end up paying so much attention to our own situation that we discount or even ignore the damaging effects we have on the rest of the natural world that shares the planet - something that may well come back to haunt us.
Exactly !!!
To put it in perspective we will say pull back from helping a African nation thats in collapse but the problem is it may have a critical mineral resource. This forces a confrontational situation for that resource which has nothing to do with the plight of the Africans in the country. So you can see as each group maneuvers to take care of itself it inadvertently causes its own condition to worsen.
The complexity of our global civilization effectively means that as groups become more selfish in general their actions only result in a worsening situation. Stopping cooperation always results in pain on both sides as far as I know.
Iraq is a perfect example of this.
No one asserting that things will be different or better has even attempted to address this issue and its the critical problem.
We can barely get electric rail on then agenda in some towns in the US right now.
And I'll repeat one more time to everyone that claims technology will save us. The technology needed to live a sustainable life style for the world has existed for 70 years and we have done nothing to convert.
6.5 billion degrees of freedom, 6.5 billion individuals making their own selfish and/or rational choices = chaos. And any system governed by chaos is inherently unpredicable. Especially when the choice of just one person can have an impact on millions, or billions of others. The butterfly effect coupled with the law of unintensional consequences.
Richard Wakefield
London, Ont.
No one is ahead of their time, just the rest of humanity is slow to catch on.
I disagree. I submit the UK as an example of a country reacting to global warming.
My evidence? The UK Labour Government U-turn on Nuclear Energy. There was a rather weak political constituency for Nuclear within Labour and yet the Government did a politically damaging U-turn on policy to bring Nuclear back as they realized they needed it to reach the GW targets.
My point about losers learning from winners will be played out in countries across Europe and States with the USA.
Will renewables scale up to provide a sizable fraction of grid energy? We need only watch the competition between France and Germany. France will maintain and expand their Nuclear infrastructure. Germany have decided to phase it out. Who is right? Time will tell, but I bet the loser will suffer a few blackouts and change course well before even 1% of the population starves to death.
Learning takes time. This model indicates that there is very little time left to do the learning.
As to different countries making different choices:
So far we have not turned up any good choices on this list, so I wonder how many countries will find good choices. And the consequences of poor choices are so dire that I wonder how many countries will survive (a necessary pre-condition for learning).
Your ascertion still does not solve the problem. Even if you are correct the population MUST collapse at some time. Prolonging that with technology and alternatives will just make the situtation that much worse for those in the future. If we really want to help people, then think of those who make it through the crash. Those of us here and now are basically writeoffs. We need to protect our knowledge and technology for future generations. It's the only thing left of value we can pass on.
Richard Wakefield
London, Ont.
No one is ahead of their time, just the rest of humanity is slow to catch on.
" Even if you are correct the population MUST collapse at some time. "
Not at all. It's perfectly possible for humans to learn to live sustainably. Not easy, but possible.
The most important aspect of every analysis I see of a sustainable "footprint" is energy, and that's solvable. Others, such as habitat destruction, overfishing, soil loss, all have technical solutions. Will we employ them? That's not so clear. I'm not so optimistic about greatly mitigating climate change or meagafauna species extinction - those will be great tragedies, but I don't see population collapse as a certain result.
You cant have a sustainable society when you have a reproducing population. In biology there is no such thing. Populations rise with increased resources and crash when they overshoot. Every species over geological time follows that fact. We are no different, we've just been putting it off with cheep oil. And now Nature is coming with her hand out demanding payment.
What you are asking for is to allow people to only have children when someone else dies. World wide how would you enforce that? Religions alone would stop any attempt, especially religions that reward people for multiplying.
Thus eventually the human population will hit a point of over population, regardless of what you attempt. That means a crash of some kind.
Right Darwinian?
Richard Wakefield
London, Ont.
No one is ahead of their time, just the rest of humanity is slow to catch on.
"Populations rise with increased resources and crash when they overshoot. Every species over geological time follows that fact. "
No, that's really not true. That's not true for most of the countries of the world, where the fertility rate is below replacement. About 60% of the world has voluntarily (mostly on an individual level, but on a societal level in China) reduced it's fertility below replacement. The remaining major problems (as opposed to Mexico, where the fertility rate is above replacement but dropping fast) are places like Africa, and the Middle East, where prosperity and women's freedom remain distant dreams.
Nick,
For discussion, as you seem, at least passingly, interested in fertility:)
Take the case of a farmer and wife, they would produce many children because they were useful in that business and so provide more security. In the city where work and income are external to the family they are not essential for security therefore producing children would be limited.
One thought would be that it is not necessarily a question of wealth but more one of a desire for security that limits or increases birthrate.
Another that where the family is looked as a wealth producing unit for the prosperity of the whole, farm or nonfarm, having more members would likely be veiwed as a benefit and increase birthrate.
Third that a move now from city to country farm would result in an increase in population.
"Take the case of a farmer and wife, they would produce many children because they were useful in that business and so provide more security. In the city where work and income are external to the family they are not essential for security therefore producing children would be limited."
Sure.
"One thought would be that it is not necessarily a question of wealth but more one of a desire for security that limits or increases birthrate."
Well, things like Social Security and a successful career that generates savings, that reduce the need for support by one's children in old age, are a function of prosperity.
"Another that where the family is looked as a wealth producing unit for the prosperity of the whole, farm or nonfarm, having more members would likely be veiwed as a benefit and increase birthrate."
Sure. Family cohesion is often considered coercive by the members, so prosperity reduces it, as people have the money to leave.
"Third that a move now from city to country farm would result in an increase in population."
conceivably.
60% of the world? Nonsense, unless you're measuring by land area.
Europe, North America, China, Japan, Australia, NZ, Singapore and South Korea constitute far less than 60% of the world's population.
And even the US has just moved back over replacement thanks to the Hispanic population.
Then why is China's population still growing? World population is still growing and predicted to hit 9Billion by
century end.
Richard Wakefield
London, Ont.
No one is ahead of their time, just the rest of humanity is slow to catch on.
Not in Germany and Japan they don't.
You're assuming that human population will continue to increase until it physically can't, but you've done very little to back up that assumption. Since professional demographers disagree with you, though - the UN and US census bureau both project that the world's population will peak and decline this century due to demographic changes - it's probably not a valid assumption to make.
Nature is under no obligation to carry a species at a constant capacity forever. If this were true then all species would be in perfect population equilibrium. But we know that this is not the case, as species come into existence and die, just like everything else in life.
I am currently reading the book End of the Line by Charles Clover about global overfishing:
http://www.mvagency.com/endoftheline.html
The facts from End of The Line and Collapse fits in to the current post nicely. What Charles Clover and other environmental activists do not understand is the basis of our ability to destroy ourselves is fossil fuels. Overshoot has occrred and habitat destruction is so severe that carrying capacity wtihout fossil fuels has been greatly reduced. Jelly fish harvests in the middle of the ocean are not very useful for a population confined to small sail boats needing protein.
“Without a video the people perish”-Is. 13:24
My first comment on this site was for your May 7th post. I have to say that this post really builds on the last one. It fleshes it out more, while taking away most of what I found fault with the original. I really love the charts and everything. Even if they turn to be off a few years, they at least give us a rough guide, which is all we can really hope for. It will be interesting (and most likely horrifying) to see how things actually turn out in a few years. Thanks for all the effort you've put into this. Everyone has to see this.
Like I said back in May, I personally will not have any children. I feel that, for me, it's a moral decision...not putting down people who already have kids (like my parents!), though. Just that since at this point, we know this much, we have to act responsible. I wouldn't be surprised if forced sterilizations are part of the future. I'm personally of the opinion that China's "One Child Policy" (which often allows for more than one child, actually) is a great policy. Too bad that it's almost impossible to implement in a democracy. Then again, maybe even "democracy" might be a fleeting idea for those who had the luxury to benefit from it.
I'm 100% with your idea that we need to reduce our human population and do it now! And like I also stated, if, hypothetically, nobody on earth had unprotected sex starting tomorrow, then the population would start to fall in just 9 months without any horrendous starvation. Of course, that's just a dream, but people should remember that the fewer people who are brought into this world from this point on, the fewer will be taken out of this world prematurely.
Thanks for this post!
"Like I said back in May, I personally will not have any children. I feel that, for me, it's a moral decision"
This is why we have moral responsibility to be as accurate as possible with projections like this - we can't make arbitrary assumptions.
People are out there, reading and making life decisions.
a word of encouragement GG. pop & energy charts superimposed say it all w/o the details.thanks for working on the big, painful picture; giving it details.
I am in favor of renewables but still fail to see how they will power a techno-organism that is designed for high ERoEI fossil fuels. When will this switch-over begin? After our country is bankrupt and oil is at $200 per barrel? I’ve heard there is plenty of potential for renewables but apart from an occasional turbine blade rolling down the highway I’ve seen nothing.
The up-front investment in renewables will be tremendous not to mention many trillions of dollars for retrofitting the existing housing stock if it can be retrofitted at all. We will also have to renew our stock of vehicles. Perhaps we should think about reorganizing ourselves to do without personal vehicles. Where’s the money coming from? The Chinese? Sorry they’ve cut us off. Iraqi oil? I don’t think so. It’s getting a bit late to imagine a bright new shiny future. Why have detention camps been built? Why is law enforcement being nationally coordinated? Why the Patriot Act and talk of martial law? Not because of terrorists or the Bird Flu but rather because a metabolic collapse and all it entails is looming in our near future. I’m sure coal and tar sands will be mined at an accelerated pace but these will only serve as a palliative morphine for a dying patient and will push our climate further into the unknown.
When the big heart attack comes (loss of transportation of essential metabolites) all of the cells dependent upon that transportation will die. That’s why there are so many adherents for growing vegetables in the back yard, buying some PV panels and composting toilets. Our national heart attack will play out over a decade or two with many vain efforts to resuscitate a species whose time has come and gone.
GliderGuider has provided us with a thoughtful model for consideration. Some are panicked by its bleak prognosis and implied defeatism. They yell, “Renewables, renewables, rah, rah, sis boom bah!” I think many of us have been living in wonderland for too long. Watch the dogs and birds eating corpses on the banks of the Ganges because the families can’t afford enough firewood to properly cremate the remains of their loved ones. Where are the solar ovens, the solar cells, the wind power? If they can’t afford wood and high ERoEI fossil fuels then will they be able to afford lower ERoEI sources with high up-front capital costs?
Totally agree, I wish I could have put it as succinctly.
I really like to read about what is possible with wind and solar and it leaves room for hope but I just wish once they alternative advocates would explain how, when and who.
I wonder if the nuclear advocates have read anything about what is happening/happened with nuclear waste. It is terrifying from what I have read. Not just the USA but all over the world.
The plant in Palo Verde, Phoenix relying on effluent for cooling is astonishing to say the least.
If the population ever declines to the extent predicted, pity help the world if there is not enough specialists left to manage the running of these technical wonders.
What about all the plants built near the ocean. What will happen to those as the sea level rises?
http://en.wikipedia.org/wiki/Palo_Verde_Nuclear_Generating_Station
http://library.thinkquest.org/17940/texts/nuclear_waste_storage/nuclear_...
http://www.sea-us.org.au/wastenot.html
It is best to dig the well before you are thirsty.
So let's all hope settlement is in sight before matters get far worse. If you want to get an idea of far worse read World Energy and Population: Trends to 2100.
We support nuclear electric power for our Persian friends as part of settlement of these unfortunate matters because without nuclear power lots of Persians will likely face starvation in the dark and cold.
http://www.prosefights.org/nmlegal/nsalawsuit/nsalawsuit.htm#zavitz
I would suggest Concentrating Solar Power (CSP) instead. Faster, cheaper (assuming doing your own enrichment), better in the desert.
So much less controversial.
I hear people talk of "adapting to a lower use of energy" as if this will solve all our problems. They speak of the energy used by India or China, as if we just used no more than they, then all our problems would be solved.
We cannot "adapt" our way out of overshoot. In India and China the water tables are dropping meters per year. The rivers are drying up. The air is almost unbreathable. Their deserts are expanding. Their lakes are drying up and all the fish in them is either already dead or dying. And in much of the rest of Asia, and all of Africa, it is even worse. Japan, and others, are so drastically overfishing the world's oceans that it will take hundreds of years to recover. We are destroying the habitat of all future Homo sapiens. And we are destroying the habitat for all megafauna as well.
The only thing that could possibly be worse than peak oil would be no peak oil.
Ron Patterson
You know H. Sap doesn't have a "habitat", Ron. Only spotted owls and golden frogs have habitats. We live in houses...
I once asked this question on another energy/enviro board: If humanity suddenly developed cheap, safe, clean, easy nuclear fusion, might that have any downsides? Nobody could think of a single one...
GG, you are nitpicking......and wrong.
The habitat for the original hunter-gatherers was probably the savana. Because we depend on our wits for survival, we expanded that habitat to include the forest, the seashore, the arctic and just about every other habital place on earth.
If we did suddenly develope a form of cheap energy, it would not prevent the collapse, only delay it. During that delay the world's population would expand by three or four billions, meaning the suffering would be increased dramatically when the collapse finally does arrive. But that would only be part of the bad news.
During those extra three or four decades that this "new" form of energy gave us, we would completely destroy the environment. Water tables would drop out of reach or dry up completely, rivers would run dry, deserts would expand to twice their size, the air would become unbreathable, lakes would either dry up or become so polluted that all the fish would die, and virtually every species of megafauna would go extinct.
Ron Patterson
Sheesh, they need sarcasm smileys on this board.
I was kidding, Ron. I agree with your position right down the line, have done for a couple of years now. What you say was precisely my point. Nobody understood that we would simply complete the destruction of the world with all that free energy. Blind as endangered bats, the whole bunch of them.
I don't know. I think human floundering & desperation could do much greater damage than you've thought about. Nothing will accelerate "incinerating" the planet than economic collapse.
Look at what happened to pets, zoos and parks in New Orleans and Russia during bad times: the animals were in deep trouble. Look at what is happening to endangered species in Africa in war zones, and what is happening to archeological treasures in Iraq. Look at poor countries destroying their rain forests for crops (especially sad, the extinction of orangutans for palm-oil). Are we going to burn more CO2-emitting coal with plentiful energy, or scarce energy?
Nothing is so dangerous to our world as poverty, and economic collapse.
I'm not so optimistic about things going well with prosperity. For instance, with the chances of greatly mitigating climate change or meagafauna species extinction - those will be great tragedies. But, I think things will be much, much worse with poverty, and economic collapse.
That sounds much like John Michael Greer's theory of "Catabolic Collapse":
They certainly are related - I would expect that we would indeed tend to consume our capital if we started an economic collapse, and you can consider much of the natural world as part of our economic capital.
OTOH, much of the natural world is not part of our economic capital, like the orangutans, and would get destroyed just in the chaos of things. And, on the 3rd hand, I'm not sure natural capital is essential to human society - we could live in sterile skyscrapers with hot-houses, if we had to. It wouldn't be nearly as nice as having a good world to live in....
Collapse is not to be hoped for - our best path through is improving prosperity, health & welfare.
As another, really good example of this: the best way to reduce population growth is education, careers, income and freedom for women and elders.
Nick, are you hoping for a miracle from God? You are describing less than 10% of the population and there is very little hope of that percentage becoming any greater. If the entire world....hell, half the entire world....became prosperous as you suggest, then the energy consumption would have to at least double. That is not going to happen. Most of the world's population is poor, and getting poorer.
We can sit here and propose "what ifs" until the cows come home. But what we have Nick, is the world as it is. The world is not educated and never will be. The world is not wealthy and never will be. The population of the world will continue to increase until it hits its Malthusian limits. That is until the world can no longer feed its population, then and only then will the population increase cease.....and begin to decrease.
Stop dreaming and start looking at the world as it is, not as you would like it to be.
Ron Patterson
"Nick, are you hoping for a miracle from God?"
No, not at all.
"You are describing less than 10% of the population "
No, I'm really not. About 60% of the world has become sufficiently prosperous that it has voluntarily (mostly on an individual level, but on a societal level in China) reduced it's fertility below replacement. The remaining problems are places like Africa, and the Middle East, where prosperity and women's freedom remain distant dreams.
"Most of the world's population is poor, and getting poorer."
Actually, this isn't so. Most of the world is doing better. World income is growing by 5% per year, and in most countries that is sufficiently well distributed that the large majority of the population is doing better (even in the US, with it's unusually bad distribution of income, the majority are doing at least a little better).
"The population of the world will continue to increase until it hits its Malthusian limits. "
Nah. It will likely grow by about 50% by 2050, stabilize, and then start slowly dropping.
Sheesh. Now I can see why you're pessimistic, but your view isn't realistic.
Why not? What, precisely, are the insurmountable problems with scaling up wind and solar power? How can you say with absolute confidence that such a thing is impossible?
Wind, in particular, seems entirely possible. The total resource base is large enough, no rare materials are required, plenty of overall manufacturing capacity already exists, and it can provide baseload power via pumped storage, which is also simple to manufacture. What is the unavoidable show-stopper that makes you dead certain wind power cannot be scaled up to allow that energy increase?
Malthusian limits?
Malthus's limit was land mass.
PO-Doomers' limit is energy.
Eco-Doomers' limit is GAIA.
All assume direct causation. All are only partially true. Since humans are substitutionalists, it is difficult to consider such direct relationships.
All assume that we live in a closed system.
Instead, humanity continuously changes the borders to that system. If you can't find it on your island, migrate! if you can't find it on the earth's surface, mine for it! If you can't accomplish it on the molecular level, go atomic!
We do not live in a closed system. We live in a generally broadening system. It is not necessarily so, only historically so. PO will be a problem. Solvable? We'll see.
We do not live in a petri-dish but quite often climb out of the dish. Not always, of course, and that's why you get many Easter Islands in our history.
Humanity has limits.
These limits are not, however, of the Malthusian kind.
Cheers, Dom
Nick, of course you are correct. When things collapse, when people get very hungry, they will eat the songbirds out of the trees. But you seem to think that the alternative is prosperity forever. Nothing could be further fruther from the truth.
It is collapse now or collapse later. Those are the two possibilities, (but certainly not choices). We cannot go on destroying the earth as we are now. If the collapse happens in the next two decades, then billions will die, bush meat will be a staple and species will go extinct, even songbirds.
But if it happens four or five decates from now, even more billions will suffer horrible starvation and diseases brought about by malnutrition. And there will be no bush meat to be had because the animals will have already gone extinct. More of the earth will be desert, most lakes will be cesspooles, even the oceans will be a lifeless desert.
I repeat, the only thing that could possibly be worse than peak oil would be no peak oil.
Ron Patterson
" you seem to think that the alternative is prosperity forever. Nothing could be further fruther from the truth."
Well, now, that's the key question. I don't see proof of that in the OP here, and I haven't seen it elsewhere. Other analyses that I've reviewed, like Limits to Growth, all use energy as their most important element of human footprint, and rely on an assumption that it will necessarily be inadequate, an assumption for which I can find no support (note how I phrased the assumption - "necessarily".
Have you seen a reputable analysis that comes anywhere near proving that prosperity is unsustainable that does not rely on energy?
We will use less coal if we are more prosperous.
Now you are getting reeeediculous! There has never, in history, been prosperity without energy from slaves or from surfs, or from fossil energy. And the first two were always in a world with only a tiny fraction of the present population. And in all three cases only a tiny fraction of the world's population was ever truly prosperous. Fell fortunate Nick, because you are among that very tiny fraction.
The world is Nick, as it is. The world is not as you would like it to be. The world is not like you think is possible if, only if, people would behave this way or that way. People are as they are, not like you think they should be. Look at the world as it is. That is all you have and all you ever will have. You cannot look at the world and say…”but if people only behaved this way or that way then prosperity for everyone is possible.” People will behave as they are now behaving. They are behaving in that manner because it is of their nature to do so. It is called human nature and it is not going to change any time soon. If you could only understand that simple fact then you would stop living in a dream world.
Ron Patterson
"There has never, in history, been prosperity without energy from slaves or from surfs, or from fossil energy"
The prosperity of Europe in the Enlightenment started well before coal began to be used - wind & water power had a lot to do with it. There's nothing magical about fossil fuels.
"The world is Nick, as it is. "
Sure, and it's a lot better than you think. I appreciate that you feel the world is a terrible place, but if you want to convince me that it's going to hell in a handbasket, you'll have to provide some hard evidence: numbers, sources, etc. I've provided some, it's your turn.
Surley you jest! The only prosperity of the Enlightment was won on the backs of the surfs. As I said, only a tiny fraction of the earth's population has ever prosperous at any one time. Did you miss that line? Here is a typical French village during The Enlightnment:
Nick, there has always been tiny pockets of prosperity, but there has never been, in the entire history of the world, prosperity of the majority of the world's population. The times of The Enlightnment was a most terrible time for the vast majority of the earth's population.
Again, let me repeat my assertion: There has never in the history of the world a time of prosperity for more than a tiny fraction of the earth's populstion.
Ron Patterson
"The times of The Enlightnment was a most terrible time for the vast majority of the earth's population."
My point was narrow: that substantial economic growth, and improving living conditions, began before fossil fuels.
"There has never in the history of the world a time of prosperity for more than a tiny fraction of the earth's populstion."
Are you arguing that this is the case today? I think the large majority of the population of the OECD countries, as well as many other countries in which the majority of the population are doing reasonably well, plus a substantial fraction of places like the BRIC countries (Brazil, Russia, India, China) constitute rather more than "a tiny fraction".
Around the world, even people in relatively miserable places like Chad live 45% longer (57 years) than the average life expectancy in the US in 1900 (40 years).
The majority of people in the world feel safe enough, and prosperous enough, that they're willing to have less than 2.1 children (the replacement rate), because they expect to be able to take care of themselves in their old age. They're also willing to have fewer children because infant mortality is down to historically astonishingly low levels in most of the world, less than 1%. This is both a result of prosperity and a direct measure of social well-being.
People are more prosperous today because of fossil energy. That was my whole point remember, fossil energy, slaves or surfs. But the OECD is only about one sixth of the world's population and a couple of OECD nations are really poor, Mexico and Turkey for instance.
And much of the rest of the world is really poor. In Sub-Sahara Africa the lifespan is under 50 and they have desperate poverty as a rule.
You seem to be woefully unaware of the poor living conditions in most of the world.
Ron Patterson
"People are more prosperous today because of fossil energy. "
No, they're more prosperous because of energy in general (as well as other things, like rising technology), including a fair amount of nuclear. Energy is mostly from FF's lately, but FF's are not mystical, magical things - they can be replaced by other forms of energy.
"a couple of OECD nations are really poor, Mexico and Turkey for instance"
Sure, but they're still doing much better than historically, and Mexico, for instance, has reduced it's fertility to just above or at replacement...which is where this particular discussion started.
"much of the rest of the world is really poor. In Sub-Sahara Africa the lifespan is under 50"
and yet that's still above the US in 1900.
" and they have desperate poverty as a rule."
Sure, but Africans are also only 10% of the world population.
"You seem to be woefully unaware of the poor living conditions in most of the world."
Compared to what? They're much better, on the whole, than they were historically. Sure, there's a lot of misery in the world, but...I'm not at all sure what your point is, here.
Again, most of the world has gotten it's fertility down to replacement or below, and a large portion is close behind. The remaining stubborn areas are a relatively small %, perhaps 20% of the world.
It's pretty clear that pop growth is slowing down, and moving to a plateau around 2050. If you don't agree, you've got a lot of professional demographers who'd disagree. You may not think that's fast enough, but it's certainly not limitless exponential growth, as is often mistakenly thought.
This is exactly the drum I keep beating its trivial as oil usage declines to create a society where a few live a very good life. Attempting to sustain and expand the middle class is hard.
I'll post this later since its buried deep in a long thread.
Considering that part of how people are now behaving involves massively scaling up renewable energy while trying to figure out how to reduce carbon emissions, it's not so bleak as you suggest.
You appear to be concentrating solely on the bad things people do; that's not the whole story. The world is as it is, and it's not all bad.
No, I am looking at the entire world! The vast majority of the world is poor and they are concentrating only on how they will feed themselves and their families tomorrow. They are not concerned with politics and they sure as hell are not concerned with how to save the world.
People are neither good nor bad, they are just people trying to survive, like every other animal has done since the beginning of time.
And you are dreaming if you think the vast majority is concerned with massive scaling up of renewable energy or reducing carbon emissions. They are concerned with survival and living their daily lives as best they know how. Not one earth resident in ten has ever heard of carbon emissions or global warming.
You Pitt, are apparently using yourself as a gauge of the average citizen of the earth. Not even close. Go to remote Bangladesh, or Burma or Uganda or wherever. Look at those poor souls trying to grub a living from the earth. Ask them about carbon emissions and they will look at you like you are a fool.
That is the real world Pitt, that is the way the average citizen of the world lives, not the world you see in London Ontario, Pittsburg Pennsylvania or Butte Montana.
Ron Patterson
And they're not the ones we need to worry about when it comes to oil consumption and CO2 emissions.
The world's wealthy - which includes the vast majority of the West - consume the lion's share of fossil fuels, and are precisely the people who have the comfortable lives necessary to consider what should be done rather than what must be done. Some of the world's wealthy consider these issues to be much more serious than others - contrast Germany with the US - but evidence suggests there is a strongly growing sense that these issues are important to tackle. Witness Gore's Nobel prize as only the most recent evidence of that.
The only thing that keeps me from being sick is the knowledge that the planet has suffered disasterous mass extinctions in the past, and whole new species and major groups of species, resulted once recovered.
In a million years that will happen after this mass extinction.
We just wont be around to marvel at the new species.
Richard Wakefield
London, Ont.
No one is ahead of their time, just the rest of humanity is slow to catch on.
Well, with 300+ comments I haven't found the one or two to which I especially want to respond. I'll just say I'm glad to see this on The Oil Drum, and have been recommending it to people in email and on Growth is Madness for several days now.
Of course GliderGuider and others will produce revised analyses as time goes on. But this is some very substantive food for thought, and moves the discourse on our global ecological plight (i.e., peak oil, climate change, population overshoot, species extinction...) another step. I hope it gets as much attention as it deserves. It's off to a good start!
-John
http://growthmadness.org/
" this is some very substantive food for thought, and moves the discourse on our global ecological plight (i.e., peak oil, climate change, population overshoot, species extinction...) another step. "
This is awfully preliminary. I'd wait for another couple rounds of revisions before drawing any conclusions at all.
"This is awfully preliminary. I'd wait for another couple rounds of revisions before drawing any conclusions at all."
Well, that's kind of what I meant by, "Of course GliderGuider and others will produce revised analyses as time goes on." I do think it's substantive food for thought and that it moves the discourse. Certainly those statements can apply to preliminary work. :)
--John
http://growthmadness.org/
"I do think it's substantive food for thought and that it moves the discourse. Certainly those statements can apply to preliminary work. :)"
The problem is that in this case it's too preliminary. I think GG would agree that he hasn't yet established a firm foundation to allow the model to answer it's first, major question: whether net energy availability will be severely disrupted.
Hmmm, let me put it a little differently. What I mean is that (a) the topics, relationships, etc. which GG tackles in this paper are, IMO, profoundly important and provoke a lot of thought, as seen in this thread, and (b) the paper clearly prompts a lot of discussion, also as seen here.
Regardless of how preliminary or inconclusive it is, I think it takes on questions needing much, much more attention and investigation. (As everyone here knows, these topics are essentially ignored my most of the media.) Clearly any model or analysis of these issues which would gain wide acceptance by those with expertise in these areas would be a huge contribution. So it seems, at least, that any intelligent effort of this sort which gets good exposure and gets people talking and refining ideas, perhaps leading to further analyses, is a real contribution itself. Time will determine the final status of this particular paper.
John
http://growthmadness.org/
Thanks for your input on this thread, Nick. As I said above to Pitt the Elder, it has helped move my personal yardsticks quite a bit. I especially appreciate the fact that you don't seem to get too frustrated by obstinate obtuseness :-)
"Thanks for your input on this thread, Nick."
You're very, very welcome.
" As I said above to Pitt the Elder, it has helped move my personal yardsticks quite a bit. "
I'm very gratified to have made a useful contribution both to your information, as well as to the collective effort on this energy "thing".
" I especially appreciate the fact that you don't seem to get too frustrated by obstinate obtuseness :-)"
I always assume that people are reasonable. Most of the time it works out, though rarely are people willing to be as straightforwardly open minded as you.
It's been a pleasure!
This thread is one of the more intense intellectual and emotional experiences I’ve had recently, on a number of fronts.
As I expected going in, the readers of The Oil Drum are a very tough audience. If an article is presented as having a technical underpinnings, they has better be correct and defensible. If an article claims to draw conclusions from technical and numerical analysis, the links from the assumptions through the analysis to the conclusions had better be explicit and defensible. This audience responds poorly to handwaving, unsubstantiated claims, sloppy logic and opinions masquerading as fact.
In retrospect I agree that my paper committed all of these epistemological sins, something many of the readers were quick to point out. Fair enough, one of the reasons I write this stuff is to learn from both the writing and the reactions. Many of the criticisms were fair, though some were worded more strongly than others.
The primary challenge was “You have not proved that straitened circumstances in global energy will result in a population crash.” And, in truth, I hadn’t. Many countries have thriving technical and industrial bases with a per-capita energy consumption that would make a Canadian throw up their hands in despair. There are no examples I can find of countries where population growth has been reduced by energy limitations alone. Making that linkage therefore required handwaving and unsubstantiated claims.
There are hints that a convergence of ecological, economic and energy crises (the 3E crisis as I call it) could result in the spread of famine and disease. Qualitative scenarios have been proposed for this, but they aren’t supportable by quantitative analysis just yet. Trying to pin such an outcome on a single factor is very hard to do. Establishing that such a single factor could precipitate an outright die-off is even harder (read, damn near impossible). Trying to objectively draw such a connection is to have one’s opinion masquerade as fact.
Finally, if a conclusion (such as “energy reductions will result in a die-off”) is logically unsupportable it means axiomatically that the logic used to arrive at it was sloppy.
So, on the terms in which I presented it, this paper has to be judged a failure. Your humble servant has to admit he’s perhaps not quite as smart as he hoped he was, and that in this case his reach exceeded his grasp.
I still think some portions of the article are useful, especially as a foundation for further thinking. The Net Oil Export crisis, for example, seems to be something we should pay a lot of attention to in the coming decade. The degree to which wind and nuclear will be able to offset the decline of oil and natural gas, what the limits on wind power development might be, and the Hobson’s Choice presented by coal deserve a lot of thought as well.
On the question of population, it has to be asked whether the 3E crisis may in fact not reduce the world’s population after all. Is it possible it might simply degrade the global quality of life to the point that we have 8 or 9 billion people living like 14th century serfs, but still reproducing enough to keep the population from falling? That would seem to be an outcome many would consider more probable than the one I presented.
Finally, are the portents of apocalypse that so many of us are starting feel so strongly rooted more in our inner world than in the outer one?
I’ve only just started re-examining my position in light of these questions, but the journey already promises to be an interesting and productive one. Thanks to all who contributed to this stimulating if uncomfortable thread.
You are being too harsh on yourself. It is clear that cheap fossil fuels underpinned the green revolution. It is clear this led to a large increase in food production. It is clear the world population increased almost proportionately to adsorb the increased food. It is easy to find news items showing the linkage of fossil-based fertilizer to adequate food supply.
Currently one half of child deaths worldwide are malnutrition-related, so much of the world is hitting the Malthusian buffers now. Therefore it is probable that a decline of fossil fuel, reducing food production, will increase malnutrition sufficiently to reduce population proportionately. Simplistically, if fossil fuels double food production, than a 6% FF decline per year would initially cause a 3% population loss per year. This is too much to be adsorbed by child deaths for long, so we are likely to see widespread civil conflict or war in all food-limited populations.
There are a couple of caveats. Firstly much of the resource is used by parts of the world not under food pressure, due to purchasing power disparities. The die-off could be mitigated or held off by a fast redistribution of consumption and large decrease in global inequality. Human nature suggests this is unlikely. Secondly some permaculture experts say non-fossil farming can be as productive per hectare as fossil farming, so this can mitigate the problem with the correct eco-aware government policies.
Peak oil is just one threat to food production. The other effects of overshoot are perhaps more ominous:
The solutions to most of these problems require foregoing personal, class, or national benefit for the common good. Humanity hasn't a good record in this area, so the likely outcome is severe global environmental damage followed by a permanent population crash (or series of crashes) which keep human numbers low enough for long enough to allow some recovery of the natural system.
The next 100 years should be interesting.
" It is clear that cheap fossil fuels underpinned the green revolution.
That's not clear to me. Improved strains of grain had a lot to do with it. Tractors can be electric. Fertilizer doesn't have to come from fossil fuels.
"It is clear the world population increased almost proportionately to adsorb the increased food. "
Not really. That suggests cause & effect, but fertility levels didn't increase as a result of increased food. It's certainly possible that an increase in death rates was prevented, but that's a little different.
"It is easy to find news items showing the linkage of fossil-based fertilizer to adequate food supply."
Yeah, but I think that's superficial: my understanding is that fertilizer doesn't have to come from fossil fuels.
"Currently one half of child deaths worldwide are malnutrition-related, so much of the world is hitting the Malthusian buffers now."
Not at all. There's more than enough food in the world, and most of these countries have more than enough farm capacity: it's social chaos that is keeping the food out of the children's mouths, not food production limits. Further, something like 90% of farm production now goes to livestock and cash crops like coffee, which aren't essential - we're talking about social & economic organization, not limits to production.
"Without long-term enforced population and immigration policies, population growth will overwhelm any other adjustments we can make and cause chronic resource overexploitation"
Do you agree with the UN that population growth is stabilizing, and likely to end by the middle of the century?
Toby Kelsey: "Without long-term enforced population and immigration policies, population growth will overwhelm any other adjustments we can make and cause chronic resource overexploitation"
Nick: "Do you agree with the UN that population growth is stabilizing, and likely to end by the middle of the century?"
Nick, I don't think the UN report is much comfort. A couple of points: The report is widely viewed as a set of predictions. But that's a bit of a misconception. it doesn't actually predict an end of population growth by mid century. It just offers projections looking at what would happen if recent trends were to continue. The supporting papers attached to it go to great lengths to differentiate the projections from predictions, emphasizing that they can't predict very far ahead with much confidence because unpredictable social changes, for instance, can lead to changes in fertility rates. And even small changes in fertility rates can lead to very different population sizes down the road. The authors insist we shouldn't think of the projections as "best guesses" to be counted on.
Also, their projections have population peaking in 2075, then gradually dipping back toward 2050 levels. (Their latest update projects 9.2 billion for 2050.)
More important, though, is that even if they were confident predictions, they would mean the global population would soon grow to about 40% bigger than it is today. That means adding more people than the entire world population of 1950.
If you agree with people like the "ecological footprint" guys, many of the folks who've studied carrying capacity, authors like Catton, etc. that we're already in overshoot, then having population level out at 9.2 billion is not much comfort.[1] Given the serious and growing environmental issues today, paired with the observation that while in overshoot a population further erodes carrying capacity, such growth is especially worrisome.
A good case can be made that the human population needs to come down considerably from where it is today. Obviously, if we're in overshoot, it does. An even better case can be made that it sure couldn't hurt. :) After 2.5 million years of numbering in the millions, we shot into the billions in the last 0.0008% of our history. That alone is more than a hint that maybe we should think about dropping back down to a more resilient population size.
[1] And bear in mind that the demographers behind the UN report are not ecological scientists. Had some of the latter been included in constructing the report, I'm not sure the projections would have shown a nice, smooth leveling out. Assuming overshoot at some point, something more akin to a crash would need to have been considered.
John
http://growthmadness.org/
"More important, though, is that even if they were confident predictions, they would mean the global population would soon grow to about 40% bigger than it is today. That means adding more people than the entire world population of 1950."
Yeah, I agree. It would be greatly desirable to have fewer people. I just want people to be clear on two points: 1) we're not in runaway exponential growth, and 2) most of the world is already at or near replacement fertility levels. It will do little good to tell the Japanese that the world is overpopulated.
"If you agree with people like the "ecological footprint" guys, many of the folks who've studied carrying capacity, authors like Catton, etc. that we're already in overshoot, then having population level out at 9.2 billion is not much comfort.["
Every analyis of sustainability that I have seen relies heavily on energy as a main component of the model, and their energy assumptions are deeply flawed.
Now, I agree that humans are doing tragic damage to the planet. I just don't see a serious danger of human collapse. Could it happen? Sure, our society and economy is not the model of stability that one would like. But, I don't see anything which makes it likely.
"I just want people to be clear on two points: 1) we're not in runaway exponential growth, and 2) most of the world is already at or near replacement fertility levels. It will do little good to tell the Japanese that the world is overpopulated."
Okay Nick, but still I don't think the specter of 40% more humans in a few decades is much more comforting than runaway exponential growth. Not in the context of arguments that we've already overshot carrying capacity.
Now the "ecological footprint" may or may not be flawed, but even without any measures of that sort, it seems clear the ecological degradation happening today is an indication that, given our current ways of living, we're in overshoot. Of course carrying capacity varies according to how we live, but historically 7 billion is an awful lot of people, and would, IMO, be so under any conditions.
The other thing that makes me worry about a possibility of collapse is the convergence of several major ecological problems at once -- mass extinction, peak oil, and climate change being perhaps the three biggies. (But others are no small potatoes either.) Mass extinction alone, if allowed to go far enough, would, at some point we can't predict, hit us very, very hard. As these things compound each other, it looks more ominous. I dunno, I have to wonder if nature will stop our population growth before the "demographic transition" does. :-/
John
http://growthmadness.org/
"It's certainly possible that an increase in death rates was prevented, but that's a little different."
So you actually agree that is "cause and effect". We agree that a change in either birth or death rates can change population levels. Whenever child deaths from disease and malnutrition have been a constraint (as they have been for most societies for most of history), it is expected that an increase in food supply will improve child survival and increase population levels, and this supports my point that Malthusian food limits are important.
"my understanding is that fertilizer doesn't have to come from fossil fuels"
The Haber-Bosch process of ammonia synthesis using petrochemicals is the key technology which allowed yields to rise so much post-WW2. Before that wars were fought over guano and phosphate resources. Whatever sources of hydrogen or methane we will have post-oil for synthesis will be much smaller and be unable to maintain current yields. It is also worth noting that the new "green revolution" varieties were designed to work well with artificial fertilizers while native varieties are generally superior without. As I mentioned, permaculture may help ameliorate the shortfall if its productivity claims are correct.
Electric tractors may help productivity per person, but it is artificial ammonia which raised the critical productivity per hectare. In fact it is the smaller, less mechanized farms which are the most productive per hectare. Farmers can employ more workers but they can't easily create new productive land.
"it's social chaos that is keeping the food out of the children's mouths"
Food is not kept out of hungry mouths by "chaos" but by market forces (including cash crops) or policy. My point is that die-off will probably occur with current (or worsening) levels of inequality. With the current disparities of purchasing powers, the population of the world poor is limited by the Malthusian buffer of child malnutrition. I think a radical transnational transformation of social structures towards equal global food distribution is unlikely, so the die-off numbers will broadly follow the productivity decline.
"Do you agree with the UN that population growth is stabilizing, and likely to end by the middle of the century?"
The UN numbers are too high as they assume business-as-usual. For poorer countries, any current slowing of population growth largely reflects Malthusian forces or emigration (although family-size policies have some effect). For richer countries which are meant to be more demographically stable, most are growing via immigration due to malign neglect or as a deliberate policy. Except for China (temporarily?) I'm not aware of any country that has successfully imposed social limits on population (some African countries which were concerned with population growth have involuntarily reduced their population from HIV/AIDS, but that is not the result of policy). These growing population numbers will soon collide with declining food production.
"Whatever sources of hydrogen or methane we will have post-oil for synthesis will be much smaller and be unable to maintain current yields. "
Well, that's the key question. Could you quantify that? I have seen estimates that biomass would be a sufficient source - biomass willl never work for liquid fuels, but it's a pretty good source for hydrocarbon needs that don't have the same very low efficiency conversions, and that are on a substantially smaller scale, like fertilizer and plastic.
Similar considerations apply to hydrogen: I don't see why electrolyzed hydrogen couldn't be used, assuming sufficient electricity (which I think we can assume). Electrolyzed hydrogen can't compete with direct use of electricity for transportation due to the very low efficiency conversion steps involved (as well as the problems of making hydrogen portable), but for a higher value, smaller scale, centralized thing like fertilizer production? It would be pretty good, I think.
""Whatever sources of hydrogen or methane we will have post-oil for synthesis will be much smaller and be unable to maintain current yields. "
Well, that's the key question. Could you quantify that? I have seen estimates that biomass would be a sufficient source - biomass willl never work for liquid fuels, but it's a pretty good source for hydrocarbon needs that don't have the same very low efficiency conversions, and that are on a substantially smaller scale, like fertilizer and plastic.
Similar considerations apply to hydrogen: I don't see why electrolyzed hydrogen couldn't be used, assuming sufficient electricity (which I think we can assume). Electrolyzed hydrogen can't compete with direct use of electricity for transportation due to the very low efficiency conversion steps involved (as well as the problems of making hydrogen portable), but for a higher value, smaller scale, centralized thing like fertilizer production? It would be pretty good, I think.
"Food is not kept out of hungry mouths by "chaos" but by market forces (including cash crops) or policy. "
Well, in places like Zimbabwe, it certainly has little to do with general availability of food, or farm productivity (under normal conditions). OTOH, perhaps a more general word/phrase is need, like "poor governance". Keep in mind that market forces and policy are based on social choices and history - markets are always embedded in social choices.
"My point is that die-off will probably occur with current (or worsening) levels of inequality. With the current disparities of purchasing powers, the population of the world poor is limited by the Malthusian buffer of child malnutrition. I think a radical transnational transformation of social structures towards equal global food distribution is unlikely, so the die-off numbers will broadly follow the productivity decline."
As long as there is more than enough food in the world, and as long as any large country could grow enough food if even moderately well governed, we're not looking at a Malthusian problem, which I would define as population growing inexorably until it reaches the limits of food production.
Sure, if a country is poor and border-line malnourished due to bad governance, then a worsening of the situation (like rising oil or food import prices) will cause more malnutrition and death. I can't see how you can describe that as Malthusian.
hmmm. Well, I can see it a little bit: there are certainly places like Nigeria, or KSA, where population seems to be out of control, and where some kind of over-shoot looks pretty likely. But, they're a distinct minority in the world, and eventually I expect the rest of the world to bail them out, even if the bailout is slow, messy and painful.
"For poorer countries, any current slowing of population growth largely reflects Malthusian forces or emigration (although family-size policies have some effect). "
That doesn't sound right to me. Take a look at Mexico, and Latin America: fertility is plummeting. One proposed explanation is the exposure of mothers to soap operas (telenovelas), where smaller families are popularized!
I downloaded your spreadsheet. Let's consider it a Beta version 1, that needs to be upgraded. I hope over the next weeks to do some research on potential wind energy production & I'll email you a revised spreadsheet. If others would do the same in fields where they have expertise, version 2 (and I hope you produce one) could be quite interesting.
I am glad GG that you were open to input and were trying to focus on developing a factual based projection.
You should provide a link within the main article to this comment as to whatever initial direction for amendments you were looking to make based on the new information that you have seen as relevant.
Many people in the comments are still going with the unamended article and have not reviewed most of the comments.
===========
http://advancednano.blogspot.com
As I said above, I'm very gratified to have made a useful contribution both to your information, as well as to the collective effort on this energy "thing". You've been really unusually open minded, and it's been a pleasure!
A few comments on further analysis:
I think the divide between electricity and liquid fuels is more important than the supply of electricity: I don't see any reason to expect shortages of electricity in any moderately well managed country. OTOH, electrifying transportation (installing PHEV/EV's, rail, etc) quickly enough to deal with Peak Oil will be a challenge. It's perfectly doable for a number of reasons: production could be greatly accelerated by urgent public policy - heck, at the beginning of WWII Roosevelt called in the heads of the car companies and said roughly "today you're making cars, but tomorrow you'll make tanks"; PHEV's are realistically near: for instance, GM's Volt looks extremely realistic for large volumes in 2010; batteries are now good enough; it's just a matter of ramping up production; cars less than 6 years old drive 50% of miles; and conservation,like carpooling, could provide a very powerful and fast response to fuel shortages in a transition. But, still, a real challenge...
"The Net Oil Export crisis, for example, seems to be something we should pay a lot of attention to in the coming decade."
I think this is best analyzed in the framework of a portion of world demand being insulated, up to a point, from price pressures.
"what the limits on wind power development might be"
Don't forget solar. I don't think any reasonable analyst thinks that any one source will provide the majority of energy.
"Hobson’s Choice presented by coal deserve a lot of thought as well."
This is a very, very different analysis by country. I'm hopeful that the US will effectively stop building new coal plants soon - I don't see that for China, or importers of Australian coal, like Japan.
I think the very best option is to develop cheap solar ASAP, so that coal actually becomes uncompetitive even without internalized the cost of CO2. The following article is pretty good:
http://www.reuters.com/article/newsOne/idUSL1878986220071019?pageNumber=1
"Once the choice only of idealists who put the environment before economics, production of solar panels will double both next year and in 2009, according to U.S. investment bank Jefferies Group Inc, driven by government support especially in Germany and Japan.
Similar support in Spain, Italy and Greece is now driving growth in southern Europe as governments turn to the sun as a weapon both against climate change and energy dependence.
Subsidies are needed because solar is still more expensive than conventional power sources like coal, but costs are dropping by around 5 percent a year and "grid parity," without subsidies, is already a reality in parts of California.
Very sunny countries could reach that breakeven in five years or so, and even cloudy Britain by 2020.
"At that point you can expect pretty much unbounded growth," General Electric Co's Chief Engineer Jim Lyons told the Jefferies conference in London on Thursday, referring to price parity in sunny parts of the United States by around 2015."
"it has to be asked whether the 3E crisis may in fact not reduce the world’s population after all. Is it possible it might simply degrade the global quality of life to the point that we have 8 or 9 billion people living like 14th century serfs, but still reproducing enough to keep the population from falling? "
Interesting way to put it. It's certainly possible that reduced expectations might reduce fertility: it certainly did in the Great Depression. So, straitened circumstances might reduce population growth even without increasing death rates. I think an increase in death rates is the scenario some people assume when thinking about a linkage between energy/prosperity and population (based in part on deeply flawed extrapolations from data from animal populations), but the other certainly could make sense, seems more likely (if only because something like 90% of farm production now goes to livestock and cash crops like coffee, which aren't essential), and is a lot less painful to contemplate.
There's no question that Peak Oil will, at the least, reduce economic growth to some degree during a transition to renewables. I think you could develop a robust analysis quantifying the effect of reduced economic prospects on fertility, based just on people's responses to the Depression.
OTOH, I'm not sure that link, while it almost certainly exists, is all that important, for several reasons: The basic questions of what are likely to happen, energy and environment-wise, and what we would propose as personal and public-policy responses, seems much more immediate & interesting; there's sufficient uncertainty there that it seems difficult to put analysis of later developments on a sufficiently sound footing (i.e., to narrow them down sufficiently) to make it worthwile; and population growth is already stabilizing, albeit at uncomfortably high levels.
Hope that helps!