The Bakken Formation: How Much Will It Help?
Posted by Gail the Actuary on April 26, 2008 - 10:00am
This is a post by Piccolo, a petroleum engineer working in the petroleum industry.
The Bakken formation in North Dakota and Montana has generated a lot of buzz in the past year. Reserve numbers in the billions of barrels, even tens or hundreds of billions show up in press reports and blogs. Now the USGS has weighed in with a comprehensive assessment of the resource. So just how much will this oil accumulation help the world's largest importer of oil? Is it time to relax or is this just another small blip in the long-term decline of domestic production? We'll examine these questions and others below the fold, using data from the IHS database.

Overview of the Bakken
The Bakken formation is an oil-bearing strata covering parts of Montana, North Dakota, and Saskatchewan. Oil was first produced from the Bakken more than 50 years ago. Production was mainly from a few vertical wells until the 1980's when horizontal technology became available. Only recently after the intensive application of horizontal wells combined with hydraulic fracturing technology did production really take off.
The Bakken is one of many hydrocarbon producing formations in the Williston Basin, a sedimentary basin covering parts of three states and two provinces. The total layer of sediments in the basin can be up to 15,000 ft thick, and within that, the Bakken itself reaches a maximum thickness of about 150 ft., but is thinner in most areas. The depth to the top of the Bakken can vary from a few thousand feet in Canada to more than 10,000 feet in the deeper areas in North Dakota. In terms of geologic age, it was deposited during the upper Devonian and Lower Mississippian periods about 360 million years ago. The entire stratigraphic column for the Williston Basin is shown below. Figure 2 indicates 15 primary producing formations in the basin, including the Bakken.

The Bakken shale consists of three members, the upper, middle, and lower. The upper and lower members are similar, and can be characterized as a gray or black organic-rich shale. The middle member is more like a conventional reservoir with siltstones, sandstones, dolostones, and limestones. The middle member has been a target for many horizontal wells, but more recently the upper and lower horizons are also being seen as important reservoirs. For a more complete description of the Bakken, see the 2001 USGS study Diagenesis and Fracture Development in the Bakken Formation, Williston Basin: Implications for Reservoir Quality in the Middle Member, by J Pitman, L Price, and J LeFever.
Two key properties of reservoir rock are porosity and permeability. Porosity is a measure of how much "empty" volume the rock has space available to store hydrocarbons, water, or gas. Really good formations can have porosities of 20% to 30% or more. Permeability is a measure of how easily fluid can flow through the rock. The best reservoirs have permeabilities of 1 to 5 darcies or more. (1 Darcy = 1000 millidarcies: better reservoirs are usually measured in darcies, and poorer reservoirs in millidarcies.) These high porosities and permeabilities can be found in many world class prolific oil and gas fields, such as the offshore Gulf of Mexico, the North Sea, and Saudi Arabia.
The majority of currently producing reservoirs in the onshore US are by contrast much "tighter." A pretty good reservoir might have porosities of 10% to 15% and permeabilities of 1 to 100 millidarcies (0.001 to 0.1 darcy). Reservoirs with those properties by and large would be considered very desirable reservoir in most of the onshore US and Canada. Moving downward on the scale of reservoir quality, many thousands of wells in the US are now being drilled in so-called "resource plays." These are thick, laterally extensive reservoirs usually covering thousands of square miles, and filled with hydrocarbons, but they are difficult to exploit. The Bakken Shale, along with formations like the Barnett, Fayetteville, and Woodford shales fall into this category. Permeabilities can be in the range of .00001 to .01 millidarcies, with porosities in the range of near zero to maybe 10% or a bit higher.
Porosity and permeability can vary widely and unpredictably over short distances. There are many stories on oil field lore about dry holes drilled next to prolific producing wells, with little explanation geologically about why this might occur. This phenomenon is one of the primary risks that oil producers take when they drill wells, especially in new areas or highly variable reservoirs.
The Pittman/Price/LeFever study cited above reports a wide range of measured permeabilities and porosities in the Bakken, but the average is low. One part of the report gives the average porosity and permeability for the middle Bakken as being 5% and 0.04 millidarcies.
In many of these very tight reservoirs, natural fractures play a big role. These are natural cracks which have low porosity but can have permeabilities one to several orders of magnitude greater than the rock fabric or matrix. Most of the better wells in the Bakken have encountered abundant natural fractures.
Even with an extensive natural fracture system, often times additional help is needed to create an economic well. This is where hydraulic fracturing comes in. Fluid, sometimes with sand or other material ("proppant") is pumped at high pressure into the formation. The pressure is high enough to create large artificial fractures that can extend hundreds of feet from a wellbore. Proppant holds the fracture open, and creates a permeable channel to allow hydrocarbons to flow to the wellbore. Production in many, or perhaps most, of the producing formations in the US is improved by hydraulic fracturing. When hydraulic fracturing is combined with horizontal wells (and high enough commodity prices), many of the shale or resource plays become economic to produce.
Oil in Place and Reserves
To understand how much oil might be producible from the Bakken, we need to get there in a couple of steps.
The first step is "oil in place." The Bakken is postulated to be both source rock and reservoir. Over millions of years organic matter is cooked under heat and pressure to produce hydrocarbons. In many areas, the oil created by the source rock slowly migrates to another location where it is trapped and later found as an oil or gas reservoir. In the case of the Bakken, these layers contain source material, but the hydrocarbon was cooked in place and little or none of the created hydrocarbon migrated to other potential reservoir rocks. The Pittman/Price/LeFever study estimates the volume of oil generated at 200 to 400 billion barrels, which we can more or less equate to an estimate of oil in place.
The next step is to estimate how much oil could be recovered (produced). For a reservoir such as this, the range of recovery can very widely. Good reservoirs with "water drive" can have recoveries of more than 30% of oil in place. As reservoir quality decreases, so does recovery factor. In very tight reservoirs, recovery would probably be in the range of less than 1% to around 10%, depending on many factors like porosity, permeability, presence of fractures, well spacing, etc.
In the good areas of the Bakken, with higher porosity and lots of fracture permeability, the recovery might range as high as 5% to possibly 15%. Typically only a few areas, or "sweet spots," will have recovery this high. Outside the sweet spots, recoveries are likely to be much lower; the reservoir quality will deteriorate, with lower porosity, lower permeability, and fewer fractures, and/or thinner beds of reservoir rock. In these areas, recovery will probably be less than 5% of the oil in place, and in some areas less than 1%. Estimating recovery factor in shale reservoirs is more an art than a science; only after several years of production, and with very good data, can a reliable range of recovery be estimated.
In the less favorable and thinner areas of the reservoir, even though it might be technically possible to recover 1% or 2% of the oil in place, the risk may be too high to for an operator to be willing to spend $3 to $5 million or more, with no assurance that the well will pay out. In this case the "technically recoverable" reserves might be 1% of oil in place, but the economically recoverable reserves are 0% if an operator is not persuaded to risk capital to drill a well.
Some of the recent articles have suggested a Bakken recovery as high as 50%, but that is highly doubtful in my view. Recoveries that high only occur in a few really good world class reservoirs, and, even there, often require secondary or tertiary recovery techniques.
The USGS 2008 estimate
The discussion above now gives us a context with which to understand the recently released USGS estimate. So far, only a two-page summary of findings was released. We do not have access yet to the detailed report that backs up the summary, but we can make a number of inferences from the information provided.
The USGS summary indicates that their estimates are "undiscovered, technically recoverable oil and gas resources of the Bakken Formation in the United States." The term "undiscovered" suggests that the currently known reserves have been excluded from their totals. "Technically recoverable" has not been defined in the USGS summary; we will need to wait for the detailed report to find out their definition. In the mean time, one reasonable definition might be "the volume of hydrocarbons that theoretically could be produced if enough wells were drilled to drain the entire known area of Bakken oil accumulation".
We can contrast "technically recoverable" to "economically recoverable," a term which can be taken as the amount of producible reserves that will give a reasonable return on capital invested. The volume of economically recoverable reserves will change as oil price, cost of wells, etc. vary. In reality, some of the areas of poorer reservoir will never be drilled because of poor economics: the cost and risk will not be offset by the expected recovery of oil. It is true that more of these marginal areas will be exploited as the price of oil rises.

The USGS estimated reserves probabilistically, as indicated by the P95, P50, P5, and mean values on the table above. (P95, for example, indicates that there is a 95 percent chance that the reserves value given will exceed this value.) Using the mean value as a representative number for the distribution, the USGS estimate that there are 3,649 million barrels of technically recoverable oil in the entire US Bakken accumulation. Associated with the oil production are 1,850 billion cubic feet of natural gas and 148 million barrels of NGL's. On an equivalent energy basis, about 90% of the energy value is in the oil, with the remaining percentage in the gas and NGL's.
Ok, so now we have an estimate of undiscovered reserves. How does that compare to known or discovered reserves? Our estimate is that the Bakken has produced about 111 million barrels so far in North Dakota and Montana. Although it's a rough guesstimate, we could say that perhaps 3 times to 5 times the produced volume constitutes "discovered resources." This would include the "proven" category of remaining production from existing wells, plus the immediate areas around the wells, plus additional area that is more speculative but could yield some production. Let's be clear that the term "total discovered resource" is very fuzzy. Who is to say where the discovered technically recoverable reserves stop and the undiscovered resources begin?
Using the round numbers of 300 to 500 million barrels of oil discovered resources, we can then say that the mean USGS undiscovered resources are 7 to 12 times the size of the already discovered resources. Using the combined undiscovered and discovered resource estimates, we can take a stab at the implied recovery factor. If we choose the value of 500 million barrels for discovered resources, we find that the implied recovery factor (oil produced / oil in place) is 1.0 % = (3,649+500/400,000) to 2.1% = (3,649+500/200,000).
Will Bakken ever produce as much as 4.1 billion barrels (= 3,649+500 million barrels), the amount suggested by the USGS estimate? It seems very unlikely. Production so far has been 111 million barrels. If the industry is able to discover several more prolific areas such as the Elm Coulee field in Montana (43 million barrels, or 38% of the Bakken oil recovered to date), it might be possible to increase this recovery to 500 million barrels, or 4.5 times the current production. Is total production of 500 million barrels likely? It's difficult to say. The USGS estimate is vastly higher than this, so much less likely.
If 500 million barrels turns out to be the ultimate recovery, the recovery factor would range from 0.13% to 0.25% of estimated oil in place. This very low percentage recovery of the estimated oil in place is not unreasonable if one considers that many of the more marginal areas of the field are likely to be deemed sub-economic and will never be drilled and produced. Technology improvements that will inevitably be made during an era of high energy prices will undoubtedly render some of this more marginal oil recoverable, but the total recovery is still likely to be low.
The USGS numbers are notable for their apparent certainty of the size of the undiscovered resources. The p5/p95 ratio is one measure of the spread or uncertainty of a probabilistic estimate. The USGS oil numbers show ratios of 1.2 to 1.9, which is quite surprising. These low ratios imply that the USGS is highly confident in their recoverable resource estimates. One would have thought that a 5X or 10X spread in this ratio would be more plausible considering that 85% to 90% of the resources has not yet been discovered. Perhaps when the detailed report is released, the logic behind this narrow range will be revealed. In the mean time, I remain highly skeptical that such a large resource with an unknown variability of fracture density, porosity, and recovery factor, and other factors, can be quantified with such precision.
If we could actually produce 3.6 billion barrels of undiscovered oil forecast at the P50 level by USGS, how much would this equate to? The US uses about 7.6 billion barrels of oil products a year, according to EIA data. This is equivalent to just under six month's US oil use, spread over a very long period, probably 20 years or more. If total production amounts to only 500 million barrels, as I have suggested, this would equate to about 23 days worth of United States oil usage, spread over many, many years.
Looking at future production another way, the recent peak in production has been 75,000 barrels of oil per day (discussed in more detail below). Even if operators are able to triple this amount, the resulting production of 225,000 barrels a day (which would be a considerable challenge), will amount to only about 1.1% of US oil consumption, assuming the US uses about 20.7 barrels of oil a day, based on EIA data.
If we can reach 225,000 barrels of oil per day, the history of Bakken suggest this level would be short-lived - the peak production will probably last for a year or less - because as we shall see below, total Bakken production can be expected to decline to 50% or less of its peak rate within a few years, because of the steep decline rate of individual wells.
Bakken production history
To understand historical Bakken production, we utilized a commercially available production database (IHS) that contains monthly production for all Bakken wells in Montana and North Dakota. This database, while not in exact agreement with state data, is accurate enough to discern general trends. A cross check of state records indicates that the total production and well numbers for the individual states indicated by the database are within a few percent of those recorded by the individual states.

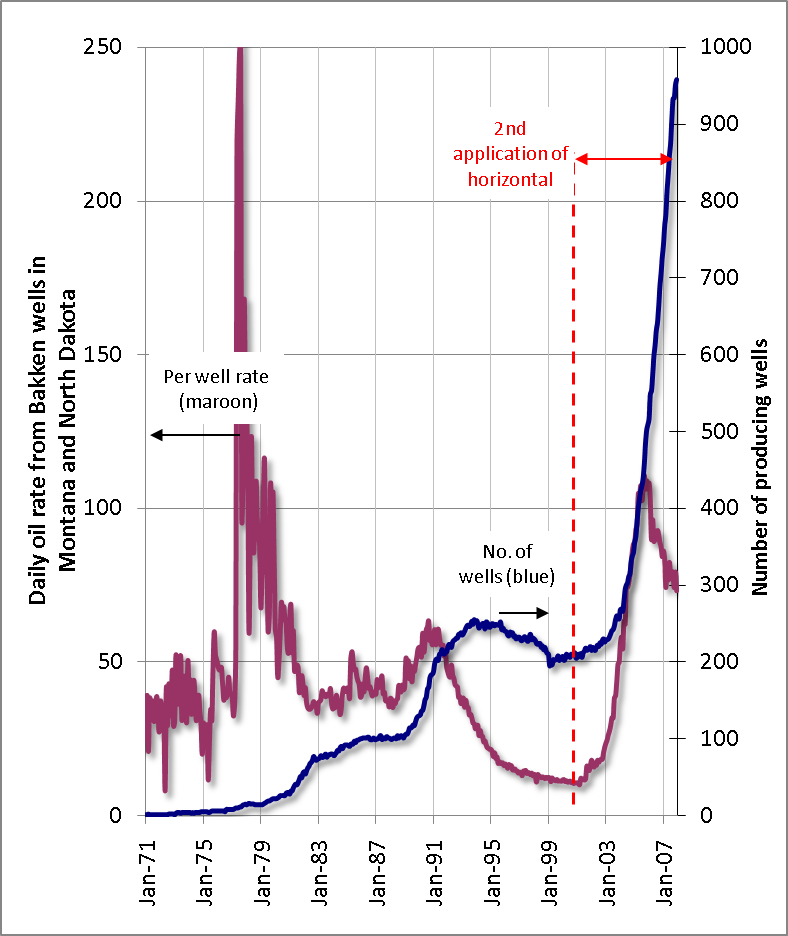
The production history of the Bakken in Montana and North Dakota (Figure 3) can be divided into three phases, a) vertical well production prior to 1985, b) the first wave of horizontal well production up to 2004, and c) the second wave of horizontal production since 2004. Clearly the second wave of horizontal production has had a huge impact, which can be credited to several improvements over the technology of the 1990s. These improvements include, among other things the ability to drill longer horizontal and multilateral wells from a single vertical wellbore, and improved hydraulic fracturing technology. The first wave of horizontal well technology boosted Bakken production to an April 1991 peak of 11,790 barrels of oil per day (BOPD). Constrast that with the most recent peak in October 2007 of 75,000 BOPD.
As a quantification of the importance of horizontal wells, the proportion of Bakken horizontal wells (including multilateral), as a percentage of total wells, increased from 0% in 1980, to 50% in 1990, 78% in 1995, and 95% today.

If we consider the number of wells being drilled, and how it affected production, a key point arises from Figure 4. There is distinct peak and rapid decline of production in 1991, even though the number of wells increased for two more years after the production peak. This is one of the harsh realities of oil and gas production, especially in tight, fractured reservoirs. The wells may individually reach peak production rates of 500 barrels of oil per day (BOPD), 1,000 BOPD, or more, but the peak is normally very short lived because it is followed by a rapid decline that can be anywhere from 20% to 60% per year for the next couple years. After an initial rapid decline, the well may produce at low rates and less decline for many years afterward, but usually high well rates anywhere close to the original rate can never be achieved. Combining many wells with this high rate / rapid decline characteristics means that it may be possible to achieve a high field production rate, but only for a short time, and drilling additional wells often will not be enough to offset the overall field decline.
Production of wells in a field is usually log-normally distributed. A few wells produce at high rates, and most of the wells produce at less than average rates. In a typical field the best 20% of wells pay for the other 80%. It's a numbers game - unless one is lucky enough to hit a big well on the first try, one needs to stay in the game long enough to drill enough wells to achieve an acceptable statistical average.
The field decline during the period of February 1993 to February 1997 is about 25% per year. If many new wells were not being drilled and put into production during this decline period, the overall decline would be considerably steeper. Note that after January 1997, the decline flattens somewhat; this would be the beginning of the long "tail" period of production from existing wells, characterized by low producing rates with shallower decline.
If we consider average production per well (Figure 5), we find that its behavior may be predictive of later field decline. The average production per well is simply the total reported Bakken production for the period, divided by the total number of wells producing during the period. If a well is drilled and goes on production in a certain period, the well count goes up by one, and the well's production gets added to the total. If a well becomes uneconomic during the period, and the operator stops producing the well, the well count goes down by one. In any given month, wells that come on at high rates of say, 1,000 BOPD, are averaged with wells already on production that may be producing 100 or 50 BOPD. If there is a population of wells already producing and on decline, bringing on more wells at temporarily high rates (the 1,000 BOPD may last for one month or two months max in most cases) will only raise the average production slightly.
For the first wave of horizontal technology, the per-well production peaked in August 1990 at 71 BOPD per well, with 142 wells producing. The per-well production then declined, even though additional wells were brought on production for the next 4 years. In August 1994, the peak well count of 235 wells was reached, but by then the average per well rate was only 22 BOPD. Interestingly and perhaps alarmingly, the 2nd wave of Bakken horizontal well production reached in August 2005 a peak per-well rate 116 BOPD per well, with 433 wells on production. Based on production in the early 90's this may portend a near term decline in Bakken total production. As of October 2007, however, the total Bakken production rate was still rising rapidly.
Even if Bakken production should peak in the next year or two, this doesn't necessarily mean a permanent decline in production. Past history shows that some combination of new technology, new discoveries, and higher prices could lead to another uptick in production.
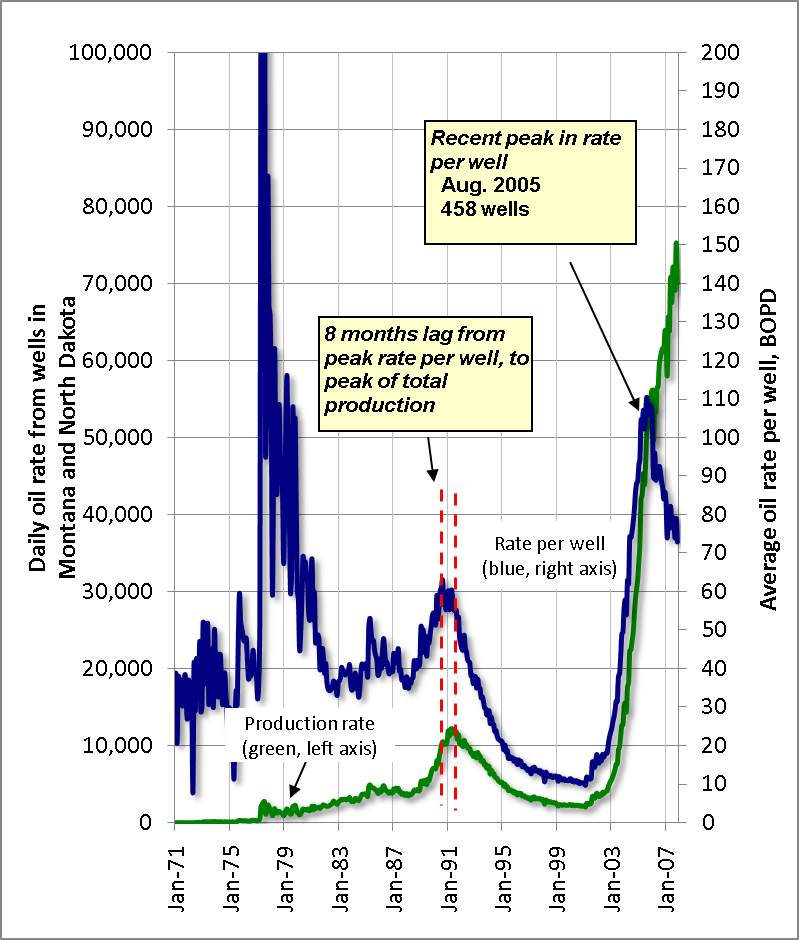
Comparing per well rates and total producing rates in Figure 6, there was an eight-month lag from the peak per well rate in August 1990 to the peak Bakken production rate in April 1991. As was mentioned above the peak in total Bakken rate occurred in spite of the fact that wells continued to be drilled and brought on production during the next four years. We are now 26 months past the August 2005 per-well peak, so that's encouraging. That's 26 months up to October 2007, the last month plotted in this graph.
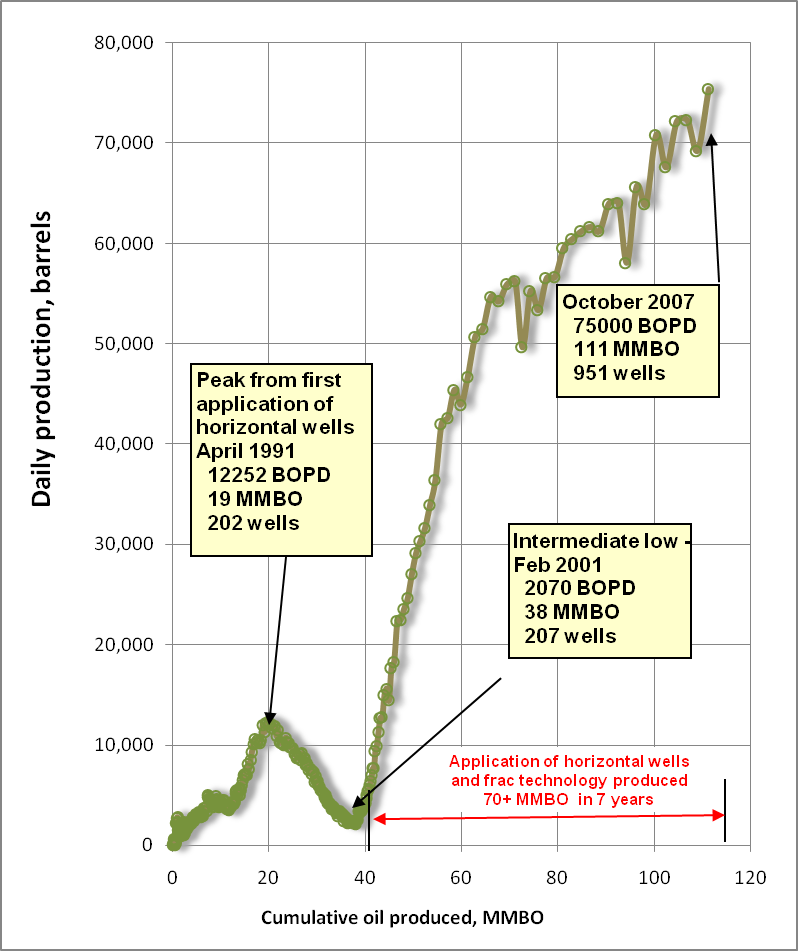
Looking at the total Bakken production vs. the cumulative production (Figure 7) will allow us to approximate produced volumes of the two waves of horizontal technology. The first wave production curve indicates that if no new wells were drilled, the ultimate recovery would have been about 41 million barrels. The second wave of horizontal technology did indeed dwarf the first wave, and we can say that so far the second wave has added about 70+ million barrels of production.
The first wave of horizontal technology peaked at about 20 million barrels, with an ultimate recovery of about double that, or 41 million barrels. Using this analogy, if the industry were able to keep up the current rate of increase for the next two years, and reach a peak production at 150 million barrels cumulative recovery, ultimate recovery could reasonably be estimated as being around 300 million barrels, without additional new waves of development.
What's next for the Bakken?
Bakken production is trending upward and should continue for some time. The October 2007 production of 75,000 BOPD equates to 27 million barrels per year, a substantial amount by most measures for the US onshore sector. This only amounts to about 0.4% of US consumption (using a base of 20,700 BOBP, based on EIA data), or 0.6% of US imports.
Drilling activity in the Bakken continues at a frenetic pace. It's difficult to predict how long the upward trend in production will continue. Over the long term, economics will play a significant role in determining how much production will be expanded.
Conclusions
1. The Bakken shale has produced about 111 million barrels of oil during the last 50+ years in Montana and North Dakota.
2. Total Bakken production is still rising, and producing at the rate of 75,000 BOPD in October 2007.
3. Because of the highly variable nature of shale reservoirs, the characteristics of the historical Bakken production, and the fact that per-well rates seem to have peaked, it seems unlikely that total Bakken production will exceed 2x to 3x current rate of 75,000 BOPD.
4. The latest boom in Bakken production is driven by the application of horizontal wells and hydraulic fracturing technology, which has added about 70 million barrels of production in 7 years. Ultimate recovery of the already-drilled wells should be at least double this volume.
5. The USGS estimates the mean volume of technically recoverable hydrocarbons to be 3,649 million barrels of oil. This is roughly 7 to 12 times the size of already known resources.
6. Based on current production and areas likely to be drilled, the USGS estimate of technically recovery resources seems optimistic.
7. The Bakken potential resource, while large by US onshore field standards, will have only a minor effect on US production or imports. Using 2006 US imports and consumption for comparison, the Bakken undiscovered resource of 3,649 million barrels of oil, if subsequently discovered and fully developed, would provide us with the equivalent of six months of oil consumption or 10 months of imports, spread over 20 or more years. In reality, the reserves developed are likely to be many times smaller than this value.
8. The October 2007 production rate of 75,000 BOPD amounts only 0.4% of US oil consumption, or 0.6% of imports.
9. Per-well Bakken production peaked in August 2005 at 116 barrels a day, and was down to 79 barrels a day in October 2007. If the Bakken production history in the 1990s can be used as a guide, the peaking of per-well production may portend a peak in total Bakken production.
Contact
- Content: editors at theoildrum dot com
- Tech support: support at theoildrum dot com
License

This work is licensed under a Creative Commons Attribution-Share Alike 3.0 United States License.
Thanks for the superb rundown on Bakken. I'll read it carefully later -- but it certainly is in accord with other things I have read.
I just went through there on Amtrak Empire Builder -- there is a huge buzz in North Dakota about the possibility of vast riches to be had. I fear there will be massive disappointment when the reality hits.
Thanks for this great analysis! what is the quality of the oil recovered (API gravity, etc.)?
A recent presentation by Julie LeFever gives an API of 39 to 46 degrees, i.e. very good oil quality.
Not surprisingly, the hype about the Bakken's potential ends up being hype after all. Even if the Bakken's could be produced at peak levels starting right now (which it can't), it would only delay global peak production by approximately 6 weeks; so much for the "Saudi Arabia" of Northern Plains that oil company surrogates have attempted to spin.
Thanks to Gail for deftly extracting pertinent trends from the fast-moving data stream.
You know how the old saying goes: A gold mine is a hole in the ground with a liar on top. Something similar might be said for oil too. However, we've talked about this a bit previously on this site and up until now I've been pretty skeptical but now that I've read this I'm fairly impressed. Even if this does nothing for global supplies, or make a dent in the U.S. imports, this will be a boon for the economy of these states. Or rather, it will be a boon to the finances of those who lease the land the wells are on and the few people who are actively engaged in extracting and shipping the oil. Yet, translating mineral wealth into a diversified economy has always been a challenge for the western states.
*edit* Actually, now that I think about things in a more consumption sort of capacity, does anybody know if it would make gasoline locally cheaper for this area? If I remember correctly, ND is at the end of the distribution chain.
Interesting guess that ND is at the end of supply chain/pipelines. Thought I would point out for the benefit of TOD readers, especially US readers, that ND, Montana etc... are more or less at the start of the big Cdn pipelines not so much at the end of the old gulf/SE lines.
The amazing thing about this, though, is that our Cdn lines do not actually serve our own industrial heartland in the east. All the Alta lines go into the US, mainly toward Chicago or over the mountains to the Pacific coast. We import almost all our oil in the East in tankers, plus a little Cdn offshore production.
Companies are actually starting to reverse some of the old gulf/WT lines to get "dilbit" synthetic crude to the hubs.
That leaves Eastern Canada with no SPR (yes, zero) and no local onshore production if you exclude Petrolia in Southern Ontario where the first wells were dug around 1850, before Titusville.
My GGGGrandfather is buried there (Oliver Simmons). His tombstone dated +/-1880 identifies him as a petroleum engineer. He was into refining/fractionating with Imperial. Needless to say, we're past our peak! We store vast gas there now in shallow dolomitized pinnacle reefs.
I wrote a note in one of the Drumbeats about needing someone to look into this (or some other issues) further. Piccolo wrote me an e-mail saying he was interested in doing some investigation. It wasn't until I saw a draft of the report that I knew for sure that he really could provide a lot better analysis than most of what is available.
I missed the attribution at the top, and only saw Gail's name. Good work, Piccolo.
Gail,
Thanks for following up on this and thanks Piccolo for delving in. It will be good to look harder once the USGS report is available, but I'm pretty pleased so far that this does not look like a huge amount of carbon. Nor does it look like it will bring down the price of oil. I still worry that the natural gas will be wasted on tarsands though. Perhaps the royalty income will spur some alternative energy development at the state level, which would be a positive development.
Chris
Thanks great report on the opportunities in the Bakken. Do your estimates include only the Bakken or also the Williston Basin. I have tended to notice the two discussed interchangably but it appears from your analysis they are separate as the Bakken is contained within the Williston Basin. Do you have any ideas on the Williston basins' productive capability?
This only includes the Bakken in the US. The Bakken is a subset of all the production in the Williston Basin, but it's the hottest play going at the moment in the Williston. It would not be difficult to do the same exercise for the Williston, but we'll leave that for another day.
There are probably quite a few different types of analyses that could be done like this.
It would seem like it would on other oil locations, like Gulf of Mexico, or shallow water separate from deep water in the Gulf of Mexico.
It might also work on natural gas, as with Barnett Shale in Texas.
Just to say, there are significant character set issues with this article, with ’ in place of apostrophes throughout.
I am having that problem as well. I think it may be something to do with the crash last night and possibly the Safari browser. I notified Super G, and he has notified Gaia Host.
The page claims "charset=utf-8" - but if I was guessing I'd suggest a unicode translation issue. It's not Safari since I'm using Firefox and in any case the three characters seem 'baked in' to the source.
A quick search and replace should solve it, if someone has appropriate access.
I got the problem fixed (unless I missed some). I also made a couple of the figures a little more legible.
world’s We’ “empty” “tighter.” ???
I think somebody cracked this site or your computer.
Just what is your point? We can breath a sigh of relief and go back to bau? Let's just keep burnin' it away. Let's keep sending Co2 up into the only air we have to breath. Let's further retard any rational discussion concerning how society at large might transition to a localized, sustainable, and meaningful form of existing on the only planet we were given to exist upon.
This article reaks of subtrafuge. To hi heaven. So what if it peaks or doesn't? It will peak, and before it's physically possible TO peak, because there's this little bugger of an economic glitch in the system that will slam the door shut on any peak consideration as to this current clutch at the straw of Bakken. It peaked before they started extraction. How long have THEY known about that formation. THEY didn't bother developing the process to extract said ff because at the time of discovery and realization, it wasn't economically feasible, THEN. And it is now? No, it's even less so now, by far.
Leave it be. Spend your energy learning how to compost, how to live from sun up to sun down, with no electric lighting. How to walk 5 to 10 miles to gather what it is you need to stay alive. Teach your children how to hunt, trap and fish, how to plant seeds, how to stay warm in a relentlessly cold winter season, if you choose to remain in winter like lattitudes. Teach your children how to aleaviate cold/flu symptoms with items that don't come off a grocery store shelf in a cardboard box.
Extreme view? Not for these times. This peak/depletion of ff energy is exponentially growing, and it's not the elephant in the room, it's THE ROOM. The elephant is the pitiable effort to forestall the inevitable, wasted energy, but that's the hallmark of the naked ape. We cerainly are unique on this planet. No other life form wastes energy like a human. We are the only life form which, given the choice, will SH*T where it sleeps and eats.
Rant over.
Jeff
Your last name wouldn't happen to be Kunstler, would it?
Seriously, getting angry at the problem is a great first step, but actions do speak louder than words.
My actions:
1) Bought a Prius last week (or rather, ordered it since there's a 3-4 month waiting period for these) and dumping gas-guzzling 9 year old car once that comes in
2) Trying to convince my wife to rent (Not buy... Not with the current mortgage mess) a house in the middle of town
3) Looking at options to relocate my family to said house (see #2) within walking distance of work
4) Bikeriding. Lots of it. (Great way to lose weight). It's free, convenient, and a great way to make small trips. (And how many folks here on this page use their bike? Yeah, didn;t think a whole lot of you would say yes.)
5) Eliminating debt where possible
And yes, the world can be f*cked with PO, but I have decided not to be a victim.
Incorrect. My bank account begs to differ.
Bike riding is free; bike owning may not be!
Relative to roughly $5000 - $9000 per year to own and operate a car in the US, bikeriding is as close to zero as it gets, unless one walks or hitch-hikes. If you want to buy a $2000+ bike, don't complain about the expenses.
Riding a bike is a an excellent way to save costs for the majority of commuters; it means lifestyle changes, but being 'addicted to oil' means breaking the habit will not be easy.
Ok, correction VV: It's Fossil Fuel free...
Er, wait...
There's the alumninum for the frame of my bike, made from ore mined with machines running on FF, and then assembled in a factory with machines running on electricity from FF... Tires? Might be made from oil themselves...
There's food that I eat, brought to me from a farm using machines using FF to plant, harvest, process, and transport said food... Oh, and not to meniton fertilizer for said food, made from... You guessed it... Fossil Fuels... But, I'd probably be eating most of this regardless if I use my bike, so MARGINALLY it's probably pretty cheap (i.e. the extra food I would need to eat to power my bike is probably less than the extra fuel I would need to drive my car). And I can plant the food myself in a garden and reduce the FF impact.
Alright, once my bike is paid for (which was, like, 6 years ago), it's free to run (almost). There's maintentence... But I would be paying for that with a car anyway (And a LOT more with a car, mind you...)
OK VV! Not free, but less expensive than the alternative.
But I do get the benefit of better health and quality of life due to the excercise (Until I get a gasp of exhaust from a Hummer that just spent >$100 to fill up.)
In another post somewhere I did an order of magnitude calculation that showed that a human and an (good, modern) internal combustion engine are roughly equivalent in thermodynamic efficiency. The difference with a car is that you are dragging around 2000lb of sheet metal wherever you go. The food eaten to ride a couple of miles is PRACTICALLY ZERO in terms of the net energy input, as compared to driving a car around.
"a human and an (good, modern) internal combustion engine are roughly equivalent in thermodynamic efficiency."
Which suggests that an electric motor is likely to be substantially better than human power, right? Of course, you have to include the health benefits of aerobic exercise...
I'd be curious to see a re-posting of your calculations.
It took me a week to find that calculation on TOD, but I FOUND IT!!! You can view it here
I can't resist jumping in here. I have been riding my bikes at various levels since I was 5 years old (I am now 48). I've raced, toured, commuted, wrenched.
There are millions of perfectly good bikes hanging in people's garages. You can pick up a great bike from the 70's or 80's for $100. I'm not talking Huffy quality here. Bike snobs see downtube shifters on a road bike, or thumb shifters on a mountain bike and refuse to even look at it. I recently bought a full Campagnolo road racing bike from the 70's in great condition for $90. I put about $100 into tires and minor repairs, and it will now last me decades. I've seen great old mountain bikes go for $50. Honestly, for commuting, an 80's/mid-90's Bridgestone or Raleigh or Schwinn or Trek mountain bike will give you years of service for almost no cost. Find a rigid fork, good steel framed brand name and just ride. craigslist is great for finding cheap bikes. I realize that in some locales used bikes are tougher to find, but they are everywhere if you look. I am lucky to live in Colorado, where craigslist has overtaken the classifieds and paper bulletin boards of the past. There are hundreds of bikes posted on craigslist in Denver every day. Examples just from today and yesterday:
http://denver.craigslist.org/bik/653482449.html
http://denver.craigslist.org/bik/653262295.html
http://denver.craigslist.org/bik/652655833.html
http://denver.craigslist.org/bik/652643816.html
http://denver.craigslist.org/bik/651792771.html
http://denver.craigslist.org/bik/651720068.html
To clarify: cycling as a basic form of transportation can be cheap. But if you get the bug become a cycling enthusiast, hold on to your wallet. Plus you can end up driving quite a bit to do rides here and there. But this is a whole different topic.
How true.
My 'Specialized' S-Works cost me so much I had to sell my top-of-the-range Opel Zafira and replace it by a cheapo Citroen C1.
Dude, I'm with you. The problem of exponential growth does not only apply to finite oil reserves, but to everything we do. I was going to suggest that maybe the problem is that your perspective is inappropriate to the oil drum, but then I re-read the subtext: "Discussions about energy AND OUR FUTURE." So maybe everyone here should be paying attention to you comments instead of thinking that exponential graphs and logistic curves are only applicable to oil production.
An amusing side note: I keep both full size and dwarf hamsters. The full size hamsters are very meticulous about picking their crap out of their nest/sleeping pile and putting it in a neat stack in the corner. On the other hand, dwarf hamsters are terrible and pretty much crap, pee, and sleep in the same spot. Arg! I think I'm going to give the little buggers a bath...
How to walk 5 to 10 miles to gather what it is you need to stay alive.
I challenged Airdale when he produced such a wackjob position, and I am going to challenge you on the same grounds.
On a planet with 6 billion, there is not enough 'space' for man to be a hunter gatherer.
(one square mile is 640 acres - so they guy is either suggesting the taking of others property, trespassing, or owning a whole lot of acres - amounts of land far beyond the ability of most people to pay for. A simple search engine query gives kilometers (10 to 700 square miles) of land per person for hunter gatherers)
Extreme view? Not for these times.
No, your view is out of touch. Badly out of touch. And peddling snake oil.
Nice job, Picolo.
I came to the same conclusions as you did, saying that production would peak somewhere in excess of 100,000 barrels per day but likely never matching peak output from Thunder Horse (250,000 b/d). I also said that peak rates from the Middle Bakken won't come for another 5-10 years.
As you say, longer term production will depend on the number of wells drilled. A few thousands wells will be required to boost production to the eventual peak in the low hundreds of thousands of barrels per day.
I didn't have access to the IHS database, so I got some useful data from this article. Your graphs are excellent.
-- Dave
Regarding the prior "estimates" for URR in the 200 Gb to 400 Gb range, from a near zero permeability sometimes fractured shale and from a sometimes productive silty sandstone, I concluded that someone had discovered a new branch of physics--one that allowed us to recover more than 100% of OOIP from said near zero permeability shales and silty sandstones.
Of course, I did notice that most of the 200 Gb plus proponents helpfully cited the stock of one specific company in the play.
BTW, very good work.
Thanks to all who posted above. The editor, Gail the Actuary, deserves a lot of credit for whipping this story into shape.
I want to thank both you and Gail for this story. It is timely and very useful as a rebuttal to those who hawk the falsehoods of the Bakken being another Saudi Arabia.
I thank you for the fine work. My bone of contention is in regard to the recoverable reserves. We know there is a huge gap between the technically recoverable reserves and the economically recoverable reserves. Obviously, as supplies get tighter, this gap will gradually close. Indeed, there has been a significant increase in the number of profitable wells just in the past couple of months. Perhaps, more importantly, the amount that can be recovered technically will jump again. The last jump was created by an improvement in fracturing technology. The one before was from horizontal drilling. There will be other developments. The work being done to develop methanogens holds great promise. One can dream that the day will come when natural gas is the steady product of fast working "bugs". Who knows what the next innovation will be? In the mean time, various sources coming online and the increased incentives to conserve should solve the short term problem.
This neglects entirely the issue of rate of production. So yes, someday, maybe a large percentage of that oil will be recovered - but that may be a long, long time from now. Does that substantially change our situation?
Yes. The law of innovation is that innovations occur when there are people willing to pay for them. The most recent jump in production has been a combination of innovation and the increase in economic incentive. This combination has made vast areas worth the expense and effort to develop. New oil production is just like new corn production, the price of corn went up last year and the acres under production reached an all time peak, but give farmers a couple of years and land that is now fallow will be growing corn.
The number of working rigs is up several times over the past 5 years or so. Just like what happened from 1974 to 1980, it took a while to gear up but the massive investments made resulted in supplies over taking demand. If one looks only at the investments made in Canada for the past 5 years, one sees how much serious money is going into development. Five years ago, Canada invested something like 5 billion and last year somewhere around 15 billion. The big increases in production there have just started to accumulate. Billions have been spent on Thunder Horse, in the Gulf of Mexico, without a drop of production but it will start late this year at 250,000 bpd and grow to 1.1 million in a few years. Surely you would admit the Bakken increase of the past few years exceeds all expectations from just a few years ago.
I'll agree on the investment. We have to wait and see on the production. The oil sands aren't yet ramping up much, despite huge investment. I can believe Thunder Horse starting late this year (delayed since 2005!) at 250,000 barrels. I will believe 1.1 million when I see it.
Regarding Bakken exceeding all estimates--The problem is that it still isn't very much in total, although from an individual company perspective, it might be what they were expecting.
I think it's fair to call that a "guideline" rather than a "law". Calling it a "law" implies a steady and endless progression in engineering, which to some people means that eventually we'll be getting our oil from the hydrocarbon seas of Titan.
Um, probably not.
Firstly, eventually technical limits will be reached if only from the laws of physics, chemistry and biology. I mean, if it were simply a matter of spending money we'd have a cure for cancer by now.
Secondly, people may never be willing to pay enough for that thing. They may have other things to spend their money on, as I discussed in The Freezing Point of Industrial Society. If incomes stayed the same but fuel became (say) $50 a gallon, would this lead to innovation in oil extraction or... more trains?
I mean, there comes a point when it's just not worth the trouble. Exactly where that is, that's hard to say. But it's somewhere between Bakken and Titan ;)
EOG Resources 2007 bakken reserve estimate is 80 MMBO.
http://www.eogresources.com/about/letter_shareholders.html
Plenty of other companies (Marathon, Hess, Conoco etc...) also have significant Bakken production and reserves. So I think the 500 MBO estimate will be exceeded.
Plus this does not include the Canadian side of the Bakken.
Getting higher recovery out of the Bakken seems like an easier challenge than the Colorado shale.
And there is always the chance that the proponents of the "New Physics" are correct.
The tip sheets i saw were quoting a cost of $16/barrel, maybe it's a new paradigm:-)
How come Canadian states don't have names?
Why is our oil under their snow?
Speaking of which, and thinking of advances like THAI... is there enough combustible material in the Bakken shale for fire-flooding to work materially better than just draining liquids?
I thought the idea of the fire in THAI was to liquefy the oil that was too viscous to flow otherwise. This oil is very liquid (API = 40+), so heating it wouldn't make any difference.
It would turn most of the oil into a vapor which could escape from the rock much more easily than liquid; there would be no need for some other fluid to displace it, it would only need to be allowed to expand and find an exit. At least in theory, this could make a considerable difference.
Perhaps, but this is not the THAI method. The THAI method catches the liquid that drips out through the sand. You would need a new method to catch the vapor.
Gail, when I use the words "advances like", I don't mean precisely the same method. You can stop picking that nit now.
Catching vapor is easy. It's called a "condenser". Non-condensible gases such as carbon monoxide (produced at the flame front) could be processed to useful products somewhere else.
How would THAI work in such a tight rock formation as Bakken, having nearly zero porosity? Toe to Heel Air Injection works because the oil sands are such a loose material with good flow when heated. Bakken even has trouble maintaining flow when fractured, as a blog describing some of the plays showed most wells have 50% production decline in first year.
Furthermore, THAI is having serious air pollution issues with initial tests on Canadian tar sands. I can't find the article on THAI problems, but it was posted on the Drumbeat about a month ago.
"Toe to Heel Air Injection works because......"
um............thai is not by any means a proven technology.
It would be a wonderful thing if the 500 MMBO were exceeded. It's a moderately long way from 111 MMBO to 500 MMBO, but if there are several EOG-equivalent areas out there, and if their reserve numbers are more or less in the "proven" category, then we might make it.
It should be said that neither the USGS analysis or my analysis considers Canadian reserves.
I don't know where you are going with this analysis. Per well production should drop if older wells remain in production. Am I missing something?
It seems to me that the ultimate recovery for the Bakken is going to be dependent on the number and area of the sweet spots that are discovered. If the entire Bakken was one massive Elm Coulee [it clearly isn't] it would be a super giant. If there are ten Elm Coulees lurking in the thousands of square miles ... your numbers are low.
It also appears to me that the economics of a [5,000 foot?] vertical well [and some of the formation is much less than the 9000 feet usually quoted] even with a massive frac job over a hundred and fifty feet of pay --- are excellent based on the numbers you quoted. Once again, to me the question is how much of the Bakken has reasonable permiability, porosity, and the upside prospect of encountering some natural facturing.
Your a correct that if older wells remain on production, the per-well rate should drop. I believe that is what figures 5 and 6 show.
Yes indeed that is the question- how many more Elm Coulee's and other big sweet spots will be found. Let's hope there are many out there waiting to be found. In any case, it will take a lot of these to get anywhere near the mean reserve estimate of the USGS study.
Regarding vertical fracced wells, it is certain that operators would be drilling and fraccing vertical wells if the economics those were better. However, the proportion of active horizontal & multilateral wells is up to 95% of the total, and vertical wells are the remaining 5%. Certainly they would cost less to drill, so this indicates to me that horizontals/multilaterals must yield highly superior economics. Intuitively, one can arrive at that by comparing one lateral, 5000 ft of exposure to the formation, or two laterals, 10000 ft of exposure, to a vertical well with less than 100 ft. of exposure.
Intriguing post.
Never heard of Bakken till it started to sprout like a rash over the last few months.
Cost per foot drilled would be a useful metric , So might thousands of barrels over thousands of feet. Both with comparisons over time since I am sure that rigs and crews and specialists will get more expensive rather than less.
Anyway, I think I would rather be a day rate driller than a stockholder.
Good night.
A fantastic article investigating the limits of the Bakken Formation. I'm curious about blogs like these:
http://nextbigfuture.com/2008/01/bakken-and-torquay-formations-saudi.html
That say things like this:
"Bakken oil is currently about 100,000 barrels per day and seems to be heading to 250,000 barrels per day by the end of 2008. It could take 4-6 years to get a million or two million barrels per day. So it will take time to develop the fields and get the pipelines and other infrastructure. A continued build up of oilsand oil, the Gulf of Mexico oil and continued increase in biofuels. Shifting the US off of non-North American oil imports is still a big job even with the Bakken oil. However, it could be part of a substantial shift and allow more time for the development of more nuclear and other power sources and for more efficiency from thermoelectrics, ultracapacitor/battery hybrid and electric vehicles."
I tried to find some validation for the current figure of 100,000 barrels per day and managed to dig up this:
"The Bakken boom
300 Number of North Dakota wells in the field in 2006.
457 Number of wells at the end of 2007.
137,000 Barrels per day production in the state in January.
148,500 Daily production record, set in 1984, expected to be surpassed this year."
http://www.star-telegram.com/business/story/575614.html
Of course, there is no way to distinguish Bakken production from other resources.
And then, of course, there is Wikipedia:
"The greatest Bakken oil production comes from Elm Coulee Oil Field, Richland County, Montana, where production began in 2000 and is expected to ultimately total 270 million barrels. In 2007, production from Elm Coulee averaged 53,000 barrels per day — more than the entire state of Montana a few years earlier.[5]"
Fine to focus on the primary producer in the field but it doesn't give a total production estimate which leaves a big gap.
So the 2008 total field production data remains a bit of a mystery with a lot of wild claims, punctuated by variable and spotty information. The oil field recovery and production estimates seem to be trending nicely with EROEI -- full of conjecture and misinformation.
One final point -- the more you look at the way analysts figure out how much oil is in place and recoverable looks more like voodoo than science. In all, this kind of analysis makes back of napkin look like state of the art.
If anyone has good sources on production figures for Bakken in the recent (2008) timeframe, I'd be all eyes.
My analysis goes only to October 2007, and clearly production was rising at that point. I looked at the available data for November and December, but did not believe it to be complete. There usually about a 6 month lag before production data becomes available for analysis. So perhaps in July we can look at this again.
It would be great if the Bakken could make it to 250,000 BOPD. However,at the rate of increase shown during the last year it would take at least 5 years to get to 250,000 BOPD. In the mean time the average rate per well seems to be dropping. That needs to be reversed if much higher total Bakken rates are to be achieved.
In the quoted figure of 100,000 BOPD, it's difficult to tell if that happens to be more recent data than Oct. 2007, or maybe it includes Canadian production. I do not now how high Canadian Bakken production is. I would say, though, that in my sampling of web sites that have commented on the Bakken, many do not seem to have a lot of technical depth. Either that, or they are believers in the "New Physics" thing.
Piccolo, I think you did a fantastic job putting together the most recently available, valid information :D. One can always strive to get current figures on what is happening now but it's really just a shot in the dark. I'm not happy to wait until July, but I understand the reality of figures publication and validation. I guess impatience is what I get for living in the information age :).
For my part I agree that Bakken ever reaching 250,000 bbl/day is very optimistic. I am unaware of any 'new physics' changing reality in today's universe. But I'm still a bit curious about the entire Bakken Basin and how it will all play out.
Best hopes for more data come July!
How much do it costs to drill one well? I guess the costs are going up too.
I'm trying to guess what is the net profit of a 1,000 barrels per day well at $100 per barrel.
That's quite a read .. even the third time !
It is not 300 billion (whatever) barrels of 'easy oil'is it.
Therefore it cannot fundamentally shift the overall economics of
food and fuel costs.
I wonder if there'll be any measurable benefit to the tax payer
in the UK when we try and build for and then host the Olympics
in 2012 ?
I think 'No' would be the short answer to that.
A recent data point from someone in the know is that the current Bakken horizontals are costing in the range of $5 million.
A look at the data in Richland Col, Montana, which includes Elm Coulee field, shows that about 1/6 of 600 or so wells that have produced Bakken oil (including now inactive wells) have already produced over 200,000 barrels, and most of those are still producing. The average of all wells appears to be over 100,000 barrels. This is extraordinarily good for an onshore US field.
200,000 barrels x $100/bbl x 75% revenue interest = $15 million. After tax and operating cost, a good percentage of the Bakken wells in this field would appear to be highly economic. EOG states in a link posted above that their North Dakota Bakken play is the "highest rate of return play in our drilling program."
Hi Piccolo,
Is it possible to get access to your data on the ultimate recovery per well drilled?
A rough calculation of EROI would be:
100,000 bbl ultimate recovery per well.
$5 million drilling cost
6.1 EROI
If the average URR per well is closer to 200k then double the EROI.
Not factored in is operating cost for the wells (but they seem very short lived so drilling costs may dominate) and the number of failed wells.
EROI of 6 and this is the hottest thing in US drilling.
Ultimate recovery for each well would take a little while to come with and is not part of the dataset I have.
How are you getting EROI? I can't think of any combination of the numbers provided to get to 6.1.
I may have misunderstood what you posted. I thought it was expected URR per well. But it was production to date average?
Here is how I do the calculation:
Find the URR for a well. Convert that into gigajoules. (6.1 Gj per BOE is the value I used).
Take the dollar cost to drill the well. Convert that into gigajoules. The conversion is done by using the energy intensity of an industry in j/$. In the case of the oil and gas industry, for 2005 that was 20e6j/$. Drilling is about twice as energy intense as the US average. The energy intensity value came from Dr. Hall's EROI nat gas paper.
So 100k bbl out per well = 6.1e5Gj and $5 mil to drill the well = 1e5Gj
EROI = 6.1e5Gj/1e5Gj = 6.1.
So what would be really useful is a distribution of the URR for wells drilled and $ distribution for wells drilled. Then we could create a really good estimate of EROI.
When we sent a draft of this post to Heading Out for his review, he commented that he had heard someone working in Bakken claim that they were able to drill horizontal wells for less than $3 million. I presume if they were doing fracturing, that would add to the cost.
I haven't seen the actual data, but my guess is that there is a distribution of wells - some producing well over 200K, some 100K, and some much less. It would be worthwhile trying to figure out what a real average is, including any "dry holes" that still are part of the overall cost.
The production in these wells is clearly dropping off very quickly. If the average production per well is 79 barrels a day (October 2007) and we could assume that they could get the equivalent of this rate for three years (probably it really would be longer, but the average would be lower than this), then we would be talking about 79 x 365 x 3 = 86,505 barrels per well. With the rapid drop off, I am wondering if it would be even lower than this - perhaps 60 x 365 x 3 = 65,700 per well.
We might get to the 6 EROI, but with a lower cost per well and lower output. It would be worthwhile trying to investigate what is really happening.
After I looked at this a different way, I think my estimate of the average production per well may be too low.
If you look at Figure 7, one way of making an estimate is by determining the number of barrels of oil added by horizontal wells, divided by the total number of horizontal wells including drop-outs.
The number of barrels added by horizontal wells looks to be at least 140 million barrels - that is, the 70 million to date since horizontal wells were begun multiplied by two. It could also be higher than that, but for now assume that peak horizontal production is now.
How many horizontal wells would be drilled to produce the 140 million barrels? Clearly it is not just the horizontal wells currently in operation (95% x 951) = 903 wells. There would also be some drop-outs on the way up, some dry wells, and some holes drilled on the way down. If there were no drop-outs, dry wells, or holes drilled on the way down, the average would be 155,000 barrels per well.
One can only guess at drop outs on the way up and number drilled on the way down. If the total were something like 300, one would get 903+300 = 1,200 wells. If production were 140 million barrels, this would come out to something like 117,000 barrels a well. If the number is a lot higher than 300, it would bring the average down.
This isn't a very good method, but gives the idea that it would be possible for average production to be 100,000 a well or higher. It doesn't seem like one could get to average production of 200,000 barrels per well, unless peak is long way off, so the total production is much higher than 140 million barrels. In that case, the total number of horizontal wells would be much higher also.
Looking at more refined data would be much better than this approach, but I thought it might provide some insights.
Good idea.
If I rerun the calc with 120,000 URR per well and 3 million drilling cost then we get an EROI of 12.
To add some perspective to all this:
“….production would peak somewhere in excess of 100,000 barrels per day but likely never matching peak output from Thunder Horse (250,000 b/d).” Posted by Dave Cohen
100,000 barrels a day. This represents (approximately) a whopping one eighth of one percent of daily world consumption, considering an All-Liquids total of around 85 million BPD.
************************
“9. Per-well Bakken production peaked in August 2005 at 116 barrels a day, and was down to 79 barrels a day in October 2007.” From Original Post
79 barrels a day? Nothing more than glorified stripper wells.
************************
“The number of barrels added by horizontal wells looks to be at least 140 million barrels”
“The production in these wells is clearly dropping off very quickly. If the average production per well is 79 barrels a day (October 2007) and we could assume that they could get the equivalent of this rate for three years (probably it really would be longer, but the average would be lower than this), then we would be talking about 79 x 365 x 3 = 86,505 barrels per well. With the rapid drop off, I am wondering if it would be even lower than this - perhaps 60 x 365 x 3 = 65,700 per well.” Posted by Gail the Actuary
140 million barrels = approx. 40 hours of world consumption.
86,505 barrels over the lifetime of a well? Didn’t wells in the early days in Texas and Saudi Arabia pump out this much in just several weeks?
***********************
To paraphrase Dorothy: “Well, Toto, its pretty clear we aren’t in Saudi Arabia anymore.”
Antoinetta III Posted on Oil Drum 4-23-08
'......had heard someone working in Bakken claim that they were able to drill horizontal wells for less than $3 million."
encore operating company made that claim in their recent analyists meeting.
opertators on the north side of 4540 are claiming they can drill and complete,
shallower, bakken wells for $1 million (and with shorter laterals on 160 ac spacing).
The THAI process looks like a better investment to me even at $60/barrel, about 1,200 barrels/day for a well pair over maybe 5 years:
won't solve the peak oil problem though.
brigham exploration, bexp, stated in their april 18 analyists meeting that the break even point(on a discounted cf basis) for a horizontal well is 158k barrels. bexp uses about $5 million for drilling and completion costs. encore operating made the claim in their analyists meeting from a few weeks ago that they can drill and complete a horizontal bakken well for closer to $ 3 million.
The numbers I have seen range from $1.7 million (petrobank in Saskatchewan) to 6 million (EOG) per well.
The payback seems to be in 3-11 months. For several of the active regions they are getting 80+% successful and profitable wells.
a few comments and a few questions.
pitman,price and lefever make a claim in their paper (at least implicitly) that the natural fractures in the bakken are horizontal. what are your thoughts on this, and do you have an explaination for this truely wierd (if true)phenomenon ?
you make the statement:
"The pressure is high enough to create large artificial fractures that can extend hundreds of feet from a wellbore"
are you claiming that the hydraulicly created fractures are also horizontal ?
if not, then a (vertical) fracture that can extend hundreds of feet from a wellbore would likely result in excessive water production.
you also state:
"but the hydrocarbon was cooked in place and little or none of the created hydrocarbon migrated to other potential reservoir rocks.*"
well, i disagree. the oil produced in canada is (according to price,etal)outside the thermal maturity window and if it didnt migrate there, how did it get there? i believe price acknowledges that oil produced from the lodgepole is bakken sourced. others claim that madison produced oil is bakken sourced, price disagrees, i dont know.
also the elm coulee field is interpreted as a stratigraphic trap. without oil migration there would be no trap, no need for a trap.
aside from these questions, doubts, i think you did a great job of pulling all the current information on the bakken together.
footnote: i sold my few shares of brigham exploration earlier in the week.
*i assume this statement is based upon price's opinion
A rule of thumb is that hydraulic fractures should be horizontal above about 2000 or 3000 ft, and vertical below that depth. The reason for this is the magnitude of overburden stress (the weight of overlying sediments) compared to the X and Y direction stresses at the same depth. Above 3000 ft. the overburden stress is the least of the 3 stresses, so the fracture is horizontal.
At depth, almost all induced fractures are vertical. In some areas with very high horizontal stresses, perhaps the induced fracture could be horizontal at depth. From work that I've seen by Schlumberger, their model also shows vertical hydraulic fractures in the shale. It may be possible for natural fractures to be horizontal, but really, the same laws of physics should apply.
The question of sourcing of the Bakken, I can't give a detailed opinion on except to say that my read of the Price study seems to indicate that it was sourced in place. Maybe I need to go back and look at that.
Isnt this area exactly where a huge amount of wind-power is/or should be developed? Certainly both projects would dovetail.
I think the USGS uses a standard definition for technically recoverable...i.e., the technology exists and can be employed to recover said material. It does not include a cost consideration and for that reason technically recoverable is always more than economically recoverable values.
I am coming to this conclusion also. I had never stopped to think how far apart the two could be, until recently. The difference could explain quite a lot.
Piccolo,
Thanks for a very detailed review of Bakken and it's prospects. I confess I skimmed at lot of the material.
Still one question I don't see discussed: What does the need for all these quite low-flow wells do the the overall expected EROEI for the whole formation?
Thanks,
Roy
And how many low flow unconventional oil and gas wells does it take to offset the declines from older, higher quality conventional reservoirs? And do we have the manpower and equipment to drill, complete and operate the wells?
Or, as I have put it, there is a huge difference between oil companies making money in conventional and unconventional plays in post-peak areas and making a real difference in total production.
Any way you slice it, IMO it is not a good idea to be on the wrong side of the consumer/producer equation regarding food & energy.
I did a simple calculation just upthread. About 6-12 EROI. And the best technology we have. What this means to me is that by the time there is no oil left on the market (2030 or so) there won't be any US oil left with EROI higher than the 5 minimum Hall estimates is required.
ELP and Electrified Rail!
If I understand your question correctly, the low-flow wells come with the territory. Before a well is drilled, there is usually a fairly wide error bar in predicting how much it will produce. After it's drilled, operators will produce the well to the economic limit, when revenue equals operating expenses.
Before drilling, the calculated EROI on a low flow rate well is low. After drilling, if the energy used to drill is considered to be "sunk energy" (like sunk cost), then the EROI per new barrel produced is high.
Re "sunk energy"
From a non-specialists perspective, I wouldn't ignore the energy cost of drilling a new well as "sunk energy", especially as it seems the main trade off might be EROEI vs flow rate. The more wells drilled the higher the flow and the lower average life of the wells. No? With fewer wells and longer well lifetimes we have much lower yearly production but higher EROEI and perhaps greater total extraction. (With due apologies to experts for not considering porosity, viscosity, distance between wells, etc.)
Piccolo,
I must echo the thanks of others. Not being a Petroleum P. Eng, I rely on expertise such as yours to piece together the myriad of information that is out there to help filter out the noise that is the MSM.
I would ask, if anyone has the info, (or can point me to the info) to help flesh out the facts on the Canadian portion of this Bakken field. Sadly since Stoneleigh has been focusing on the Automatic Earth, there has been no action in TOD Canada.
Thanks again to all that make this site what it is, and the (generally) open discussion that we can have.
Best Hopes the American Government keeps focused on the oil elsewhere and forgets about what is lying under the ground just a few hundred miles north....
you can get some of this info from the websites of publically traded companies. petrobank comes to mind. there is also a royalty trust, i believe cresent point energy trust, that is active in this area. there are others.
A quite illuminating read and an excellent addition to the grist that must be milled when looking at this area. I had spent time at the ex-Amoco refinery in Mandan, N.D. (now Tesoro I believe) in the early and mid 90s and my recollection of their outlook for the future was not awe inspiring.
The boost in attention given to this area, to me anyway, simply points out the lack of better prospects to turn to elsewhere, sigh.
Thank you very much Piccola and Gail for the time you spent on this excellent post!
Your comment about not having better prospects elsewhere was exactly my comment about Brazil's Tupi last year. The fact that people are excited about this gives us an idea how little is available with reasonable effort elsewhere.
Is there a site that does the same for wind and solar that the oil drum does. It's like watching the ship sink with all this discussion of how much. The only question of concern is how long before the price escalates to cause the dislocations that will bring down the economy.
I am familiar with the environmental impacts being argued about the Canadien tar sands...what is the environmental issues with the Bakken drilling underway with horizontal wells and hydrolic fracturing?
The percentage of US electricity produced by Solar went up from .064% in 2002 to .070% in 2006. The percentage by wind went from .105% to .258%. The amount from fossil fuels went from 83.994% to 85.307%.
Wind and solar may be big in the future but they each have a long way to go to warrant the amount of attention and subsidy they get. California will spend $2.9 Billion to encourage roof top solar. This type of spending is nothing but political vote buying. It does nothing to advance the science of solar energy. The subsidy to corn farmers is doing nothing to solve the problem but it is causing poor people to go hungry.
The TOD site is a great site because it follows the Willie Sutton Law, which is to spend your time and effort where the money is.
Jack: This doesn't get mentioned enough with all the solar and wind hype. These minor increases were in the context of a 500% increase in oil prices. At the current rate wind and solar won't be material overall even when oil is at $1000 a barrel.
I'd agree that many get carried away about wind and solar, and as far as I am concerned the notion that we can power the whole of society any time soon on renewables is not founded on reality.
However, that is not to say that major inputs will not come from wind and solar where they are a good resource.
To date most of the solar, for instance, has been built in locations like Germany, which is about as unsuitable as you can get for it.
This has resulted in utterly cost-ineffective demonstration projects, eco-bling whilst the real heavy lifting remains coal burn.
You are in a different ball-game though when you use resources where they are appropriate, and costs have now dropped to a point where, for instance, for peak energy use in hot areas solar should fit the bill, particularly with rising NG prices:
http://www.sciam.com/article.cfm?id=solar-power-lightens-up-with-thin-fi...
IOW now that it is approaching economic levels in some circumstances, then future build will be orders of magnitude bigger.
Although it was unrealistic in Germany, and will be for the foreseeable future, the build there has enabled costs to be driven lower so that more favoured regions will shortly be able to feed in a major new source.
The rise of solar energy should be similar to the explosive growth in the aluminium industry as costs dropped - in the US alone out of a total electricity production of around 1000GW, just 450GW is base-load - there is a heck of a lot of peaking power up for grabs.
The economics get still better as you can build solar where it is actually needed, rather than transport it large distances:
http://www.nanosolar.com/blog3/2008/04/16/municipal-solar-power-plants/
If you put in the current 35% or so growth rate, then it doesn't take long for the present insignificant fraction to become very significant indeed.
Total generation is closer to 460 GW average, not 450 GW base-load. I'm not sure what fraction of the total is base load, but it's way short of 95%.
Correction noted.
Thanks - I am a lot more familiar with UK figures.
Re-check your arithmetic. The totals for wind are given at the EIA and come to 0.27% in 2002, 0.64% in 2006. Installed generation increased more than 50% in 2007, so wind generation probably came to around 1% last year.
Thanks very much for this post. The Bakken reminds me of the emergence of the Barnett shale back in 2000. The Barnett is a tight gas reservoir which has seen enormous production growth and has made a real difference to the outlook for gas production in North America. Back in 2000 nobody predicted how big the Barnett was going to get and many were not very impressed with it.
While there are clearly serious challenges in exploiting the Bakken the technology involved and the understanding of the field is only going to improve in future years. Technically and economically recoverable reserves are likely to rise over time as rock fracturing technology improves.
Even if that happens the Bakken is not going to be big enough by itself to overturn the case for peak oil. A 30 billion barrel field would only make a one year difference to the timing of peak oil. However, if there are other "Bakkens" in other parts of the world then these kinds of tight reservoirs could have a big impact on the peak oil story. This story and the deep water story are areas which peak oil advocates need to pay attention to.
I'm in Regina (largest city at the top of the Bakken Play) and there is a lot of land aquisition activity and hype going on in Saskatchewan over the Bakken.
Bakken oil formation has industry gushing
Petrobank Bakken page
Saskatchewan Record land sales eclipsing Alberta's
Reece Energy Acquires Saskatchewan Land
From Petrobank article:
From Saskatchewan Record land sales eclipsing Alberta's
It should be noted that the reservoir depths in Saskatchewan are considerably shallower than those on the US side; hence the lower well costs.
In case readers didn't understand, your analysis is really looking at the US side of the Bakken. The Canadian side is in addition. If the US side is not too large, it is probably reasonable to assume that the Canadian side isn't too large either, but total Canadian Bakken production could be larger than US Bakken production, especially if the Canadian side is less deep.
One thing that strikes me is that some individual companies may do well in Bakken, even if total production is not huge in relationship to US or world oil usage. The ones that are likely to do best are the ones in the most favorable areas - areas where wells are less deep and have better reservoir characteristics.
Won't Saskatchewan be over the moon. All these years of bieng Alberta's resource poor relation and now this comes along.
Check out Ryland Oil news release re discovery. Geologist w/RYD was the guy who made Elm Coulee happen. I would love to hear comments form anyone w/oil background on the news. Here is the link to Sedar go to the April 23 English News Release:
http://www.sedar.com/DisplayCompanyDocuments.do?lang=EN&issuerNo=00003293
akguy
Curious what are the prospects moving east of Mountrail into ward county. There is the lonetree field about 25 miles east of the austin field that i believe is mission canyon. The usgs report didnt count anything in ward county as continuous. I dont think htere has been many holes ever poked below mission canyon there. Thoughts?
there is a rumor that the behm/edwards well in 33-154-88 is a dry hole (er.....that would be an economic dry hole but maybe not a technical dry hole). this may define the eastern limit of the parshall field.
a discussion of the behm/edwards can be found here:
http://bakkenshale.blogspot.com/search?updated-min=2008-01-01T00%3A00%3A...
i think that some operators are still looking, at least buying acerage in dunn county.
There are some USGS slides about their methodology posted here.
Unfortunately they talk in generalities, and don't give any specifics on the details of how they came up with the Bakken numbers.
Also on slide 18 they say that, to the end of December 2007,
- 105 MMBO was produced
- Montana and North Dakota produces 200,000 BOPD and 26 MMBO per year.
- North Dakota alone produces 70,000 BOPD.
Comparing to my analysis,
- I estimated about 111 MMBO produced. It is not surprising that the numbers do not agree exactly. "Official" state production numbers will not agree exactly with the numbers in the database I used.
- The 200,000 BOPD must be a summation of individual well peak rates or something. I estimate Montana and North Dakota together produced about 75,000 per day at the end of 2007, which is 27 MMBO per year, which is close to their 26 MMBO figure.
- There is no way that North Dakota alone produces 70,000 BOPD from the Bakken. That is close to the Bakken total for both Montana and North Dakota.
nd produced a little over 20,000 bpd from the bakken for all of 2007.
https://www.dmr.nd.gov/oilgas/stats/statisticsvw.asp
According to the ND website stats, there were 457 wells producing the oil in North Dakota Bakken. Calculating it out, the average daily production in North Dakota was 44 barrels a day, which is lower than Picollo's average. This is to not too surprising, if it is the deeper and less productive area.
Here's an unsettling thought.
The current administration has been involved in documented suppression and distortion of the findings of government scientists.
The EPA is perhaps the best example along with James Hansen of NASA. I have also heard mentioned of pressure on the EIA related to production and imports, and the Bureau of Labor statistics, related to inflation, although I do not have links about those.
This type of interference begs the question of whether the USGS Bakken number is a political number or is based on true science. As I mentioned in my post, the very low p5/p95 ratio strikes me as unrealistic because it is way too small. Is this a symptom of pressure to arrive at a certain "right" answer? Truly I hope not, but this is not out of the realm of reason considering other similar behavior by the administration.
the usgs has historically been engaged in the privatization of us assets. i dont have much actual history of the usgs, but i know for certain that they were instrumental in opening the western us to mineral exploration.
so it is not too surprising if they are pimping the bakken. look who is a major benificiary..............(drum roll)..........halliburton !!! sound familiar ?
it seems a little unbelievable that cheney could have that much influence, but look at what is happening in iraq. BIG profits for howco(nobody uses that term much anymore). the model that seems to fit this administration best is the looting of the treasury model(look at the national debt in the last 8 yrs).
anyhow i think the usgs has done a good job at what they do. and in the interest of full disclosure, about 1/4 of my pseudo-retirement income is derived from a prospect i developed based on a usgs study (olive-1957).
I don't think we need conspiracy theories of one man's corporate buddies asking him to get agencies to give the "right" reports. When you work in a big organisation, corporate or public, you know what the bosses want to hear.
Some people will just go along saying what they think is the truth regardless, but those people tend not to get promoted. Most people know how to pull with the rest of the team and not rock the boat.
So it seems that if you work in the USGS, you know that the bosses want to hear optimistic reports. I'm no geologist, but surely at some point in these reports there are some educated guesses going on. So... you can do an educated guess on the conservative side, or an educated guess on the generous side. One will get you praise from the bosses, the other will get you a meeting where they grill you. Which do you choose?
I can think of a lot of people who are unhappy with a lot of other agencies. The FDA has done nothing to keep the food supply in reasonable shape. It is just what will make a profit for those selling the food. There are any number of harmful chemicals that are included in food, that we know perfectly well are harmful. On the other side, the omega 3 fatty acids that we need have been removed, because they don't keep well without refrigeration. No wonder we have so much depression and ADHD! As far as I can see, it is basically a bad food problem.
The Autism Society of America has felt the CDC was suppressing information about mercury and vaccines. More recently, we have the formaldehyde in the trailers problem that CDC and FEMA were jointly involved with.
Before we hang the administration for malice, we should remember Hanlon's Razor: "never attribute to malice that which can be adequately explained by stupidity".
It took a massive dose of "group think" for America to agree to starve hungry people while putting corn oil in gasoline tanks. Corn oil: a weak, high cost fuel that wins votes in the Iowa Caucuses.
Yes, the "big boys" are out to make big profits and the big money is in oil. The massive subsides going to a number of alternative projects will make other players very rich but these are tiny relative to the future profits from oil. The most recent run up the price of oil is going to encourage a lot of drilling and fracturing. The cost per barrel is still small compared to the equivalent cost of alternatives.
I guess I do not find it too unsettling, because it is business as usual for a high visibility government agency. Having worked in one before, political pressure (sometimes from Congress, not the Administration) was the norm.
And that is probably as it should be, given the "government" of the US is not supposed to be an entity separate from the citizenry. That is, the EPA serves those whom it regulates.
I skimmed the comments from the EPA employees in that study (to which you had linked.) What leaps off the page is that the co-mingling of the scientific work with the policy work is causing grief. The approach to improve this would be to separate the scientific work out into its own unit, while the policy setting unit could (should) make public whether it accepts (in whole or part) the work of the scientific unit. However, to make changes like this will require Congress to change the set up of the EPA (and maybe the DoI.)
So, would it surprise me that the USGS estimate had been influenced by political parties (the prime suspects being the congressional delegation from ND and MT)? No, but such influence can often be subtle and not explicit, so that if you think you can uncover a smoking gun you likely will become frustrated.
So we are left with the realization that estimates are just that, and one definition of an "estimate" is a "judgment of the value", and I believe the word shares the same Latin root as the word "esteem". These are human actions, fully suspect to human foibles.
Some thoughts on Bakken production in Canada
1. The sweet spots get drilled first, so the areas of the Bakken that yield higher IP's per well will give you a faster payout on investment and also a higher NPV per well. Currently, everyone is chasing the sweet spots, but the less prolific areas will get drilled later on.
2. Costs in SE Saskatchewan are running around $1.9 million per horizontal well drilled, completed and tied-in, including a share of capital costs for production facilities and gas processing, and also including 7-10 x 15 tonne multi-stage fracture stimulation job. The reason it's cheaper in Canada is that its shallower at about 1,600 m depth. Most horizontals have a single lateral 1,500 to 1,600 m in length.
3. In the Viewfield area of SE Sask, production rates from the newer Bakken wells (2007-2008) have averaged 12,000 bbls in the first 3 months, with first year production around 33,000 barrels. Revenues are enhanced by 15% from liquids-rich solution gas recovery, so with oil prices of $85.00, you get a net price of $98.00 per boe from which deduct $25.00 for lifting costs, royalties and production taxes, so payout is less than 1 year. Horizontal wells also qualify for reduced Crown royalty on the first 37,000 barrels of oil produced, which will accelerate payout by about 1 mo. on Crown leases. Discounted Revenue to Investment Ratio can be as high as 4 to 1.
4. At Viewfield, individual well production rates decline from an IP of around 190 bopd, to 100 bopd after 3 months, to 60 bopd after 1 year and is expected to level out at around 50 bopd after 18 months, followed by a long slow steady decline of around 10 percent per year. Ultimate recovery by natural depletion is expected to be 175,000 bbls of oil per well, of which 25% will occur in the first 18 months. Initially 4 wells per sq mile, and indications are for recovery of 15% of OIP by natural depletion.
5. By accumulating a large land position, oil companies can stage their development over a longer period of time in order to avoid having to build larger production facilities and pipelines than will be needed after the inital flush production period. It appears that producers in SE Sask will gradually build production over the next 5-6 years, with peak annual production at approximately 8% of ultimate recovery, and average individual well rates at around 50 bopd at peak field production, as compared to individual well peak rates of 190 bopd at start of production. For a field with 1 billion barrels of recoverable oil, this would mean peak production of approx. 220,000 bopd.
6. There are other areas of Bakken development in SE Sask, but the Viewfield area is the most active, and appears to cover an area of 1,500 sq mi, with oil in place of over 6 billion bbl. This area alone could have 900 million barrels of recoverable oil, and peak production of 200,000 bopd (230,000 boepd).
Hi Red-Dog,
Very useful info. Can you tell us more about what is included in "lifting costs"? I want be sure I understand that this is running pumps. Is it also paying for transport down pipelines? Do you have any information on how much of that $25 is lifting cost and how much is taxes and royalties? Any links to this kind of information on line?
Without lifting costs, the energy return in quite good on energy invested about 28. Including them, it drops to 8 to 1.
This is where energy accounting ends up telling a very different story from regular accounting. A $ of gasoline has a huge number of BTU in it. Same with a $ of steel. So it is very easy to use a lot of energy without spending very many $. That makes things profitable in $ that are not nearly as good in energy.
These are very rough estimates. Without detailed accounting, it is the best we can do.
Hi back JonFriese,
Lifting costs include running pumpjacks, oil batteries and include field labour and maintenance. It doesn't include transportation of the oil to the purchaser. It also does not include depreciation of equipment or other non-cash expenses.
Lifting costs are approx. $10 per bbl, taxes and royalties are approx. 15% of value of oil and natural gas.
Probably 2/3 of costs are fixed, so later on in the life of the field, as average well production declines, the cost per barrel will trend upward.
I am pretty sure that the Bakken play will give a significantly positive energy return, but I am of the opinion that pre-tax economic return on capital employed is the best indicator of project viability.
I have ventured the opinion in the past that a revenue-neutral refundable energy tax could be the way to measure energy content of goods and services.
red-dog
rd, yes very useful info. 92% decline for 3 mos, followed by 49% decline for 9 mos,followed by 30% decline for 6 mos and 10% decline thereafter. this appears to be the same "general" trend from wells on the nd side of the border, except with higher and probably more variable initial rates.
wells drilled in the sweet spots, such as viewfield in sask,elm coulee, mt and parshall,nd will return very attractive economics. quick payout followed by long and steady production at lower rates.
presumably your 4 to one discounted pv is based on a constant oil price, with potential for even higher prices in the future.
the jury is still out on other areas. i am assuming a lot of economic dry holes(vs "technical" dry holes) will be drilled.
if you would, who are some of the players on the north side of the border?
Crescent Point 30,000 bopd + and Petrobank 12000 bopd + from Bakken in Saskatchewan are I think the two biggest players
Tristar has about 10,000 bopd in Southeast Saskatchewan and 650 net drilling locations.
MLI/NAL [Manufacturers Life Insurance/NAL Oil and Gas Trust (NOIGF.PK)] partnership acquired two private companies, Tiberius Exploration and Spear Exploration, for a total of $115 million. The new partnership receives 3,336 acres of land, 2.1 million barrels of P+P reserves and a current 925 barrels of daily production.
http://nextbigfuture.com/2008/04/saskatchewans-portion-of-bakken.html
http://nextbigfuture.com/2008/02/marathon-oils-bakken-play.html
http://biz.yahoo.com/ccn/080311/200803110448018001.html?.v=1
http://seekingalpha.com/article/65909-the-bakken-trend-increasing-in-value
From the end of 2007, incomplete survey of 56000 barrels of oil per day from known Canadian companies plus the rapidly rising 75,000 barrels of oil per day identified from the Oct 2007 database for North Dakota and Montana. So already 131,000 barrels of oil per day plus from Canada + USA Bakken at the end of 2007.
In the range of 300+ wells being drilled on the Canadian side in 2008.
Petrobank indicated that its initial production Thai project should be producing 10,000-15,000 bopd late 2009. Expansion to 100,000 bopd in 2010 and after.
4 to one pv ratio (actual 3.7) based upon oil price of $85 per barrel oil, no price escalation or cost inflation. This is for sweet spot at Viewfield with inital production of 190 bopd, 12,000 bbl oil in first 3 months, 175,000 bbl oil recoverable, plus 15% revenue boost for rich solution gas.
Current oil price is around CA$120/bbl, using this constant price gives pv ratio of 5.5.
Of course if oil price stays high, we are likely to see a lot of inflation, both due to high demand for oilfield equipment and services, and also due to higher costs of nearly everything else because of energy costs embedded in other goods and services. Also potential for high general inflation because of huge monetary stimulation especially in US UK and EU, led by monetisiation of ABS from the central banks buying the toxic paper in exchange for Treasuries.
Safer to evaluate assuming recession and lower oil prices and hopefully low inflation (crossed fingers here).
This is a resource play, and at a high enough price, much of the Bakken area within the Williston Basin could be economically developed. At current oil prices a lot of technical dry-holes could still be economic.
Take for example a well drilled outside the sweet spot in an area where OOIP per sq mi is only 2.0 million bbl, or 40% of the Viewfield area, and recovery is only 10% or 50,000 bbl per well. This well will still probably produce on the order of 9,500 bbl oil and recover 50% of investment in first 18 months, at current netbacks, and probably achieve full payout in just over 3 years.
Remaining reserves after payout of 30,000 bbl will generate some positive return on investment.
Ergo, an economic well once drilled, however a technical dry-hole, because no further wells will be drilled in the area as the economic hurdle rate will not have been met.
Thank you, Piccolo, for an excellent report and to The Oil Drum for publishing this information.