The Myth of Election Year Price Manipulation
Posted by Robert Rapier on October 8, 2008 - 10:15am
It seems that every election season, conspiracy theories arise that the oil companies are trying to bring down gasoline prices in order to influence elections. The thinking is that oil companies tend to favor Republicans (true) and that they bring prices down to help Republican candidates. When I hear this sort of talk, I try to explain to people that U.S. oil companies control so little of the world oil market that there isn't much they can do to influence prices. They simply don't have the stroke that people think they have.
But a poll in 2006 showed that nearly half of Americans thought Bush had successfully manipulated prices down as the election approached:
Almost half of all Americans believe the November elections have more influence than market forces. For them, the plunge at the pump is about politics, not economics.
Retired farmer Jim Mohr of Lexington, Ill., rattled off a tankful of reasons why pump prices may be falling, including the end of the summer travel season and the fact that no major hurricanes have disrupted Gulf of Mexico output. “But I think the big important reason is Republicans want to get elected,” Mohr, 66, said while filling up for $2.17 a gallon. “They think getting the prices down is going to help get some more incumbents re-elected.”
No doubt that incumbents like to see gas prices falling ahead of an election. But having any real power to influence price is a different matter. Since gas prices are once again falling as we head toward an election, I thought I would try to put this myth to rest. So, I decided to tabulate the price behavior of gasoline stretching back over the past three presidential elections. I chose to track the price from the beginning of summer driving season - Memorial Day - until the first part of November when the elections take place.
The results are shown below:
| Year | Memorial Day | November 1 | % Change | Comments |
|---|---|---|---|---|
| 1996 | $1.32 | $1.27 | -3.8 | Presidential election (PE) |
| 1997 | $1.26 | $1.22 | -3.2 | No elections (NE) |
| 1998 | $1.11 | $1.05 | -5.4 | Congressional elections (CE) |
| 1999 | $1.15 | $1.27 | 10.4 | NE |
| 2000 | $1.58 | $1.57 | -0.6 | PE |
| 2001 | $1.74 | $1.25 | -28.2 | NE; 9/11 |
| 2002 | $1.43 | $1.49 | 4.2 | CE |
| 2003 | $1.53 | $1.58 | 3.3 | NE |
| 2004 | $2.09 | $2.08 | -0.5 | PE |
| 2005 | $2.14 | $2.42 | 13.1 | NE; Hurricane Katrina |
| 2006 | $2.94 | $2.25 | -23.5 | CE; refining capacity recovers |
| 2007 | $3.25 | $3.06 | -5.9 | NE; gas prices set records |
| 2008 | $3.99 | ? | -? | PE; gas prices set records |
Table 1. Comparison of Gasoline Prices Between Memorial Day and Elections Source: Energy Information Administration
Personally, I think one would be hard-pressed to find a pattern there. The biggest price drop happened in a non-election year, albeit it was an anomaly caused by 9/11. Of the thirteen years recorded, gasoline prices fell between Memorial Day and November during nine of the years. This is what I generally tell people: Prices fall for seasonal reasons, and do so even when there are no elections. The reason prices fall is that demand for gasoline falls after the summer. The price generally peaks in early summer, and following Labor Day in early September the price falls. (The details of why this generally occurs was explained in The Transition to Winter Gasoline).
Of the presidential election years, the price fell in 1996 when President Clinton was running for reelection, was essentially unchanged in 2000 and 2004 when President Bush ran against Al Gore and then John Kerry, and will almost certainly fall this year as oil prices pull back from their record highs.
In fact, if you take out the major anomalies on the graph - the slowdown caused by the 9/11 attacks, and the 2005 run-up of price in the wake of Hurricane Katrina, followed by easing in 2006 as refineries recovered, the truth is that gas prices usually don't change dramatically between May and November - election year or not.
So why does this myth persist? There are a couple of reasons I can think of, but I think they generally fall under the category of confirmation bias. There really isn't a strong pattern of gas price behavior (other than a stair-step up year after year); people just notice it more in an election year. In addition, because prices rise and fall over the course of any year, you can always point to a price drop in an election year to support possible biases. But if you use objective analyses (e.g., start and stop the price check on the same date every year) the non-pattern becomes obvious. Had I allowed my dates to be variable, no doubt I could have shown prices falling during any election year. Or, I could have shown them rising.
As for the idea that the president has that much power, all he can really do is go with his hat in hand and beg the Saudis to pump more oil in an attempt to ease prices. OPEC has indeed had historical pricing power, but even that is eroding as spare capacity dwindles. But the idea that Bush can pull any strings and get Big Oil to manipulate gas prices demonstrates that people give him, and Big Oil for that matter, far too much credit. Besides, as Joanne Shore, an analyst at the EIA noted in the previously linked article “What company in their right mind would step forward to kill their profit?”
I won't go so far as to say that gas and oil prices can't be manipulated. OPEC as a group can manipulate prices if they still have a couple million barrels of spare capacity. But U.S. oil companies do not have the power to manipulate prices to impact elections. I would further argue that for those who do think oil prices are presently being manipulated down, do you also believe that they were being manipulated upward as they rose to near $150/bbl? After all, that manipulation argument can cut both ways.
Contact
- Content: editors at theoildrum dot com
- Tech support: support at theoildrum dot com
License

This work is licensed under a Creative Commons Attribution-Share Alike 3.0 United States License.
Well put Robert. But the fact that the majority of Americans would say that you've been bought off by Big Oil highlights the general problem with getting the populace to begin seriously addressing PO. They would rather blame the "invisible hand" then accept responsibility for their own gluttony. Add the fact that the 2-party system will do anything to keep such divisions alive in order to hide its collective culpability it's difficult to imagine the American thought process altering to any great degree. I do find solace here among all the clever folks at TOD but I never forget how outnumbered we are.
It's totally clear that Robert has been bought off by people who want to gouge us. How could it be otherwise, why shouldn't we be able to buy as much gas as we want at a (criminally low, strikeout) reasonable price using dollars? What do you mean the rest of the world drives smaller cars and pays more? that's just because they are commie surrenderists trying to take us over. We need to cut back THEIR consumption, after all things were OK before chindians started driving cars. Anyway if this peking oil thing is half right how can i make enough money out of it to continue running my yank tank? After all us hockey moms gotta stick together, wink!
/sarcanol off/
Robert, good data but I think your conclusions are a little too hasty. We actually have very good evidence of price manipulation in 2004: straight from the mouth of Bush himself. If we can believe Bob Woodward, that is. Woodward wrote in State of Denial about a conversation between Bush and Saudi Prince Bandar, thanking Bandar for increasing production in 2004.
I agree entirely that the US oil companies don't have the market power to influence prices significantly. But as you write, OPEC still can, and in particular Saudi Arabia. Confessions of an Economic Hit Man is a good review of the very interesting history between Saudi Arabia and the US.
I've got State of Denial: Bush at War Part III sitting on my table at home and Woodward does say that President Bush thanked Bandar Bush for Saudi Arabia adding extra crude to the global market in the months leading up to the 2004 presidential elections to take the energy off the table as a major issue for the American voters.
The recent drop in crude prices has a lot to do with recent releases from the SPR, not from a decrease in global demand.
Here's an excerpt from my 10/4/06 blog post (http://blog.myspace.com/index.cfm?fuseaction=blog.view&friendID=69613389&blogID=176118880...
"Here's the transcript from 5:46 on from http://www.youtube.com/watch?v=JsDEXfhMH7E:
Wallace: "Prince Bandar enjoys easy access to the Oval Office. His family and the Bush family are close. And Woodward told us that Bandar has promised the President that Saudi Arabia will lower Oil Prices in the months before the election to ensure the U.S. Economy is strong on Election Day."
Wallace: "And you also say, Bandar wanted Bush to know that the Saudis hope to fine tune Oil Prices to prime the economy in 2004. What was key (Bandar understood) were the economic conditions before a Presidential Election."
Wallace: "Oil Prices are at an all time high!"
Woodward: "They're high, and they could go down very quickly. That's the Saudi pledge. Certainly over the Summer or as we get closer to the Election, they could increase production several million barrels a day and the price would drop significantly."
"The recent drop in crude prices has a lot to do with recent releases from the SPR, not from a decrease in global demand."
I don't think so, SPR stocks have decreased less than 5MM barrels. From 707,215 M barrels to 702,400 M barrels.
(EIA) That 6 hours worth of demand for the US and 90 minutes for the world.
MMS shows a shut in loss of 38MM barrels due to Hurricanes in the Gulf Since Aug 30th. Through Oct 8th.
Very true, a real eye-opener.
Robert, thanks for the great summary and clear-cut argument against pre-election gasoline price manipulation. I am inclined to agree. However, this I'm still curious about some relevant questions, here outlined.
Here are the weekly gasoline prices going from the end of May to the beginning of November for the four election years 1996-2008 (Source: EIA):
Due to the much higher prices, the year 2008 is given its own axis, but with the same scale as used for the 1996-2004 price trendlines. And 2008, of course, hasn't reached November at this time. Interesting: Each election year has had higher prices than the previous one, a reflection of the growing cost of gasoline over the past decade. The "Ike spike" is quite evident in the 2008 trace.
Looking at two points in time--the price at Memorial Day and Election Day--might miss some important trends. Note that in all these elections years, the price of gasoline did fall at points through the summer. This brings to mind a few questions: How much does the price of gasoline have to fall to have a favorable influence on the voting populace (if there is even a favorable response due to the price of gasoline)? In 1996, losing a dime a gallon from $1.30 to $1.20 might have had a much more significant effect than in 2008 going from $3.50 to $3.40. I point this out because 1996 looks fairly flat, but did lose about a dime a gallon going into the summer.
Also, how long is the voting public's memory (probably short)? A downward trend through much of the summer, with some escalation late in the season, as in 2004, still might carry some favorable response, as the perception may be of lower prices going into the election. Maybe.
Here is, by the way, another way of addressing the price manipulation question:
These are the prices post-election for the three years 1996, 2000 and 2004. With rampant manipulation, prices might be expected to climb at some point post-election as more agreeable profit-making is resumed after the vote. Prices did not climb during the two months after the three elections. Indeed, during two of the years, prices continued to fall and in 1996 prices remained remarkably flat.
Anyway, thanks again Robert.
-best,
Wolf
Prices did not climb during the two months after the three elections. Indeed, during two of the years, prices continued to fall and in 1996 prices remained remarkably flat
That is a very good point.
I believe it was a story posted on this site earlier explaining the drop in prices were due to a shift from summer to winter blends and that winter blends were cheaper. I noticed that prices in Eastern Oklahoma were about 30-50 cents cheaper than in North Texas this past weekend. I dunno if that's a relic from the supply problems caused by Ike or that the further south you go they still use summer blends.
The first time I noticed the steady drop in prices was during the 2006 election. I do believe their is manipulation around the edges but there isn't enough evidence that someone can be prosecuted for.
I believe it was a story posted on this site earlier explaining the drop in prices were due to a shift from summer to winter blends and that winter blends were cheaper.
I linked to my post on winter gasoline in the above essay. In fact, winter blends are cheaper to make, and the transition happens a couple of months prior to the elections. Further, the elections happen well after peak driving season. That's why prices usually fall after peaking in late spring/early summer - election year or not.
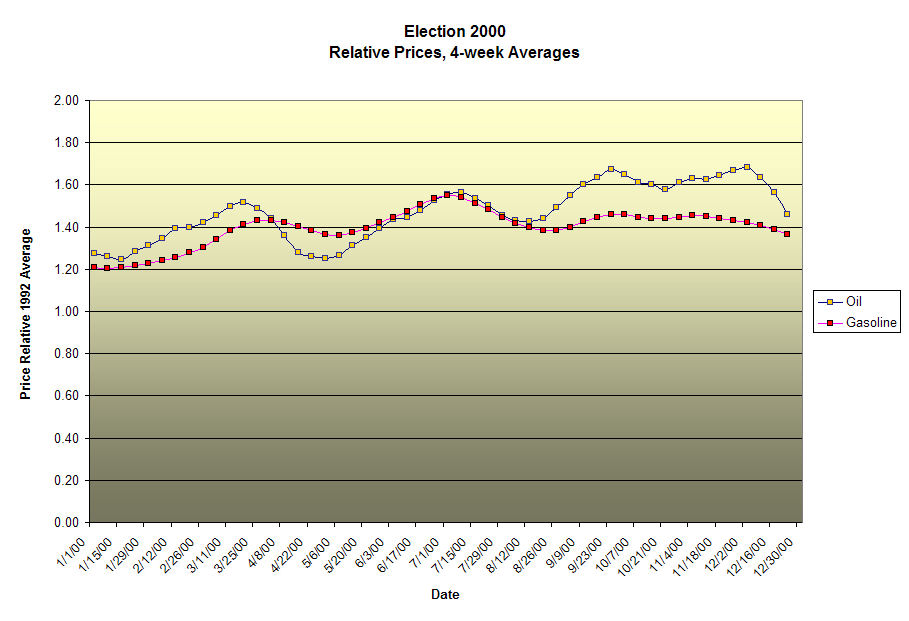
Here is the summary of gasoline prices for the past 19 years. The value for the first Monday report in the calendar year is set to a value of 1.00.
The value for each subsequent week is calculated relative to this value. As can be seen, the gasoline prices, on average, rise rapidly through the first half of the year, stabilizes during the summer driving season with some slight declines after the fourth of July and then begin to fall about 4 weeks before the first week in November. Oil prices have much more volatility but also show a similar average trend.
But U.S. oil companies do not have the power to manipulate prices to impact elections.
I don't support the view that prices are currently being manipulated. However, the claim that the market cannot be manipulated is highly dubious. There is a plausible mechanism of manipulation, which was discussed in the context of mid-term elections in 2006:
The NY Times discussing this same phenomenon: Change in Goldman Index Played Role in Gasoline Price Drop
Matt Simmons himself has stated that:
If you want to state that the market cannot be manipulated, and is not powerfully affected by speculators, you should directly address the more plausible mechanism noted above, and the arguments given by Simmons in the above paper. Personally, I wouldn't use the term "manipulation", but I would claim that speculators and other purely financial interests play a very large role in the market, going both up and down. Given that the entire financial system is rife with financial excesses and chicanery, I find it highly unlikely that the oil market is a temple of purity.
However, the claim that the market cannot be manipulated is highly dubious.
And of course I didn't make that claim. From the article:
Also, while I know that you believe speculation played a very big role in recent price run-ups, many here do not believe that. If they don't believe that speculation ran the price up, it's kind of hard to accept that it ran the price down as the speculators unloaded their positions (not my position, but in essence the position of many posters here).
It seems that the administration can have at least as much impact on oil price as OPEC.
Just count the number of times the administration threatened to bomb Iran, and the number of carrier battle groups in the area, this year vs. the previous two years.
By ceasing the saber rattling they can impact oil futures without conspiracies or other machinations.
Commodities markets are under the manipulation of the Federal Reserve Bank, Goldman Sachs and other large global institutions, although control varies with circumstance.
Hundreds of Trillions of Dollars are leveraged via the OTC Shadow Exchanges.
DeepCaster has some very good articles:
http://www.financialsense.com/fsu/editorials/deepcaster/archive.html
When Peak Oil becomes clearly supported by the Numbers these crook's will shove us over the precipice.
I wont talk about price maniupulation, I dont believe in it.
I agree with previous posters mentioning the winter blend of gasoline as a known source for reducing the price of gasoline into November. Perhaps the price reduction will be greater as oil prices have retreated at the same time, but yet there are still refining issues around Houston. Personally, I think this year is different than any other year, but the trend of the winter blend will continue to be present.
Robert:
I am going to disagree with you with regard to the Bush (II) timeframe as the degree of price manipulation is actually pretty evident.
First, let me state the following: my source of data is the WTI daily spot prices from the EIA averaged for a 5-day week. Each of the 5-day averages are then used to compute a 4-week average. This smooths the data somewhat (I also keep the original data plotted and it's obviously a lot noisier). I selected this 4-week averaging to help eliminate the pinging between the NYMEX front-month that could showup on the last day of the contract. The gasoline prices are the weekly composite (weighted) gasoline prices for all grades and all areas that are reported each Monday. These are paired with the previous week WTI average (both for the 1-wekk and 4 week values). These are rolling 4-week values that I've plotted.
Second, I actually started this project to demonstrate the "half-dome effect" of gasoline prices when oil prices increased sharply (sharp rise and gradual decrease).
Finally, I normalized all the data to be relative to the 1992 average prices for both oil and gasoline to demonstrate where and when the relationship breaks. I chose1992 because both oil and gasoline prices were actually quite stable during that year even though it was a Presidential Election Year.
A constructive criticism of your approach: it is not sufficient to pick a few days out of the year and then claim there is no pattern. In part, what you say makes sense and the evidence prior to 2000, indeed suggests lilttle ability to signficantly manipulate the market on a national basis. Regionally might show something different, but I haven't tried to burrow down that deep. But I'd also note the following, that oil market tightness since 2005 has probably limited the capacity to play with the prices.
Starting with the normalized data from 1990 to present we can see the decoupling
Zooming in a little closer since 2001 the data looks like this (I've added diesel prices to this one):
Only the election cycle of 2004 shows what looks to be manipulation when the price of oil and price of gasoline decoupled. The prices have mirrored since then, but the long standing trends of close coupled prices (relative to the 1992 prices) that existed from 1991 until mid-2004 have not returned.
So, let's zoom in on 2004.
Election 2004
A funny thing happened on the way to the Democratic Party and Republican Party National Conventions:
Notice that while thr price of oil increased beginning with the 4th of July, and in the prime of driving season, gasoline prices continued in a downward trend and until just a few weeks before the election (I'd say the timing was a little off and the price just could not be held through the election). The price of oil went from ~$39/barrel to more than $54/barrel in that period. In the meantime, gasoline prices slowly dropped from $1.96/gallon down to $1.89/gallon before rising just before the election to about $2.05/gallon. Certainly a portion of this could arise from hurricane season and specifically Hurricane Ivan, but oil was going one way and gasoline prices another well before hurricanes payed a role in the GOM.
One could also make an argument that something similar happened in the 2000 election:
It is more difficult to argue that price manipulation occurred in the 2002 Mid-terms (but a similar pattern appears):
Since the 2004 decoupling and it's persistence, the leveling of production in 2005 and the 2005 hurricane season, it's harder to demonstrate a persistent pattern for the elections in 2006, and 2008 is all over the place because of other factors sweeping the "controls" away. Here is what 2008 looks like so far:
I'd say that the price evidence shows that there was a very limited window for the oil companies to manipulate the gasoline prices to favor one party over the other. We might suggest that the "undervaluing" of gasoline relative to oil is just a grander scale manipulation to keep the revolutionaries from storming the gates. But the trends suggest that early in the 21st century some price manipulation for the purpose of political influnece might have been in play...
In case any one is curious about 2001 and 2003, their curves are shown below.
The Starship Trooper
Manipulation of prices in general have been a feature of post 2002 politics. I mark it at that time, because that was when the stock market became much less prone to price changes more than about 2.5%. Of course, this is changing today...
Anyways, Mr Rapier, my principal objection would be that the price of gasoline is dropping when the actual supply of gasoline has dropped well below normal levels. Normal economics thinking would suggest that people would be bidding up prices as something has gotten scarcer, especially in light of the recent situation in the SE US as compared to other regions of the US.
What I would like to see is gasoline prices and gasoline supply measured together in some form...
Based on data for daily market volatility, 1998-2002 were quite volatile as the tech bubble inflated and burst, but 1993-1997 were quite stable. At first glance, the data seems to say little more than that stock markets are volatile around economic downturns. That doesn't seem too surprising.
Gasoline supplies are 21 days, same as this time last year.
Moreover, oil prices have dropped about $40/bbl - $1/gal - since their July average; given that, how could gas prices not drop?
A constructive criticism of your approach: it is not sufficient to pick a few days out of the year and then claim there is no pattern.
I didn't. I looked at the prices from May to November. That's a lot more than a few days. But the point is you have to pick a time frame and be consistent. If I only looked at election years, or moved my dates around, I could have shown any trend I wanted.
Take your approach, for instance. You aren't consistent with the data you are looking at. You aren't looking at all the data, and you are allowing your dates to move. When the price trends went in the wrong direction, you rationalized ("I'd say the timing was a little off and the price just could not be held through the election"). I can zoom in on any dates in any year and show just the opposite of the claim you are making. That's especially true if I zoom in on different dates in different years. If I look at late spring, I can usually show that gas prices are going up in an election year. That's the point. Show me an objective measurement, as opposed to "if we look at these dates in 2004, but this other date range in 2006..."
Gasoline prices and oil prices have become much more decoupled in recent years due mostly to limited refinery capacity. But there have also been times when inventories told the underlying story. If oil prices are falling, but so are gasoline inventories, those prices will decouple. You also have to keep in mind that the elections represent the low gasoline demand time of year. On the other hand, demand for oil can remain strong as people start to stock up on heating oil for the winter.
I think if you did a test in which you showed the yearly graphs for about 20 different years - but didn't show the dates - people would have a very hard time telling you which ones were election years. Just scanning your first graph, I see numerous decouplings that didn't happen in election years - especially if you zoom in and blow them up.
Let me conclude by posting a pertinent response when I posted this essay on my blog:
And yet, the way Saudi Arabia sets it price and quantity delivered to its customers seems more consistent with Saudi political decision making than simply maximizing dollar profits would imply.
Russia was much the same way during the Warsaw Pact days - profit was not the only consideration in where oil was piped, and what price was paid for it.
But that would imply that oil producers have a political agenda not actually coupled to monetary accounting, which would then lead to the idea that oil is not merely an economic good which the invisible hand distributes to its faithful servants.
Ask Chavez how much his various grandstanding oil shipments have cost, and he would likely answer that in a case like Cuba, the Cuban doctors have done more for his countrymen than the dollars supposedly lost by shipping oil at a 'loss.'
Mondays are always Monday unless you are looking across the International Date Line. So, when I take the weekly gasoline prices, which are are polled the same way whether there is a Federal holiday or not, they represent the first through 52nd (and on occasion 53rd) weekly values in any calendar year. Fridays are always Friday and so, with the exception of Thanksgiving Week and the various holiday weeks, we always have a 5-day average for that week from M-F. It's just as easy to pick a moving average of any suitable length between the WTI price (spot market) and the composite wholesale spot market price for gasoline.
Furthermore, the values shown are the rolling 4 week average value so the "error" of shifting days is extremely small. Besides the year-to-year preccessional effect on the movement of certain holidays that are fixed (e.g, the 4th of July) versus those that float (e.g, Memorial Day, Labor Day) are minimized AND the 4-week rolling average further reduces that effect. What is relevent is to pick a sufficiently representative period of time where short-term transients are minimized in the time-series, while teasing out the trends.
And the trend is most striking in 2004. I'm open to other suggestions as to what caused the 2004 decoupling, why it occurred right after the 4th of July and right before the Democratic Convention and then was sustained for the next 3 months before gasoline prices finally started rising (at a faster rate than oil).
Furthermore, the dollar effect is nowhere near what you suggest. If you take the four month period in 2004 (July through October) using the gasoline supplied from the EIA data you'd find that the total amount supplied was 1.13 billion barrels or 47.43 billion gallons. If the marginal cost differential was $0.10/gallon (which actually looks pretty close to the difference between the "normal wholesale price differential" and the price differential during this period of time), you'd only get a difference of 4.7 billion dollars. But with an oil aquisition cost of ~$74.5 billion and a wholesale value of the gasoline sold at around $60 billion (just by itself), not to mention the value of all the other products produced and sold, a differential cost of around $4 billion is a small price to pay to have voters happy and your favorite Congressional representatives back in power in addition to a friendly White House.
This cycle, we aren't happy in NC as we are still paying around $3.80-$3.90/gallon, when you can find gas. It does not seem to be much of a problem if you live along the some of the Interstate Highway corridors, but even in the state capital it is a problem. Yesterday and this morning, only 3 out of 12 gas stations along two routes I took had gas at some of the pumps. The rest have all their pumps shut off and the pump handles bagged. We are being told that this is likely to continue for another 1-2 weeks. Fortunately, I ride the bus.
Mondays are always Monday unless you are looking across the International Date Line.
That's not what I mean. What is the objective test we can use to compare years and use it to conclude manipulation? I think you are going to have a hard time defining that. For instance, what are the important dates for a price movement? Does it need to start a month before the election? Two months? Can the movement start in May one year and in August another year? What if the trend continues until well after the election? What do you do situations (like 2007 as Pitt pointed out) where prices decouple in a non-election year?
What I see is pretty random. One can always pick patterns out of the randomness, but only by ignoring some of it. If we do the blind test I suggested (show graphs of gas/oil prices for 20 separate years) do you think people could pick out the election years if there were no dates on the graphs (you could show the months, but not the years)? I don't think so, but if there is a pattern of manipulation this should be pretty easy to show.
I only have a couple of minutes to devote to this. Perhaps when my wife has recovered I can spend more time on this.
When I say that the gasoline price decoupled, I do not mean that it has remained uncorrelated. I mean the previous relationship can be shown to have been changed and at a very specific time.
However, if you had actually looked at the data and presented it differently, you would have discovered that the relationship between oil and gasoline prices was strongly correlated during the period of time from January 1 through June 30 with an r2 of 0.965. After July 1 through Election Day 2004, that correlation went away as oil prices climbed and gasoline prices didn't (they declined until the very end of the period in October). In that period the slope of the curve practically disappeared and the r2 fell to 0.265.
For comparison, the r2 of the period from January 1, 2001 until June 30, 2004 was 0.798 and showed a high degree of correlation (and the path up versus path back down is also quite evident). The point is that something distinctly different happened in 2004.
After the election over the next 6 months, the correlation curve shifted (to the right) but returned to a similar slope as the period from Jan 1, 2001 until Jun 30, 2004 AND returned to a highly correlated state (r2= 0.878). Now if you think you can explain why this occurred, I'm all ears. Manipulation does not have to have occurred in every election year for it to have occurred once and be perceived that it occurs every time.....
Elesewhere, you challenge me on the 2007 issue, yet you devoted a portion of your blog on the dropping of the gasoline stocks and how sharp the decline was (would you like the reference?). This is a plausible explanation for the short-term (February-May 2007) for the correlation to "fail" once again. It's more difficult to make that argument for 2004 as stocks build slightly in July 2004 before falling. We also have refineries running flat out with very high utilizations (something else that was discussed in TOD) and those refineries did not get to that state by themselves.
I can provide a much more detailed analysis, but the main point is that the ability to manipulate gasoline prices to severely lower them is probably much more limited than in the two preious Presidential elections.
As a final note: you should have noticed that the price in your quote $2.17/gallon was not possible as, until two days ago, this was less than the wholesale price of gasoline on the spot market. Last time I checked, they are still paying federal and state gasoline taxes in Illinois.
In that period the slope of the curve practically disappeared and the r2 fell to 0.265.
Well, you are going into lower gasoline demand season. That is always the case coming up on an election. But in order to make a statistically strong case, you would need to show that this anomaly didn't occur during other periods. The problem is that it has - it just depends on the time frame you look at.
Which brings me back to my original question: What is your objective test for determining manipulation? When you can define that, then we can go and apply that standard to other time periods to determine how many false positives the test gives.
you should have noticed that the price in your quote $2.17/gallon was not possible as, until two days ago, this was less than the wholesale price of gasoline on the spot market.
That quote was from 2006.
Now that my wife's health seems to be less pressing I can spend a bit more time on this.
If that were the case, it would always or nearly always be present. Simply stated, it is not.
The objective test is really quite simple:
First, is there a positive correlation between the cost of oil and the cost of gasoline? The assumption is (and this can be tested) is that gasoline prices are largely governed by the aquisition cost of oil. Statistically, this can be shown to be true from the entire dataset. We can further test whether the relationship is statistically different when oil (and gasoline prices) are rising and when oil (and gasoline prices) are falling. And indeed, the price system exhibits hysteresis with different damping factors (which is where I came into this project years ago).
There are several other tests, we can apply. Is there a pattern to oil prices and gasoline prices over a time period of our choosing? Yes, and for simplicity sake we can choose calendar years. For example, with an average error of ~2% we can take the 15th week price of gasoline, plug into a simple equation and very accurately predict the average price of gasoline for the year. The only reason this is possible is because persistent patterns exist and there is dampening of the gasoline prices (and the autocorrelated nature of these prices) and it's not random. You could do something similar for oil prices but there is much more variability on oil prices.
Which brings us back to what other test can be applied. The simple test I applied is one where I take the first six months of data (the first 26 weeks), look to see if there is a correlation that is consistent with the hypothesis and then see if in the next 4 months the corrlation relationship holds (which runs you right up to an election). If the loss of correlation in July, August, September and October that was seen in 2004 is due, as you suggest, to going into a lower demand season, then it should always be present.
It isn't. And yet, with the six-months immediately following the 2004 election, the relationship returned to a highly correlated state even though the relationship was different (shifted) from the previous relationship. So, the question is was this merely a random transition or was is it intentional manipulation of gasoline prices? I suggest that in the case of the 2004 election and perhaps in the 2000 election you have the same type of forces at work (using the same analysis technique. But I also reiterate this point: the degree to which prices can be manipulated and for what period of time is limited by other factors.
This requires something more than a table (which means you failed to put forward a sufficiently strong and objective argument backed up with acceptable statistics) and you aren't going to be convinced by graphics without the accompanying statistics. That's fine. As I learned long ago "All experiments should be repeatable, they should fail in exactly the same way." Looking for other explanations, including statistical analysis to evaluate residual error in the models (which is what these are) to determine randomness, is what is needed.
Right now the gasoline/oil correlation is running it's "usual course" even in the face of a highly volatile market and it does not show the loss of correlation seen most strongly in 2004 and to a lesser extent in 2000.
That's not even close to true. Look at mid-to-late 2007, for example; your graph clearly shows oil prices rising sharply and gas prices falling or flat. It's the biggest decoupling in the entire graph, and it's in a non-election year.
Your data does not support the story you want to tell.
Then perhaps you should fit your argument to the data, rather than trying to shoehorn the data into your argument.
There was one brief period of time where gasoline prices rose rapidly in 2007 to look as though the two would once again recouple. That period from Febraury to the end of May 2007, reversed and went back to the decoupled (but mirroring), post-2004 operating curves. If memory serves, gasoline stocks were low and declining during this period as there were a number of discussions on the minimum levels here on TOD.
Note that the same type of "price manipulation" trend is present in the 2002 data, it just is not as pronounced as in 2004. I could similarly argue that the trend is more pronounced in the two presidential elections since 1998 than it has been in the midterms. But I also look at the data going back to 1990 (where my weekly data ends and my monthly data begins because I have not been willing to go to the Federal Repository library and dig this data out of the files) and similarly conclude that there does not appear (from the way I'm handling the data against a baseline of 1992) to be manipulation prior to 2000. But, I can say that in 1973, that there was an big perceived difference between gasoline at $0.269/gallon and 0.399/gallon. Perhaps a relative value that is contemporaneous to the year in question.
Also note that this is not what I was setting out to discover when I started putting together this project more than 5 years ago AND in 2004, it was fascinating to watch the numbers evolve the way they did and a completely new pattern to emerge in near real time.
Here is what the 2007 data looks like when you remove the other years and just delalwith the calendar year (note the scale change)
One argument could be that it looks, sorta, kinda, like 2004. But the sharp rise and then what looks on the other graph as a sharp fall in gasoline prices is not so pronounced when you zoom into the data. And more importantly, we know what what caused the rapid rise in gasoline prices relative to oil prices.
http://i-r-squared.blogspot.com/2007/04/this-week-in-petroleum-4-25-07.html
If it wasn't for this, I suggest that the price rise of gasoline would have been more in line with the oil price rise and not the curves we see here.
Still hunting for a reason to explain 2004, so when you find one in the production, stocks, or other petroleum related data, do let me know. SAS hasn't found it yet.
The article is a red herring. Of course the oil companies don't have enough clout to manipulate the price of gasoline significantly around election time. But Saudi Arabia does.
If there is Saudi manipulation, they will favor the Republicans and hurt the Democrats. And if the Republicans win, prices would not go right back up, but they might if the Democrats won. Also, I would only expect the manipulation to take place in the month or two before the election, because it costs so much.
I don't know if there is real manipulation or not going on, because there are too many factors to take into account, such as the big changes in the price of oil, the general economic situation, etc., and too little data. Any attempted manipulation could be hidden in all those other factors. It could only be really proven, if there were documentary evidence of collusion, and that would still leave open the question of how effective it was. But the close ties between the Saudi royal family and the Republicans should make us suspicious.
Of course the oil companies don't have enough clout to manipulate the price of gasoline significantly around election time. But Saudi Arabia does.
From the article:
But Saudi has to have spare capacity to pull it off.
The other point was to look at historical price patterns. If you apply objective analysis the data look quite random.
Everyone actually TRADING crude oil could see the blatant manipulation surrounding both hurricanes...."special sunday sessions" and all. It was a joke.
[note to the humour impaired - this is not a "serious" post.]
But isn't The Market Always Right? And the market has spoken: price manipulations exist and are done in favor of or in opposition to political candidates.
The entire basis of free market economics is the supposed fact that while individuals may or may not have correct ideas, the market as a whole interprets the situation correctly and acts accordingly, producing reliable valuations and results.
So you have a problem - either a) market manipulations exists as is believed by the Market, or b) the basis of free market economics is incorrect and free market economics is therefore fundamentally flawed.
I'm guessing B myself.
Nice article. I'm reminded of B.F. Skinner's pigeon experiments.
It's a false syllogism: Gas prices are falling, it's an election year, therefore gas prices are falling because it's an election year.
Incidentally, I speculate that this sort of tacit acceptance without proof probably is a side effect of something that does have an evolutionary advantage. I've forgotten the study now, but a while ago some researchers claimed that children mimic the behavior of others using tools while almost completely ignoring how it is the tool actually works. They tested this by introducing unnecessary and ineffective behaviors while demonstrating how to use a tool and seeing if the children mimicked that or if they just went to the important parts of the tool mechanism. Most followed the ritual rather than the important parts. Chimpanzees however more often than not ignored the ritual and went straight for the relevant portions of the mechanism. That strange behavior in humans is probably usually an advantage because it allows us to learn complicated things quite rapidly while young without needing the experience and maturity necessary to understand the complete workings of the tool.
If we treat phenomena like gas prices in a similar way, maybe the brain is assigning some arbitrary meaning to it and then treating it like it would tool use, i.e., completely ignoring the actual mechanisms of the tool (in this case supply and demand) and looking at the circumstances surrounding the presentation of the phenomenon.
Actually, a study came out just last week that sheds some light on this:
Lack of control fuels superstitions, rituals: study
"Lack of control can lead rational people to see patterns even where no true pattern exists, a finding that explains seemingly irrational behavior, U.S. researchers reported on Thursday.
...
The need for structure or understanding leads people to trick themselves into seeing and making connections that do not exist, said Jennifer Whitson of the University of Texas at Austin.
"When we lack control we are going to see and seek out patterns, sometimes even false patterns, to regain our sense of control," said Whitson, whose research appears in the journal Science.
...
"People see false patterns in all types of data, imagining trends in stock markets, seeing faces in static and detecting conspiracies between acquaintances," Whitson said.
"This suggests that lacking control leads to a visceral need for order -- even imaginary order," she said."
I wonder - was Prince Bandar and George Bush just imagining a pattern in 2004 because of their lack of control, or could it be that those in control create patterns?
MOST STUDIES ARE TOTAL B/S, RESEARCHERS FIND
well, i dont think it is any mystery that human childred learn by observation.
when i used to baby sit.... er...... i mean supervise truck drivers, i concluded that written communication was the least effective, verbal communication was slightly more effective and demonstration was the most effective and if all else failed there was the baseball bat communication tool( i never actually used that one).
Convenient that Aramco and company are excluded from the discussion - much the same way that the Kingdom of Saudi Arabia is excluded from discussing who provides world wide support of radical Islamic theology, backed with billions of dollars.
Prince Bandar has been cited stating that Saudi Arabia manipulates prices in its own political interests - good paragraph at http://en.wikipedia.org/wiki/October_surprise#2004_Bush_vs._Kerry
Of course, any number of things factor into an election, and oil is just part of it.
But the transcript from April, 2004 at http://edition.cnn.com/TRANSCRIPTS/0404/20/lad.04.html is also interesting, including the clip -
'BOB WOODWARD, "THE WASHINGTON POST": What I say in the book is, according to Bandar, the Saudis hoped to control oil prices in the 10 months running up to the election, because if they skyrocketed, it would hurt the American economy.'
Let's not be too naive - former ambassador Bander's Rolodex (or his speed dialer) certainly includes a few oil company heads, and I'm quite sure he enjoys their input in deciding how to best keep their mutual interests firmly addressed. For example, in making sure that no candidate which would seriously damage their interests is given the same proven help America's worst president was provided. (No hedging needed about him being the worst modern president - Bush is the hands down winner at being the bottom of the list.)
However, oil is just one part of a very complex picture. For example, this election, the price of oil has been declining (what a surprise, at least according to your opinion), but I don't think it will help the economy much. Which means, to the extent that the coincidental fall of oil's price before a major election involving a man many see as the only way to keep the policies Bush pursued in place, it won't matter whether Bandar and friends were doing their best to advance their interests.
Convenient that Aramco and company are excluded from the discussion
Are people not reading down to the end? For the 3rd time in this thread:
Aramco, coming under the umbrella of OPEC, are not excluded. But they have to have spare capacity to do it, and I know a lot of people here don't believe they have spare capacity.
Ooops - quick edit. Aramco is not OPEC in my eyes, though the point is certainly open to discussion.
Notice that I specifically said Aramco, not OPEC. And Aramco has demonstrated that its adherence to a free market in the American sense is less than its dedication to various political goals. For example, how much did the embargo of 1973 cost the Organization of Arab Petroleum Exporting Countries?
I found this recent article about Saudi intentions for getting McCain elected.
http://seekingalpha.com/article/95512-saudi-talk-and-production-bring-do...
Do they really have to have real spare capacity ... can't they just lie and get the same results?
Consider these
1.) Given that we are probably post peak putting a peak date in 2005.
2.) Considering that we have a lot of evidence that the post peak world will be volatile.
3.) Consider that geopolitics are also becomnig strained.
4.) Consider that so far KSA's ability to flood the world with oil seems limited to sixty day surges and not sustained production increases.
I'd say that the details of the current year are far more important then any trends taken from previous years for any reason either to support or deny price manipulation.
This situation is only going to get worse in coming months not better. We are entering a period of extreme volatility because of current conditions.
I have my own opinions about the matter but one thing is very clear at least to me whats happening now and will in the near future has little or nothing to do with the previous years. We have entered a completely new situation this year. Its as abrupt as a phase transition from liquid to solid. Trying to take trends across this change is a mistake. We are now at T0 for the post peak economy.
This means I think you will find that going forward as the data accumulates it will become obvious that a tectonic shift happened this year.
People intuitively sense that Bush is just a puppet, and that both parties are controlled to the point where they are virtually identical. But they do not know how to put those intuitions into words. (Because right-brain thinking has been suppressed by our educational system for decades.) That's why you end up with people thinking that "Bush" manipulates oil prices, even though it is not really him that is doing it.
But make no mistake, it is being done. You can say its a myth, just like you'd probably say its a myth that the stated purpose of the CFR is to destroy America. Oil prices are manipulated because elections cannot be about energy. It has to be about regulations and bailouts and mortgages and wall street corruption. If it were about energy, then the country might have a chance to take a step in the right direction. But because energy wont be an issue (aside from toothless platitudes spewed by both candidates) there is NO chance that America will move in the right direction. That's why the housing bubble was engineered in the first place. So that all this financial turmoil would mask peak oil. And it will. I can guarantee that 2 or 3 years from now, the general public will be none the wiser about peak oil, even if oil production has declined 10% by then.
Peak oil will never be proven, and that also is part of a master plan. 10 years from now, if we're lucky, we're going to have to deal with paid hacks arguing that the reason oil production is at 68 mbpd is not because of peak oil, but because of the recession, failure to invest, war, terrorism, etc. You'd be a fool not to see that coming.
Humans, because of their language ability, are capable of stringing words together in an infinite number of combinations many of which seem to make sense but don't really and there's no way to tell.
eek
Good Article! I agree.
At www.WorldEnergy.TV there is a new Matt Simmons interview where he paints a very scary picture when it comes to gasoline and then says he is backing Obama. He also brings up a gasoline alternative created from Sea Water off of Main.
I don't think he would go with the idea that our government can successfully manipulate anything, and I would agree.
Ah, but Matt Simmons is CFR, which most people will tell you is the very definition of government and market manipulation. So he has some goal in mind by making these statements, no doubt.
Robert, you still haven't addressed the VERY direct evidence in Woodward's book that the Saudis do and have manipulated prices.
LOL! For the 4th time in this thread, let me just point you to the last two paragraphs in my essay - where I address exactly you said I haven't.
To paraphrase Simon and Garfunkel "still, a man reads what he wants to read and disregards the rest."
Robert, your piece is entitled "The myth of election year price manipulation," you present data showing, in your view, no trend, and thus no conclusions re manipulation. And you discuss why this myth persists. Your line about the possible OPEC manipulation doesn't dispel the very clear misimpression that your piece dispels the alleged myth of price manipulation. But this is angels on the head of a pin! Interesting piece and keep up the good work.
And what I showed in the tables is no consistent pattern of price behavior - election year or not. On the other hand, I am also saying that OPEC/Saudi could do it to the extent that they have spare capacity.
“What company in their right mind would step forward to kill their profit?”
well, companies do that all the time, short term profit killing , for long term benifit. it is called campaign contributions and they go to both parties, usually more to the gop.
Off subject or not, I have to vent big time. This AIG bailout of 85 billion and now supposedly another 35 billion is outrageous! Add on the Executives giving themselves a 400K plus party event, with a 2nd party event scheduled for next week and it's deplorable!! Close them down. I don't care how many jobs are lost - close the doors. The basic idea of Capitalism is competition. Smaller insurance companies will pick up the slack and we will never miss AIG.
Pemex entered the oil futures market for the first time. Selling oil futures against future production is certainly bearish.
GWB has more influence over Mexico than any other oil exporter.
2 + 2
And selective denial of credit to those hedge funds long oil, but not short oil, after Paulson calls some old colleagues.
I do believe that GWB has tried to manipulate oil prices.
Alan
'96 election ? 2000 election ? who is arguing that clinton had anything to do with manipulation of gas prices ?
i dont think gas price was even on the radar sceeen back then. probably not in '02 either.(i think we were talking about the all important issues of prayer in the classroom, whether a woman has a right to terminate a pregnacy, the ownership society).
'96 election ? 2000 election ? who is arguing that clinton had anything to do with manipulation of gas prices ?
You are hitting on the point. If you look at all the election years - and non-election years, you can't tell the difference. That's the reason for going back 3 elections; it gives a fair amount of data to compare.
it seems to me that the only relevant years would be 2004, 2006, 2007 and we shall see about 2008. imo, you could eliminate 2003 (the start of the search for wmds in iraq) and 2005 (katrina and rita).
3 election years and 1 non election year, not much to base any conclusions upon, imo.
3 election years and 1 non election year, not much to base any conclusions upon, imo.
Agree, which is why I went back as far as I did. If one wants to make a case based on just 2004 and 2006 numbers, that is a case that is statistically very difficult to make. Not enough data.
I didn't read all the comments so forgive me if this is a repeat.
The answer is so obvious it's like your own nose (takes someone else to see it).
Look at what prices did after each election.
edit. Oops. 2001 it dropped.
I too have a nose.
I'd add:
Coming from a family full of Republican oil men I am exposed to lots more of the same. I have heard I hope the price falls until after the election. After that I don't care high how it goes.
That's a common sentiment, but a long way from actually fixing the price.
I believe (know) oil prices are being manipulated downward but have no proof other than statements from both sides of the aisle.
The reasons for doing so go beyond partisan politics (McBama has said so on numerous occasions).
Right now we're tying to stop the bleeding of American wealth into countries like Russia, Venezuela, etc.
I'm amazed that nobody has realized this yet but oil prices don't matter and the oil companies could even raise the national average gas price and still influence the election to lean towards the incumbent/republican/Bush-Cheney neocons whatever.
Let me say first that I am not necessarily a believer in the price manipulation although it might be happening.
I live in NW Ohio and had to drive to Lansing, MI today for work. On the radio I heard that Ohio was 4th lowest for average gas prices on a state by state comparison. A speedway in Bowling Green, OH was selling for $2.45 and I saw numerous stations selling for no higher than $2.65. When I filled up in MI I payed $3.09! Now MI is always a little higher but that is an extreme difference.
As you probably all know, the popular vote matters almost none in a presidential election, it's about carrying each state to get their electoral college votes which for most states are all or nothing. On any given presidential election there are but a handful of swing states which will decide the election (OH, FL, IN, VA,etc) and so if those few states gas prices were lowered dramatically and gas prices in other non-swing states were raised slightly, the net national change would be $0.00 but it would effectively influence the election results. OH is a swing state and MI is not, in fact Mccain has stopped campaiging in MI and all but conceded it to Obama.
Like I said, I'm not some nut that is a diehard believer but I would like to see a comparison of swing state gas prices over the various election years vs non-swing state prices. You don't thing AZ is gonna go to the democrats do you?