New Year, New Price Poll
Posted by nate hagens on January 1, 2009 - 9:51am
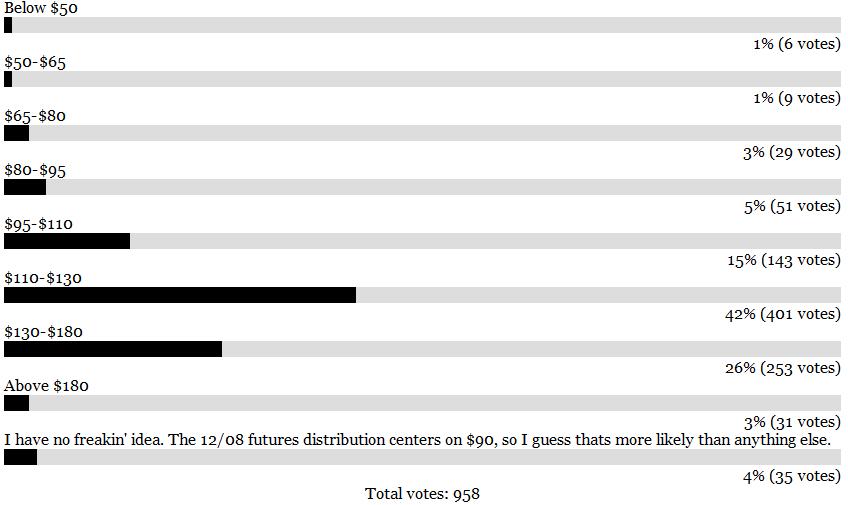
Though the model of oil prices being a valid 'signal' of long term scarcity took a hit in 2008, many of our future trajectories do hinge on higher (or lower) oil prices. Here is the 2009 Poll on where oil futures prices will close 2009. There were 6 posters who voted on a close below $50 in the 2008 Poll, but none in the public comments section (so I am not sure who they were); thus the prize of 'a date with Professor Goose' gets extended to 2009 (poor PG). In full disclosure, here was my thinking in that thread a year ago. Below the fold is a screenshot of last years poll results and some commentary. Feel free to add your own analysis, links, etc. I wonder how many in the general public would agree that July 2008 will prove to be the all time high in oil production...?
12/31/2007 Price Poll Where will oil futures close on 12/31/2008? -(Oil was at $97 per barrel at the time) (***Note - this is a pretty small sample size and may be more reflective of who was on their computers On 12/30-12/31, than a random sample of TOD readership...;-)
2009 will mark a sharp reduction in oil projects and investments, scrapping of marginal production, and lack of capital for new investments due to higher price decks for banks. But at least for now, consumption decline rates will exceed production decline, barring more OPEC cuts. The open question is what is the resting pulse of world oil demand and do we emerge from the credit crisis with a full or half head of steam, or languish further into a depression. Oil price and supply, at least for 2009, will take their cues first from the economy, and second from depletion/cuts.
Please add your comments and vote in the 2009 Poll
Happy New Year.
Contact
- Content: editors at theoildrum dot com
- Tech support: support at theoildrum dot com
License

This work is licensed under a Creative Commons Attribution-Share Alike 3.0 United States License.
Perhaps I don't understand, but I suspect you meant to say that consumption decline rates will exceed production decline.
changed, thx - trying to do price poll, brew coffee, and feed animals is just asking for a mistake (at least I made typo and didn't give coffee to the dogs instead - a Type I error preferable to Type II..;-)
I have been Mr. Geometric Progression--long term prices are best described as a series of doublings, with the caveat that the price of oil is a horserace, IMO, between declining demand and a long term decline in net oil exports. However, if you had held a gun to my head in June and demanded a prediction as to whether oil prices would ever fall below $100 again, at least for an extended time period, I probably would have said no.
Having said that, the average price for 2008 was very slightly below $100, versus $72 for 2007--and $14 for 1998. The current average futures price for 2009 is right at $50, which would be an annual rate of increase of about 12%/year since 1998 (2008 prices increased at 20%/year since 1998).
In any case, the long term net oil export decline rate, IMO, is relentless and almost certainly accelerating. While the current price level will have some effect on exporting countries' consumption, consider the fact that Indonesia rapidly (80% gone in four years) exported all of its post-1996 cumulative net oil exports at an average annual oil price below $40:
By the time that oil prices crossed the $40 annual mark, in 2004, Indonesia--a founding member of OPEC--was a net importer.
The net export decline rate can be thought of as a function of 4 variables: 1)world demand for oil, 2)geologic depletion, 3)internal demand for oil from exporting nations (which could further be broken down between energy and non-energy sectors) and 4)decline rate differential between exporters and non-exporters. The 'relentless decline' in net exports, in 2009, will predominantly be due to a drop in oil demand, not the other 3 factors.
If the average price for both 2009 and 2010 is lower than avg for 2008, what would that change about your outlook? Because there is a subtle snag in your theory - if oil prices plummet (which they have), those countries whose economies are predominantly based on oil export, demand will drop MORE due to wealth effect, then the ROW which has more balanced economies (already, most oil exporters will run fiscal deficits at these prices.)
It's still too early for this to manifest in lower domestic prod #s- we shall see. (and in any case, the low cost production is virtually all located in export land, so lower prices 'hurt' them less than the producers of expensive oil - see below CERA/Horizon graph). In sum, the equation boils down to lower wealth effect on oil concentrated economies + greater reduction in expensive projects in oil importing countries. We shall see which dominates in 2009...
(If we do go into a full-on depression, oil exports are going to drop precipitously)
IMO, the following top 10 exporters are probably in long term terminal net export decline (relative to the 2005 to 2007 levels): Saudi Arabia, Russia, Norway, Iran, Venezuela and Mexico (probably also Kuwait & Nigeria).
But the key metric to consider is the net export rate versus the net export depletion rate (depletion marches on regardless of whether production and exports are increasing or decreasing, in fact, higher net exports cause the net export depletion rate to increase).
Our middle case is that the top five net oil exporters--accounting for about half of world net oil exports--have already shipped about one fifth of their post-2005 cumulative net oil exports. One fifth gone, in a little more than a thousand days.
As of January 1, 2009, assuming a current net export rate of 20 mbpd from the top five, our middle case is that they are depleting their post-2008 net cumulative net exports at the rate of about one percent every 50 days. (About 100 GB left, shipping about one Gb every 50 days). For comparison purposes, Indonesia shipped about one percent of their post-1996 cumulative net oil exports about every 18 days from 1997 to 2000, inclusive.
IMO, the net export decline rate--which in 2009 will be a combination of voluntary + involuntary export reductions--will cause the decline in net oil exports to outpace the decline in demand in 2009, pushing oil prices back up.
How would a sharp drop in demand change your numbers?
It helps to keep historical analogues in perspective.
Just eyeballing a Thirties production chart, it appears that world oil consumption only fell in one year, in 1930. As "Downsouth" noted, there were three million more cars on the road in 1937 in the US than in 1929. The key difference regarding auto demand between now and 1929 is that hundreds of millions of people worldwide want to drive a car for the first time now versus millions of people in the 1929.
In the early Eighties, we obviously saw a decline in demand, but the price decline was very gradual (price decline of -6%/year from 1981 to 1985), as Saudi Arabia cut back on exports. The big price decline did not occur until Saudi Arabia boosted their production and exports in 1986 (price decline of -73%/year from 1985 to 1986):
And it remains to be seen if the 2009 average annual oil price will be below the 2008 average price.
I like to use the inflation adjusted oil price shown here:
http://www.wtrg.com/prices.htm
Of course it is a wee bit of problem trying to buy and sell in terms of inflation adjusted dollars. Commerce is done with nominal dollars.
But it's the only way that a graph that includes almost 100 years of price data can be even a little bit relevant.
Quite complicated.
1 Ignoring the economy, there is one demand at 98/b (1/1/08), less demand at 50% higher (147/b 7/08) and more demand down 50% (46/b on 1/2/09). With the economy down and employment falling, there is clearly less demand at each of the above price points than when the economy was at a higher level. US demand could be increasing already on account of lower price - too early to tell. Also, lower price is helping the economy, no doubt this helped retail sales, down a little y/y this xmas season but not as bad as some feared.
2. Saudi is well aware that their own increased output had a lot to do with the price crash, higher supplies coming just as demand was falling on account of high price and a slowing economy. (this increase surprised many at tod, including me, that were expecting permanent declines from the kingdom.)
3. Reducing the supply, as opec is doing, will raise price and further reduce demand. Saudi supposedly wants 75/b... there are growing reports that other members will meet the latest reduced targets. IMO opec is back in the saddle for now, and that price will rebound as time progresses and the cuts take hold. I see now as the ideal time to invest in small us e&p's.
Small US E&Ps? With the above data by CERA showing average barrel to produce in North America is between $60-$80 cost? You better pick the right ones...
For any doubters that ELM is real use this tool to quickly check 100 or so oil producing countries and regions.
Almost all exporting countries with post peak production show declines in exports while domestic consumption remains essentially the same or grows.
http://mazamascience.com/OilExport/
As I said the other day, I really developed the ELM, just a simple mathematical model, to help me understand what happens to net oil exports as production shows a long term exponential decline, with consumption generally, but not always, showing a long term exponential increase. I was, and remain, stunned by the resulting net export decline rate.
As are those of us who have followed your 'simple little model' and get it's implications. Without ELM it's just the bathtub draining w/o noticing the growing elephant standing in the tub drinking his fill. I showed the chart of Indonesia net exports to our two young professional offspring this holiday for a nice family oh shiite moment BTW.
A room full of unhappy elephants can't be wrong. It's the primary reason why I don't see demand related oil price falling much from here. With much lower price the potential for conflict will be much higher and put a floor down IMHO. Low cost producers HAVE to cut, or create tension to bring their production/price in line with the high marginal supply destruction cuts coming from the OECD. Who wants to produce their remaining net barrels for cheap printed script while gold to oil is so far out of whack and their own budget deficits grow?
A new non-bank trillion dollar stimulus (one nation only) that may actually make it's way down to the consumers (who will spend) will buy a ton of gasoline at $1.65 a gallon and these two factors provide the juice to ensure increased economic activity. And ,hey, newly reinfused GMAC will get you into a low interest two for one deal on a shiny new guzzler with a Cobalt on the side. Plenty of fuel tanks around the world to soak up the remaining 100 Gb net export barrels at 1% per 50 days.
Thanks for helping us keep it in perspective WT and a pleasant new year to you.
(It ain't gonna be dull)
I went for $75 to $100 for end 2009 but wouldn't be surprized if it went higher.
xeroid,
looking at the data for Austria in http://mazamascience.com/OilExport/ it does not seem to match up to the data supplied here http://www.indexmundi.com/energy.aspx?country=at&product=gas&graph=produ...
I read in an Austrian newspaper that they produced nearly 20% of their natural gas (sorry no link, only in print).
Here is a link where OMV wants to increase production to 20% of Austria's needs.
http://www.scandoil.com/moxie-bm2/news/omv-strengthens-security-of-suppl...
In the data browser from your link, there is no production shown for Austria. What gives?
It's good to see you are using the tool for gas as well as oil.
The article says that the OMV company intends to expand it's gas production by 20% by 2010, not 20% of Austria's usage.
I think that 0.06 million cubic metres domestic production is an almost insignificant proportion of the ~339 million cubic metres actually used in Austria ... that's about 0.02% of Austria's needs ... certainly not 20%! ... yet.
year production consumption
1980 0.075 186
1981 0.051 159
1982 0.047 154
1983 0.043 157
1984 0.045 175
1985 0.041 188
1986 0.039 182
1987 0.041 190
1988 0.044 181
1989 0.047 195
1990 0.045 215
1991 0.047 228
1992 0.051 224
1993 0.053 235
1994 0.048 242
1995 0.052 262
1996 0.053 281
1997 0.05 271
1998 0.055 279
1999 0.061 285
2000 0.064 272
2001 0.061 288
2002 0.066 291
2003 0.074 315
2004 0.069 317
2005 0.058 339
Looking at this link http://www.indexmundi.com/energy.aspx?country=at&product=gas&graph=produ...
I think you will see that it is 0.06 trillion and not million.
Yes, sorry, all trillions ... production and consumption.
Production is so little it doesn't even show up at this scale.
http://www.indexmundi.com/energy.aspx?country=at&product=gas&graph=produ...
Thanks for replying.
It appears the the newspaper I read ( Kleinezeitung) picked up on the 20% increase reported by Oil & Gas and reported it as 20% of consumption. Very reassuring for it's readers, but also total mis-information.
Sorry for wasting your time. :-(
Dave
History shows that nobody knows what the future will be or how much oil people will be able to afford to buy.
The USA is not the world.
We buy what we can afford ie: it is not the price that is important on it's own but price and income.
Since the oil price is a global one the income is a global one as well ... there are too many unknown variables so a price prediction isn't sensible or possible.
All we can say with certainty is that post peak the oil will be less affordable ... that might mean $10 or $180.
I totally agree with this, but since price polls are kind of a tradition here, I put one up..;-)
Very nice prediction for 08, Nate. BTW, what are your thoughts on this year? Do you see (a bit) less volatility in 09 that hedge funds will probably not be able to leverage as much as they used to? Do you see political causes for price changes to trump economic ones?
Have a good year (and hopefully not too cold winter) ;)
Andrej
I'm still thinking about it. My best guess is new lows in Q1, followed by a slow but consistent rise the remainder of the year to close at high end of $50-$75. But as this year showed, things can move fast, quickly. E.g. if our poll ended in Nov 2009 or Jan 2010 instead of Dec 2009, it might fall in a completely different price bracket. If we start 09 out of the gates with Iran shutting in production due to this Israel/Hamas issue, well then that would change things a bit. Pretty small geopolitical risk premium in current prices..
And yes, hedge funds are going to play less of a role than last year, though a large part of the drop (say from $90 to $40 was more linked to rule changes impacting ALL hedge funds and credit availability than any oil contract teeter totter. In fact, the current 'longs contracts' in oil are even greater than they were in July when prices were $147+:
Net Fund Length at $145 bbl (7/1/08)
WTI Crude - 99,782 contracts
Heating Oil - 12,629 contracts
RBOB - 63,716 contracts
Net Fund Length at $100 bbl (9/30/08)
WTI Crude - 78,793 contracts
Heating Oil - 5,908 contracts
RBOB - 21,113 contracts
Net Fund Length at $75 bbl (10/14/08)
WTI Crude - 53,156 contracts
Heating Oil - 5,150 contracts
RBOB - 21,141 contracts
Net Fund Length at $50 bbl (11/25/08)
WTI Crude - 92,198 contracts
Heating Oil - 8,507 contracts
RBOB - 42,612 contracts
Net Fund Length at c. $40 bbl (12/17/08)
WTI Crude - 128,140 contracts
Heating Oil - 8,929 contracts
RBOB - 51,819 contracts
Net length for WTI futures and options (subtracting outright short positions from outright long positions) totaled 128,140 contracts last week. Since each contract reflects an underlying 1,000 barrel futures position, the length represents a buying bias of more than 128-million bbl of WTI crude. Of course, the 30 million barrels more of 'long' now represents same amount of oil but much smaller amount of 'dollars', so it's hard to say.
Guessing on oil prices in 2009 is really much more a guess on the economy and geopolitical/structural changes than it is on decline rates. But 2010-15 will be different stories.
I think that 2009 will be the year of the spike so to speak with prices spiking rapidly over a period of days. So I think the pattern for 2009 will be low price building contango spike with some futures going into backwardation. Snap back to contango probably with profit taking pulling back the prices rinse and repeat.
Prices will depend on the pattern.
But I expect us to see some amazing spikes in oil prices this year with breathtaking daily run ups.
I think this downturn in prices will look like '98-99, with a sharp dive
then bouncing back somewhat. Production will decline
over the next 6 months but will really crash as a result of drilling slowing
down even more in q1. Prices will dive down to $10-20 then bounce back
in 2010. end of next year I voted for $25-37.
happy new year.
We're being asked to determine the relative value of oil and the dollar. Changes to the latter might also be relevant since there is: considerable inherent deflation; money being printed but not given to people likely to spend it (until the holders panic that everyone else will); deleveraging forcing asset sales which often results in other currencies that need to be converted to dollars to meet commitments which have typically been specified in dollars.
This vote would have been easier for me if the choices were in ounces of gold, rather than USD. Point is, that all bets are off if there is a major currency/bond crisis resulting in a significant decline or even crash of the USD. Likewise, if deflation deepens, and/or reverses into severe inflation.
Valuation of a barrel of oil against the nominal value of the USD, IMHO, is much more dependent on what happens in the currency markets in 2009, than supply/demand factors.
My vote is that oil will end 2009 valued at 1/10 oz. gold (or currently at approximately $88.) What the USD will be at the end of 2009 is murky speculation at best.
$ 75 +/- 10%
methodology: wag
basic asumptions: the saudi's truely want $75 oil and will have enough spare capacity to swing it.
It is now clear that the spike in oil last July was the climax of a speculative bubble. We have some recent experience in speculative bubbles: the dot com bubble and the housing bubble. When speculative bubbles collapse it may take years for another one to rebuild in that area.
The dot com bubble hasn't reappeared yet after going on 10 years and the housing bubble is still in the process of collapse just like the oil bubble. The oil price trend is still down. The rule is: go with the trend until it reverses. Trying to catch a falling knife is dangerous and while tops happen quickly, bottoms take a long time to form.
Given that financial excesses contributed to the oil and other commodities bubbles and that financial excesses are now supposedly in retreat, it is hard to imagine where the fuel to build up another oil bubble is to come from. Generally after a collapse like the oil bubble has had in the last six months there follows a long period of base building lasting years of even decades.
Such was the case with gold, another finite commodity, after the 1980 bubble as well as for oil back then. Farm land which is also a finite commodity went though a similar bubble bursting at about the same time. I was stupid enough to buy land at the top and it took nearly 30 years before the price we paid was exceeded.
There are strong fundamental reasons that oil will remain under valued even in the face of declining post Peak Oil production. The recent attempts at trickle down socialism with the bail outs of the too big to fail isn't working. Wealth and income continue to be transferred from those at the bottom to those at the top though the tax code. Unemployment will likely continue to rise here and in foreign countries as they slide into the American dug ditch.
The unemployed and the fear of the employed that they will be next will reduce auto demand. And the unemployed to not require gas to drive to work.
Not only that, there is excess ethanol capacity with no where to go. That puts pressure on retail gasoline prices. Even diesel has some small competition in bio diesel.
IMO it will take many months and perhaps several years for the shocks of 2008 to work though the system and for it to recover. I voted for 37-50 dollar oil at the end of 2009.
you have exceeded the your maximum allotment of the phrase "oil bubbles".
For Those who think Oil was a speculative bubble.
A challenge: please define a speculative bubble, and then go on to show how oil was in a speculative bubble.
You'll run into three problems in the above exercise.
1. You'll be able to assert, but not show, that oil was in a speculative bubble.
2. Once you start defining a speculative bubble, you'll realize that it won't be easy to fit oil into the definition.
3. If you get close to showing that oil was in a speculative bubble, it won't be separate or distinct from the thesis that the whole planet was in a bubble, and that it was all driven by credit.
Since no one who tried to show that oil was in a speculative bubble the last few years was successful, I'll place the chances that someone here is able to do so near zero. The closest anyone will get is scenario #3. Which would of course negate the thesis that oil was in a distinct bubble.
My view: oil was not in a speculative bubble and has never been shown by anyone to have been in a speculative bubble. The increased amplitude of oil's price behavior is more than adequately explained by the history of commodity prices, whose nature it is to move in violent fashion. Especially when supply cannot easily be increased. Or in the case of this decade, zero growth in global oil production for 3+ years, and zero growth in non-OPEC production for 6 years. In war, and in economic booms, it has not been common to assert a "speculative bubble" but rather has been more common to assert the price behaviour as typical of commodities.
The common attraction to the bubble thesis currently is really about participant's cultural bias since the Nasdaq speculative bubble and bust. The Tech boom introduced a whole generation to the bubble paradigm. Since then, the paradigm has been mis-applied to everything under the sun.
G
gregor,
"For Those who think Oil was a speculative bubble."
"A challenge: please define a speculative bubble, and then go on to show how oil was in a speculative bubble."
I qualify without doubt as one who thinks oil was in a speculative bubble for most of the last three quarters of 2008, probably a bit longer.
To your second point, I am not sure that I could ever "prove" a speculative bubble using anything you would consider acceptable evidence. I do not have access to the records which would document the actions of hedge funds, mutual funds, banks, etc. in proving the purchases, sales, options, puts, and leverage they use. The hedge funds and powerful money managers tend to publish only what they have to, and they attempt to disguise their actions by burying them in very involved and complex documentation.
First, allow me to define what I consider "speculative bubble" in laymans terms:
A speculative bubble is caused by a surplus of money seeking somewhere to go. This investor money has historically flowed to what the consensus says is either (a)great returns compared to the average for all markets or (b) a sense of safety compared to the average of all markets.
In the late 1990's excess money flowed into the tech sector not because it was seen as a "safe place" but because the returns had been fantastic and no one, large or small investor alike, wanted to miss out on these great returns.
When the tech sector began to unraval, investors (in particular the well informed large investors, hedge funds, etc.), began to flee and needed somewhere to go.
At that time the place to find good returns and what was presumed to be relative safety seemed to be real estate. And as surely as night follows day, the housing secter began taking off, as prices skyrocketed beyond all reason.
We all know what happened next: Real estate prices went beyond any realistic ability for the homeowner or the leasor of office space to be able to afford it, credit was tapped out to the max, the money began to dry up and returns began to flatten. The well informed and alert investors began to pull out. But where to put the money in a world where most stock market returns had been flat and showing signs of possible decline soon?
Commodities of course. Hey, the world is only going to need more and more oil, metals, grain (it was presumed) and supply was tight due to two decades of under-investment. Soon enough you had Goldman Sachs joining the Matthew Simmons club talking about $200 plus oil, talk of "The Club of Rome" (they were right after all! It just took longer than originally expected!), and even the oil companies ("Will you join us?", Chevron joins the doomer camp!)
The money poured into commodities and the prices began to climb fast. People and firms who had virtually no knowledge of commodity markets were (knowingly and unknowingly) pouring money into the commodities market by way of individual investment, hedge funds, pension funds, mutual funds, and it was being leveraged to the max through options and margin.
Let us pause for a moment to consider the effect of hedge funds alone. Charles Schwab, he of the same named discount brokerage firm, recently said that the U.S. hedge funds (never mind the offshore ones for now) had 3 trillion dollars under their control. If one takes the conservative view that they leveraged 3 to 1 (Schwab took this number, but mentioned that firms with over 5 billion dollars under management could leverage to whatever degree they choose) you get 10 trillion dollars. The U.S. yearly GDP was only 12 trillion dollars.
The amount of money which could be flooded into commodities is truly astounding, and prices indicate that a great deal of invested money fled to commodities. The amounts of money invested dwarfed the amount of oil, natural gas, metals and grains that could possibly be consumed by the buyer, especially in a slowing economy.
By way of a "street level" example, I personally knew several relatively small scale money managers who, upon seeing their clients begin to lose returns on the stock market, recommended them to move to commodities mutual funds. Ironically, they were moving to commodities for "safety" just as commodities were nearing all time record prices. In several of these cases I recommended great caution repeatedly. Commodities prices are always prone to volatility and these people were being put into them as a safe haven when they were at record prices! This same story was repeated all over the nation, as those who came to purchase commodities late in the cycle would be burned badly.
The outcome was predictable: The big hedge funds and money managers saw prices at fantastic prices and supply, while flat, was not collapsing in the near term. Meanwhile, demand was slowing in the markets that matter, China and other fast growth economies, and had been relatively flat in the U.S., Japan and Europe for years. The prices began to fall, and the hedge funds and big money managers began to go short on commodities. Given the billions they could hurl around, the prices collapsed at accelerated pace. Birth, middle and end of bubble cycle completed.
As expected, prices have now over-corrected. The developed world can easily withstand and would be willing to pay around $90 to $100 per barrel for oil into eternity. This price would assure the needed level of exploration and production. The recent remarks from KSA indicate that they know the oil business, and the price they are seeking (some $75 to $90) is about right for the upcoming half decade.
Note that all of the above remarks does not refute in any way the concept of peak oil. I have long held the view and stated it here on TOD repeatedly that price is no indicator of peak. There are too many other variables.
Excess investable money now is concentrated in cash and bonds, but will soon begin to look for somewhere to go. The question is, where?
Do not dismiss the possibility of a rebound in oil prices back to some $85 to $95, a fair market price as China and India and other developing markets recover, but don't bet all of your chips on it, keep some loose for other things. Buy enough oil or gas futures at these prices to hedge your consumption. Your going to buy the product if you drive or heat your home anyway! High dividend paying infrastructre development and distribution companies are not a bad bet. Very safe utility bonds, and in particular TVA bonds are something to keep for the longer haul. Get the dividend! Get paid while you wait!
Everyone is holding their breath for what happens in the automotive business. They are being given all the room possible to survive by the government, and if they can make it, they may make for a heck of an opportunity in the longer haul (say 3 to 5 years), but I am almost against buying them on ethical grounds. Still, the money could be good if they survive, but it's a speculative bet.
But we know one thing: There will be another bubble, and then another. Human psychology never changes, or as has been said, "the only constant is human stupidity." The only question, what will the bubble be in the next time?
RC
Housing in the US has been in a speculative bubble since WWII.
As with any bubble market there have been short periods of retrenchment but in all cases prices have consistently increased.
Your wrong to tie speculation in housing with the tech bubble in fact if you look the popping of the tech bubble had almost no effect on housing.
Lowering interest rates after the tech bubble burst accelerated the housing bubble and arguably caused it to pop early but it would have eventually popped anyway because of peak oil and baby boomer retirement.
Next bubbles are trivial to detect all thats required is to identify speculative demand and also notice that its growing. Speculative demand is simply someone holding a product for later resale at a higher price. Hoarding is what causes price bubbles.
Speculative demand in housing became blatant at the end however for a lot of the housing bubble effective speculative demand was fueled by racism and bigotry as housing stock was abandoned to escape living with people who where different again in the southern US it was obvious in other parts it was less blatant. Banks and governments where willing players in this game.
For oil you have a problem for speculative demand to cause a bubble you would I'd argue need to store a crapload of oil for later delivery very few entities are capable of storing enough oil to actually effect the markets. The US spr and I'd argue KSA are the only two entities capable of even a short term speculative move in the oil markets. You can figure it out yourself but I figure your need 30-60million barrels of oil added or removed to the oil markets over a period of 30-60 days to even influence the oil markets.
The only entity that speculated in the worlds oil markets was KSA and it did it be surging oil exports as demand was falling they are the only people that can realistically provide or withhold the required oil for real speculation.
Now with that said if the market is very very tight then and only then could a small amount of speculation using both oil and money actually have a influence on prices. Thus if supply is not really meeting demand one can see that storing a more manageable sum like 5-10 million barrels of oil could say move global prices by a few percent but thats a small speculative effect.
You have the same problem in reverse for oil again since no one can really store all that much of it if you produce it you have little choice but to sell it for whatever price you can get. Thus is supply exceeds demand for oil once storage is full the price falls dramatically if you continue to produce.
In the excess case it actually works like a traditional commodity like grains if the crop is large and storage is full the price for excess grain goes to zero. Same for oil. Next season everyone is forced to plant less and with oil production is pulled back to match demand you cannot overproduce oil for long.
Given the relative lack of storage for oil vs daily supply one can further see how devastating surging exports during a normally low point in demand and further more with real demand falling is. You quickly fill all available storage.
About the only thing that kept oil from falling to 10 dollars a barrel was the simple lack of storage itself i.e people had to keep making new orders forward and the contango remained in the market as actually supply into the future was not sufficient to allow the futures market to collapse.
Show me storage for 300-400 million barrels of oil owned by speculators and then I'd change my opinion. Using the housing bubble as and example when speculation finally really drove prices about 50% of the homes where bought by speculators. In the Hunt silver bubble its my understanding that they bought 70% of silver production near the peak. For the DeBears Diamond cartel 90% of production is bought by the cartel to maintain prices.
So lets say for oil given the lack of storage speculators would need to corner say 4mbd of production and store it for say 60 days thats 240 million barrels of oil. And thats well under known conditions where speculative bubbles zoomed to bursting point.
Now one could assume that a pure financial manipulation of a market is possible but again its difficult to see how this could last for months given the nature of the oil market and inability to store. I know of no single example of a speculative bubble without hoarding. I'd certainly be interested in reading how one could be created but its not easy to see how it can be done without artificially increasing demand and traditionally this is done by hoarding the actual product. I'd argue that if you think the oil market can actually be manipulated with pure financial speculation to the extent that prices where tripled then how on earth can you assume current prices are not the result of massive short speculation ?
The argument works both ways if the oil markets are really that rigged that they don't represent the actual physical market then god only knows whats going to happen. I'd have to think that if they where that rigged given the size of the worlds oil markets then the US government would have to be a big player in rigging the markets. This leads to not leadfoil hat speculation not tinfoil.
Occam's razor states that the market has for the most part correctly price oil all of last year. The nature of the market ensures that speculative pressure with the single exception of Saudi Arabia cannot effect the market significantly. Given the movements Saudi Arabia made in 2008 and demand I'm perfectly comfortable that the price was correctly set by the market.
The only point I question was the consistently low prices following the Hurricanes however the other speculator capable of influencing prices i.e the US government with its SPR did step in during this period. It seems that offers of draws from the SPR and a few actual draw where sufficient to keep prices low. Certainly at the same time we had hedge funds unwinding so the combination of forced selling of futures and real oil from both the SPR and continued large shipments allows oil prices to remain low and falling even as GOM production was taken offline. Thus I do question the price movement over a small time period which still seems questionable. In general from July through November very large and complex forces where roiling the oil markets and this includes a serious surge from KSA but as November ended it was clear that the market was finally starting to become more attuned to simpler supply demand issues.
In conclusion I see no speculative bubble in oil and doubt given the nature of the market that one could actually occur. I do see a number of complex and large forces that effected in the market in the second half of 2008 that probably to complicated to call it a bubble.
And finally right now current supply simply exceeds demand. Despite the complexity of what happened in the second half of 2008 when the smoke finally settled we had a simply supply demand issue. Thus no bubble first half of 2008 complex forces second half finishing with excess supply and the market for the most part responded correctly. I find the factors behind the price decline in the second half of 2008 far more interesting and informative then the supposed speculative bubble in the first half I think most people are looking in the the wrong place and wrong time for when oil prices where significantly distorted.
In doing so they are missing very important information.
I like these polls, even if they often are not more than educational fun.
However, why Year End price?
What is so significant of the price of oil on 31st of Dec 2009, compared to, say 13th of October 2009?
It's just a day, and a single day at that. It may be almost completely unrepresentative of the whole year - and getting it right represents very little else except a guessing game.
Now, if we voted on year average and std dev, then it would get more more interesting AND imho, more useful.
Just food for thought - don't take my comments too seriously, after all it's good fun even as it is.
Using Wetexas' WTI graph up above ... extrapolating it gives a fairly accurate figure for the average 2008 price ... however, if oil is like other commodities the bursting bubble would suggest back to ~$20 for years and years ... which implies ever diminishing economic output for years and years as the oil that can be profitably produced at $20 gradually depletes.
The big question is ... is oil like other commodities? ... or is it special in some way?
I think it is special ... the master commodity with no adequate substitute, our food depends upon it for example! ... which implies the price won't be low for very long or we will all starve.
When my grandparents were growing up, all people had their own gardens and could grow their own food. Now people are too lazy to do any real work like growing a garden. But when they have to do it, then they will start growing that garden. Indeed, we have had it too good for too long.....
Our ancestors tilled the soil for thousands of years before us.
So we will have more farmers, and less computer geeks, what a pity....
I think that OPEC is going to have a hard time trying to control the price. If agreements about cutting production are honored, I think they are going to have some trouble pacing the drops in demand. What we're facing is worse than the Great Depression, at least in America.
Last year I drove a minimum of 60 miles per weekday. This year I drive 11.2 miles per weekday. I use public transit as much as possible now. A lot of people started using public transit and are sticking with it because it's more convenient despite adding a small amount of time to your normal commute.
Then you have the unemployment situation which will be far worse in 2009 barring a miracle of some sort. Fewer businesses will be around to use the energy. Less goods being bought here leads to eroding energy demand in China. We're looking at multiple feedback effects because of globalization. So the pressure will generally be in favor of a lower price.
However, we have to expect the unexpected as well. We see that the fighting in Israel is having an effect. Soon Obama is going into the White House. Joe Biden said Obama will be tested. Various military projections and other politicians have said that the odds are high that Obama will be tested (i.e. we can't foil EVERY attack) within 8 months. There are many reasons to believe that SOMETHING is going to happen, the world isn't getting safer after all.
I voted for $50-$75. Without a combination of effective production cuts, escalating conflict or war, and maybe a major terrorist attack (9/11-like)... I would say we're heading to below $20/barrel for a brief period and then stabilization around $20-$25.
I voted for the second most expensive price category: total WAG, no justification. If I win the invitation to meet Prof. Goose, I will donate it to Tiger Woods if they both promise to video release the interview as it proceeds over 18 holes. Of course, a Goose is not a Black Swan, but a Tiger might be surprised how tenacious the fight might be...:)
EDIT: No golf equipment allowed; both must use wheelbarrows to caddy their 'clubs' [axes, shovels, hoes, hand-trowels, scythes, etc].
Bob Shaw in Phx,Az Are Humans Smarter than Yeast?
As total liquids supply decreases the oil price should revert back towards its long term trend as shown by the dashed green line in the chart below which has been updated for OPEC production cuts and the recent IEA Dec OMR.
http://omrpublic.iea.org/
The forecast weighted average oil price implies that WTI oil is likely to be between $100 and $147 at the close of 2009.
OPEC 11 is doing its best to get the price back up to at least $75. Petrologistics estimates that in Dec 2008, OPEC 11 produced 27.1 mbd crude oil. This corresponds to a cut of 1.9 mbd from Sep 2008 levels, which represents 45% compliance with the total cut of 4.2 mbd.
http://www.bloomberg.com/apps/news?pid=20601072&sid=a_TxZfNZWTyo&refer=e...
OPEC cuts may already have helped the oil price to revert back to its uptrend. On December 31, light sweet crude for February delivery increased by 14% to just under $45 a barrel.
http://money.cnn.com/2008/12/31/markets/oil/index.htm
The forecast total liquids supply below assumes that OPEC 11 compliance is about 70% of the total cuts of 4.2 mbd.
Supply, Demand and Price to 2012 - click to enlarge
The largest component of total liquids is crude oil, lease condensate and oil sands. The forecast below indicates that production in Jan 2009 is 71.9 mbd. The last time that production was below 72 mbd was May 2004 at 71.4 mbd. There is a strong possibility that production will never exceed 72 mbd again as indicated by the forecast below.
Crude, Condensate and Oil Sands to 2012 - click to enlarge
The forecast to the end of this century indicates that 2005 was the peak year for crude, condensate and oil sands at 73.74 mbd. The combined crude and condensate production for Saudi Arabia, Kuwait and the UAE also appears to have peaked in 2005 at 14.62 mbd.
Crude, Condensate and Oil Sands to 2100 - click to enlarge
Hmm according to your graphs we are now entering the phase that a noticeable gap begins to open between supply and demand see my previous post about volatility.
It would be nice to think about large price swings like we have just seen becoming more common going forward. I like your graphs and think they are basically sound except that we have evidence building that spikes are "latent" if you will in the current prices.
Lets assume for example that the first spike took six months and prices doubled.
Lets say the reverse spike we are seeing lasts about six months then we go into another upward spike but twice the amplitude this would take prices to 200-250 or so before backing off to say 100 by Jan 2010 then back up again.
This scenario implies that OPEC maintains spare production and eventually floods the market causing prices to fall. It would fail if OPEC decided to not flood.
I think price volatility in past post peak conditions had a lot to do with temporary surpluses pulling the price down. I question if this will really happen again assuming that KSA by itself holding back results in the lack of a surge.
Now as far as why prices can go to 100, 140, 200, 250 basically pick a number I think its pretty simple. When a bidding war starts between wealthy nations they will pay whatever they have to. The underlying reason is whatever it takes to prevent serious shortages from developing. If the supply/demand equation amongst wealthy oil importing nations reaches the point that shortages start developing then the upper limit on prices is unknown. It becomes a choice of economic crippling from price or from shortages.
The point is this is the real driver for oil prices and in a sense is the opposite of export land lets call it wealthy import land. Given that these same countries control the currencies used to purchase oil then life can get interesting fast.
I don't think this deep pocket volatility factor is included as a supply demand gap opens.
Memmel,
You're right in that I don't include high future price volatility. I only account for seasonal volatility. It would not surprise me if WTI oil overshoots this summer to over $150.
The prices of Tapis and Minas are now over $45 today. Note that the last traded price of Brent was $35, probably on Dec 31. It will be interesting to see how much Brent spot price moves up later today when trading starts. Brent could move up by $10 to catch up to Tapis, which would represent a 29% increase in one day.
source http://www.upstreamonline.com/market_data/?id=markets_crude
Bloomberg already has dated brent spot at $44.62.
http://www.bloomberg.com/markets/commodities/energyprices.html
Not sure how to do it but its important :)
On the same note if you look at non-OPEC oil supply you will notice that seasonal variation in oil shipments seems to have disappeared. The variation in OPEC exports was interesting and in general counter seasonal.
The combination of another bidding war erupting and OPEC actually able to control oil because of the decline of non-OPEC supplies is very volatile.
Throw in the current political situation of Israel invading Gaza as OPEC member who are in general against Israel being under orders to cut and life gets interesting. I.e we could well see OPEC almost accidentally act as a cartel as I'm sure not cutting could be viewed as in a way supporting Israel. Thus we have a very good short term reason for a lot of OPEC members to actually do what they said they where going to do.
I think a sort of volatility graphic would be helpful your estimate of prices with say a swing of 2-4mbd in production up and down from OPEC post peak.
Sort of the strong OPEC case.
I think the production side is easy its just compression in a sense of your supply and demand curve. The really interesting aspect is not the potential for OPEC to discover it can control price but the demand response if OPEC manages to manipulate prices to high.
I'd suggest that because the supply imbalance would be correctly viewed as a short term supply problem from OPEC that demand would be robust since price increases are expected to be temporary.
Now what gets really fascinating is at some point looking at your graphs is that by late 2010-2011 we would actually see a real permanent supply/demand gap open up after and OPEC induced price spike. Lets say that it takes six months of consistent OPEC control of the oil supply to cause 150 dollar oil this puts us into the second half of 2009. So assuming that the US manages to continue to prop the economy up and keep it and general world demand continues to grow at a small rate we still see a noticeable and real gap opening in 2010-2011.
Your big arrow as plataue through 2009 for example. The point is if you throw in OPEC/Bidding war/ Export land volatility on top of your demand gap prices get crazy and the real obvious no way to hide it post peak signal is literally pushed out until after 2011 maybe even 2012. It could be that long before the world is actually forced to grapple with the fact the world really peaked !
Whats actually really fascinating is how this plays out politically for Saudi Arabia by the time they actually have to admit peak it may literally not matter any more since the rest of the world would be well pass peak. They in my opinion just pulled off the political move of the century almost.
If I'm right about a lot of my thoughts through this year esp that the surge from Saudi Arabia was unsustainable and drew down their own strategic stockpiles then they will have to cut and cut deep to ensure that the world views price increases in 2009 as a result of OPEC cuts not peak oil. Its in my opinion absolutely critical for them to ensure that the world thinks that their cuts are the cause of price increases for as long as possible. I'm sure at the right time they will claim that speculators are again driving the market interfering with them trying to set a just price. Basically they have to do this to hide the fall into post peak production until they can safely point out that the rest of the world is screwed and they cannot increase production to make up for the rest of the worlds decline.
At this point they should have consistently high priced oil assuming we don't have widespread economic collapse and I think if you look going forward past say 2012-2013 that even if whole countries collapse price will probably remain high. Given the game I think they have played to date I have a lot of faith that they can make it till oil becomes a valued commodity even in a ruined world.
Makes me wonder if at some point Saudi Arabia may not play the Iran card and acquire some of its own nuclear weapons to protect against someone killing the golden goose. You can see that they could really use some at some point in the next ten years. And whats really fascinating is if Iran really does develop nuclear arms for KSA to arm itself would probably be accepted by the international community in say 2012-2014.
And last but not least if Ghawar is in as bad a shape as I suspect then Saudi Arabia actually need to do a repeat of their cutbacks in the 1980's to ensure they can play the game I think they are playing. Thus for me at least everything points to us seeing some incredible cuts coming if I'm right about the Geopolitical/Oil depletion game KSA is playing.
I could see KSA wanting to reduce production to the 4-6mbd range for as long as a year if not longer. Indirectly I think we will learn a lot about KSA true production capacity as we watch how much they cut and for how long.
If they do cut and don't increase if prices cross their threshold then they have physical reasons to cut. Next if they cut and prices stay low and they keep production low for a long time they have physical reasons.
Only the case of them cutting production less then what I'm guessing and prices remaining low then increasing before the end of the year indicates that that they have both ample reserves and low lifting costs.
So overall the next year or so is going to tell us a lot about KSA's real production capabilities. And if they play the game I think they are playing by the time they finally have to admit to their true situation it simply won't matter.
So to go off on this KSA tangent but given my price volatility concept you can see that the lynch pin is really KSA what it does will determine the short term future of both oil prices and production.
As opec cuts they clearly regain spare capacity, which presumably was around 0 last summer as saudi surged their production and precipitated the price decline.
So long as opec has spare capacity (and determination) they regain price control, which had been lost on the upside for some time and, more recently, also on the downside on account of 1.5% increased production plus reduced demand mostly on account of high price but partly on account of slowing economies. There is increasing reports that various opec members are cutting production to conform with the new quotas.
IMO they will hit saudi price target of 75-80 (just below tar sands new projects cost) in the near future, and price will remain in or near this zone until depletion and the lack of new investment soaks up opec surplus, probably around 2010-2012, depending on the severity of the downturn. So, my prediction of price for 2009 is the saudi preferred price, 75/b. And, unlike others, I see little volatility for this year as the market accepts the new price regime... investors/speculators will soon decide it is not profitable to bet against opec.
Meanwhile today's price has hammered some of the small US e&p's, a recovery to 75-80 will not return earnings they reached in 2008 thru Q3, nevertheless share price recovery should be significant. Shares have already recovered modestly from the trough, but still look like good investments to buy and hold over the next few years.
I would think it incumbent on us to do a post-mortem on 2008. How is it possible that on a blog where we supposedly know more than almost anyone else about oil supply and demand, that virtually no one accurately predicted the price of a barrel of oil going forward just one year?