A Few Thoughts on US Petroleum Demand, Inventories, and Prices
Posted by Gail the Actuary on February 26, 2009 - 4:50pm
The price of West Texas Intermediate (WTI) oil finally seems to be rising. At least part of this may be occurring because inventories at Cushing finally seem to be drawing rather than increasing:
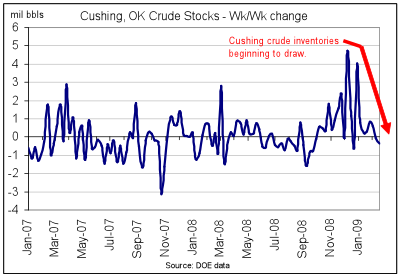
WTI has recently been trading at a discount to Brent. The shift in the inventory situation may help get this relationship back to a more normal relationship, with WTI priced above Brent.
One might also ask whether US demand is playing a role in higher prices. Below the fold I show a few graphs that seem to indicate that US demand is really not up much yet.
Gasoline Demand
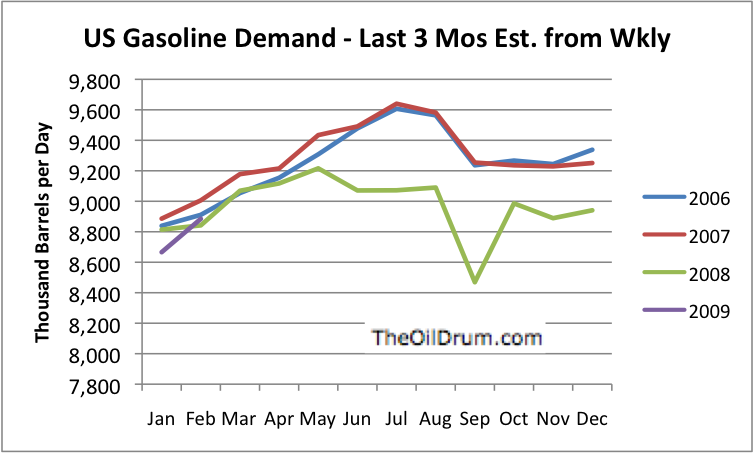
One can see from this graph that January and February are months where little discretionary driving is done. January and February 2009 demand is only a bit lower than demand for the same months for 2006, 2007, and 2008. If we look back at 2008, we see that the big drop in demand was during the summer months, when a lot of discretionary driving is done. There was also a big drop in demand (or really, gasoline available) in September 2008, after the hurricanes hit. Demand bounced a little in October, as customers refilled their empty tanks. November and December 2008 demand seems to be down about 3.5% from a year earlier. While January and February 2009 are closer to demand of prior years, their absolute level is not very high.
Demand for Other Petroleum Products (Diesel, Jet Fuel, etc.)
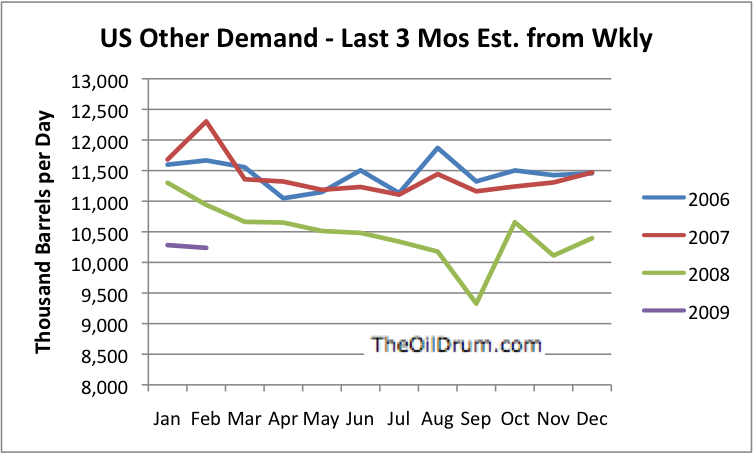
One can see that demand for petroleum products other than gasoline was down during all of 2008. Demand in the first two months of 2009 seems to be down even more. Exports play a fairly big role in the "other that gasoline" category, and these are difficult to estimate accurately, so my estimates for December 2008, January 2009 and February 2009 are subject to change.
Total Petroleum Products Demand
If one adds together the demand graphs for gasoline (Figure 2) and for other petroleum products (Figure 3), one gets this demand graph:
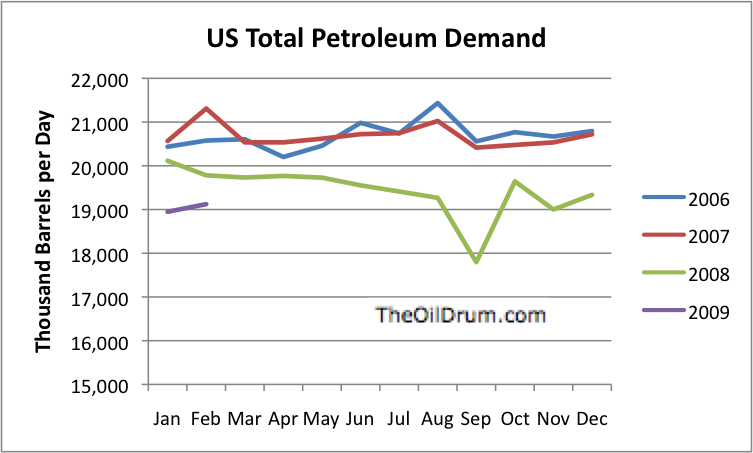
Total demand still seems to be down in the 19 million barrel a day range. This is quite low for the US. Refiners are adapting gasoline supply to today's reduced demand level. The lower supply is tightening inventories, and tending to keep gasoline prices higher.
Contact
- Content: editors at theoildrum dot com
- Tech support: support at theoildrum dot com
License

This work is licensed under a Creative Commons Attribution-Share Alike 3.0 United States License.
Thinking about this and the fact that I still see Wally-World parking lots full all the time, sooner or later the use of Oil in America should be heading back up. Spring is coming, Lawns will need mowing, More planting will be going in, Just the general movement of Springtime.
Then again, 2 weeks ago I know of 2 cars that bit the dust and got totalled. No one was hurt Thank God, but yet at least one of the vehicles will not be replaced in the foreseeable future. One down 30 million to go.
Yet we are still heaving Jobs out the window and more and more people will be driving less for a while, unless they drive more while hunting for the next job. All in all I'd think the driving miles would go down a bit even if they are still job hunting, saving money for the house and food would be top issues.
Charles
Thanks for the data. I'll head off the quibble that I know is coming: "usage" might be a more appropriate word than "demand", since demand is generally thought of a function of price. The fact that usage is down so much, even with prices down too, is actually even more remarkable than what is indicated by the charts. It suggests to me that the state of the economy has much more impact on usage that does the price.
One can imagine that if the economy shows signs of a comeback, prices will make a comeback in a major way.
Do you think it is possible that the US will never annually use more petroleum again than in 2006 and 2007? I think that it is quite possible.
If (1) recovering US demand coincides with the effect of OPEC production cuts (the markets finally seem to be taking the idea seriously, especially now that this 4.3 MPD figure looks like it's really going to happen), such that prices recover enough to keep demand lower than the levels of recent years, and (2) that condition holds while (A)projects are being mothballed and investments cancelled, (B) China and others lock up bilateral non-market deals with producers, and (C) all the while depletion from existing fields of course continues, I guess it's possible there will never again come a time where (1)America demands as much oil as in 2006-7, and (2) that much oil is actually available to it.
In that case, we would already have seen American Peak consumption.
I think that is a very safe bet. For usage to go back up to 2006/2007 levels one needs the economy to recover enough to allow for discretionary driving on top of full commuting driving and for the price to stay below 2007 levels.
The economy does not appear headed for a recovery soon. By the time it does recover, the price of oil will be much higher due to the supply dropping off.
Does US consumption include how much it takes to support our soldiers in Iraq and Afghanistan? I think I recall hearing that it takes on the order of 16 gallons a day per soldier.
That is less than 100,000 barrels a day, we barely acknowledge such a small figure.
The demand number they use is weird. Usage is probably a better word. I think the EIA calls it Products Supplied. Implied demand is a bit different horse.
Excellent question if we ask will the US ever use more than we did in 2006/07. Sobering really. If the answer is no, we will never grow GDP again. Ever.
I think that may be a bit extreme. The Kingdom will have 3-5 MMdb of spare capacity when the normal cycle turns in late 2010 so that will allow hyper-charged grown until maybe 2012. I think oil might be $175 a barrell then and Pres. Obama will be on his way out and right wing republican will win promising to 'guarantee American access to oil' using 'any means necessary'. Then we fight China for the last drops.
Well, I got off on a tangent. for a first post that was rather depressing.
PooBah
I agree--demand is not a very good word for it. Product supplied really describes the situation better.
Glad to have you as a commenter!
Naw, they just use different words in different places but the figures are exactly the same. They use the word Demand here.
http://www.eia.doe.gov/emeu/ipsr/t17.xls
And they use the words Petroleum Products Supplied here.
(Excel) http://tonto.eia.doe.gov/merquery/mer_data.asp?table=T03.01
(PDF) http://www.eia.doe.gov/emeu/mer/pdf/pages/sec3_3.pdf
But if you check the numbers, they are exactly the same. The latter numbers however from their Monthly Energy Review are always two to three months ahead of the former numbers from their International Petroleum Monthly
Ron
Very interesting post, I appreciate all the work you do on this site.
My take is that in Q2&308, when there were arguments that the economy was still expanding a little but oil price went far above normal, people drove and flew less, even to the point that consumption in aug/sep was less than what was/is normal for winter months. IMO it was the shock of high prices, and not recession, that pushed down gasoline demand.
The recession is much more clearly with us now but oil price is under a year ago, accordingly gasoline consumption is back on track with what is normal. Assuming oil stays under 80/b or so then IMO gasoline demand will continue in line with traditional usage, e.g. 2007. However, vacationers and business people alike will cut travel expenditures, meaning that jetfuel will continue sharply down.
Most of the cutback in gasoline demand has been the US, which e.g. saw a much higher proportional increase in price than europe on account of our low taxes. Growth continues in some parts of the world, china (maybe), and the persian gulf. Tata is about to begin sales of the nano* car for $2500. IMO we will not see shrinking demand and low price regardless of the recession. As WT says, price and demand declined in only one GD year, 1930, both rising briskly thereafter... and there was no hint of PO in those days. IMO the down year was 2008.
Also note that Henry Groppe thinks price will double this year.
Regarding refiners, their crack spreads have been vanishingly small, almost no profit at all. It makes sense to produce less until prices rise sufficiently to justify running their expensive facilities.
* http://wheels.blogs.nytimes.com/2008/01/10/tata-nano-the-worlds-cheapest...
In the 1979-1984 recession, vehicle fuel efficiency increased 2.8% a year until 1992( according to Stuart Staniford).This was with low prices for the decade, so VMT continued to increase faster than 2.8%. If OPEC can return prices to $100 barrel, we would expect to see about 3% ( or more) increase in fuel economy AND perhaps very little VMT increase. If fuel oil also continues to be replaced by NG or electricity, the US may well have peaked in oil consumption( demand).
Rapid and wide-spread adoption of PHEV and EV's would be the last nail in the coffin for oil consumption, but OPEC may still be able to control price if non-OPEC supplies decline quickly, and a PHEV transport economy would be able to tolerate much higher than $4/gallon prices, probably more like $20/gallon prices( in today's $$).
A large PHEV fleet will be very elastic in consumption relative to gasoline price, taking extra care to top up battery charge if prices high, making more shorter trips, not being too particular if prices are low using gasoline as a convience.
It could be a win-win for OPEC, and OECD economies and reduce the decline rate so that prices stay high but NOT spike to $1000/barrel.
Some longer term perspective on crude oil inventories on Days of Supply basis:
Crude inventories are definitely high relative to recent years, but that is the context of an industry decision to apparently move to more of a Just In Time system. Year over year, assuming a MOL of about 270 mb, we have gone from about 72 hours of supply in excess of MOL to about 144 hours of supply in excess of MOL.
Gail, how does it look if you add in gasoline imports? Murray
These amounts include gasoline imports. The amounts represent the total amounts sold during the period.
One problem that comes up is that the monthly actual data and weekly estimates aren't exactly equivalent. The export amounts in the weekly amounts are EIA estimates, and historically these have tended to be too low. I have tried to adjust for this bias--recognizing that this bias may change or disappear, since export levels are likely changing now with the reduced world demand and the lower WTI price.
Nice to see demand by years (or product supplied or whatever you want to call it) stacked like that, much as the FHWA does with VMT:
Note that we bucked the usual downward trend in Dec. for some reason - more people tooling around dropping off resumes? And perhaps '09 will match '07 levels, as long as the cheap juice holds out. Or people have jobs to make money to buy the stuff in the first place.
For Product Demanded, a graph organized by PADD would be cool, using EIA Company Level Imports would be totally boss - you can sort the .xls any which way you want, by product or state or city or company or nation. 'Course, having made special docs for just the Pacific Coast states, I can testify that this is a real chore to prepare. Doesn't help that the sheets for 2001/2002 were formatted differently in certain repects than the rest - damned Bush appointees! That would be the tool to use for an insight into the impact of Gustav and Ike.
I am afraid I am not up for doing more graphs. If someone else would like to do them and post them, that would be great!
The stacked graphs are easy to do. If production amounts are displayed in a horizontal grid with months across for each year, as they are with the EIA data, Excel makes that type of chart easily.
Oil was up 6% today. As supply is cut by OPEC and declines start for Non-OPEC, the price will escalate back up to $100 within a few months.
i wish that were so, but i'll believe it when i see it. However, i'd rather see nat gas go up.
found this at:
http://www.houstonenergyanalyst.com/Predictions.html
"Oil grinding lower. Will follow equities markets:
As noted on the Energy Week show this past Sunday, I'm looking for April crude oil to start off the week on a slightly higher note, pushing up to the $41-$42 area, but I don't expect too much of a rally to unfold. I do think we have a potential to re-test the $35 or lower area this week as well.
For the most part, oil futures are likely to follow closely to the stock market. Even though we saw a sell-off in equities last week, which began to test the November lows, we didn't get much follow-through to the downside. This tells me that we COULD see a bit of a rally in stocks first, before the bottom falls out.
With regard to the stock market -- let me be very clear about this -- I'm expecting an major sell-off in the stock market to emerge at anytime! As I've been saying since last November, I'm expecting the Dow Jones Industrials to plunge to the 5,500 to 5,000 area. This is now becoming more evident to me that this massive collapse is likely to occur anytime now. When this happens, look for crude oil prices to tumble down well below $30 a barrel.
Natural Gas Predictions:
As discussed on the Energy Week show, I'm looking for a slightly higher trending March gas futures contract early in the week on Monday, followed by erosion in prices as expiration for March gas happens on Wednesday. I'm looking for natural gas to fade back down to the $3.90s-area again. If violated, look for prices to erode further, down to the $3.85-70 zone going into expiration.
Regarding the longer term view: March gas has recently fallen to a level approximately equal to the low price of the year for ’02, ’04, and ’06, while the one-year strip price fell to the lowest level since ’04. A short-term correction is well overdue, and the higher close last Friday may have been a signal that we are going to see a one, but not before we plum lower numbers first. The weak economy, a waning heating season and a glut of gas production don’t bode for a big price rally, but the passage of the monumental stimulus package may be enough to put a floor under all commodities. We may be near the reversal from the bottom that is a sign to buy longer term gas (and electricity)."
(please note, this is a weekly forecast, so it's pretty much short term. but some long term forecast can be extracted.)
Whats important is that it looks like a fairly sharp economic slowdown has resulted in a demand decrease on the order of 1-2 mbpd. This can and will vary but also we are seeing sings at least the demand is no longer decreasing and may already be slightly rising.
The US uses 25% of the worlds oil so and initial rough estimate is worldwide demand down by 4-8mbd. I'd suggest that the US has the most discretionary oil use ( we are the most wasteful ) So a more refined estimate is probably towards the low side i.e 4-6 mbd.
Underlying this demand decline you have intrinsic growth in demand from our ever expanding population. Lets guess worldwide we see a 1% natural increase in demand from demographic changes. This is roughly 1mbd of intrinsic demand increase thats resistant to decline this is relentless and shifts the overcapacity downwards i.e 3-5mbd.
Given the economic pullback I think its reasonable to expect that real production capacity will come of its current plateau and begin to decline Non-OPEC production has been in decline since 2004.
I'd argue a real decline of 1-2 mbd is reasonable.
Lets go with the low figure this again shifts the spare capacity downwards to 2-4mbpd.
Finally export land may slow but its not going away a lot of the population increases are in oil exporting countries with subsidies.
I don't have WT estimates handy but we can guess that regardless of economic slowdown we will see at least a 0.1-1mbd change in available exports this pulls the range down using the low end estimate again.
Now its sitting at 1.5mbd-3.5 mbd.
Finally last but not lease OPEC itself is cutting back its reasonable to assume that they will achieve a real 2mbd cutback.
This puts spare capacity at -0.5-1.5mbd
Finally we could assume that given this range and the error in the estimates at this point control of oil prices is probably doable by OPEC
They might have to do some additional cutting beyond the current cuts but if demand remains close to its current levels then OPEC should be able to put a floor under oil prices with even the slightest discipline.
As Non-OPEC continues to decline and export land marches on any spare production capacity is completely under OPEC's control in particular if production declines even a bit more then projected here Saudi Arabia alone should soon be able to manipulate oil prices at will since effectively all the spare production capacity whatever it is would be under Saudi Arabia's control.
Thus for now at least it looks like Saudi Arabia alone can finally play the role they have claimed forever which is to be a true swing producer.
Finally depending on how production capacity trends over this year we could easily see this spare capacity dwindle. Sometime in 2010-2012 the world would have no spare capacity with demand within say 1-2% of its current levels.
Looking at US storage levels etc and guessing whats happening it looks like the world overall had excess production of oil of about 1mbd for about sixty days or about 60 million barrels of excess production is floating around our globe maybe as high as 100 million barrels. If OPEC can cut production by 2mbd for 60 days then we should see this spare oil drawn down in about 60 days. This is a very hazy figure but it gives you at least a ballpark figure for when OPEC could conceivably control prices.
Rising prices attributed to OPEC cuts that could disappear at anytime will not spur new investment in production.
Back on the demand side consider a Mortgage Broker making 200k a year selling subprime Mortgages his office is five miles from his house. Assume now he has lost the house has and apt and works at a McDonalds 10 miles from his apt. In this case the oil used by this person has increased significantly despite a massive reduction in his contribution to the GDP. Lets say his GDP contribution has dropped at least ten fold while oil consumption doubled.
The point is after the obvious pullback in spending esp in areas where the economy bubbled i.e housing the relationship between oil usage and GDP is complex and full of numerous counter examples depending on very specific conditions some peoples oil usage goes up some down. Thus the net result is that oil usage becomes somewhat decoupled and in another post it was pointed out that people burn cheap oil to get expensive money. Basically anyone capable of trading energy for money will make the trade. Only if oil becomes expensive again does it make sense that pressure to conserve will exist.
Bottom line is I see no reason that OPEC cannot take control of oil prices and pretty much set them at what ever level they wish. All they need is a small amount of discipline. Next this need for all of OPEC to participate in production cuts is weak and may not even exist right now.
Saudi Arabia may already be able to control production via cuts they are capable of making i.e 1-2mbd. Within 1-2 years they may not need OPEC to cut to control prices. And shortly after that they may well lose the ability to increase production to keep prices in check.
And last but not least outside of a confirmed overproduction of 1-2mbpd for at least sixty days we really don't have a clue where we are at. I think the rate at which US spare oil storage declines will be very telling. If it declines rapidly then this sort of implies that production has fallen off fast beyond OPEC cuts. If the OPEC cuts result in a very slow decline and prices remaining about at this level through the year then it implies we are on the high side and spare production outside OPEC exists or that OPEC itself would have to make deeper cuts then they probably can pull off to restore prices. Regardless I think we will glean a lot of information from how these spare barrels are finally cleared from the market.
I agree the extra inventory amount makes these confusing. I think Cushing particularly has gotten full, and this has tended to depress WTI prices.
Investments are way down. I understand Obama's tax proposal is to increase oil and gas taxes. This will decrease investment even further. I think we may be headed for real problems more quickly than people realize.
Gail -- Based upon a summery I read of the new o&g taxes it might not have too strong an impact. It seems the biggest increase would be for those operators who had benefited from the Deep Water royalty exclusion (which I suspect this new tax will end up before the Supremes in several years). Other OCS operators will get a tax credit in exchange for the increased severance tax. Thus the bulk of those taxes will really be consumption taxes paid by the consumers. The $4/acre/year rental fee for non-producing OCS leases will amount to $20,000 per typical lease block. The income from this slice of the pie will probably be less then anticipated. If an operator is hanging on to 30 lease blocks (hoping someone will come along with a new drilling idea and sublease from them) he might rather drop those leases then pay $600,000/year to hang on to them for a long shot prayer.
There may have some more onerous provisions I haven't seen yet but what I've read so far I don't see a big impact on the oil patch....at least not big enough compared to the spiral down caused by the price collapse. Have I missed something big?
My question: At what stage of the production/consumption process will the proposed carbon tax be paid? Of course, prices will rise downstream from the point that the carbon tax is paid. If had my choice, I would have imposed an energy consumption tax at the retail level, offset by abolishing the (SS + Medicare) Payroll Tax.
It sounds like most of the provisions that are likely to be problems are repealing benefits for the very small producers. These are already on the edge.
Why is it that in these graphs, the end of each year does not line up with the start of the next year?
One number is December; the other number is January.
I had the same question. Does this mean that gasoline demand in January is always sharply lower than December?
Qualitatively that seems likely:
1. There's a lot of holiday travel, both for socializing and shopping.
2. In much of the country real winter weather tends to hit in mid December and last till about March 1. This does make people cut back on discretionary driving more in January.
I agree with you. People go visit their relatives over Christmas and New Years. They also do a lot of holiday shopping and driving to parties.
Once the snowy season starts (mid December) people in the Northern states don't drive anywhere they don't have to, except for their planned trips over Christmas and New Years.
This is one reason I was watching the winter numbers with extreme interest they would tell us how deeply non-discretionary demand has been effected. Despite the economic slow down the answer seems to be not much.
In a previous post I likened gasoline demand to a plate of jello the discretionary demand is like jello and is very elastic but once you hit the plate it becomes very difficult to drive demand below that level.
The division is easy enough to figure it gasoline used to make money and gasoline used when your spending money.
On the making money side costs such as gasoline can and will be passed on through the economy. For your typical salaried employee driving to work this means reducing expenditures in other places at first discretionary driving then other expenses which is where mortgage debt and work costs compete for a workers salary. Other expenses such as food costs and utilites can be reduced some but they suffer from diminishing returns. Many people may be able to initially half their food budget for example but and additional 50% cut is exponentially more difficult.
The two big expenses that can be reduced when the consumer is strapped for cash are not buying a new car and defaulting on mortgage debt. The last one is defaulting on credit card debt.
My argument is that once discretionary driving is reduced that we won't see significant changes in gasoline usage in the US until after people have reduced expenditures on mortgages and automobiles. This will take years to play out. For housing many people underwater on their mortgages will eventually default. When oil prices start rising strongly new home buyers will seek cheaper and cheaper housing options. Housing choices would also be strongly influenced by the distance needed to travel to work etc.
Unlike that last thirty years I think we will see people seriously work to conserve the amount of money they spend on housing to ensure they have enough cash flow for food and transportation. This is a fundamental change in the American lifestyle. Only after this new conservation is in place for housing costs do I think that reducing fuel expenditures will become and important issue.
Hi Gail
There seems to be a discrpency between numbers depending on source. If you look at the following EIA link;
http://www.eia.doe.gov/pub/oil_gas/petroleum/data_publications/weekly_pe...
Total product supplied is quoted as running at 19,723 for 2/20/09, down from 19,889 for a year earlier. that's a drop of only 0.8% and nowhere near the almost 2mbpd drop shown in your figures.
Am I missing something that is different in the way the two datasets are calculated or presented? Just that one is signalling significant demand destruction and the other is saying nothing to see, move along!
Thx
TW
http://tonto.eia.doe.gov/dnav/pet/hist/wrpupus24.htm
This data table shows 19.7 mbpd as the running average for the four week period ending 2/20/09 (which matches the summary data), but 20.6 mbpd for a comparable period in 2008 (four week period ending on 2/22/08). Note that the summary shows data for a four week period ending on 2/20/08, versus 2/22/08 for the data table linked here. But other than that, it's a mystery to me as to what the difference could be, since both data tables show 19.7 for 2/20/09.
Thx WT, the graph in the link you provided tells 1000 words and the demand destruction is pretty clear looking at that. I guess the big question is whether it has run its course (at least at present prices!).
TW
There is a big problem with the weekly data being out of sync with the monthly data.
New "real" demand numbers for the month of December just came out. They show total petroleum demand of 19,199. This actual amount illustrates the problem with EIA weekly forecasts for demand. They tend to be quite a bit high, especially on the non-gasoline portion.
I had estimated that December total petroleum demand would be 19,336, when December numbers finally came out. What the four week average said was 19,936 for the four weeks ended 12/20/08 and 20,108 for the period ended 1/02/2009, both considerably higher than the actual amounts.
The error is mostly on the other than gasoline part, which EIA cannot seem to get right, primarily because of all the exports.
Regarding the two different comparison numbers you are seeing, there are two sets of year ago numbers: one the original (high estimates), and the other the lower real consumption amounts, adjusted when the actual consumption (including correct imports and exports) is known. The estimates the EIA is making now seem to be as out of sync as a year ago. When they compare current high estimates, with year ago corrected amounts (the lower number you see in some reports), they come to the conclusion that there is hardly any decline any more. When they compare today's high estimates with a year ago's high (uncorrected) estimates, they come up with a truer indication in terms of percentage change.
The weekly number historically have not translated to as high numbers in the monthly actuals, because EIA has tended to over-estimate imports and under-estimate exports. Other errors also seem to go in the same direction. I am assuming that the same pattern continues. If things have changed enough that the EIA starts getting the weekly estimates right, then you are right.
I originally was going to do a post on differences between weekly and monthly estimates, but decides that was not doable in the time available--also boring to most.
Oil in the Middle East - Wars, US policy.
Prediction - All Troops out of Middle East when the oil runs out!
No one (outside the Pentagon) has really considered the full impact on oil production of a War in the Middle East. Obama may be waking up to that fact now. First he said all troops would be out of Iraq in 3 months, then 6 months, then 12 months, then "combat troops", now it is 19 months combat troops, and leave 50,000 troops until Dec. 31, 2011. So, the main promise he made is alreay over because when he made that promise, he did not have all the facts. Looks like Bush was right this time. You can't listen to people like Sheehan saying pull the troops out now! We would all love to pull the troops out, but until we get off of oil, it is just not possible - a fact that Bush, Cheney and others were fully aware of.....however they did nothing to get us off of oil!
Russia is working closely with Iran on Nukes. Israel and Pakistan already have them.
Either Russia or the US will one day own the Middle East. Who can out last the other?
If Russia and Iran take the Middle East, then the US and Israel are toast.
My prediction: All troops will come out of the Middle East when the money runs out. This will be decades before the oil runs out... The players in the Middle East will be the nations that can walk there.
My prediction: in 5 years most US troops will be in MEXICO.
Mexico will run out of oil in 5 years, so we will not care anymore.
The millions of immigrants are already costing us more than the oil is helping us; we need troops to seal the border and keep the drug cartel wars (and the "express kidnappings", and everything else) from spilling over here.
More accurately, Mexico will probably be where the US was in 1948, zero net oil exports, but still producing oil.
At least we can just truck them there, that seems an improvement.
Self Imposed - Oil Import Restrictions
Has anyone done any research to see if we could restrict our oil imports?
This would force people to stop living off of oil in the US.
It could be planned and published with targets of 10% import reduction per year.
Then we could be at a better place in 10 years.
Under the current plan, we just wait around and watch what happens.
Great charts on US demand, thanks!
Total US oil demand shows way down in January 2008, even before higher gas prices and falling gas demand later in the year. Does that reflect economy going into recession already at that time?
Where are similar charts for total world demand? Is the world demand down like the US or are growing nations like China and India taking up the excess?
Tom
I think you are right about the big drop off reflecting the decline in the economy, even before the recession was officially announced. In particular, the housing industry was dropping off, and less oil was needed to transport building supplies across the country, or to make them in the first place.
BP puts together annual consumption numbers for countries around the world. They come out about six months after the end of the year.
Regarding oil and price, there are three basic scenarios possible right now that I can envision.
1. Demand for oil drops as fast or faster than supply keeping price relatively low or falling even further.
2. Demand for oil increases while supply continues to decline or stay flat, resulting in higher prices.
3. Potential demand for oil drops more slowly than actual supply drops resulting in higher prices.
I do not see any sort of "growth" scenario as likely in the near future. Personally, for the immediate future, scenario #1 seems the most likely. But given that we do not really know what global decline rates are and that we cannot predict interruptions to global supply (war in the Middle East anyone?), the other two scenarios are possible, just not as likely as the first one in my estimation.