US Natural Gas - May 09
Posted by Gail the Actuary on May 20, 2009 - 10:31am
Natural gas seems like it should have huge potential, but the prices remain too low to encourage additional production. In this post we will look at a few recent graphs and their implications.
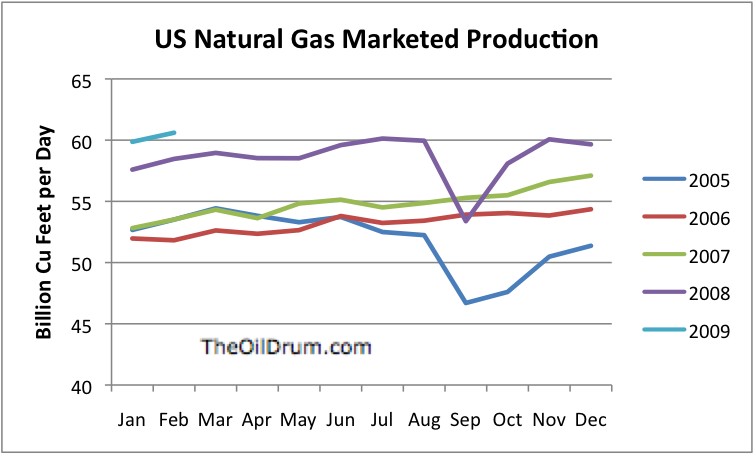
This is a graph of US natural gas production. One can see that production increased by about 8% during 2008, but there was a huge dip as the result of the September hurricanes. Production in the first part of 2009 is up a little under 4% above production in the first part of 2008. (All graphs are based on EIA data.)
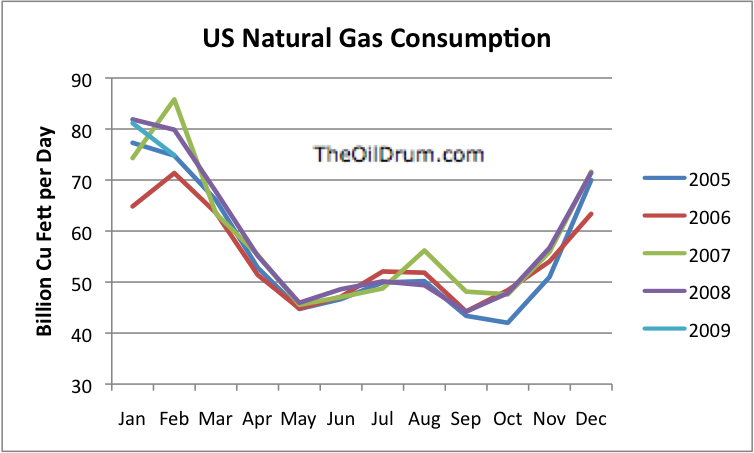
This is a graph of US natural gas consumption. One can see that consumption has been virtually flat. Consumption is closely tied to heating buildings and making electricity, and these amounts have not been changing rapidly. Industrial consumption has declined, offsetting the increases in electrical consumption.
The result of the mismatch between more production and constant consumption is prices that are too low to encourage more production.
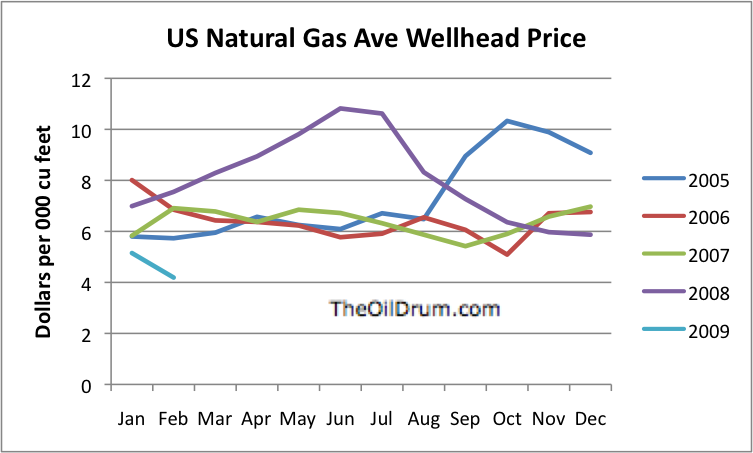
It is clear that 2009 prices have been below those of recent years. Huge reserves of natural gas from shale and other forms of tight gas indicate that there is likely to be a huge amount of natural gas available if prices would stay at a high enough level to encourage production. If prices were constantly at least as high as they were generally in the 2005 to 2008 period -- say in the $6 to $7 range, it would be help quite a bit. If prices were even a little above this--say $8 to $10, it would be even better, in encouraging shale gas and tight gas production over the long term.
The question is how to get supply and demand to match. With the current recession, it looks like there will be excess world supply of LNG, and this LNG is expected to be sold in this country at low prices as well. This is expected to make the mismatch worse, at least in the short term.
One factor offsetting the excess supply is likely to be at least a small shift from coal to natural gas for electricity production, because of the low price of natural gas, and the availability of power plants to burn the natural gas for electricity. This change is especially likely if there is any type of carbon tax or cap and trade.
Greater use of natural gas in vehicles could also help bring the balance between supply and demand into better balance. It seems like what would be needed is a few fleets of busses and other commercial vehicles in cities near where natural gas is produced. The energy equivalence of natural gas to oil is about 6 to 1, so $7 natural gas would be similar to $42 oil and $10 natural gas would be similar to $60 oil, at least for transportation purposes.
Natural gas in the US usually trades at a substantial discount (as much as 50%) to the Btu equivalent of oil, though, because of the high cost of transporting natural gas, and because it is not as highly valued as oil. For these reasons, for electricity and heating, most users would find $8 to $10 natural gas quite expensive. If prices were this high, homeowners would find it necessary to cut back on other purchases to pay their heating and electricity bills.
Getting a balance on natural gas is very tricky. Pipelines and built infrastructure are inflexible. Building only a few too many vehicles could tip the balance the other direction again. Changes in natural gas for electrical use could have an almost immediate effect, and would need to be considered in the balance.
It seems like natural gas has the potential to do more than it is now doing, if we could only figure out how to harness the capabilities of what we have. To do this, we will need to keep the price high enough and get the right amount of new end use infrastructure built.
Contact
- Content: editors at theoildrum dot com
- Tech support: support at theoildrum dot com
License

This work is licensed under a Creative Commons Attribution-Share Alike 3.0 United States License.
deleted
Hi Gail,
You have been very prolific lately and done some good stuff.
This Gas market scares me. We are on the brink of possible collapse of the Free Market system, and (by Kunstler) at the tipping point of our whole way of life. Nothing in our future will ever be the same again, no matter which way it goes.
Our not so free market is still playing the Supply and demand fantasy for selling cheap natural gas.
We all acknowledge "Peak Oil" and say that gas will follow within a decade. We have to be insane to try to adhere to our cheap natural gas pricing regime when we know that cheap prices will deplete it sooner than later.
When NG is gone we are screwed industrially. Olduvai will be a reality.
We are being given one last chance to change our natural gas consumption model. Once we actually start a recovery, the next shock will be "the Big one" when all the Free Market Capitalists have to burn their money to stay warm.
Graham
I agree that gas is key, but we have a problem that no one realizes what potential is available, if someone would work to make the natural gas market work properly. We have a huge number of natural gas producers who are putting rigs down, because at this price it makes no sense to drill.
In many ways, the natural gas market is similar to agriculture. It needs stable prices for producers to make intelligent investment decisions. But no one in governmental office has figured this out. In fact, natural gas is considered one of the "bad" carbon emitters by some, even though it is a lot better than coal (assuming one can keep leaks to a minimum).
I think a cap and trade program will tend to shift electricity production from coal to natural gas. I don't see it having much effect on wind, because capital requirements are so high, and there are few firms with the "tax appetite" for the tax credits that are theoretically available to wind and solar, but in practice have limited applicability. Also, wind needs 5% interest rates (plus tax credits) to be competitive. Such low interest rates are (sort of) available now, but it is hard to see how interest rates can be kept at the artificially low levels where they are currently, long term.
If electricity production shifts from coal to natural gas, this won't help US energy availability--it will still go down. Oil consumption will decline; natural gas will increase, but as a substitute for reduced coal production; and wind will not increase very much.
I don't see nuclear increasing much either, because of the high up front costs, the fact that electrical consumption is not now growing, and the lack of large scale government programs to finance additional nuclear production.
"I don't see nuclear increasing much either, ..." maybe not in the USA but China has 12 nuclear power reactors under construction, and at least 12 more about to start construction in 2009. Technology has been imported from France, Canada, Russia and USA. The country aims to become self-sufficient in reactor design and construction.
Russia has 7 under construction, India has 6 under construction and aims to supply 25% of electricity from nuclear power by 2050 and has a vision of becoming a world leader in nuclear technology due to its expertise in fast reactors and thorium fuel cycle. Italy plans to build new nuclear power plants by 2013, the UK will replace its existing plants and increase production by 50%...
You are right. I am talking about US nuclear. Nuclear around the world is increasing. The latest article I remember seeing talked about a total of three new US nuclear plants being likely in the nearish future. Others are being put on hold for one reason or other.
Gail, I am glad to see someone who knows how to generate a post graphs starting to look at NG. the biggest factor in pricing is not supply an or demand at a point in time, but storage. NG has n "injection" (to storage) season, roughly end March to end Oct. (28-30 weeks), and a withdrwawal season of about 22 weeks. Available storage volume has increased duting the last 7 years from about 3.2 Gb to, this year, probably 38.5 Gb. Prices get driven down in the late sunmmer if there is a real risk of storage overflow. Lower prices cause a smal amount of shut-ins and maybe some coal to gas switching, that relieves the overflow risk. Prices tend to go high in Feb. if their is a risk of overwithdrawal. There has to be about 800 Bcf minimum in storage to keep pipelines flowing to end customers. The increases in production in 2007 and 2008 resulted from a huge increase in drilling rigs and drilling starting in late 2005, (I don't have the numbers handy) but total rigs in use increased by a factor near 2 and horizontal rigs by a much larger factor from a much smaller base.
Now we have had a big drop in demand, mainly due to the economy. Drilling peaked in early Sept 2008, and you are seeing that last increase in the early 2009 production numbers. Rigs started to be taken out of production in a small way in late Sept., with a huge acceleration in Nov. and total working rogs are now down about 55% from their peak, with horizontal rigs down nearer 30%. The impact on production should begin to show up in something like 3 to 5 months, ie. now. If the economic recovery is successful and if it starts in late 2009, we will see a resurgence in demand colliding with a major drop in production. I have not tried to quantify the likely drop in production, but I wish that someone a lot more computer adept than me would do so.
LNG will compensate the early production declines, and we will have a huge storage overflow this year, regardless of what gets done. The high storage will ensure adequate supply this next winter, pretty much regardless of how cold it gets. The winter of 2010/2011 will be another story.
NG is the marginal fuel for electricity supply, so it will swing at a multiple of changes in electricity use, which is a major reason for the decline in demand.
I read last year that the minimum price that supports new production development is about $8.25 per kcf, but I don.t know how good this number is.
Tight sands and shale gas is plentiful, but for any well, initial production rates are fairly low, and declines are in the order of 50-60%/yr, so it takes a huge amount of drilling, just to run in place.
The big problem with retiring rigs temporarily is the time needed to rehire and train crews to get them running again. We are in for a really big swings in NG prices. Maybe less than $3.00/kcf by Sept. this year and > $12.00/kcf by Feb. 2011. Murray
I agree that storage is a big issue for natural gas. At least for oil, it is possible to put extra oil in unused tankers and tank farms. For natural gas, there is a very fine line between what we can use, what is too little, and what is too much.
If we had, say, twice as much storage distributed throughout the country, we would have more flexibility in production. But storage is expensive, and takes time to add. I don't think we can count on big changes in storage, without, say, a government program encouraging more storage.
Here's an up-to-date graph of the NG rig count, from Baker Hughes data:
Got parachute? Hope in a year or two those boys are ready to multi stage frac like there's no tomorrow.
I related the other day how Morgan Downey said in Oil 101 that during periods of contango in crude one of the cures for the ascending forward curve is to build more storage - facilities, that is, I'm pretty certain he doesn't mean build inventory. Have to ask Morgan about that sometime, or perhaps he'll see this and elaborate.
We will have to ask him.
It seems like additional storage for crude could be added a lot more cheaply and quickly than additional storage for natural gas. If nothing else, the minimum addition would seem to be pretty big for natural gas.
Gail -- Investment capital will always be an issue of course. But there are also a limited number of reservoirs that are suitable for storage. Most are in the Gulf Coast. Unfortunately the main bottle neck is getting from here up north.
I've been watching folks try to develop NG storage for the last 15 years with very little success. Unfortunately when NG prices are low it's a great time to develop storage since one needs to buy a big NG bank to inject initially. But when NG prices are low there's much less interest in financing storage since the upside appears to far down the road. This might be the one area where the gov't could throw some sort of tax incentive. But how popular would throwing apparent "bail out" money to the oil patch be right now? Of course, the gov't could build and operate new storage. They've done it with the SPR. But that's a pretty simple operation compared to NG storage.
The trick is what do you use for initial production and decline rates? The Canadian NEB has such data for every producing region and each region is quite different.
The Chesapeake model is hinting we will be down a bit more than 3 Bcf/d by early 2010, expanding quickly after that. Credit Suisse estimates that once we hit production bottom, it will take 2 years for increasing rig counts to claw production levels back up to our prior peak.
Figure 1: Future gas production based on final rig count drop
Source: Chesapeake Energy
-Click to Enlarge
Good article Gail!
Gail,
Thanks for an interesting piece.
Jon,
The diagram accompanying your comment is very comprehensive.
If I read it right, then assuming 750 rigs at work, US production may decline to about 56 Bcf/d by spring/summer 2011. US nat gas demand is presently showing some weakness and assuming some supplemental supplies of LNG (though the US nat gas prices presently suggests this will be the LNG market of last resort) and some time for an economic recovery to affect nat gas demand.
Further if Credit Suisse’s estimates are right about taking two years for increasing rig counts to claw back production levels, it looks like the period 2011 - 2013 might be supplied constrained.
My prior comment was poorly worded. The time is 2 years from peak to peak for a simulated shale formation with 80% decline rates (like Haynesville).
The longer it takes for prices to rise back up to drilling costs the worse the drop in production will be and the more severe the price spike later.
Canadian NEB Short Term Deliverability Report
The NEB report has an appendix which lists the decline models and initial production by region. I thought others might like to see what a model might look like.
I only saw this after my last post. It gives .020 Bcf/d/rig/yr, vs my estimated .016. Horizontal vs current mix could account for that difference. This scenario has 6 months down, 12 months flat, 3 months back up and then 3 months at the new plateau. We are now 8 months down. At $7.00/kcf to encourage drilling, (see Rockman) we are surely in for close to a year flat. then it is very unlikely that a ramp up could be done in anything near 3 months. Also a good percentage of the old vertical rigs will be scrapped and have to be replaced. Looks to me like at least 3 years to get back to Jan 2009, and maybe as much as 4. Murray
Jon, that's very interesting and helpful. I had just been doing a "back of the envelope" attempt, and came out real close to Chesapeake. It looks like from 7/06 to 1/09 we went from 53 Bcf/d to 61 Bcf/d, of which 1 Bcf/d was Independence Hub, which we shouldn't use in estimating, so let's say 60. From early 2003 to mid 2005 we went from 700+ rigs to 1100 rigs )mostly vertical) and production dropped about 3% during that period. Mid 2005 to Sept 2008 we increased to 1600 rigs (a good % of the increase were horizontal) and production went up 10%. So it looks like now we need 1100 - 1200 rigs operating just to offset declines, which is pretty consistent with the curve. At about 700 rigs, where we are now, production should be down to 54 Bcf/d by mid 2010 or 10%. Yikes! The increase in horizontal in the mix might help that somewhat. LNG isn't likely to offset more than 1/4 of that decline, and may only offset declines in exports from Canada.
From memory, global USA production decline rates were near 20%/yr in 2000 and 28%/yr by 2005 or 2006, with almost no contribution from tight sands/shale. Now tightsands/shale are a rapidly growing part of the mix of producing wells, and appear to fall off 50 to 60%/yr, so the global decline rate is probably >30%/yr and growing. So 1100 to 1200 rigs must be able to generate new production of 18 Bcf/d/yr, or .016 Bcf/day/rig/yr, just to offset declines. We are now light at least 400 rigs light so will see a decline of roughly 6 Bcf/d/yr, which is pretty close to the rough-cut 10%. During 2008 we had an average of roughly 1450 rigs operating which should have offset declines and added 5-6 Bcf/d/yr which is about what happened, so these numbers seem close enough. Some computer whiz can certainly do a more informative job, but this isn't bad. Thanks muchly.
I think the Horizontal wells may be overweighted i.e when they do decline it will be both steeper and to a much lower end production rate.
Also ROCKMAN has mentioned this a few times here and there but I really question if people are going to put in compressors as pressure falls off. My opinion is that any production needing a compressor is more likely to get temporarily shut in.
So I think production is going to be fairly non linear. Lets see where we are in six months since if these secondary issues are both real and large then they should start to show up within six months of now give what your saying about the number of rigs being dropped.
Next if the oil prices continue to increase strongly there is still significant dual fuel use with NG and fuel oil. This will flip to NG. And also as I've posted before we seem to also have a tight relationship between heavy sour crude refining and additional NG usage in refineries. If the US begins to favor the cheaper heavier sour crude esp with the relatively low NG price then this is another source of increasing NG demand.
I'm going stick my neck out and call a bottom for NG near the current price we may bump around it for another month but I think the bottom is in.
Next I'm going to even stick my neck out further and call for NG to move to the 7-8 dollar range within the next six months maybe hitting 10 or higher if some of my ideas are on the mark.
However I don't think this is going to bring the rigs back. I don't think that the rig count will actually turn around until after we see NG break at least 10 and then only slowly.
So maybe a month bouncing around near the bottom then fairly smooth increase toward eight over the remaining 4-5 months.
I'd not be surprised in the least to see rig counts continue to drop even as we pass eight.
memmel -- adding compression to the wells probably won't be much of a problem except for operators near bankruptcy. Granted, as you say, production has drop to rather low levels at this point. But even if adding compression only offers a very modest return there is another big benefit: you keep the lease active. Most oil/NG leases terminate automatically if a well is shut-in for more then 30 days. If that happens not only does the operator lose the mineral rights but is also obligated to spend $'s to P&A the well. The operational costs come out of cash flow so that's usually not an issue. Buying or leasing the compressor is the bigger hurdle. But if the compression companies have units just sitting in the yard they'll often let the operator pay for it out of cash flow. of course this all assumes there is a net gain of income by going to compression. NG pricing will pretty much control that call.
I agree with you: it's difficult to see rig rates improve significantly even if NG comes back up to $7 or $8/mcf. The NG players are hurting from a cash flow perspective. Add that to being badly burned by the rapid expansion of drilling followed by an even more rapid collapse. The mindset I hear around the coffee pot these days is that they won't be so fast to jump back into water.
Memmel, the problem in the next few months is storage. We will have enough supply to put at least 4.3 Tcf into storage by the end of the injection season, but only have storage capacity for 3.85 Tcf at the most optimistic. Prices will tend to drop to increase demand, and the only real temporary demand increase is coal substitution, which will require a price at or below $3.00/kcf. Some wells may be shut in, but that seems to be a choice of last resort. Rockman can provide enlightenment on that subject.
At 3.85 Tcf in storage, and line pack at max., we will have plenty of NG to get through the next withdrawal season, with high enough storage that, at even 2007 production rates, we would get to fairly adequate storage by Oct 2010, so for some months there will be little pressure on price. However, by maybe late June 2010 it will start to become evident that supply is declining, and adequate storage refill is doubtful. At that point the bidding war for the available supply will start. In Sept. 2010 there is likely to be something close to panic as storage goals get unmeetable. I would guess that there will be delivery failures due to low supply by late Feb. 2011.
Price should stay between $3.00 and $7.00 until about 6/10, and then start to rise. Sept. could see anything from $10.-20. The last time we came close to supply failure, (Q1 2003), prices went to $18.00 interday, and $28.00 for a brief spike intraday.
My "back of the envelope" conclusion is that for the year from end March 2010 to end March 2011, supply will be between 1 and 2 Tcf below demand. One Tcf would bring Q1 2011 storage to a dangerously low level, and 2 Tcf would wipe out storage altogether. Of course, that can't be allowed to happen, so price will go high enough to decrease demand and increase supply, which can lead to an extreme short term spike.
I think Rockman is right about the reluctance to get back into drilling in a big way until it looks like high prices are here to stay, which means fairly delayed return to Sept 2008 capacity. From 2005 to Q3 2008, rig count grew by near 200 rigs per year. I think the highest 12 month period was about 240 rigs. Even at 200 rigs per quarter from Q3 2010 on, my scenarion would likely develop. Murray
Please excuse all the typos. I was going to fast. This years storage should be 3.85 Gb. Murray
Glad you caught that typo Murry. I was about to chew on you a bit. I'll offer a few answers. The storage cycle certainly does impact pricing. There are occasional years when NG prices will actually be higher in the summer. Combination of factors; previous winter low demand, El Nino reverse and running air conditioning (electrical) bills up and relatively low storage volume as buyer hold off acquisition while waiting for prices to subside.
Yes…drastic drop in rig count. Last Feb/March we went from 18 to 4 rigs in our shale gas plays. My initial expectation was a rapid decline in NG rates as a result. But then I did a little “back-of-the-napkin” modeling and concluded we weren’t going to fall off of a cliff anytime soon. True, the rapid drilling escalation put a lot of wells into the system quickly. And we all know how rapid the initial decline rates are. It was just the steady increase in rig count that kept the volume climbing. But the early wells drilled have now entered a much slower decline rate period. Granted the per well volumes are much lower but there are also a great many of them out there. These older wells established something of a downward sloping plateau. We’ve certainly seen the last of record breaking y-o-y rate increases for quit a while.
I would also tread a little lighter about storage easily handling a very cold winter next season. For one, the delivery system from the storage sites does have a max capability that can be overwhelmed for a period of time when usage surges. Doesn’t matter how much NG there is in storage if it can’t make it thru the city meter faster the consumption. Second, supply may not be as big as issue as price. A long early cold snap with a following prolonged very cold winter can run the prices up quickly even when storage is high. Goes a long way towards killing competition-based pricing.
LNG imports might help a little. Lots of stories about new liquefaction facilities coming on line around the globe. But regardless of its availability I’m not sure how much we can import at a max. Gasification plants are complex and expensive. Additionally, efforts to build ne plants here have been routinely rejected by many local forces. What I haven’t been able to quantify myself is how little import capability we actually have. Others have indicated that current infrastructure might not allow much more then 5% or so of our peak demand volumes. A little help but not enough to swing prices (at least in the short term) or meet excessive consumption.
NG prices that would justify new drilling efforts? Sort of a moving target these days. Based on what it was costing use to drill and complete 3rdQ 08, a $3.50/mcf killed those efforts. But now costs have come way down due to so many rigs being stacked. Pipe and frac’ing cost are now dropping fast. Just a guess but I would say a price of $5/mcf could work for some of the better prospects this summer. Of course, if there a sudden big demand for rigs and equipment (very unlikely IMO) the cost goes up as does the require price for NG. I think $8.25/mcf might be a little high as a requirement to see a lot of new drilling. Maybe closer to $7/mcf. But, like I said, that number will float. One big factor that could hold back a drilling surge is operator fear of LNG imports. Even though the potential volume might be small, concerns over imports is a common discussion these days.
Perhaps the biggest long term factor I’ve just started seeing is a reallocation of budgets from “long term” projects to “short term” projects. Long term essentially refers to Deep Water both domestically and overseas. A DW GOM NG project discovered this year might not start generating cash flow for 5 to 7 years. After the beating companies just took they are hesitant to spend money on projects with such long lead times regardless of how profitable they might be. This won’t show up in the production numbers for the next 5 years. The reallocation to short term projects might even give a boost to rates… especially NG. But many of the big NG projects some were forecasting to come online in the next 5 to 10 years won’t happen. DW GOM NG is currently delivering a huge chunk of our current consumption. But just like the DW GOM oil fields these NG reserves decline very quickly. A field might come on this year at 300 million mcf/day but in 5 0r 6 years it may decline to 15% of that initial flow rate. Thus just as many of our current big NG fields are reaching terminal decline rate the new fields (which were once projected but not now) are not there to replace them. The worst impact of the big drop in commodity prices might not be felt for 5 to 8 years.
lng imports are detailed here:
http://tonto.eia.doe.gov/dnav/ng/ng_move_impc_s1_m.htm
exxon announced a 1 bcfd lng train(qatar) scheduled to start up later this yr. this train is designated for us delivery. whether the import capcity is there ?
I think we are back to 31 Bcf/m in April, or about 370 Bcf.yr. Our last peak was near 800 Bcf/yr, and some capacity has been added since then, so I would guess at least 1 Tcf/yr or or near 3 Bcf/d.
Good input. Thanks muchly.
The last time we had a really cold winter, total withdrawals were near 2.5 Tcf, leaving only 0.8Tcf in storage, and we were days away from no deliveries in New England. We will probably finish this season with 3.85 Tcf in storage, and line pack at a max. Given the economic conditions, it is hard to imagine a withdrawal of eevn 2.7 Tcf, so we should have a minimum of 1.1 Tcf left in storage, and are a lot more likely to be above 1.3 Tcf. Of course, if the new storage is in the wrong place, I could be dead wrong, and I have no data on that issue. Murray
The prospects for natural gas displacing coal in dispatch are overstated generally (although you cast this as a 'small shift' in your post). The contraction of steel manufacture has pushed back met coal prices, knocking down steam coal in the process.
At today's prices for nat gas and eastern bituminous coal, coal plants beat gas plants by around $5/MWh, so merit order still goes to coal plants. In the West the delta is bigger because western subbituminous coal is quite a bit cheaper, even factoring in transportation costs.
The CO2 delta between coal and gas CCs is 0.65 tons/MWh, so dispatch parity between gas and coal occurs at a CO2 price around $7.70/ton, a definite possibility under today's proposals, although implementation is a couple of years out.
I noticed from the charts you posted that consumption is quite a bit higher than marketed production. A good part of this difference I presume is imports from Canada. I think that is what the market will hinge on: higher oil prices bring Alberta oil sands production back, soaking up nat gas from Canada which will need to be replaced by our surplus shale gas and/or LNG.
On the demand side, electric load growth (i.e., as opposed to gas/coal fuel switching) should boost gas demand, but it might not be until after 2010.
With respect to coal/gas substitution, I am surprised that with the relatively high price of Eastern coal, coal plants beat gas plants by about $5 MWh. I presume you are considering $4 mcf natural gas prices. How do you see the prices of the two comparing--could you give more detail?
You are right though, I was thinking more about a shift over the long term, as cap and trade become effective.
I did not include imports from Canada, and this is the major difference between production and consumption. Canadian imports are another big variable. One of the issues as you point out is how much is used for oil sands production. Imports from Canada are recently down, and have helped keep supply from overflowing, as US production increased.
Hi Gail --
Here's the 'back of the envelope' math on coal plant dispatch costs, using NYMEX Central App specs:
$50/ton * ton/24 mmBtu ~ $2.10/mmBtu (FOB mine, i.e., no transport costs)
For a heat rate of 10 mmBtu/MWh, our dispatch price is $21/MWh.
For a nat gas CC, we have:
$3.75/mmBtu * 7.2 mmBtu/MWh = $27/MWh. That's a spread of $6/MWh, but go ahead and give the CC a $1/MWh edge for SOx and NOx costs. Non-fuel variable O&M are about the same for coal v. gas.
In using the FOB coal and Henry Hub gas, I'm ignoring transportation costs on both sides. This will favor coal selling to Ohio, PA, and points Northeast, and favor gas going into the Southeast. But you get the idea: in the absence of an external price driver, coal producers have no trouble discounting to blunt the threat of fuel switching to natural gas. Bituminous markets are tighter, so this may not remain true for long, at least in the East.
I was thinking that we have so much natural gas built infrastructure that is being very lightly used that one could in some cases almost ignore the O & M cost. The plant will be used for a small amount of peaking anyhow. In such cases, adding more production really only adds gas costs. Thus, some gas production could be added for the price of the gas alone.
By the way, when I looked at wind costs before subsidies from this booklet from the European Wind Energy Association, I came up with the following tentative table of costs (after converting from Euros to $).
After looking at this, it seemed hard for me to believe that one could put enough tax on coal to ever make wind competitive with coal and natural gas, especially if interest costs rise and the true lifetime of wind turbines is only about 20 years. Am I way off base on this? These numbers do not include taxes, profits, or risk margin. It looked to me as though with no interest costs or profit or taxes, (that is, at 5.2 cents per kWh), costs were already at or above coal costs.
I think you're right on with the wind numbers. Subsidy forever. However, solar thermal is a different story, esp. in high-insol areas. Moving the units from Arizona to Iowa only requires increasing the (relatively cheap) reflector surfaces by 8.2 / 5.25 = an added 56%, changing the energy costs from 3.5 to 6.2 ¢/kWh by (1 + .5 x .56 = 1.28) to perhaps 4.48 to 7.94 ¢/kWh . BTW, disclaimer. I have NO financial interest in any solar project or system.
http://www.nrel.gov/csp/pdfs/34440.pdf Assessment of Parabolic Trough and Power Tower Solar Technology - Cost and Performance Forecasts - Sargent & Lundy LLC Engineering Group Chicago, Illinois
[QUOTE]For the more technically aggressive low-cost case, S&L found the National Laboratories’ “SunLab” methodology and analysis to be credible. The projections by SunLab, developed in conjunction with industry, are considered by S&L to represent a “best-case analysis” in which the technology is optimized and a high deployment rate is achieved. The two sets of estimates, by SunLab and S&L, provide a band within which the costs can be expected to fall. The figure and table below highlight these results, with initial electricity costs in the range of 10 to 12.6 ¢/kWh and eventually achieving costs in the range of 3.5 to 6.2 ¢/kWh. The specific values will depend on total capacity of various technologies deployed and the extent of R&D program success. In the technically aggressive cases for troughs / towers, the S&L analysis found that cost reductions were due to volume production (26%/28%), plant scale-up (20%/48%), and technological advance 54%/24%).[/QUOTE]
Given Sargent & Lundy Engineering's worst case scenario provides peak time solar electricity at $0.062/kwh by only building 2.8 GW and doing a few minor and definitely achievable R&D improvements, plus transmission, and a clear path is provided to offering 83% capacity factor using cheap sand and gravel tanks for thermal storage with 3x collector area and no additional central plant, which should make the installation no more expensive PER KWH if only the industry can get to 2.8 GW installed, I don;t see what we are waiting for.
It also appears to me that the more agressive forecasts of NREL / SunLab of $0.035 / kwh if we can get to 8.2 GW installed quite quickly is entirely within reach.
I think wind turbines cost nearer $.60/w than $1.60/W. I know they did in 2005. Of course commodity prices drove that a way up in mid 2008, but it's back down again now. At $.60 your worst case becomes 5.6 cents/kwh, pretty competitive. Also capacity factors in class 4 or better wind areas are mor like 33%, which gets us down below 5 cents/kwh. You may be wat too pessimistic under present economic conditions. Murray
The wind turbine cost actually includes a lot of other stuff that goes with getting the turbine in place and up, like the transmission wires connecting to local electric transmission lines, consultant costs, and concrete pad. I have numbers from a number of different sources, and they seem to cluster in this area. This fact sheet from the University of Michigan gives the average 2007 cost as $1,710 per kW. This is a FERC graph, showing their estimates:
The difference between wind and the most of the other energy sources is that the percentage of capacity used is quite a bit less, and also that their life expectancy is quite low (it seems to me, anyhow). I can imagine a 50 year old coal power plant, but not a 50 year old wind turbine.
Regarding the percentage of capacity that is actually used, there seems to be a difference between the rated capacity and the real life production of wind as a percentage of capacity. It is hard to find any countrywide comparisons of historical production relative to capacity (US or Europe) that come out over 25%. In the US, the numbers are in the 21% to 27% range, varying by year, averaging about 24% or 25%.
Offshore may produce at a higher percentage of capacity, but its cost per kW is a lot higher. I keep hearing that new wind turbines will do better, but the question is how much better they will do in real life. The numbers I have seen in some studies are "model numbers" or "pro forma" numbers, based on estimated wind conditions. Somehow, on a pro forma basis, everything looks good.
Longevity.
I can imagine a 50 or more year life for base and tower, transmission line and access roads for onshore versions. I have seen a study of actual turbines made from re-cycled steel and using high proportion 'renewable' electricity, where the embodied energy was very much lower for the 'recycled steel' version than for the same one constructed 'de nova' on fossil fuel driven inputs. Embodied energy (albeit low compared with lifetime 'free' energy recovered) must represent a significant proportion of the cost of the moving parts. 'De nova' construction using entirely fossil fuel faces rising costs as years go on, we presume, whether it is wind or any other type of power plant.
For longevity of offshore turbines I suppose we have data of existing oil-rig and platform to go on for timespan for the base. Replaceable moving parts, presumably needing renewal more often, should be fraction of original construction costs of total system?
(Solar glass trough collectors life in one estimate - see Dave Rutledge lecture - seems in excess of 100 years. I guess the associated steam turbines longevity must be similar to gas turbines? Come to think of it, steam turbines associated with coal burning must need replacing at even faster rates than wind turbine?)
Your combined numbers look about right. Your $/kW at the top looks like maybe it should be $/MW?
But you are right in general that wind can't shut down existing coal on an economic basis, unless you throw in a whopping carbon tax.
To be a little fair, though, that's comparing the fully loaded cost of wind with the marginal cost of coal (referring back to our discussion upthread). The installed cost of new coal might be $2800/kW, or around $.065/kWh amortized. Add the $.021 for fuel costs, and wind with a fully applied PTC can be competitive. Between wind economics and gas CC economics, a $10/ton carbon tax would keep new coal out, but leave old coal in place.
You are right about $/kW should be $/MW. I multiplied numbers given per $ /kW by 1000, and should have changed the units.
As you say, new coal might be$.065 amortized; old coal is probably less.
The problem with the Production Tax Credit, as I understand it, is that many who might have used the PTC are not in a taxable position, because their financial results are poor. If it is actually a utility getting the PTC, it might be able to use it, but most banks and other financial companies have no use for them at this time, because of all of their losses.
I think a surge in gas demand is inevitable within a few years due to
- carbon caps or fear of their introduction
- CNG as an alternative transport fuel
- ease of balancing wind and solar.
Meanwhile world population increases taking with it demand for ammonia derived fertiliser. Severe cold snaps will ensure plenty of gas must be kept in storage.
The swing to CNG fuel for cars and trucks may happen around 2012-2015 if oil goes up again. Already countries like Iran and Argentina (I think) require most new cars to be NGVs. The Anglosphere will probably follow that lead if PHEVs disappoint or are too expensive.
Using gas fired combined cycle electricity to back up wind power saves quite a lot of CO2 compared to coal. For example 3 Mwh of bituminous coal fired electricity will produce about 3 tonnes of CO2. Alternatively that 3 Mwh could be produced as 1 Mwh wind with no CO2 and 2 Mwh combined cycle with ~1 tonne of CO2. That's 3 tonnes for coal versus 1 tonne for wind with gas backup.
It will only take $150 oil or cap and trade for gas to make a huge revival.
to archive energy independence we should drill more in Canada and use CNG as a transportation fuel.
Congratulations you got a job. Get in the back of the van we are going to Siberia to build a gas pipeline.
We need another Alcan highway.
Hello Gail,
Thxs for this keypost. I don't have the expertise to determine what the appropriate falling pricepoint should be, but I would like to see all countries build Multi-year Strategic Reserves of I-NPK as a way to help keep the bottom from falling out on Natgas Prices plus to help keep the rigcount from plummeting too low. IMO, this would help to smooth market volatility and add societal resilience in the long run for when we need to ramp O-NPK recycling worldwide.
As Borlaug said: Without I-NPK-->Game Over!
Natural Gas prices look to have bottomed in late April around $3.3 and are now rebounding:
http://stockcharts.com/h-sc/ui?s=%24NATGAS
The faster moving average (blue) has just turned up and should head back toward the slower (red) MA line possibly crossing around $4.5-$5 in a couple of months.
I wouldn't expect to see sub $4 prices for long now...
But hey, its only tea leaves not the bigger picture... :o)
Nick.
Not alone in calling the bottom I see :)
Lets see where oil prices go and see how the coupling between NG and oil work out.
Remember we had strongly increasing prices in the past even as NG production was increasing so people may be a bit surprised at what happens.
Longer term whats important is how the NG industry responds as prices start crossing break even points If its weak like I suspect I think we can also expect the oil industry to behave the same way with a slow response to price increases this time around.
The whole market is real jittery at the moment, I would be surpirsed to see a sell-off anytime now. Longer term of course we run into the issues that will come about because of a 50% rig-count decrease so in the short term its a battle between those that see a huge rise 'down the road' and are getting in early and those that cannot see any justification for the current price...
"Sell in May and go away"?
Nick.
the bigger picture, production data, is about 2.5 months old. implicit production data, the weekly storage report, is about a week old. the market is saying that $ 3.30/mmbtu is/was too low. beyond that, ?
From today's, May 21st, Drumbeat:
Robert Bryce - There Will Be Many Barnetts: A Q&A with Roberto Aguilera
I mean that by using creativity the industry is finding keys to unlock the North American unconventional natural gas endowment which is, simply put, gigantic. The first shale well was drilled in 1821 in Chautauqua County, New York, and probably produced gas for local uses through natural fractures. It is significant that the very first shale well already introduces the key element of natural fractures, created by Mother Nature, for successful production of natural gas. The Big Sandy gas field is eastern Kentucky, which started production from Devonian shales in 1921 is a classic example of a naturally fractured reservoir. In my opinion, the same key elements hold true today and are partially responsible for the revolution in gas production. The addition of hydraulic fractures to these already naturally micro-fractured reservoirs leads to the monsters we are pursuing today with horizontal wells that will dominate the North American energy landscape for decades to come. John A. Masters of Canadian Hunter indicated in the foreword of our book “Horizontal wells, Formation Evaluation, Drilling and Production” (1991) that the well design should be approached from the point of view that drilling the target formation is a completion operation as there are many subtleties that can be addressed easily in the preplanning stages that may be virtually impossible to correct once the well is drilled. This drilling-completion vision by a new breed of geologists and engineers working as a team with a common goal in mind has been pursued by many in North America with outstanding results.
This is a link to new Simmons & Co national gas report called U.S. Gas Directed Drilling Activity: 2H’09 Drilling Activity Trough Yields 2010 Recovery. It is not a Matt Simmons report--instead by the staff.
I haven't had a chance to read it yet, but my impression is that the 2010 recovery is price recovery.
Gail,
Aguilera talks about 45,000 TCF in the US! If we use 27 TCF per year, that's a 1,000 year supply! Or, or did I miss my decimal point a few places?
i think aquilera was refering to worldwide potential.
The 45,000 TCF seems to be a world number, so it is perhaps a 300-350 year supply, assuming it is just used to replace world natural gas. If it is used to replace oil as well, or oil and coal, we could burn through it much more quickly.
Quite a bit of it may not be very close to markets. We know that there is a huge amount of natural gas in Alaska that would cost at least $2 per mcf to transport to the 48 states. Unless the price is high enough, it is hard to justify the extra transportation charge.
I think the major obstacles are (1) price - needs to be higher (2) focus on carbon emissions (3) people unaware of the available gas (4) built infrastructure uses oil, rather than NG. (5) problem of matching supply and demand--gas difficult to store
Thanks for the heads up! Maybe I can look into it some more and write a post on it.
Well, the world uses about 400 quadrillion btus per year, or 400 TCF, so wouldn't that be a 110 year supply even if the whole world used nothing but gas?
Here is a presentation by Roberto explaining the technique used. It is based on extrapolating USGS estimates for NG world wide. The USGS estimate for conventional is listed at just over 10,000 Tcf world wide (minus US) and about 11.5 Tcf with US. (I am just inferring from the graphs he posts).
http://www.speca.ca/PDF/SPE_Present_Calgary_March25_09.pdf
Laherrere puts world conventional gas at about 10,000 Tcf. So those numbers are not so different. He graphs 12,000 Tcf and that puts peak production around 2025.
http://aspofrance.viabloga.com/files/JL_Nice08_long.pdf
These are discovery numbers. A lot of gas has already been produced. The US already passed peak in the 70's.
But what about the unconventional, which appears to be twice as large?
no one know how much gas can be recovered from unconventional. the slow down in drilling may give operators a chance to actually evaluate the economics of shale gas wells with more than a few months of diving production and a sack full of ............... er.......eh........ assumptions.
gypsy moths decline profile:
http://en.wikipedia.org/wiki/Gypsy_moth
bert lancaster though he could fly with a cape.
aguilera makes a valid point(assuming some shale gas wells are economic) that there is an abundance of source rocks. that just demonstrates how far this ff addiction has taken the junkies - drilling the source rock.