| The 2012 Oil Crunch vs. Cash for Clunkers | The Oil Drum | Campfire and Human Capital - What Do You Want to Learn? |
Energy Journal Roundup: June 2009
Posted by David Murphy on June 17, 2009 - 8:38am
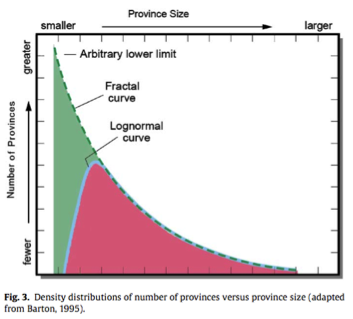
Aguilera, R.F., 2009, Oil Supply in Central and South America, Energy Policy, Vol. 37, is. 8, pp. 2916-2925
This paper estimates a cumulative supply curve for conventional oil in the Central and South American (CSA) region. The curve includes volumes from provinces not previously assessed by other organizations, as well as reserve growth. Volumes for the previously unassessed provinces are estimated using a variable shape distribution (VSD) model. Then the volumes are allocated to CSA countries based on each country's share of proved reserves. Figures provided by the cumulative supply curve are stock variables for all time, unlike the traditional supply curve where they are flow variables that can continue from one period to the next. In this study, the fixed stock approach is used since it provides practical information with respect to the concerns that some have expressed about oil scarcity in the near future. Results indicate that Central and South American oil is more abundant than often assumed, and can be produced at costs below current market oil prices, and substantially below mid-2008 prices.
Fischer, C., Hernnstadt, E., Morgenstern, R., 2009, Understanding errors in EIA projections of energy demand, Resource and Energy Economics, Vol. 31, no. 3, pp. 198 - 209
This paper investigates the potential for systematic errors in the Energy Information Administration's (EIA) widely used Annual Energy Outlook, focusing on the near- to mid-term projections of energy demand. Based on analysis of the EIA's 22-year projection record, we find a fairly modest but persistent tendency to underestimate total energy demand by an average of 2 percent per year after controlling for projection errors in gross domestic product, oil prices, and heating/cooling degree days. For 14 individual fuels/consuming sectors routinely reported by the EIA, we observe a great deal of directional consistency in the errors over time, ranging up to 7 percent per year. Electric utility renewables, electric utility natural gas, transportation distillate, and residential electricity show significant biases on average. Projections for certain other sectors have significant unexplained errors for selected time horizons. Such independent evaluation can be useful for validating analytic efforts and for prioritizing future model revisions.
Campbell, J.E., Lobell, D.B., Field, C.B., May 2009, Greater Transportation Energy and GHG Offsets from Bioelectricity Than Ethanol, Science, Vol. 324, no. 5930, pp. 1055 – 1057.
The quantity of land available to grow biofuel crops without affecting food prices or greenhouse gas (GHG) emissions from land conversion is limited. Therefore, bioenergy should maximize land-use efficiency when addressing transportation and climate change goals. Biomass could power either internal combustion or electric vehicles, but the relative land-use efficiency of these two energy pathways is not well quantified. Here, we show that bioelectricity outperforms ethanol across a range of feedstocks, conversion technologies, and vehicle classes. Bioelectricity produces an average of 81% more transportation kilometers and 108% more emissions offsets per unit area of cropland than does cellulosic ethanol. These results suggest that alternative bioenergy pathways have large differences in how efficiently they use the available land to achieve transportation and climate goals.
Baxter, J. et al., 2009, Nanoscale design to enable the revolution in renewable energy, Energy and Environmental Science, Vol. 2, pp. 559 – 588.
The creation of a sustainable energy generation, storage, and distribution infrastructure represents a global grand challenge that requires massive transnational investments in the research and development of energy technologies that will provide the amount of energy needed on a sufficient scale and timeframe with minimal impact on the environment and have limited economic and societal disruption during implementation. In this opinion paper, we focus on an important set of solar, thermal, and electrochemical energy conversion, storage, and conservation technologies specifically related to recent and prospective advances in nanoscale science and technology that offer high potential in addressing the energy challenge. We approach this task from a two-fold perspective: analyzing the fundamental physicochemical principles and engineering aspects of these energy technologies and identifying unique opportunities enabled by nanoscale design of materials, processes, and systems in order to improve performance and reduce costs. Our principal goal is to establish a roadmap for research and development activities in nanoscale science and technology that would significantly advance and accelerate the implementation of renewable energy technologies. In all cases we make specific recommendations for research needs in the near-term (2–5 years), mid-term (5–10 years) and long-term (>10 years), as well as projecting a timeline for maturation of each technological solution. We also identify a number of priority themes in basic energy science that cut across the entire spectrum of energy conversion, storage, and conservation technologies. We anticipate that the conclusions and recommendations herein will be of use not only to the technical community, but also to policy makers and the broader public, occasionally with an admitted emphasis on the US perspective.
Ridolfi, R., Scubba, E., Tiezzi, E., 2009, A multi-criteria assessment of six energy conversion processes for H2 production, International Journal of Hydrogen Energy, Vol. 34, no. 12, pp. 5080 – 5090.
The study of Very Large Complex systems (“VLCS”), of which modern energy conversion systems are an important subset, requires a holistic approach to analyze the system itself and all of its “external” and “internal” interactions. The view taken in this paper is that the VLCS should be considered as an “extended” (in a sense specified below) thermodynamic system. The evaluation of the flows of matter and energy sustaining a VLCS and the knowledge of the transformations therein can be used to describe the rate of exploitation of the available natural resources, to assess the efficiency of the conversion process, and to provide a quantitative estimate of the impact of the system on the environment. This kind of information is an important part of the essential database of any Decision Support System for both the internal and global policy planning and for resources management. Several assessment methods are in use at present, and each one of them provides a different insight in the “performance” of the conversion chain under examination.
This paper presents the results of a multi-criteria comparative analysis of both conventional and innovative hydrogen production processes in which H2 is generated from different feedstocks: methane, residual oil and biomass (wood chips).
A multi-criteria comparison of different H2 production processes based on exergy, emergy and economic analysis represents a viable approach to the assessment of a VLCS. The exergy analysis provides important information (and insight) on the efficiency of the process, the emergy assessment focuses its attention on the type of resources used (notice that plant costs do not affect much the EmA results). This suggests that EmA may be the proper tool to assess the degree of sustainability of possible future productive processes. The economic analysis, in a more conventional way, measures how feasible these processes really are.
Newsham, G.R., Mancini, S., Birt, B.J., 2009, Do LEED-certified buildings save energy? Yes, but…, Energy and Buildings, Vol. 41, no. 8, pp. 897-905.
We conducted a re-analysis of data supplied by the New Buildings Institute and the US Green Buildings Council on measured energy use data from 100 LEED-certified commercial and institutional buildings. These data were compared to the energy use of the general US commercial building stock. We also examined energy use by LEED certification level, and by energy-related credits achieved in the certification process. On average, LEED buildings used 18–39% less energy per floor area than their conventional counterparts. However, 28–35% of LEED buildings used more energy than their conventional counterparts. Further, the measured energy performance of LEED buildings had little correlation with certification level of the building, or the number of energy credits achieved by the building at design time. Therefore, at a societal level, green buildings can contribute substantial energy savings, but further work needs to be done to define green building rating schemes to ensure more consistent success at the individual building level. Note, these findings should be considered as preliminary, and the analyses should be repeated when longer data histories from a larger sample of green buildings are available.
Service, R. F., June 2009, Hydrogen Cars: Fad or the Future?, Science, Vol. 324, no. 5932, pp. 1257-1259
Last month, Energy Secretary Steven Chu announced that the Department of Energy (DOE) was putting the brakes on research into automotive hydrogen fuel cells because it would take decades to convert to a hydrogen-car economy. But many scientists and energy experts believe Chu made the wrong call. No alternative-vehicle technology will make a major impact on carbon emissions, petroleum use, or anything else within the next 20 years, they say, because it takes longer than that for a new technology to displace what is already on the road. In the long run, they say only two technologies—hydrogen fuel cells and electric vehicles—are capable of getting the job done, and only one variation, plug-in hybrids, will be on the market anytime soon. But the uncertainties with both technologies make it shortsighted to abandon one.
Czech, B., 2009, The neoclassical production function as a relic of anti-George politics: Implications for ecological economics, Ecological Economics, Vol. 68, is. 8-9, pp. 2193-2197
Widespread support for Henry George's land tax proposal prompted a backlash from wealthy landowners, who focused their political efforts on tax policy. The backlash corresponded chronologically with the development of neoclassical economics, and land barons became active in the establishment of academic economics institutions in the United States. Whereas the classical economists frequently referred to the factors of production as land, labor, and capital, neoclassical textbooks appearing in the 20th century increasingly ignored land and provided a production function, “Y = f(K,L),” in which capital and labor were the only factors explicitly identified. Neoclassical authors had several possible reasons for using a two-factor production function, but the political influence on neoclassical economics during its formative stages was conducive to avoiding reference to land when discussing factors of production. An emphasis on land would have invited scrutiny of land rents for tax purposes. Ecological economics has evolved as a response to the shortcomings of neoclassical economics in dealing with the environmental perils of economic growth. One of those shortcomings is the capital/labor production function which hides the importance of land and natural resources. Ecological economists have developed production functions that are more ecologically oriented, and one of them is explained herein.
Michael Sivak, and Omer Tsimhoni, 2009, Fuel efficiency of vehicles on US roads: 1923–2006, Energy Policy, Vol. 37, is. 8, pp. 3168-3170
This article documents and analyzes the changes in fuel efficiency of vehicles on US roads between 1923 and 2006. Information about distances driven and fuel consumed was used to calculate the on-the-road fuel efficiency of the overall fleet and of different classes of vehicles. The overall fleet fuel efficiency decreased from 14 mpg in 1923 to 11.9 mpg in 1973. Starting in 1974, efficiency increased rapidly to 16.9 mpg in 1991. Thereafter, improvements have been small, with efficiency reaching 17.2 mpg in 2006. The information for 2006 was used to calculate the fuel-efficiency improvements in different classes of vehicles that would be needed to achieve a given percentage reduction in the total amount of fuel consumed by all vehicles.
Farid Guliyev, and Nozima Akhrarkhodjaeva, 2009, The Trans-Caspian energy route: Cronyism, competition and cooperation in Kazakh oil export, Energy Policy, Vol. 37, is. 8, pp. 3171-3182
The article delineates the major national, regional and international level stakeholders in the westward Trans-Caspian transportation of Kazakh oil, supplemented with a discussion of the prospect of expansion of the Trans-Caspian/South Caucasus corridor in light of the presumably harmful effect of the war between Russia and Georgia in August 2008. It demonstrates that while foreign companies have been backed by their respective governments, national firms have also enjoyed considerable state support, partly due to their close links to the interests of state elites in Kazakhstan and Azerbaijan. It appears that most companies along the shipping line either belong to the governments of Kazakhstan or Azerbaijan, directly or indirectly (through subsidiaries), or enjoy favoritism and a near monopoly in their markets (crony capitalism). Some of these firms are privately owned but registered in offshore tax havens, while some others have rather obscure ownership structures and corporate profiles. It suggests that cronyism and state capture comprise that politico-economic environment within which the future of Caspian transport systems will have to be decided.
Xiaodong Du, and Dermot J. Hayes, 2009, The impact of ethanol production on US and regional gasoline markets, Energy Policy, Vol. 37, is. 8, pp. 3227-3234
This study quantifies the impact of increasing ethanol production on wholesale/retail gasoline prices employing pooled regional time-series data from January 1995 to March 2008. We find that the growth in ethanol production kept wholesale gasoline prices $0.14/gallon lower than would otherwise have been the case. The negative impact of ethanol on retail gasoline prices is found to vary considerably across regions. The Midwest region has the biggest impact at $0.28/gallon, while the Rocky Mountain region had the smallest impact at $0.07/gallon. The results also indicate that the ethanol-induced reduction in gasoline prices comes at the expense of refiners’ profits. We find a net welfare loss of $0.5 billion from the ethanol support policies in multiple markets.
Robert K. Kaufmann, and Ben Ullman, 2009, Oil prices, speculation, and fundamentals: Interpreting causal relations among spot and futures prices, Energy Economics, Vol. 31, is. 4, pp. 550-558
A consensus that the world oil market is unified begs the question, where do innovations in oil prices enter the market? Here we investigate where changes in the price of crude oil originate and how they spread by examining causal relationships among prices for crude oils from North America, Europe, Africa, and the Middle East on both spot and futures markets. Results indicate that innovations first appear in spot prices for Dubai–Fateh and spread to other spot and futures prices while other innovations first appear in the far month contract for West Texas Intermediate and spread to other exchanges and contracts. Links between spot and futures markets are relatively weak and this may have allowed the long-run relationship between spot and future prices to change after September 2004. Together, these results suggest that market fundamentals initiated a long-term increase in oil prices that was exacerbated by speculators, who recognized an increase in the probability that oil prices would rise over time.
Nicholas Apergis, and Stephen M. Miller, 2009, Do structural oil-market shocks affect stock prices?, Energy Economics, Vol. 31, is. 4, pp. 569-575
This paper investigates how explicit structural shocks that characterize the endogenous character of oil price changes affect stock-market returns in a sample of eight countries — Australia, Canada, France, Germany, Italy, Japan, the United Kingdom, and the United States. For each country, the analysis proceeds in two steps. First, modifying the procedure of Kilian [Kilian, L., (forthcoming). Not All Oil Price Shocks are Alike: Disentangling Demand and Supply Shocks in the Crude Oil Market. American Economic Review.], we employ a vector error–correction or vector autoregressive model to decompose oil-price changes into three components: oil-supply shocks, global aggregate-demand shocks, and global oil-demand shocks. The last component relates to specific idiosyncratic features of the oil market, such as changes in the precautionary demand concerning the uncertainty about the availability of future oil supplies. Second, recovering the oil-supply shocks, global aggregate-demand shocks, and global oil-demand shocks from the first analysis, we then employ a vector autoregressive model to determine the effects of these structural shocks on the stock market returns in our sample of eight countries. We find that international stock market returns do not respond in a large way to oil market shocks. That is, the significant effects that exist prove small in magnitude.
Józef Paska, Piotr Biczel, and Mariusz Kłos, 2009, Hybrid power systems – An effective way of utilising primary energy sources, Renewable Energy, Vol. 34, is. 11, pp. 2414-2421
Nowadays in many countries the increase of generating capacity takes place in small units within the framework of so-called distributed power industry (distributed generation – DG, embedded generation), and among them in hybrid power systems (HPS).
In this paper we present our experience of the design, build and exploitation of HPS in the Institute of Electrical Power Engineering, Warsaw University of Technology. The following major subjects are considered:
■ the experience of exploitation of a hybrid solar – wind power plant,
■ a solar power plant with a fuel cell,
■ the concept of a wind power plant with a battery energy storage,
■ the utilisation of a DC micro-grid for the integration of different electrical energy sources.
Tomas Persson, Axel Garcia y Garcia, Joel O. Paz, James W. Jones and Gerrit Hoogenboom, 2009, Net energy value of maize ethanol as a response to different climate and soil conditions in the southeastern USA, Biomass and Bioenergy, Vol. 33, is. 8, pp. 1055-1064
A recent increase in the demand for bio-ethanol has sparked maize production in the USA and other countries across the world. The net energy value (NEV), i.e. the energy output in ethanol and co-products after accounting for energy input requirements in the production chain of ethanol, is a measure of its sustainability. Grain yield of maize, which varies substantially across different climate and soil conditions, greatly impacts the ethanol NEV. The objectives of this study were to determine i) the NEV of ethanol produced from maize grown in four production regions in the southeastern USA and, ii) the specific impact of local soil variability under the same climate conditions within the four regions on the NEV of maize-ethanol. Maize yield was simulated with the Cropping System Model (CSM)-CERES-Maize model for soil and weather conditions, and management practices representing Bulloch, Floyd, Laurens and Mitchell counties, Georgia, USA. The calculation of ethanol NEV took into account the energy inputs and outputs of the entire ethanol production chain, and was based on the crop simulations. There were statistically significant differences in ethanol NEV among the counties, and within counties due to local soil variability. Differences in ethanol NEV among counties were partially due to different transportation distances. Based on the results of this study, it was concluded that maize-ethanol NEV can be increased by accounting for the soil and climate factors in the feedstock production and by locating ethanol-processing facilities in regions with soil and climate conditions that are favorable for ethanol-maize production.
Contact
- Content: editors at theoildrum dot com
- Tech support: support at theoildrum dot com
License

This work is licensed under a Creative Commons Attribution-Share Alike 3.0 United States License.
The article on LEED standards brings up problems of accounting for energy that are reminiscent of the EROEI issues around various fuels.
I have heard criticism that you get points toward LEED certification if you put bike racks in front of the building, even thought this doesn't reduce the amount of energy the building uses directly. But if everyone bikes to the building rather than driving Hummers there, shouldn't this be included in the energy savings of the building? If not, where should it be counted?
I think Megan Quinn Bachman and other Community Solutions folks may have a post on LEED certification and issues surrounding it in the not too distant future. They have talked to us about it.
In one LEED Certified home I saw, there was an amazingly large laundry room and an open two-story high living room. The house as a whole was way too large for the one woman living there. The house was in the "middle of nowhere" so that she would have to drive for long distances to buy anything. I am sure the woman could impress people with the LEED credentials, but it was hard for me to see that there was any real net energy savings.
I think the people involved in buying the Green Buildings really have to understand the bigger picture. It is too easy for it to be a nice "green" thing to do, without changing one's basic lifestyle. It reminds me a little of buying a diet Coke to eat with your brownie.
Around here there's a big push for a LEED certified "green hospital." But they want to build it on formerly-prime ag land, and included in the redevelopment was a high end subdivision (that is now having trouble being filled up with people). All this activity is taking place on the outskirts of city limits, with the city limits expanded to incorporate it, giving the development projects access to city sewer, water, street maintenance and police services at a time when budgets are being cut back and fees for services are going up.
Meanwhile, it turns out that because the hospital is new, it must comply with gargantuan though well intended building and ventilation standards that mean it will use MORE energy than the current hospital! And these same standards require automation of nearly everything so that windows can't be opened manually, for example. Without electricity the place will be useless it seems, and yet part of the reason for having a hospital here is that in case of disaster we are isolated. Well, couldn't a disaster take out power for an extended period? Yes. So how much back up power exists? Three days of diesel. Any plan to use renewable energy? No, too expensive.
Furthermore, all the existing doctors offices, which cluster around the current facility might need to be relocated to another set of yet to be built buildings since doctors here follow their patients in the hospital. But until then doctors are expected to drive back and forth, umpteen times per day.
In the discussions with the design team I brought up "boundary of analysis" and was basically told that they only assess within the project property itself.
So much for "green."
During the Transition Training weekend we did here in Rochester, NY back in March I met a man who has been doing solar installs and consulting for municipalities downstate NY. He was telling me how he went to a green energy conference in Boston last year and all the installers basically asked the LEED people to please take their website down, cease and desist, all in flowery installer language. The impression I get is LEED is pretty much a joke.
On your note about "boundary of analysis", Jason, it brings up for me the most profound dilemma about trying to really understand energy accounting. I started reading Vaclav Smil a little while ago, and admit I didn't fully comprehend most of it (very technical), but what I came away with is that there is really no accurate way to measure the conversion of energy from one form to another, given the difficulty of accounting for the utility, transportability, power, re-use potential and other characteristic factors of various forms.
The other issue is, of course, where to draw the boundary in any given analysis. According to the permaculture definition of a System Yield, it's the net energy stored, conserved, re-used AFTER the system has all its needs met, including the needs of the inhabitants, and all the resources used are replaced. The system boundary seems always to be expanding to include the whole globe...
As always, would like to hear your thoughts on these conundra.
Remind me of some "green" houses in San Francisco that cost like a few millions. So much for that idea... When anything "green" that ends up costing 3x, 5x what people normally paid -- I wonder what the point!!!
Same thing with Organic --- great if you have the money to buy "organic" for 3x the normal price. 99% of the people, probably, don't -- does that make a "green revolution"?
This points out a fundamental problem with "free market theory"-- prices don't reflect anything in reality. The so-called normal price is heavily subsidized three ways to sunday. The organic price is probably closer to the real cost of the produce. Either way you pay, it's just not included at the point of sale. All your farm, water, energy, DOD, sewage, Army Corps of Engineers work on the Mississippi, EPA, higher prices on things like Bay Shrimp due to farm-runoff-caused Dead Zones in the Gulf: these upstream and downstream costs are hidden from your purchase decision.
LEED is just crap but the architectural establishment suckers STUPID local government into supporting it.
Architects simply won't allow proper insulation and want to designs they always do--paper-thin walls, lots of glass, standard building construction methods that allow 'thermal bridges', inadequate air tightness but allows lots of meaningless gimmicks. To be a LEED-NC professional you must memorize a bunch of worthless 'green facts' for a $200 test.
The final product is a joke.
Energy Star run by DOE is based on simulated annual energy consumption and is definitely superior but the best real world savings is about 30% below standard new. I understand that commercial property developers consider Energy Star more realistic that LEED and price those properties higher.
Passive House looks at a 90% reduction below standard new but does require many lifestyle changes. Rooms are smaller, windows are for passive solar heating, efficencies of appliances is very high. Water usage is restricted.
Still if we are running out of energy it is very possible that a Passive House lifestyle would survive a drastic reduction in energy with ease.
"LEED is just crap but the architectural establishment suckers STUPID local government into supporting it."
Gee, maj, don't hold it all in. Let it out and tell us how your REALLY feel about it. And perhaps with a few more CAPs this time! ;-}
Interesting piece from Matt Simmons on the Natural Gas data and how inaccurate it may be.
http://www.worldenergysource.com/hottopics/simmons/index.cfm?&id=38
http://www.worldenergysource.com/wes/stores/1/A-Glut-of-Bum-Data-P1278C1...