| Drumbeat: September 9, 2009 | The Oil Drum | Joseph Tainter - Human Resource Use: Timing and Implications for Sustainability |
OPEC Meets as Oil Demand Turns the Corner
Posted by Gail the Actuary on September 9, 2009 - 10:10am
This post is a guest post by Morgan Downey. Morgan is author of the book ‘Oil 101’.
OPEC members announced cuts in late 2008 totaling 4.2 million barrels per day (Mb/d). Compliance with these cuts is currently running at around 3Mb/d.
Ahead of OPEC members meeting on Wednesday September 9 in Vienna, it is worth elaborating on why OPEC will likely refrain from making any production changes and why they may in fact need a temporary tightening of compliance with existing quotas by up to 500,000 barrels per day.
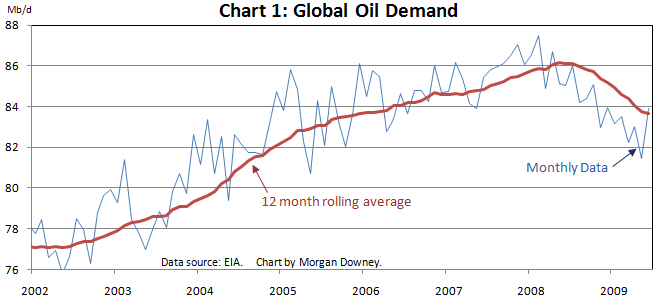
During the 2008-2009 recession global oil demand fell by 2 Mb/d from 86 to 84Mb/d (chart 1). Global demand appears to have stabilized and is beginning to grow again. The charts in this post (click to enlarge) use monthly data and 12 month rolling averages to adjust for seasonality.
Almost all the global decline was concentrated in developed OECD nations (chart 2). Less developed non-OECD nations such as China and India only saw a temporary stagnation and are now exhibiting growing demand again (chart 3).
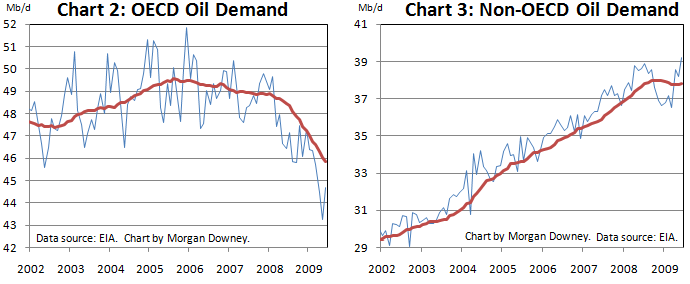
Of the OECD decline, one third came from the US, one third from OECD Europe, and one third came from the remaining developed OECD countries.
The US accounts for just under 23% and Europe 18% of 2009 global oil demand. Oil demand in the US and Europe has yet to stop falling (see charts 4 and 5).
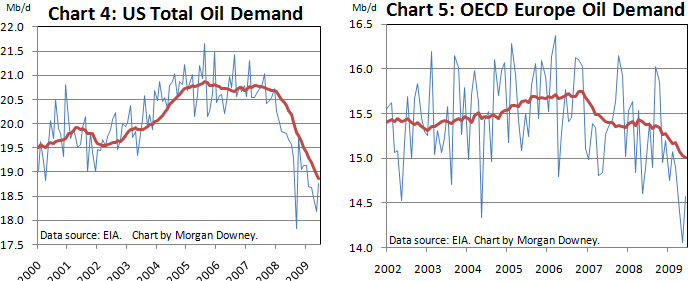
Oil demand in the US was destroyed more in absolute barrels over the past few years than in any other region.
The severe demand destruction in the US had a lot to do with current US oil consumption patterns (76% of Americans get to and from work by driving alone) and infrastructure (average US vehicle fleet efficiency is less than half that of available technology). Relatively inefficient consumption allows for swift efficiency gains compared with other parts of the world which are already at or close to maximum technically available oil consumption efficiency.
Looking at total US oil demand (chart 4) one may perceive that it is in a steady decline which can perhaps be extrapolated into the future. However, delving deeper into the data provides clues as to exactly why US demand is declining and why we may be at or quickly approaching the end of the decline in total US demand.
The total number of miles driven on US highways has stabilized and is increasing (chart 6).
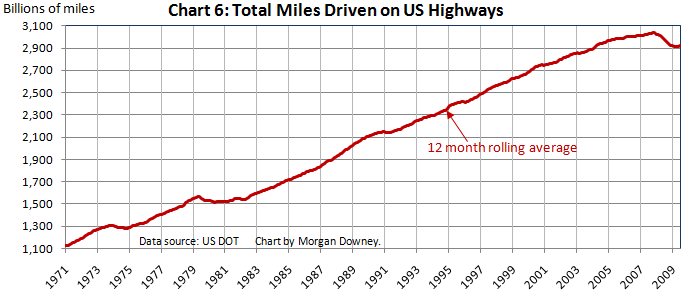
This stabilization and increase in highway miles driven is showing up in US gasoline demand which is no longer falling and has begun to grow again (chart 7). Gasoline demand accounts for almost half US oil consumption.
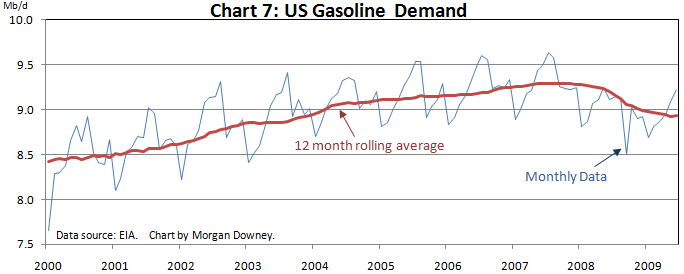
The recovery in gasoline demand is because people are cutting back on vacation spending by driving rather than flying to holiday spots. This certainly syncs with the fall in jet fuel consumption (chart 8) and anecdotal evidence. Businesses have also been cutting back on flights.
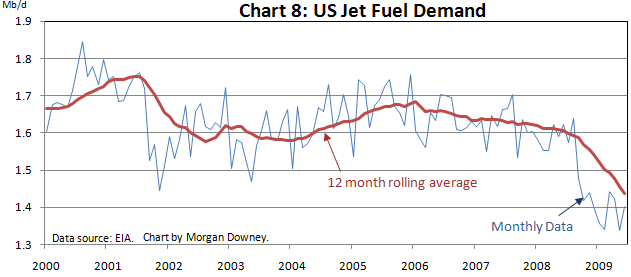
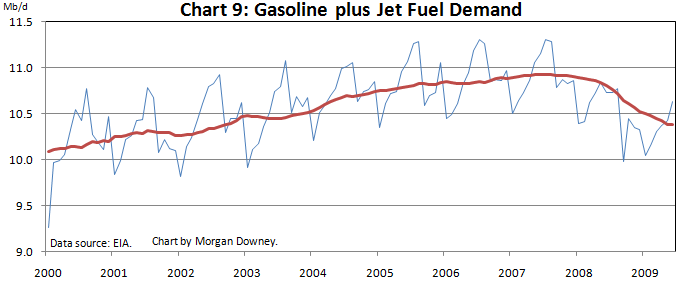
The decline in jet fuel consumption is more than offset by the increase in gasoline consumption. Combined, jet fuel and gasoline demand (together 57% of total US oil demand) are beginning to recover (chart 9).
Where is the remaining weakness in US oil demand? It is in industrial oil demand. Demand for distillate (diesel and heating oil), residual fuel oil (mostly used for shipping and a little for electrical power generation) and other oils (lubes, waxes, asphalt, plastics and a bunch of other oils).
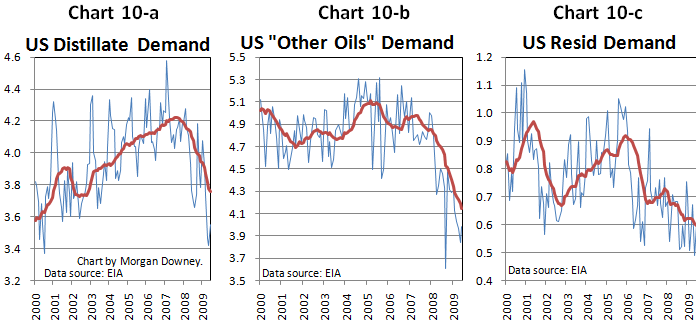
Aggregating these three categories of US oil demand into “Industrial” demand, these industrial oils account for 43% of total US oil demand (chart 11).
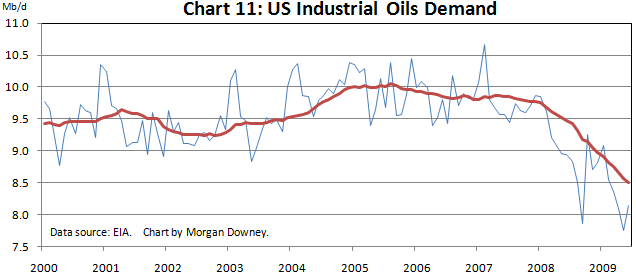
To see a recovery in US industrial oil demand there will have to be a recovery in consumer spending (linked to unemployment, housing and the savings rate), manufacturing activity (especially autos), and private services sector activity. Most indicators in these macroeconomic areas have begun to stabilize and even improve over the past couple of months.
Summary of Demand Situation
US industrial oil demand is currently the weakest part of global oil demand and the largest component of global oil demand yet to cease declining. Non-oil macroeconomic indicators suggest that an end to the decline in US industrial oil demand is imminent.
Despite the weakness in OECD oil demand and US industrial oil demand in particular, global oil demand has stabilized and is beginning to grow due to non-OECD demand.
Inventory Situation
At the end of 2008 OPEC members removed close to 3Mb/d from supply. This was the amount required to stabilize and reduce OECD land based storage.
While OECD land based storage is no longer increasing, global floating storage and non-OECD storage continue to creep higher. There needs to be an elimination of inventory growth in these areas in order to bring the global oil market into balance (a balanced market has inventories neither increasing nor decreasing).
This elimination of inventory growth can come from the recovery of global demand which appears to be just beginning or a further reduction in supply from OPEC. The required number is generally estimated to be around 0.5Mb/d.
What will OPEC Do?
At the OPEC meeting this coming Wednesday, September 9, members have little choice but to maintain existing production cuts.
Until nascent global demand growth strengthens, OPEC members may need a temporary 0.5Mb/day improvement in cut compliance (compliance with 4.2Mb/d cuts announced in late 2008 is currently only around 3Mb/day) in order to stall increases in floating and non-OECD storage, and bring the global oil market into balance.
Contact
- Content: editors at theoildrum dot com
- Tech support: support at theoildrum dot com
License

This work is licensed under a Creative Commons Attribution-Share Alike 3.0 United States License.
Thanks, Morgan! These are really nice charts.
I take it Charts 1 - 4 are based on EIA's International Petroleum Monthly Demand data. This data seems to be though May.
On the US only, Charts 7 -11, I imagine they are coming from EIA "Product Supplied" data. This data seems to be through June.
There is always a lag in data, so if there is a change due to "green shoots" recently, I guess we wouldn't see it yet.
Hi Gail. There is a lag in the data. Revised monthly data used in the above charts are delayed a little. The more recent preliminary monthly numbers are available on the EIA web site.
Even with the lag the graphs are compelling. Well done and it will be crucial to see if OPEC cuts the 1/2 million barrels or whether they let is slosh around. Is China going to back out a bit and let it fall or will demand continue to rise?
Chinese auto sales have been growing at a rapid pace and Chinese oil imports have been very strong over the past few months.
The consensus appears to be that OPEC will hold production steady with the 3Mb/d cuts and wait for demand growth to clean up inventories rather than increase compliance by 0.5Mb/d.
I wonder what the oil demand graphs would look like without 30%+ of G-20 GDP guaranteed by governments via Commercial Paper purchases, loan guarantees and other financial bailouts?
That is a great question. I have a feeling based on past recessions that the absolute barrels consumed would be no different.
Hmm, here's what obtained in the 80s with gasoline/distillates/resid:
The sharp decline in resid was due to the cutback in using oil for electrical generation. Gasoline demand dropped sharply in '79/'80, plateaued for a while, then began to pick up again. 1988 gasoline consumption was 99% of 1978's, with CAFE standards bumping up all the while. Some talk of a huge dip in overall consumption in the 80s that was only surpassed in the 90s, a lot of this however was accounted for by items like the fuel oil in my graph.
What do you think of the impending contraction in refining, Morgan? Deloitte's study projects ca. 2 mb/d of US output being shut down in the next few years; do you think the overall global figure will stay flat with new builds? And do you know how complex this new refining is - will it have the capacity to crack all the heavy sour we have on hand, or are we facing a glut of road oil etc.?
The refining industry is facing a tough time globally as a lot of new refining capacity is coming online around the world. The newly built refining capacity covers the gamut of complex at one extreme to very simple (Chinese tea pot refineries) at the other end.
With excess refining capacity the 2010-2020 period is shaping up to look a lot like the 1980s for refiners with a long stretch of very low refining margins siting on top of volatile crude oil prices.
There should be plenty of capacity available to crack all heavy sour crudes - although the margins may be quite low for doing so.
Nice graphs Morgan. They seem to be signaling a large change in where economic growth will be in the future.
I like the idea of Jonathan Callahan's that oil is subsidized strongly by non-oil fuels in some countries. And that those countries are going to keep taking market share from those countries who need oil for primary economic activity.
Taking a look at his export browser, India and China both have coal consumption much higher than oil.
http://mazamascience.com/OilExport/
So could we expect continued growth in countries with large domestic oil or subsidizing non-oil energy supplies, at the expense of those countries that import oil for production and manufacture, such as Japan, Malaysia, US (and OECD in general)?
Here in the US the oil soaked interests just caused us to ditch our green job czar, so we are well on our way to solving this crisis. (Darn cynicism is leaking out again...)
Agreed, excellent graphs, Morgan. Not only the raw data and moving averages as well (always a help in perception of overall trends), but the pertinent sectors selected. Kudos.
I like the moving averages too but thought that 12 months was, perhaps, a little longer than the underlying trends. I'd like to see 6 month MA.
Re: Chart 8 - Jet Fuel demand
I thought that the military used 2mb/day, mostly for jet fuel.
Is the military use of (jet) fuel included?
Your total is under 2mb/day, so i guess not... ?? ?
If so, your US oil demand, Chart 4, which is shown as down to 19, could be thought of as down to 21?
The US military oil consumption | Energy Bulletin
Military jet fuel demand is included in US jet fuel demand numbers in the charts. Military jet fuel consumption has not changed much over the past 2 years.
Regardless of the exact numbers these jets are still burning aa whopping amount of fuel that may not be available in time of war someday before the jets are retired.Or perhaps they might be retired early due to a lack of fuel.
Perhaps the fuel situation is a technology driver that is not getting much attention from the public but is heavily wieghted by senior military planners.Apparently just one super modern bomber can take the place of a whole air force (almost )when compared to WWII ERA planes.
Delivering a very big load of very powerful bombs very precisely on lots of different targets in a single sortie must translate into a very small bomber force being able to get the job done.
Where are you Porge?
The idea that one current bomber can replace a whole air force of WWII-era planes is profound hyperbole.
Granted, a modern bomber has much, much greater capabilities than a B-17, B-24, or B-29 from WWII.
However, you can't compare one modern bomber to many tens of thousands of Army Air Corps aircraft in WWII...the numbers are overwhelming.
The point is: The U.S. Military burns a huge amount of oil...especially since 9-11. This oil is not generating business revenue nor is it generating tax revenue. It does cost us tons of tax payer/U.S. debt money and is of dubious use to provide us 'national security'.
A big factor that makes this sort of analysis work is reported US distillate stocks which can be accessed here.
http://tonto.eia.doe.gov/oog/info/twip/twip_distillate.html
And
The large stock build translates into lower assumed demand.
Also if you look at distillate production its not dropped that much.
http://tonto.eia.doe.gov/dnav/pet/hist/wdirpus24.htm
However there is another trend thats also occurring which is a sharp increase in US exports of distillates.
http://tonto.eia.doe.gov/dnav/pet/hist/mdiexus1m.htm
Generally when market dynamics change fairly rapidly its not surprising that various stats might become misinterpreted indeed the rise of distillate production for export may well skew the actual data. And given the reports of a sharp increase in distillates stored at sea and US production it makes sense that a lot of these barrels of distillates may have come from the US.
http://news.alibaba.com/article/detail/energy/100097140-1-analysis-disti...
And why on earth are diesel prices not falling through the floor ?
http://tonto.eia.doe.gov/dnav/pet/hist/ddr001w.htm
Heating oil is.
Also we have the switch to lower sulfur fuels not only inside the US on but also on many maritime routes and in Europe.
In short the distillate situation is anything but clear lots of changes are taking place many over a short period of time and the simple assumption that the large build of distillates indicates a fall in demand is probably not correct and even the exact size and nature of the build in distillates is questionable.
And given the rise in use of low sulfur fuels for maritime use and rising exports its not clear if the build is more a reflection of a changing market.
I'm not saying that demand is not down a simple look at intermodal rail traffic shows a 18% drop.
http://www.ttnews.com/articles/basetemplate.aspx?storyid=22578
Trailer volume is off nearly 40% however again we don't know the economics of shipping by rail vs simply using trucks.
http://www.thecitywire.com/?q=node/5803
This suggest that at least in some cases freight that previously used trains may be moving solely by truck.
So although we have a inventory build in distillates it looks like ULSD supply and demand are probably in balance. The trucking numbers prices etc point towards a stable albeit well supplied market. Heating oil and other low quality distillates seem to be the only ones still in an obvious glut.
I just don't think the simple demand for distillates assumption is valid way to many factors are at play to make a simple assumption of a glut.
In fact as far as I can tell great oil glut seems to have been reduced to a bit of excess heating oil with the prices of all other products generally holding their own and moving with the price of oil.
Heavy oils yield a disproportionate share of distillates, unless a lot of cracking is done. Now that there is more heavy oil, there would likely be more distillates produced. I don't know if this is a factor in the excess of distillates. One would think that would be more than offset by the corn ethanol.
I'm coming up for two years visiting here... What have I learnt? Probably not much. What have I changed? Same answer, without the "probably".
I've written letters and emails to familar faces and voices, had dozens of responses. I continue to have the impression it's business-as-usual; compounding growth just isn't an issue.
So I guess it'll be at least another decade (perhaps two or three) of "meeting demand"; whether it's squeezing tar sands, probing the depths of the ocean, whatever.
And then?
Perhaps they'll squeeze a bit more. Or grow more sugar-cane for ethanol. Anything to keep the status quo for Joe and Jane. Perhaps Australia is the "lucky country" afterall?
But what the heck would I know?
Regards, Matt B
Still living in mainstream (for Pete's sake!). What else is there to do?
I personally expect the next year to be quite "interesting".
The financial problems combined with the crude oil price spike lopped the top off the exponential growth curve, at least in the short term, but there are a lot of people trying to get the party started again.
If they succeed, we find out if that crude oil limit is a hard ceiling after all.
Keep on keepin' on.
There is NO evidence for large amounts of oil or product being stored on the water. In fact with tanker rates so low I suspect there is almost no oil being stored at sea. If there is land based storage available which there is, it makes no sense to store oil on the water.
It would seem to me that low rental rates on tankers is precisely the reason on the water storage could work.??
Memmel has a theory over at PO.com that floating storage has been used as a means of manipulating the oil market. Because it is effectively invisible, it is easy to fine tune the level of oil delivery to port to manipulate the oil storage figures to generate short term profits on the oil markets.
This has had the effect of moderating the oil price in the medium term (months) whilst introducing enough short term volatility to make a profit.
His analysis is that most of this offshore stored oil has now been landed, and in a month or three we will return to a more volatile period in the market. Then it will be up to OPEC to increase quotas again or admit that they can't.
Alternatively, we may enter a 'double dip' recession and prices will drip to $35 and the floating oil storage will grow again , just in time for the next economic recovery.
Isn't most oil delivered under contract? I wouldn't think that the spot market would be large enough to really manipulate the price of oil.
Hmm,
Reading between graphed lines, it suggests another economy wrecking price spike early next summer as the rising consumption driven by western economies feeling better hits the 3Mbpd buffer between supply and demand - and the US driving season comes back in full force.
Maybe its time for another poll, when does oil go above $100 again?
I see this article on the web, confirming what Morgan is saying about OPEC price cuts. No actual decision yet, but tending in the direction expected.
OPEC committee recommends no oil production cut
I heard a little blurb on NPR a couple of days ago that said that the US economy declined by 2.3% (Or something like that) in the month of August. Does anyone have some general economic numbers, say going back a year, that could be correlated with these production/use type graphs in the post?
The Three Year/Six Year Rule?
I have previously noted that the US Lower 48 and the North Sea--which respectively peaked in 1970 and 1999 and which were both about 50% depleted at their respective peaks (based on the logistic, or HL, method)--both had low decline rates for three years, followed by more rapid decline rates over the following six years, and we see a similar pattern in other regions.
For example (all 3 & 6 years except for Mexico):
The 1970-1973 Lower 48 decline rate was -1.4%/year, and the 1973-1979 decline rate was -3.9%/year.
The 1999-2002 North Sea decline rate was -0.9%/year, and the 2002-2008 decline rate was -6.7%/year.
The 1972-1975 Texas decline rate was -2.0%/year, and the 1975-1981 decline rate was -4.6%/year (TRC).
The 2004-2007 Mexico decline rate -3.2%/year, and the 2007-2008 decline rate was -9.7%/year.
(Above data C+C, EIA, except for Texas).
I noticed this again when I summed the total oil production from Indonesia, the UK and Egypt (IUKE):
The 1996-1999 IUKE decline rate was -0.2%/year, and the 1999-2005 decline rate was -6.4%/year (total oil, EIA).
The obvious implication, since world conventional crude oil production in 2005 was about 50% depleted (based on Deffeyes' logistic model), is that the decline in demand may be obscuring an accelerating rate of decline in world crude oil production.
"...the decline in demand may be obscuring an accelerating rate of decline in world crude oil production."
That seems very possible. So the race is on between declining demand and declining supply (?) If so, can we make these two assupmptions for world demand and supply(?):
The decline in demand will reverse with the world economic recovery and world demand will increase again (?)
The decline in supply will continue. That's a problem.
For OECD nations, the decline in demand will continue (how fast)?
The decline in supply of conventional crude will continue (how fast, and can the alternatives come into the gap fast enough to outrun the decline in production/supply?
Notice I am making an assumption that the decline in demand for crude oil will continue in OECD nations but not in the world market. I am making the assumption that the world is not yet to the state of technology and logistics (grid electric power/natural gas distribution/propane) to be able to stop advancing world oil demand just yet, but that the OECD nations are. Anyway we slice it, we are assuming that the world will never see 90 million barrals per day production of crude oil (and therefore demand).
The growth of the oil age is over. OECD nations are already dropping demand fast, and it will drop only faster in the upcoming years. The world market is a problem, because it will take longer for them to reduce demand without severe economic pain, perhaps even human suffering. It will happen, but not as fast. How long is the window of suffering, and can the big players (China in particular) accelerate their alternative energy production and use?
Interesting times.
RC
I think the most likely scenario is a "race to the bottom" between supply and demand, with periodic shocks every few years as the production decline catches up with declining demand.