Was Volatility in the Price of Oil a Cause of the 2008 Financial Crisis?
Posted by Gail the Actuary on December 8, 2009 - 10:26am
This is a guest post by Theramus, a college professor in a field unrelated to finance. He has looked at the relationships shown in this post as a hobby.
Summary
A cause for the financial crisis of 2008 is described that differs from conventional wisdom. It is proposed that in the early 2000s, an increase in the volatility of oil took place. This increase in oil volatility had an impact on investment risk in general, and led to incentives to promote self-interested cashing out rather than protection of shareholders. Novel data will be provided to show that a distinct series of pulsed spikes in oil price volatility initiated in the early 2000s. The oil shock of 2008, when price doubled over less than a year (peaking at ~ $140 a barrel), is shown not to be an isolated event. Instead, the oil shock of 2008 is the largest in a series of 7 prominent spikes in oil price variance that began some 7-8 years ago.
The multi-year pattern of spiking instability in oil price appears to be unprecedented, is ongoing and may be a natural process that results from initiating or being on the down-slope of the production curve since "Peak Oil".
Importantly, individual spikes in oil price variance precede corresponding spikes in volatility in the inflation rate, the S&P 500 index and the price of gold - indices tied to the confidence of financial professionals to make accurate assessments of investment risk. It is proposed that as evidence consolidated that “see-saw” changes in oil price variance were propagating increasing uncertainty into investment outcomes, the necessary and sufficient conditions emerged for:
1) Expansion of the "shadow banking system" and
2) Unregulated value extraction (i.e. looting) from this sequestered pool of capital.
Finally, data will be described as to how a volatility spike in oil price in 1986 and a subsequent crash in the stock market in October 1987 (Black Tuesday) may have provided a key teaching moment. Lessons learned on the economic impact of a large transient variance in oil price from "Black Tuesday" may have been a factor guiding the avaricious behavior of Wall Street in the lead up to the financial crisis of 2008.
Introduction
The distress of Mr. Greenspan
The former chairman of the US Federal Reserve Mr. Alan Greenspan provided the following response during questioning about his “ideology” before a committee of the US congress on the 23rd of October 2008:
"I have found a flaw… I don't know how significant or permanent it is. But I have been very distressed by that fact...."
A reflexive media and commentators jumped on a bowed Mr. Greenspan for the usual depressing reasons. However, had Mr. Greenspan let his mask slip for a moment? Notable words in his response included “…how significant or permanent…”. By using this phrasing could Mr. Greenspan have been signaling that he’d not been wrong previously (as if)? Instead, was he suggesting that conditions in the economy had changed in a manner that now made his old way of thinking flawed?
This idea explores a possible cause for Mr. Greenspan’s distress. In short, it proposes the outline of a mechanism for how volatility in the price of oil might have contributed to the apparently irrational actions of the financial industry. In particular, it speculates how a recent upsurge in the instability of oil pricing might have provided a rational basis for altering the incentives of global finance.
Consider the following hypothetical sequence of events:
1. Global oil production starts becoming constrained around the year 2000, on its way to peak, as predicted by Hubbert.
2. A new pattern of volatility in oil price emerges shortly thereafter and this pattern continues to build through the present (and into the future).
3. This new type of volatility is in the nature of being on the production down slope of a finite resource in great demand (i.e., oil).
Variance and occasional very large movements were certainly evident in the upslope of the production curve. However, the frequency and severity of oil price movements that characterize the variance on the downhill side of the production curve are envisaged to be of a different pattern and order of magnitude.
4. Owing to its singular role in the economy, increased pricing volatility in oil begins to propagate volatility (and thus uncertainty) into the price of nearly everything else.
5. The rising levels of uncertainty in pricing translate into increases in risk of investment. Indeed, due to unknowns in future prices and most especially of oil itself, real financial risks are probably rising exponentially across the board.
6. A knowledgeable and initially small number of insiders anticipate the implications (as outlined broadly in 1 through 5) of moving onto the down slope of the oil production curve 4-8 yrs earlier than the rest of us.
7. With financial risk increasing, and a still small, but growing number coming to understand what is going on, incentive begins to shift from protecting the interests of shareholders, to figuring out how to “cash out” quickly. This shift in incentive may be the fundamental change (of uncertain permanence) that is the cause of Mr. Greenspan's distress.
8. The behavior of the primary few spreads within the global financial industry and perhaps beyond. Most secondarily affected individuals are probably oblivious to the ultimate cause (i.e., oil price volatility) of their choices and actions.
A fin-de-seicle ethos becomes pervasive. There is an unspoken or perhaps even quietly discussed urgency that time is running out for you to make your “nut” (i.e., sufficient money to retire wealthy) and get out.
How the "cashing out" occurred is a matter of some complexity. But this part of the story does seem to conclude with tens, and possibly hundreds of trillions dollars in worthless ("toxic”) assets in the "shadow banking system". It is speculated that the primary mechanisms of "cashing out" did not directly involve accumulation of wealth in the "shadow banking system" per se. Instead, the evidence suggests that extraction of value involved the taking of fees, salaries, bonuses, stock options (ugh!) and other mechanisms leveraged against the "toxic assets" by the exclusive few who had access to this huge, but ultimately chimeric pool of capital.
Government bailouts of “systemically important institutions” are perhaps the most recent example of leverage against the "shadow banking system". Whatever the specifics of the “cashing out” mechanism - we know the rest - credit crisis, stock and housing market crashes, job losses and the deepest recession of the last 50 years.
Four propositions that link volatility in oil price to bad behavior in financial markets
The “hypothetical sequence” enumerated in 1 through 8 suggest at least 4 propositions for which some data can be derived.
1. Volatility in the price of oil increased after the year 2000.
2. Variance in the price of goods and services (i.e., inflation rate) after 2000 should show a correlated increase downstream of increasing volatility in the price of oil.
3. Investment risk should rise in concert with increasing volatility in the price of oil and the price of “stuff” in general.
4. And there may have been information in place prior to the 2008 crisis that enabled anticipation of the destabilizing effect of large variances in oil price on investment risk.
The author refers to these as the 4 propositions of the apocalypse - a sad attempt at playfulness and definitely in poor taste. Nonetheless, evidence will be provided to support each of the propositions. It is probably fair to point out that even though the propositions imply mechanistic linkages, the actual data presented will generally be correlative.
By the way, this essay is based on a longer wiki composed online over the last year or so. This might go some way to explain the accretive, and somewhat clumsy structure of the present essay. The longer (winded) piece can be found at http://ow.ly/hSGb.
Proposition 1: Volatility in the Price of Oil Increased after 2000
For the purpose of this analysis, I chose to use the price database of the Illinois Oil & Gas Association website. http://www.ioga.com/Special/crudeoil_Hist.htm
This site provides “Illinois Basin Posted Crude Oil Prices”. I would expect this data to be similar to that from more commonly used sources, such as West Texas Intermediate prices available from the US Energy Information Administration.

The chart in Figure 1 is a plot of monthly crude oil price from 1986 to 2009.
The sharp rise and fall in oil at the right hand of the plot corresponding to the oil shock of 2008 is a part of this story that is all too familiar to motorists.
The next problem was how to calculate an index in the volatility of oil price based on the monthly data. It was reasoned that this index of volatility should reflect the spread or variability in price over successive intervals of time. To achieve this a simple statistical approach was used.
The monthly oil prices for Jan, Feb and Mar of 1986 were $22.50, $16.00 and $14.00 respectively. First the standard deviation (SD) of the first 2 numbers (i.e., $22.50 for Jan 1986 and $16.00 for Feb 1986) was calculated as an index of their spread. This SD was 4.60. Next, the standard deviation of the 2nd and 3rd numbers for (i.e., $16.00 for Feb 1986 and $14.00 for Mar 1986) was estimated to give an SD of 1.41. These calculations were carried out for successive pairs of months for all 276 months from Jan 1986 down to Dec 2008.
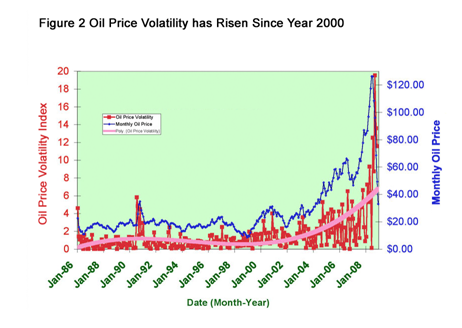
Figure 2 charts this index of rolling SD in oil price (red) together with oil price (blue). Eyeballing the "seismograph-like twitchings" of the index of volatility indicates that it is on a rising trend, particularly since 2002. An intriguing feature of the volatility plot is large "spiked twitches" that rise notably above background - more on these spikes later.
The trend in oil price volatility over time appeared to be non-linear. Microsoft Excel was used to calculate a 3-factor polynomial fit to the scatter plot (pink line - Figure 2). Interesting features of the resulting regression line include that it starts to move notably upward from around year 2000. The trend line also appears to climb in an exponential manner from 2000 through to 2009.
In conclusion, looking back from 2009 there is evidence for a rising trend in the volatility of the price of oil that commenced from around year 2000.
Proposition 2. Variance in Inflation Rate Should Show a Correlated Increase Downstream of Increasing Volatility in the Price of oil.
The monthly year-to-year inflation rates between 1986 and 2009 were used to derive an index of general price volatility in goods and services.
Monthly numbers on inflation rate issued by the US Federal Govt. (calculated from the consumer price index - CPI-U) were obtained from:
http://inflationdata.com/Inflation/Inflation_Rate/HistoricalInflation.aspx
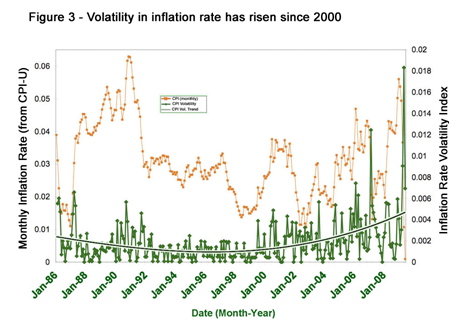
Figure 3 shows a co-plot of monthly inflation rate (orange), an index of inflation volatility based on rolling SD of the CPI-U (dark green, calculated as per the oil volatility index), and the regression trend in inflation rate volatility (light green-black core) between 1986 and 2009.
From Figure 3 it is notable that the inflation trend appears to reach it lowest point around 1997, slightly earlier than the oil trend - which as shown in Figure 2 is at a nadir around 2000. This lack of coincidence in the lowest point for the oil and CPI-U volatility plots is problematic for the "hypothetical sequence". The hypothesis suggests that oil price variance should be “upstream” of inflation volatility. One can perhaps account for this as a statistical error, the effects of more than one time-dependent factor on inflation, the result of government manipulation and so on. Nonetheless, this discrepancy is a concern and clarification is required.
What happens with if "honest" numbers on inflation rate are used?
There is a question as to whether "official" inflation numbers reflect the actual rate of inflation in the US economy. A widely known website that provides an alternate calculation of inflation is "John Williams Shadow Government Statistics": http://www.shadowstats.com/
At this site, inflation numbers are described as being calculated using methodologies that were utilized by the US Govt. in 1980s. A site newsletter indicates that this "Alternate Consumer Inflation measure, reverses the methodological gimmicks of the last 25 years". In other words, the site suggests that "cheating" on the way inflation is currently reported by the Feds has been mitigated.
When the “Shadow Stats” numbers are used the pattern observed changes significantly (Figure 4). Inflation volatility begins to pick up later into the 2000s than when the index is calculated from the official Govt. numbers (Figure 3). Indeed, it appears that volatility in the shadow inflation rate does not start a pattern of more vigorous "twitching" until after the turn of the millennium. The light green plot of the volatility regression trend confirms a low point for the shadow numbers that occurs around 2000.
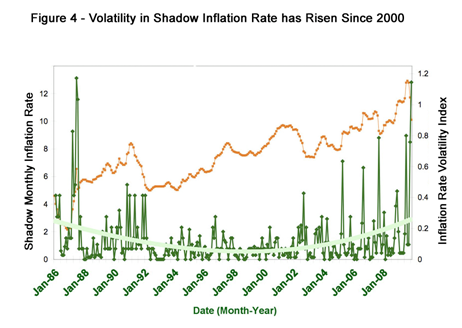
Comparing the volatility trends for oil price (pink line Figure 2) and shadow inflation (light green) indices since the mid 1990s is similar. The rise in the inflation curve now lags a little behind the rise in the trend of oil price volatility. Most importantly, the low points of the curves share a near "coincident bottom" around the year 2000 and from the point of view of the “hypothetical sequence” a near “coincident bottom” is a lovely thing. The results from the shadow inflation index (Figure 4) are thus notably more in line with the predictions of the “hypothetical sequence” than those derived from the “official” Govt. statistics (Figure 3).
Resolving Granularity in the Rolling Variance Indices
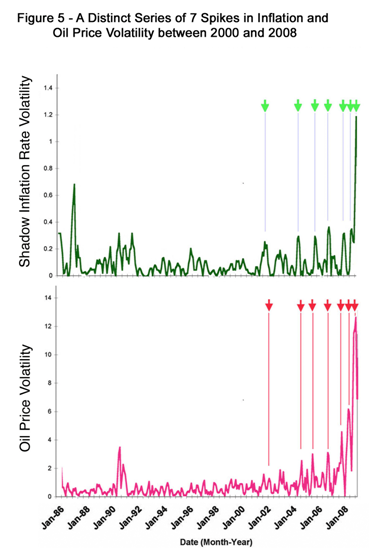
A previously noted feature of the volatility plots is the occurrence of larger twitches or spikes in variance (Figures 2-4). To improve resolution of these larger twitches, 3-month moving averages of inflation rate and oil price were calculated (Figure 5), and then the volatility indices for inflation and oil were re-calculated from these moving averages.
Prior to 2000, spiking in the two "smoothed" volatility indices occurs, but the pattern is irregular. However, after 2000 the spiked pulses of volatility appear to assume an organization. In particular, 6 distinct pulses in inflation volatility are evident in the period (green arrows on top panel) between 2004 and 2009, a recent one peaking in December 2008 being particularly large. An early “harbinger” uptick in inflation instability is also marked on the chart that peaks between 2001 and 2002.
There seems to be regularity to the pulsed spikes - and thus a temptation to assume that the sequence is an oscillating wave. However, if one looks at the spaces between the green arrows marking the pulse tops, they are NOT consistent. The time interval between the spikes gets shorter and shorter as 2009 is approached. If this is an oscillating wave, it is rather complex.
Now... if one looks at the "smoothed" oil price volatility index over the period between 2004 and 2009, almost the same pattern is seen (lower panel Figure 5). A distinct series of pulsed spikes (red arrows), each spike being separated by increasingly shorter intervals of time.
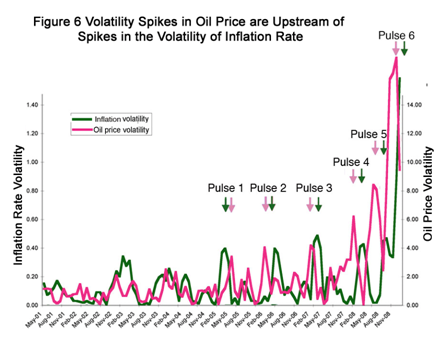
It should be noted that the words "almost the same" are used in the prior paragraph. The reason for this wording becomes apparent when the plots for oil and inflation are overlaid (Figure 6). Although the two patterns are similar, individual "pulse" peaks for inflation and oil do NOT show precise alignment over time. Instead, 5 out of the 6 inflation variance spikes lag slightly behind a pulse in oil price volatility. A further notable feature of the plots is that the volatility spikes tend to show a progressive increase in amplitude.
Pulse 2 in oil price volatility is interesting. Its initiation toward the end of 2005 corresponds roughly to the timing of Hurricane Katrina. Many in the US will remember the sharp rise in oil prices at this time and how conventional wisdom focused on the hurricane as the primarily factor causing the sharp ascent in gas price. However, the big picture view provided in Figure 5 indicates that the "Katrina-induced" spike in oil price may actually be part of a larger series of volatility pulses, including one that preceded it by a year and a third spike, which followed roughly a year later.
As with 2005, 2004 also had an active hurricane season. However, 2006 was comparatively quiet. The point is that while events such as Hurricane Katrina may act as a trigger or catalyst, they are certainly cannot be the ultimate cause of multi-year instabilities of the type illustrated in Figure 5.
In conclusion, there is evidence of a correlative link between volatility in the price of goods and services, as reflected in the shadow inflation rate that coincides with increasing volatility in the price of oil from ~2000. The strongest support for this link comes from a distinct and apparently unprecedented series of pulsed spikes of oil price instability that occurred between 2004 and 2009. Each spike in this series was matched by a coincident or later (downstream) twitch in volatility in the inflation rate.
Proposition 3. Increasing Volatility in the Price of Oil Is Causing Increased Investment Risk
Next, an analysis similar to that developed for Proposition 2 was undertaken on two indices of investment variance: One derived from the S&P 500 stock index and the second based on the price of gold.
A co-plot of "smoothed" volatility of the S&P 500 and oil price volatility over the period from 2000 to 2009 can be found at (http://ideas.wikia.com/wiki/File:SnP_Oil_overlay.jpg). The correlation between the peaks of volatility in oil price and stock (i.e., the S&P 500) are not as clean as between the oil and inflation indices over the same period (Figure 6). Between 2000 and 2004, there is turbulent "froth" in the S&P volatility index that presumably corresponds to the residue of the 1990s dot com boom. However, during the key period between 2004 and 2009, the same general pattern of correlated spike peaks observed previously for inflation rate applies.
The data shown in Figure 7 provides a more substantive and juicier meal. This plot shows a "smoothened" volatility plot of the price of gold (as measured from http://www.lbma.org.uk/stats/goldfixg - gold in USD) over the period from 2000 to 2009 co-plotted with the plot of smoothed oil price volatility.
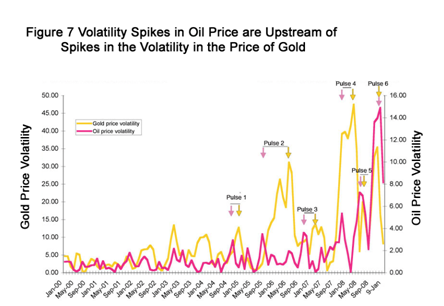
Gold is an interesting commodity. Historically, it has been treated as a safe haven by investors wishing to protect against inflation. The perception that gold acts as a store of value confers an interesting property on fluctuations in its price. The vigorousness of its movements up and down indicate the sentiment of people of means who are able to buy gold to offset investment risk.
To put this another way, volatility in the price gold provides an index of how safe or risky sophisticated investors judge the investment environment to be - a measure of the level of market uncertainty perceived by investors.
As with oil price volatility, fluctuations in the price of gold show a general rising trend over the period between 2000 and the present (Figure 7). Looking at the detailed geometry of the ups and downs within this trend, it can be seen that a downstream peak in the gold index matches Pulse 1 in oil price volatility. What comes next is a shocker. BANG ! Pulse 2 in oil price volatility (the Hurricane Katrina spike) ignites a huge surge in gold price variance. Its almost as if the pulse 1 was a warning shot and then a second confirmatory slug of oil price turbulence convinces a bunch of savvy investors to run for cover - big time.
Pulse 3 in oil occurs and there follows a modest surge in the volatility of gold price. Then the more dramatic pattern repeats. With the rise of pulse 4 in oil volatility, there is second a sharp run up in variance associated with gold price. This large spike in the gold index coincides with the first swallows (vultures?) of the credit crisis: Bear Stearns collapse, Mr. Bernanke assuring us that the sub-prime market is contained and so on. Oil price volatility spikes 5 and 6 follow, with predictable downstream spikes in gold volatility associated with both.
The patterns in Figure 7 are astonishing. Volatility in the price of oil appears to be leading investor sentiment - each variance spike heralding large changes of fluidity in the gold market.
In summary, evidence is provided for a correlative link between volatility in the price of oil and two indices of investment risk: fluctuation in the S&P 500 stock index and the price of gold. Again, six pulses in oil price instability are generally matched by unitary, downstream twitches of volatility in the stock index and gold price over period between 2004 and 2009. The detailed correspondence between the oil and gold indices is particularly striking. It is concluded the environment for investment over the last 8 or so years has been marked by risk that is increasing in a non-linear, perhaps exponential manner.
Proposition 4. Information in Place Prior to the Crisis Enabled Anticipation that Oil Volatility would Increase Investment Risk.
When Black Tuesday Came
Figure 7 provides evidence that long-term hedging in gold was occurring prior to the onset of the financial crisis in spite of the short-term unpredictability of gold as an investment. One reason for this paradoxical phenomenon is that gold is a sensitive barometer of perceived investment risk in the short term.
Proposition 4 examines how it came to be understood that oil volatility was adding unprecedented levels of uncertainty to investment outcomes through the 2000s - as reflected in indices such as the price of gold. The main question posed is whether specific information was available that could have led to a change in incentive within the financial industry from protecting shareholders to unregulated "cashing out".
Exhibit A in Proposition 4 is Figure 8. It may take a while to study and verify this complex chart. However, once you have familiarized yourself with its implications, your view of how modern economic events are shaped may be changed - perhaps not in a happy way. In a nutshell this figure shows that unitary spikes in volatility of the price of oil have occurred immediately downstream to almost all US recessions and stock market crashes since 1966.
Put aside the explanations trotted out by experts on the vagaries and fortunes of the US economy - sub-prime, the Fed, interests rates, the business cycle etc etc etc. Figure 8 teaches that the single factor common to virtually every US recession and market crash for nearly half a century is that each has been preceded by a prominent transient spike of instability in the price of oil.

The one exception with no preceding variance pulse is the shortest recession of the period, which occurred in 2001 in the wake of the dot com bubble in technology stocks. There is debate as to whether dot com actually met the formal definition of a recession, as it did not comprise 2 successive quarters of negative GDP growth. Semantics aside, it is notable that a minor volatility spike was coincident with the dot com “recession”, so the 2001 downturn might be considered as not inconsistent with the general pattern.
Looking at Figure 8 in detail, the now familiar recent 6 volatility spikes of 2000 to 2008 can be seen at the far right of the plot. Each of these transients in price variance are asterisked and referred to as "primary volatility spikes". A new, more recent pulse can be observed to be building during 2009. While the 2009 upstroke shows signs of flattening, it has already risen to the point that it is the 5th largest spike in oil volatility of the last 50 years.
The left hand of Figure 8 covering the period between 1966 and 1980 provides food for thought. Against the background of the turbulence of the last 10 years the volatility transients (asterisked) in this era are almost imperceptible. However, by expanding the Y-axis (right hand inset) we can see definite nubs of variance that coincide with the oil shocks of the early 1970s. And these were indeed “primary volatility spikes” in the context of their era, as they rise above a background which maintained at near-zero levels until ~1980.
It should be noted that the oil markets were heavily regulated by commercial and government interests during this earlier period. Hence, although squelched, volatility appeared to squeak out in spurts when it could no longer be constrained. All the same, two official recessions and a stock market crash can be recognized proximal to and downstream of notable volatility spikes between 1966 and 1979.
The period between 1980 and the early 1990s is fascinating. Within this time-frame three recessions and one stock market crash occurred. Again the "one on one" and upstream relationship of “primary volatility spikes” to economic events is maintained. Perhaps the most interesting event in this time-frame is the stock market crash known as "Black Tuesday". The crash that began on Tuesday the 19th of October 1987 appeared to come out of nowhere, occurring during a period of steady gains in growth in the US economy.
While "Black Tuesday" remains the greatest single-day loss that Wall Street has ever experienced, no convincing answer to what caused it has ever been forthcoming. There are speculations on the role of computer trading, herd behavior by market players and derivatives.
In the historical perspective provided by Figure 8 it can be seen an overlooked factor in “Black Tuesday” is that a large oil volatility transient peaked shortly prior to the 1987 market crash. This spike was caused by a failure of OPEC to stabilize prices owing to "cheating" by cartel members on production quotas. The honorable Saudi's tired of their role as a production "buffer" to counter misbehavior by OPEC siblings and temporary chaos (and hence volatility) ensued in the oil markets.
"Black Tuesday" may turn out to be one of the most significant lessons in the dark arts of the markets ever. It came like a meteor in a time before telescopes or knowledge of heavenly bodies. Its singularity and inexplicably is the "exception proving the rule" that wakeful scientists are always on the look out for. The unexpectedness of this stock market crash spared it a tidy accounting by the press and the mendacities of conventional wisdom.
With the context provided by figure 8 that "Black Tuesday" was the immediate downstream product of an unusually large spike in oil volatility now becomes a reasonable proposition. Indeed, it may be the only explanation that makes any sense - a precipitous induction of investment risk by an oil variance pulse in the absence of an economic downtown. In other words, OPEC gave us an experiment on the effects of a “primary volatility spike” controlled for the confounding influence of an accompanying decline in US GDP.
It is speculated that inquiring minds watching these events as they unfolded over 20 years ago may have become early adopters of the conclusions regarding transient instabilities in oil price and investment risk outlined in this essay.
The insights provided by the oil shocks of 1970s probably laid out the principle for anyone motivated enough to recognize the pattern. Oil volatility pulses at the beginning of the 1980s and the 1990s provided further confirmation of a correlation. But in these cases, one could have argued that the risky investment environment resulted from the economy being in recession. But "Black Tuesday" sealed the deal, by showing that a primary spike in oil price variance was sufficient, in it own right to propagate uncertainty into investment markets, even during periods of steady, positive growth in GDP.
The Number of the Beast is About Thirty or so
In the penultimate step of the data section, an attempt will be made to "drag the beast" into the "light of day". The root cause of our economic woes is postulated as to what the essay now refers to as a “primary volatility spike” – a large, transient variance in the price of oil. It is suggested that “primary volatility spikes” can be thought of as a class of discontinuous phenomena in their own right within the broader category of volatility. The focus here is on oil, but as has already demonstrated, other economic variables (e.g., inflation rate) over the last 6-7 years have also displayed similar discrete spikes.
The ability of large transient variances in oil price to cause economic shock appears to some extent to be dependent on the era in which they occurred. For example, relative to those of the last decade, the magnitude of spikes in the 1970s was small (e.g., inset Figure 8) - nonetheless the dire economic ramifications of these shocks are all too well remembered by anyone over the age of 45.
A simple arithmetic device was used to generate a visual representation of the relative magnitude and frequency of “primary volatility spikes” over the last 43 years. To do this, rolling 5-year averages were calculated from the oil volatility index from 1966 through to 2009. The rolling average for each month was then used to divide the volatility index at the corresponding point for all months between Jan 1966 and Jan 2009.
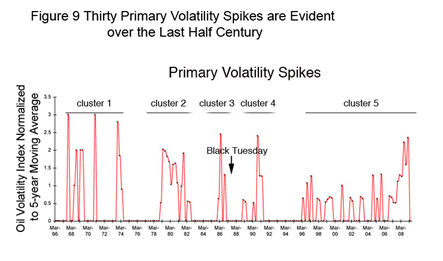
Figure 9 charts the results of this "normalization" of the time series. The plot brings into the "light of day" some 30 “primary volatility spikes”. Within the 43-year time span, these 30 or so spikes are clustered roughly into 5 groups. The first cluster of spikes is in the early 1970s, corresponding to the period in which US "Peak oil" occurred, and the second, third and fourth clusters are centered on the 1986 "Black Tuesday" spike. The fifth, largest and most recent cluster has been the main focus of this essay.

One surprise outcome of "normalization" is that it provides evidence that the latest (i.e., fifth) cluster of instability in oil pricing may have started in the mid 1990s, rather than in the early 2000s as was indicated from earlier charts in this essay. If this earlier onset is the case, it has interesting implications. For example, it could be that the initiation of cluster 5 is diagnostic of the aftermath of Hubbert's peak. If this were the case, then it would lead to the surprising inference that the worldwide crest in oil production occurred prior to 2004.
Alternately, Steve from Virginia has previously made the observation on The Oil Drum that oil price in inflation-adjusted dollars reached its minimum in about 1998-1999- a time that he refers to as "peak oil availability". After this time, it was speculated that as demand grew, supply was not able to keep up, and the effect was felt in price, rather than in increased production. Steve’s hypothesis perhaps provides a more plausible explanation of the increase in price variance after 1996 shown on Figure 9 and this interpretation would also be more in line with an emerging consensus that Hubbert’s peak probably occurred 2004-2005.
Figure 10 returns us to the theme of this essay: the effect of volatility in the price of oil on investment risk. Gold was fingered earlier on as an indicator of perceived market risk by sophisticated investors. Figure 10 provides a nice illustration of how “primary volatility spikes” tend to presage surges in the price of gold. Using this chart it is straightforward to surmise which is the likely "horse" (Therramus suggests the oil volatility spikes) and which is the "cart" (gold price) of the pair.
A small upward blip in gold price (yellow arrow, Figure 10) can even be seen to occur prior to the "Black Tuesday" stock market crash. But consistent with the hypothesis outlined in this essay, this rise in gold price and the large market crash of the following October, both occurred after the initiation of the 3rd cluster of oil price variance spikes.
Finally, note how the start of the fifth and most recent cluster of volatility in the late 1990s precedes the kick-off of a relentless climb in the value of gold over most of the 2000s. If you're curious about what happened to all that money lost during the financial crisis, then one perhaps does not have to look too much further than this veritable mountain of gold with its foothills nestling in the year 2000.
In summary, based on the data of this and preceding sections, the concept of a "primary volatility spike" or "variance transient" is introduced. It is shown that “primary volatility spikes” in the price of oil show an uncanny proximal and upstream correlation with all major US recessions and stock market crashes since 1966. Of specific interest, the stock market crash of "Black Tuesday" may have provided a controlled experiment demonstrating that a “primary volatility spike” was sufficient to cause a major induction in investment risk independent of other factors. Lessons learned over the last 40 or so years on the effect of oil variance transients on investment risk are suggested to have guided the response of the global financial industry to the present crisis. In particular, this information may have provided the rationale for shifts in incentive that led to:
1) the uncoupling of the interests of the financial industry from the broader economy,
2) the expansion and looting of the shadow banking system and
3) the aggregation of wealth by prescient actors in "value stores" such as gold.
Concluding Comments on the Financial Crisis and Conventional Wisdom on its Causes
Divining the cause or causes of the financial crisis 2008 is a problem that perhaps should be approached with trepidation and humbleness. It is easy to be off track when there are so many unknowns. The workings of complex systems such as the economy are ineffable... and well... complex.
Conventional wisdom has already coalesced around a number of probable causes. Top of the list is the hubris and greed of Wall Street. The sub-prime mortgage market is a second much vaunted cause of the crisis.
Attractive as these popular explanations are, this essay imagines an ultimate cause for the financial crisis that differs from the emerging conventional wisdom. At its most essential, this narrative is about the primacy of the laws of physics. Human frailties such as greed are viewed as a necessary, but not sufficient factors in the crisis. Similarly, the sub prime mortgage market and its devilish cousin the “shadow banking system” are seen as downstream manifestations of the deeper process of resource depletion.
This being said, one does not wish to absolve the excess of the financial industry. These people demanded to be treated like adults and left to self-regulate. Unfortunately, in the absence of vigilant supervision the moral pygmies of Wall Street took to playing with matches and eventually burnt the house down.
It should be emphasized that the hypothesis posed here does NOT constitute an organized conspiracy. Those caught up in the fin-de-seicle mentality that lubricated the financial crisis do not have to know each other or openly share their concerns. Given the right seedbed, timely ideas propagate like weeds. Simply put, the idea proposes that economic disruptions wrought by instability in the price of oil leading up to and following Hubbert’s peak provide a key to understanding the financial crisis of 2008.
Pricing unpredictability in oil - our most fundamental energy resource - is suggested here to be the sole factor that is both necessary and sufficient to explain the debacle. All else, bad behavior of Wall Street included, is proposed to self-organize and flow downstream from the effect of volatility in the price of oil on investment risk.
About Therramus:
Therramus is a neutered Tom. He can be contacted at therramus@gmail.com.
Contact
- Content: editors at theoildrum dot com
- Tech support: support at theoildrum dot com
License

This work is licensed under a Creative Commons Attribution-Share Alike 3.0 United States License.
This is a most excellent analysis that is well reasoned from evidence, well presented and informative. It's also predictive, but I wonder how much so once all the curious but perhaps not early adaptors learn of the relation of oil price volatility as a leading indicator of economic downswings and gold price spikes. I guess we could ask Greenspan his opinion, or just wait out the next spike phase pair. Of course, many here, myself included are wondering how many more pairs we can handle. Anyway, bravo Terramus!
This is not a good analysis as it completely misunderstands the correct use of the standard deviation. See my comment below.
Crobar - you miss how arithemtic is being used here to support the arguments. This is NOT "normal" stats. Check out later comment of Grouneau - " I wonder if the arithmetic was provided without the term "standard deviation", if you (i.e., Crobar) would have the same problem with it. The point seems to be to get a positive definite "derivative-like" number to represent the volatility."
If he's not using "normal" stats, why does he use standard stats formulas and language. I would not have had a problem (at least not this problem) if he hadn't used this language, but he did, and it is misleading.
Thanks for reading the article and your kind comments. The potential for coupling between the patterns for oil and other economic variables was the most interesting aspect to emerge as the work proceeded.
You're right - its going to rough ahead - there may be things that need to be done to mitigate the consequences. Meaningful reform of the financial industry (e.g., re-instatement of Glass-Steagal and strict regulation of the derivatives markets) might provide the first necessary steps - especially with respect to protecting the poor and economically vulnerable.
I don't see why you chose a 2-point moving standard deviation for your "index of oil price volatility". For two data points, the standard deviation formula resolves to just the absolute value of the difference divided by the square root of 2. That measure is not normalised to the current running mean. Hence it has the unfortunate characteristic that, for the same relative change in price, it must grow as the price grows - as, indeed, it does.
What you've got is really just the dollar price change per month (over root 2) - that is absolute price volatility rather than relative price volatility. In practice, your index is as much a measure of the current price level as it is of relative volatility.
Doesn't that explain a fair bit of what you've observed? And so don't we mostly end up with another Hamilton-style oil price rise causes economic collapse story?
Thanks to Therramus for taking the time to tinker with the data and to propose a testable theory about oil price volatility. I think the idea has merit; however, like Gergyl, the use of the 2-point moving standard deviation struck me as odd.
My suggestion would be to collect daily oil price data, calculate a monthly average and calculate a monthly standard deviation, then calculate percent relative standard deviation for each month. This would give a percentage value for %RSD that might be a better measure of monthly price volatility. You could also just use the monthly price range divided by the monthly mean X 100.
*
Hi Bigdoug,
Tks for the suggestions.
I may tinker some more using the approaches you suggest.
Also would direct you to my response to Gergyl below explaining why I went with an absolute measure of oil price volatility as opposed to a mean normalized index.
Asterisk above was me trying to figure how this commenting thing works - I wanted to make sure my comment was directly under yours.
Best
Furthermode I believe the error in the estimate of the standard deviation (SD) is given by:
standard error = standard deviation / sqrt(n)
Where n is the sample size. This error is the expected error in your estimate of the actual SD from your sample of the population.
i.e. in one case the first two values are $22.50 and $16.00 giving an SD of 4.60. The error in this estimate of the SD is SD/sqrt(2) = 3.2527. So the actual sd could be anything between 1.35 and 7.85
Also, the highest standard deviation occured during the crash in oil prices, with values previous to this time being close to this error range. The error range is probably not even calculated that accurately because of the small number of samples.
Using two values to estimate the standard deviation of anything, is absolute nonsense and completely misuses this statistic.
EDIT: I should also add that the standard deviation calculation is accurate when the data is normally distributed, which price data almost always certainly is not. So you are using a statistic incorrectly on data to which it does not really apply.
I'm sure you're right. But it's the non standard deviations from the managed glut price stability that are playing hob with the system and confidence in it. Not to mention the deviant nature of the executive salaries prevalent today. I'm sure by the time all the stats have been fully analyzed on the Apocalypse we will see that we went to hell in a handbasket at N to the umpteenth too fast.
That's very cute, rock-lizard.
Consider a normally-distributed population of pins. Some have round heads, some flat, some broken. And a similarly normally-distributed population of angels, some fat, some skinny, etc. Then, what is the number of deviant angels that could straddle two pins?
cobar, I can't argue with your strick interpretation of "standard deviation", but I wonder if the arithmetic was provided without the term "standard deviation", if you would have the same problem with it. The point seems to be to get a positive definite "derivative-like" number to represent the volatility. There are any number of ways of doing so mathematically. Is there some standard definition of "volatility" that should be used instead of the one presented?
One thing we have learned from Taleb and the science of fat-tail/gray-swan statistics is that the Normal Gaussian distribution isn't like some iron-clad standard. A fat-tail distribution like the damped exponential has a standard deviation equal to the mean; and the maximum entropy principle suggests we use this kind of distribution if we have no knowledge of the variance. That is all I use for oil depletion calculations and it works out quite well.
There are many, but as WebHubble also points out above most are not applicable to data which is not normally distributed.
If the "standard deviation" was not meant, he could have just used the word "deviation" and desrcibed the formula he was using. However, it seems the formula for standard deviation was in fact used, and used incorrectly, and the "standard deviation" in my strict (the only?) sense was what was actually meant. Therefore he is using well known statistics incorrectly to give a false impression.
Yes, except that Hamilton is a respected economist with a specialization in oil markets, writes more clearly and is not anonymous.
These two pieces, in my view, are a better starting point for readers interested in this topic.
http://www.econbrowser.com/archives/2009/04/consequences_of.html
http://www.econbrowser.com/archives/2009/11/will_rising_oil.html
I don't want to take anything away from the author and do admire the effort he/she put into this. But since it has been given earlier treatment by acknowledged experts, I have trouble seeing how this lengthy piece adds much.
Having a different way of looking at things adds another perspective, even if it isn't as polished as that of someone working in the field.
The graphs aren't ones we would have thought of. They provide some new insights, and may inspire other readers to put together other graphs, which may provide even better insights.
Insights based on innapropriate and incorrect use of statistics. I appreciate that the professor is only doing this for a hobby, which is why I blame you as editor for letting this post get through.
Hi Crobar,
Statistics and derivatives are a lot alike - the intentions accounting for their invention were good but somehow human nature took over.
This being said, I'm not sure what I'm doing here is statistics - parametric or otherwise. Certainly not calculating p values and using it to gauge mean separation.
I am a simple and enumerate guy. I used SD to get a numerical estimate of spread - saw a pattern in time and then noted relationships between the first pattern and succeeding ones - that's all. The patterns in time or their relationships were not obvious from simple scans of the base index (e.g., oil price) over time - at least to me.
If you think that what I have done is not helpful to you - then so be it. However, my screwball perspective may crystallize for others what is obvious to you.
I can't help but think you are only digging yourself in deeper here:
The only similarity is that you don't seem to understand either one of them.
I don't have any problem with you writing this piece, but don't think TOD should have published it.
There is nothing wrong with being "simple and enumerate" or lacking a even a basic understanding of finance.
But is is a horrible qualification for writing a quantitative finance piece that makes such strong conclusions.
Hi Jack,
I can appreciate your irritation. You sound like you work in business, finance or economics. If I were reviewing a hypothesis from you in my field of research (developmental biology) I'm sure you'd piss me off as well - which is not to say that you may not have good points and even a worthy hypothesis. Its just my first reaction would be against unfamiliar language and an odd manner of arguing a case. Basically I'd ask myself "Who does this dude think he is?" - condescension would then likely ensue.
You'll probably note that alot of the language in the essay is borrowed from biology e.g., induction and downstream (used in developmental biology), variance transient (think voltage transient in electrophysiology) etc.
Its true - I've never read a book on finance or oil economics - and in all likelihood won't ever. Its also true that I have rarely read text books on molecular biology until I had to for teaching purposes.
On English not being my first language - I guess the Queen's English is not my tongue. I am a colonial Scot and proud of it.
I'll await your further text before responding further - I notice for example that you have not replied to my previous response to you on Professor Hamilton's work.
As a biologist, you really should have a better grounding in statistics. Most biologists I know have
to take a stats course as it is fundamental to understanding scientific results in any field. Note I am an engineer, not a financier or businessman.
I wonder why so many comments are parsing the methods instead of looking at what they are saying and speaking to that issue?
Quite likely that the energy situation did drive all or some of the greed that was spawned as a result in the financial world as those in that world are always looking for profit and playing dice with the universe(or planet). The rest of us sheeple are the ones to be sheared.
Its for sure they used the numbers game to advantage to cook books, so to speak.
So long term then what does it mean? Means to me that they won at the tables.
We keep guessing at the charts which indicate the point of peak oil. Yet we know deep down that it doesn't matter too much in the end. We played it wrong. Or those who were supposed to 'lead us' looked the other way while it was going down.
All those lauded audits? Where? All those lauded accountants? Where? All the overseers? Where?
Cooking books.
Airdale
*
Hi Airdale,
Concur that a certain amount of "missing the wood for the trees" is going on here.
It was my objective to subject the hypothesis and its data to a kind of peer review. In fact I wanted to get the sophisticated and numerate types at TOD group to look at the specific nuts and bolts of the essay... looking for errors in the math and so on.
The essay began to be posted last January at the idea Wiki and has NOT generated a single comment. Gail's posting of the essay today has generated many new inputs, including yours - all of which are appreciated.
Agreed that what has happened is an absolute scandal. The "Shadow Banking System" apparently came to accumulate 10x the annual GDP of the entire world. One has to ask -if this is not FRAUD - Where are the other 9 planets ?!
Ah yes, well you will most certainly get a very good 'going over' here on TOD.
Put on your heat proof work boots though and ride it out.
And welcome to TOD, where usually there is never a dull moment.
Airdale
It is not very usefull the way it is now. When the methodology errors are fixed, if the results hold (what seems likely), then it will be both an usefull and important essay.
As an aside, I'd like to see comparations with other comodities, like steel, and weat.
Well then are we going to fix statistical analysis endeavors or are we going to fix the planet?
There is something from the past about a fella playing a fiddle?
We are still not sure exactly what an electron is(wave vs particle-changes sometimes,etc) and certainly the Uncertainty Principle plays a large role BUT we can , if one simply treads the paths of nature make a observation as to what is happening.
You can't do it in one day. Or on vacation but there are those who do live close to nature
and could see what is happening if they weren't so busy RAPING her.
Airdale
Airdale
Really? How else are we supposed to separate fact from non-fact? We could have a discussion of this level on a drumbeat, I expect better in a full post.
Yes but you are crystallizing incorrect ideas, or at least ideas without basis, that is my problem.
If what you are doing is not statistics, why have you used statistical language and standard statistical formulas? Why not say, "here is my measure of volatility, which I have come up with and here is the formula I will use", and give the reasons for using that formula?
I suggest that you used the standard deviation because basically, it sounds more professional, and makes your argument sound more plausible and scientific to those who do not know much stats. I don't think you've done this intentionally to decieve people or anything like that, I just think it sounded good when you wrote it down, so you stuck with it.
By the way, I am an engineer, not some mathematicion or financial guru. Every scientist (you mention you are a biologist) will or at least should have done a stats course at some point and has no excuse for not knowing when and how to apply the standard deviation.
We should all open our apertures. The measure of variance is also known as the second moment of a probability distribution and the square root gives the standard deviation. My point is that someone's description in statistical terms can be converted to a probability view. Probability and statistics are really distinct concepts, and if one person screams about misuse in one view, somebody else can gain a more firm understanding in the other. (if you want this concept reinforced, read The Black Swan, or look at the ongoing war between the Frequentist and Bayesian schools, or read stuff on maximum entropy)
Crobar, I know you realize this because you were the first to suggest the caveat that the standard deviation as applied in classical statistics really only applies to Normal distributions.
So are you saying that this is a good analysis that has increased our knowlege, and that the author would understand the points you are making? I have read The Black Swan (and Fooled By Randomness which was much superior in my opinion). If you have read Taleb then you will be familiar with his ludic fallacy of weaving false stories out of the past. This is a good example of this.
I jumped on the author about the standard deviation because he dressed his analysis up as a thorough statistical review and I could prove he was using it incorrectly. I didn't even want to get into how, even if he had used enough data, and had applied the statistic correctly, and had given errors for his estimates, that the second moment cannot actually be calculated for non-normal data in any case! That, as they say, is a whole another kettle of fish.
His analysis was supposed to be frequentist, or at least used frequentist formulas and language, it was clearly not bayesian or probabilistic.
Yes, I understand where you are coming from. Therramus is looking for some correlated indicators to tie some causality to. I usually don't follow this approach as I invariably would rather start from a model that tries to predict the behavior.
The exception is upthread where I naively tied a peak curve to Steve's graph
http://www.theoildrum.com/node/6025#comment-568127
So, yes, if you don't have a model you need to the right statistical analysis to establish confidence limits. And even that may not be good enough.
Fair point on care with wording - I should have been much more assiduous in explaining how I was using SD. I'll also own up to a similar issue with my use of the word variance (i.e., SD squared). In the original Idea wiki it was discussed early on that SD was being used as a proxy for volatility. In editing down the Wiki essay from over 20,000 words to <6000 for The Oil Drum maybe I lost a few things in translation.
I agree. I respect the effort that the author has put into this. But he/she seems to lack even a basic understanding of finance and doesn't appear to have made the slightest effort to refer to existing sources of information (a five minute review of "Principles of Corporate Finance", for example, would have led to significant edits). The result is an error ridden and misdirected piece that is not anywhere near TOD standards.
Aside from the "inappropriate and incorrect use of statistics", the entire argument seems to be based on speculation dressed up as understanding.
The author speculates that volatile oil prices increase investment risk without providing any real evidence that oil prices are more volatile than they have been or that he/she has even the vaguest comprehension of what investment risk means. It seems clear that he/she doesn't realize that only a small portion of oil is transacted at spot prices and that much of the risk can be offset through hedging.
Using the price of gold as a proxy for risk is ridiculous. Gold prices have been influenced by liquidity, concern over dollar strength, fear of inflation and to some degree concern over risk.
One gets the impression the author couldn't be bothered to even open a basic finance text to get an accepted definition of risk, or worse found that those didn't support the overall argument he/she was trying to make. Cost of capital, cost of borrowing, market P/Es, and asset prices would all be better indicators of risk, but don't support the story line.
Quotes such as this one…
..show that the author doesn't even understand that correlation is not causation. Maybe he/she should have looked at copper prices. BANG. They were up too. Why?
Then as he/she tries to grope for conclusions, the author wanders into a bout of pure speculation without any evidence at all. The entire treatment of “cashing out” lacks an underlying argument, any supporting facts, or a basic understanding of what "cashing out" would actually mean.
The author refers to the “shadow banking system” several times, without any discussion of what it means. I challenge him or her to provide a definition of what the shadow banking system actually is. I am sure that neither of us know.
If I tried to write a piece like this about some engineering (or actuarial) topic in which I was miles over my head, I would get ripped to shreds on this site. But since it is finance, I guess anyone is qualified.
Just imagine if I tried to educate the engineers here about the significant lessons in their “dark arts”, after starting out by saying I am not an engineer.
I can't muster a single response to this except "what a pretentious fool".
The last sentence in the article itself reads:
I don’t even know what that means. And what about this:
Has that been edited? I am guessing that the author's first language isn't English, which excuses him/her to some degree. But editors should make sure what is written makes sense.
Sorry Gail. I do appreciate the good work that you do here, but this piece is sloppy, inaccurate, badly written and doesn’t provide one single iota of value that is not already provided by Hamilton (who the author appears oblivious of).
It is 2am here in Bangkok, so I will be offline for a while. I will be happy to reply in detail to any comments in the morning.
My own intuition on macro-finance topics leads me to believe that game theory arguments play a huge role in every market move. This might sound promising but many researchers think this leads to a dead-end since no one (and no computer) can actually solve game theory and Nash equilibrium problems. And if someone could solve them and accurately predict market movement, this would cause a correction in that market and completely invalidate that model's solution. That thorny outcome in fact describes the essence of game theory.
Then we have other people that suggest that we shouldn't even consider equilibrium arguments, which probably makes it even a harder problem.
Therein lies the conundrum of trying to figure it all out. Not that it doesn't make for entertaining reading.
Hi WebHubbleTelescope,
You seem to have a deep grasp of the processes at work here. Can't offer a cogent response - your math is above my pay grade. Nonetheless, appreciate your insights.
Best
Hi Jack!
How's Thailand?
A friend will help you move.
Unknown photographer 'Al Capone and associates'
A really good friend will help you move a body.
A new article from John Hussman, PhD:
I'm sitting here at the table beating my fist going, "Why, why ... why? Why do you think they are doing this?"
I can't believe Hussman can write this down and still dance around the obvious conclusion; the Fed is running a racket. What is the end point of the Fed's ad hoc fiscal policy? If a policy cannot be conceived as a success at the beginning, why would it be implemented? The GSE- agencies that traded trash for cash are bankrupt, the banks that have also traded their trash for cash are either effectively bankrupt or will be as they are not making good loans. The Fed knows this as they have armies of bank examiners. The insolvent banks are receiving free money from the central bank with no strings attached! What sort of monetary (or fiscal) policy is this?
Bernanke under pressure from the Senate admits that he was wrong to not recognize the property bubble. How can he not know that the securities his organization receives from property lenders can only return to par if property prices return to bubble levels? He knows and makes the trades anyway!
What Bernanke really knows is who is friends are.
A lot of other finance observers call Bernanke and the Fed onto the carpet for monetary mis- steps: Mike Shedlock's Fed Uncertainty Principle, Karl Denninger, as well as most of the other writers who share this space. Where I claim a distinction is this:
The observation on their part that the Fed expects the economy to return to normal at some point with a high level of energy- fueled growth. My observation is the Fed and much of finance are smart like me, they expect no such thing!
The game is over and they are taking the balls home. All of them. It's every man for himself and devil take the hindmost.
To believe otherwise, that there is potential business growth in the future, finance would act otherwise. Banks would be aggressively marking down their own bad loans, purging their balance sheets and competitively asking the public to critique their banking functions. The aim would be to restore confidence and gain a competitive edge against other banks. Yet NO BANK is doing this; they are engaged in paper speculations, holding loans off the books until they can be sold to the Federal Reserve for cash or traded for Treasuries whereupon these are sold for cash. They wink and nod at the FDIC. They are operate like banks did in the early 1930's, speculating on gold or other derivatives as a substitute for ordinary business until the end.
The difference was widespread uncompensated failure of banks in the Depression; free no- strings- attached funds for the banks in the present!
What Mr. Hussman refers to as compromising depositors and taxpayers to benefit bondholders. He's too careful to come right out and say the Fed is running a money laundering operation.
We have a situation where the Federal Reserve engages in a widespread international campaign to devalue the dollar, to make it cheap and generate revulsion overseas - 75% of US currency holdings are overseas - and to call it home where it can be swapped for worthless securities.
Where the Fed's primary dealers pump up equities markets to facilitate the laundering of worthless stocks such as AIG and C into cash. Where the Fed buys Treasuries directly to turn the government debt market into a cash fountain. Where the Fed swaps dollars overseas to unknown proxies under unknown terms to benefit unknown parties. Where these and other practices could never be consistent with prudent monetary practices as the consequences have repeatedly led to default and money panics ... yet the Fed does just these things!
By its actions the Fed and its closed circle of cronies has made a bet against the finance future of this country. Having made the bet - that the finance casino has run its course - the insiders are cashing out. The manner of their cashing out suggests they have no intention of coming back.
No intention of coming back! Hello!
At the practical level, cash and 'power money' is fleeing the economy. The outcome of the money laundry added to the general deflationary shrinkage of lending multipliers and the tailing off of fiscal stimulus is effective monetary tightening. Interest rates are on the razor's edge. Less public borrowing and high fuel costs are pushing on them. Money costs overseas are also rising. Japan pushes to devalue the Yen ... the circle closes on the short- dollar trade.
If Bernanke is not re- confirmed, the Fed money racket will likely collapse. Any replacement will be more of a dollar bull. The Senate vote in January becomes very important.
The consequences of a Bernanke exit will mark the end of current 'mystery markets' where trading action defies sense and sensibility. Interest rates will rise whether the Fed acquiesces or not. Stocks will decline along with the other 'laundry' trades. There will be more business failures and earnings will reflect the current, fuel constrained growth prospects. Gravity - and thermodynamics - will assert itself.
Hussman does come out and predicts an equities correction. He's being cautious and speaks 'fund manager- ese'; he's also realistic. Our markets are now crime scenes. All that is needed is the yellow tape.
http://economic-undertow.blogspot.com/2009/12/knowing-who-your-friends-a...
NOTE: The cashing out process began with Goldman shorting its own mortgage products in 2007. The smart money is already out of the market; $2 trillion is a lot of cash. The finance 'remainders' aren't rocking the boat because they are hoping to cash out, themselves. At some point the 'dumb money' is going to see what's going on and then things will get interesting.
This is meant purely to draw some discussion and a guide-to-the-eye, but that curve looks like it was heading for a peak before it went hay-wire.

And that is not a cumulative money supply; money reflects the current situation not an accumulated amount. What Steve has said in the past that you can detect peak oil just by folloing monetary indicators.
Some mechanism started detecting a peak inflection point and an open-loop mechanism kicked in to compensate?
"Why, why why do you think they are doing this?"
Steve, this anger and frustration of yours can be tamed! Just read pages 310-311 of Nicholas Georgescu-Roegen`s book The Entropy Law and the Economic Process. That`s what I did and it worked for me!
From this book:
"Pareto explained how every elite is overthrown by a jealous minority which stirs the masses by denouncing the abuses of the establishment and finally replaces it. Elites, as he said, circulate. Naturally their names and the rationalizations of their privileges change. But is important to note also that each elite inspires a new socio-political mythology by which the new situation is interpreted for the occasion, Yet the same leitmotiv runs through all these self-glorifications: "where would the people be if it were not for our services?"......But the fact that every elite performs services which do not produce a palpable, measurable result leads not only to economic privileges...but also to abuses of all kinds."
You might as well get mad about all the unnecessary cement covering over good land and messing up the ecosystem. Or you could get mad at the smog covering the sky. Or all the plastic drifting in the ocean causing tons of environmental damage. Go ahead. Along with the abuses in the banking system these are all just the natural outgrowth of humnanity`s encounter with oil. The scale is vast but the essential pattern (feeding off of an energy source and growing from it) remains intact.....
The elites know that there is no point in reaching the top where the "controls" of the system are located if they can`t use this to their advantage.
Hi Jack,
Ouch...or maybe Wow.
Was hoping to see you back this morning. Your passion for TOD appears to be strong.
Had to put on the old "ego filter" to go through your post - but did find at least one on target criticism. In fact, this issue has been bothering me for sometime now. Don't think it's a fatal flaw - but wondering if you can figure out which of your scatter shot above is still stinging ?
As an aside Professor Hamilton swiftly zeroed in on this problem in his brief correspondence with me in April.
Best
Cleaning up prior to comments closing down in a day or so.
Jack hit the road, unfortunately.
For anyone curious as to what I was referring to in the comment above it was Jack's earlier statement that -
"The entire treatment of “cashing out” lacks an underlying argument, any supporting facts, or a basic understanding of what "cashing out" would actually mean."
Fair point. This part of the story remains bothersome and fuzzy.
Gail,
Thanks for the input. Obviously, I concur.
Hi Jack,
The idea wiki essay was started in 18 January 2009 and Figure 5 showing the coupled pulses of oil and inflation rate "volatility" was added on March 9 2009 - as recorded in Wiki "history".
As such the the main element of the essay was independently in place prior to the April and November papers from Professor Hamilton.
This being said-after reading Professor Hamilton's Brooking institution paper in April 2009 I emailed him and asked is he would comment on my Wiki. He was kind enough to write back and offer some critiques- a gentleman indeed.
I will alert him to todays post - perhaps he will offer some thoughts.
Yes, and that is precisely what we might expect if we accept the premise that our economy is built on a form of energy that is exhibiting a continuously diminishing EROEI. No?
Hi Gergyl,
Tks for the comment.
You're break down of the math seems correct. I used a simple approach (by necessity - I am not a mathematician) to measure spread and used a rolling estimate of bi-monthly SD to achieve this.
The usefulness of the approach for me (and agreed it is unconventional) as I tinkered with it was in the distinct temporal pattern that resolved when graphed. The spikes in the oil volatility index (Fig 5) provided reference markers in time that enabled discernment of relationships with the other variables plotted.
To put this another way each spike in the oil index appeared to stand as a staging post for a subsequent and downstream unitary spike of heightened change in the respective volatility indices for inflation rate, the S&P 500 stock index and gold price. It was these relationships that got me thinking about a possible sequence of cause and effect.
You are correct that the index calculated provides a measure of absolute price volatility. Two things.
First, if you look at Figure 9 I do provide one graph that attempts to get at an index of relative volatility. To achieve this normalized rolling 5-year averages were calculated from the oil volatility index from 1966 through to 2009. The rolling average for each month was then used to divide the volatility index at the corresponding point for all months between Jan 1966 and Jan 2009.
Second, I did think about using mean normalized SD (i.e., coefficient of variance) but decided against it as I thought it would have provided a dampened index relative to a measurement based on the absolute variability in oil price. I surmized that the SD of oil price volatility (and not coefficient of variation) would be more proximally related to increasing investment risk - which is where I wanted to take the arguments that were developed later in the essay.
The approach used is not perfect. However, the aim was NOT to clear the forest, but to cut a narrow path through it. As you and others point out my approach tends to accentuate volatility. However, I think I faced a classic signal-noise probelm. The pattern may not have been as obvious if I'd "turned down the gain" and used an alternate approach.
A strength may not be so much in the manifestation of single peaks (which may be noise), but in the multi-year nature of the pattern that emerges - further reinforced by the correlated patterns with the other variables looked at. The human brain is capable of all sorts of narrative fallacies - but it was hard not to look at what I saw emerging as I played with the numbers and not conclude something interesting seemed to be going on.
Regarding Professor Hamilton - in reply to Jack later in the comments I point out that the core parts of my essay - namely the hypothesis and all figures up to Figure 5- were posted on line before both papers by Professor Hamilton were published on the relationship between oil price and GDP.
Some comments above are way too harsh (mine too?). The concept of a volatility impact - as opposed to a price level impact - is interesting, and doesn't get much attention in Hamilton 2009.
My point was just that your chosen volatility index is contaminated with a strong raw price signal, so some of your observations may reflect simple price increase rather than volatility. I saw the rolling average thing and understood it as an attempt to address that, but a better up-front choice of volatility index might have avoided the need. Perhaps Hamilton will suggest one.
Increasing market volatility with increasing scarcity is no surprise. I agree that the current scarcity process began in the late 90s - it's there is the raw price signal (below, log scale). But there doesn't appear to be much increase in relative volatility (wiggliness within the price channel) until quite recently. There's a strong burst of volatility from 1998 - early 2002, then nothing much until the 2008 spike and collapse. Those are the places where the price breaks the inner channel.
Hi Gergyl,
Thanks for getting back and your plot.
You're right - if I am saying anything useful (and perhaps distinct from Professor Hamilton) it is that primary volatility spikes are unitary phenomena that once above a certain threshold may propagate pulses-like effects into other important economic variables.
Maybe its my background, but I began to think about the spikes by analogy to a well known unitary phenomena in biology -the action potential e.g., such as those driving the heart beat. Extending this a little further maybe an above-threshold volatility spike in oil price triggers a reactive twitch in inflation rate instability in a manner analogous to an action potential triggering the contraction of cardiac muscle.
I could go on (and on) but lets hope the economy is not going into ventricular fibrillation !
Good plot however I think that we are now on a new channel i.e the wrenching price change was a transition point to a brand new channel just like the price minima at the start of the channel your show.
Exactly what this new channel will be is obviously not yet clear however I'd argue projecting the old channel forward is not the correct approach.
However my current estimate is that your green projection is actually either the upper or lower bound of the new channel. The MSM claims its the upper bound.
I of course feel its the lower bound. In fact if you go with the assumption that we just now entered the lower bound of our new channel then it upper bound is somewhere at 200-300 or so to early to know the slope for sure.
Or we just peaked near the top of the new channel and prices should now fall over the next several months.
I've posted several times that we need to see how things go over the next several months. Your post hopefully illustrates that its not clear yet whats happened.
Perhaps we are on the old channel I really doubt it but the next channel is not well defined it could just happen to line up with the old I'd argue that more likely its a new channel forming displaced significantly vs the old one. Regardless its literally to early to know and you absolutely need 3-4 more months of data before you can even begin to guess whats happening.
It's ace's projection from back in May, not mine. I see he's recently updated, but haven't looked to see if he's moved much. AFAIK it's just a classical elasticity calc based on his megaprojects-guided supply decline estimate. Looking good so far, but early days, as you say. Like someone said, watching paint dry...
Gergyl,
Do you have or know where I can get my hands on the raw data from which this chart was generated ? If so, would you be so kind as to email them/it to me - Therramus at gmail dot com.
I'd like to play with these numbers some. I could re-generate it myself from log transforming numbers I have in hand - but it would be helpful to have the actual data this plot was based on.
Best wishes
The way that volatility should be measured for any price series is the volatility of change, not raw prices. Otherwise changes is nominal price would improperly imply higher volatility. This can be done easily through a logarithmic transformation of the price data. The method used here exaggerates volatility.
Hi Kingfish,
Thanks for your suggestion. I may do a log transformation - though have an idea I already tried this. Will have to look at my notes. May have not gone with it because of my desire to keep the index as simple as poss.
Please also look at to my comments to Gergyl on why I went with the absolute index used. In brief, it was mainly because the focus was NOT on the amplitude of the spikes, but on their timing and in turn, the timing of oil volatility spikes in relation to the volatility of the other variables examined.
What caught my eye was not individual spikes (which when taken alone are probably difficult to distinguish from noise) - but the distinct pattern of spikes that emerged after 2004. This sequence of repeating spikes was quite unlike anything that I could see on the chart of the 40 or so years prior to 2004.
Back to the reality what our politicians think of oil prices and their function, here the new Liberal leader in Australia:
He might be right with "all sort of things suddenly become possible" but not in the sense he is using that term.
Read more in my post:
New Liberal leader did not know what peak oil is
http://www.crudeoilpeak.com/?p=727
The high volatility in oil prices is actually one of the reasons why it will be so difficult to develop alternative fuels.
Back to the reality what our politicians think of oil prices and their function, here the new Liberal leader in Australia:
*REALITY*?!!
What I'd like very much to do do is put our idiotic leaders and their delusional non scientific economist soothsayers and toss them into Dara O'Brian's "Feckin Sack" along with all the other morons and liars that are already in there and start whacking away at the whole lot of them with some sticks.
http://www.youtube.com/watch?v=VIaV8swc-fo
It's a good chuckle.
FMagyar, you do find some good ones!
One heck of a piece of work. Amazing in the detail.
I haven't read it all but one single sentence struck me hardest.
To wit:"Top of the list is the hubris and greed of Wall Street."
As we recall the financial district suffered the WTC terrorists attacks to the tune of about
3,000 dead in Sept 11,2001.
The nation as a whole turned out in sympathy and grief and literally thousands of us went to their aid. We wept, we were humbled and we did all possible to assist there.
Then the smoke cleared and life resumed and what then occurred?
This is the way they paid the US Citizens back? This is the filth they became or already were?
Many good people died then.Some apparently who were not so good people.
They then 'attacked' their own kind,the citizens of this nation. This is what we now understand. They are crooks.We now suffer as a result and many are suffering due to their actions in the financial world.Loss of jobs. Loss of investments. Loss of homes. Families barely getting by. Our nation sinking slowly to third world status.
Shadow banking? Thief on a massive scale. No punishment rendered. When if ever will punishment be meted out? Never since some of them are now in Government and still controlling.
Folks we are fighting the wrong war in the wrong places. Where is the anger and screams for punishment? Nowhere.They are still at it. They must have taken up a new screed "Take it all, every bit for we deserve it for bad times may come and we rule."
Who watches the watchmen?
Airdale-can anything else be 'taken away' from this? I have just finished paying off ALL my debts. One small ,very small one remains to be removed in a few months. They will NEVER again make any profit that I can prevent.
Airdale --
You pay property taxes, do you not?
At least where I live, I can easily lose my house -- on which there is no mortgage -- to the "government" if I fall behind in tax payments -- whether voluntarily or not.
Getting out of debt is good, but nothing will protect us from the predators. If the banks and the government don't get you, then the bacteria and the worms will.
Eat, drink, be merry. It's what there is.
NeverLNG,
Actually I pay no property taxes. We have a homestead exemption here and I have reached that mystical age when it kicks in.
I do have less , far less, land than I did before and have reduced my lodgings as per size and value and far easier to heat. But I have enough land still that is not classified in all as 'open' and gets a smaller value by the administrators.
Yes just about totally out of debt. And with my pension and SS I get by quite handily.
But of late the local hometown banks I find have stepped up their programming to charge more and on lesser reasons. Also they will jump on defaulters in a N.Y. heartbeat. All of this is hidden in the small print that most do NOT read.
My goal now is to keep warm this winter. Right now we are in almost blizzard conditions but little precip.
Airdale
Do not go gentle into that good night
Rage
Rage
Against the dying of the light.
I believe there is more to life than staying warm.
And I believe you do, too, Airdale.
Otherwise, why would you be on this sometimes tiresome blog?
Never,
Sometimes staying warm is a clue word for being comfortable.
Yet in the winter as a lad on the farm we stayed around the old wood stove in the combination , kitchen,grandparents bedroom ..the biggest room in that old wooden uninsulated farm house.
Many good times there.
I love wood heat. Reminds me of the past and helps me prepare for the future.
Why on this blog? To try to 'make a difference' and to speak for nature. Since I see nature up close and person and because not too many farmers(or homesteaders if you will) actually post here and of those only a few have worked in what I call Big Ag(modern farmers).
Thanks for the reply,
Airdale
Excellent insight Therramus.
May I encourage you to now look at the corresponding underlying factors of US Congress legislation, and OPEC production cuts/constraint on top of Non-OPEC oil peaking.
Clinton and Congress mandating a “special affordable housing goal” in 1992 (12 U.S.C. §4563). This pushed very low income mortgages up from 27% in 1999 to 54% in 2008. e.g. HUD (2000) required that 42% of all taxpayer backed mortgages go to those below the area median income. To achieve these Fannie Mae’s 2006 “Home Possible 100" encouraged borrowing up to 105% of home value to include closing costs. etc. i.e. standing dominoes on end.
Jean Laherrère showed oil price increases led to unemployment increases the following year.
See Figure 66: US oil price (log scale) and unemployment
in Peak oil and other peaks, presentation to the CERN meeting 3 Oct. 2005
Non-OPEC oil peaked in 2004/5. OilWatch Monthly Nov 2009 Figure 8
OPEC constrained and then cut back crude oil production in 2005/6. See OilWatch Monthly. Nov 2009 Fig 3.
These magnified fuel prices. The fuel spikes increased unemployment which set the mortgage failure dominoes falling.
Hi David,
Tks for your comment. Will look into your suggestions.
Looking at the relationship between volatility and employment is an interesting prospect- regret did not do this previously.
Best
Linking the 88 market crash with an oil price spike, as it then correlates to later oil price spikes and their effect on volatility in the markets and inflation, is genius.
Based on the timing of those 7 volatility pulses in oil price, followed by the biggest recession in 50 years, is there a time frame suggested for the next price spike? Or, would the next spike be harder to time due to the slow economic recovery currently taking place?
Hi Perk Earl,
My wife, after reading your comment, will be taunting me for at least the next week... so thankyou, I guess : >)
To be honest - seeing the link between the "Black Monday" crash of October 1987 and the oil volatility spike in the previous year became kind of obvious once I started to look at the temporal co-relationships between the volatility indices for oil and the S&P 500 over longer times frames i.e., the last 40 or so years.
It took a while to get to that point, but based on what I was seeing between the narrow 2004 and 2009 timeframe - when I eventually co-plotted the two indices back to 1966 it just jumped out as self-evident.
This type of unexpected insight has been a part of the fun of doing this. Certainly did not anticipate that somehow a new idea for explaining the great stock market crash of 1987 might pop out.
As a correction - I note I mistakenly call the "Black Monday" crash the "Black Tuesday" crash in my essay - my bad. Black Tuesday happened in 1929.
Your last question is an interesting one. Dislike prognosticating - but as mentioned earlier, can't help but think that eventually another tidal wave of price volatility will crash into shore and we will again all be running around wondering why we're soaking wet.
Suspect that dismemberment of "too big to fail" financial institutions, re-instatement of Glass-Steagall, strict regulation of derivatives markets, dismantling of the "shadow banking system" and encouraging Larry Summers to return to academe will all eventually become not just necessary, but imperative.
On the positive side - an eventual broad recognition of the immediate danger presented by spikes of oil price instability to our economy and political system may turn out to be far more effective in weaning us off oil than more far off concerns like the world's supply of oil running out or us burning sufficient of it to kill our beautiful planet.
Both standard deviation as well as CPI (in part) are derivatives of the price of oil. It should not be a surprise that there are correlations but drawing conclusions from that seems "aggresive".
Rgds
WeekendPeak
Hi WeekendPeak,
Tks for the thought.
You're right about the occurrence of general correlations - these are expected. But what the comment may miss is the emphasis here on "primary volatility spikes" as discrete unitary phenomena that once above a certain threshold act as triggers for propagating variance into other economic variables.
So... bottom line:
when oil VIX spikes, buy S&P puts
so simple even I understand
Maybe.
Take care.
Therramus
Though I am not sufficiently knowledgeable in either statistical analysis or market behavior to critically comment on Theramus' thesis (how's that for a tongue twister!), I thought this was a good piece. I particularly like the way it sheds more light on something that is becoming increasingly and painfully obvious: the strip-mining of the US economy by people intent on 'cashing out' and becoming rich before the whole thing turns to shite. Essentially, most of the people who run the show, despite public displays of optimism, privately have little faith in the future and behave accordingly.
When you have people acquiring incredibly large amounts of 'real' money through fees, commissions, salaries, and bonuses by moving around worthless financial paper, that results in a flow of wealth from people who produce things to those who are parasites. As has been noted by others, the financial world is becoming further and further decoupled from the real economy, something that historically has preceded the decline of more than one empire.
Joule,
Exactly!
I was thinking about posting something along the same lines but you have expressed my sentiments more concisely than I could have myself.
I guess this has already been written many times before here and elsewhere, but when I read Joule's synopsis, I think that is the definition of a Fascist society. Strictly, is just the collusion of government with (some, favored) industry. However, like in the analysis of a duck, if it quacks, swims, has feathers, a bill, etc., it's probably a GD duck. In this case, I leave it to your imaginations to list all the other similarities we increasingly see to a classic Fascist society, you recall, like those the USA fought (along with others) to overthrow in the second World War.
As more and more boomers retire there will be more and more cashing in of investments. People were duped into IRAs and 401ks instead of insisting that employers provide a defined benefit retirement pension. They were duped by right wing propaganda that Social Security would not be there for them in spite of assurances from the trust fund managers. As their retirement funds dropped in value more and more bailed out driving stock prices down even more. The effect of retiring boomers on the economy and politics will only increase over the next decade. The same people whose productivity fed the prosperity of the last several decades will now expect to get their due and are not parasites!!!
This is on top of peak oil's effect on the economy. The inflation of the 1970s caused a lot of blaming of unions as the cause when US peak oil was the true cause. Oil is part of the immense primary economy as defined by Greer. Our prosperity rises and falls according to how we use nature's gifts to us. Instead of moving away from oil by growing the renewable energy sector as Carter proposed we have become more and more dependent on foreign sources. It is not like we were not warned. Thanks for making a good case for how commodities are a leading indicator of how other markets react.
Hi Joule,
Thanks for the comment... but you forgot to put stock options in your list.
Of all the strip-mining mechanisms it is my personal opinion that stock options played, and continue to play, the most damaging role. I have watched how in practice they are used to sneakily overcompensate executives and control minions. In my opinion, options are the most disingenuous and dishonest means of remuneration out there.
"Alignment of interest" of management with shareholders indeed.
The simply answer is, no, the instability in the oil markets wasn't the cause of the 'financial crisis', it's the other way around. It was an effect, just like the financial crisis wasn't isn't a cause of the economic crisis, it too is a symptom of something far more serious, within a deeper and more profound 'crisis', and that's the crisis of capitalism we are mired in. Of course the crisis of capitalism, and the socalled 'free market'; we've lived under for the past couple of centuries, is part of an even bigger civilizational, and environmental crisis that we face. Our fate, or challenge, is that we face multiple, complex, and interconnected crises, that all fit together like an enormous chinese box.
But there is room for hope and optimism, despite it all. The potential solutions to the crises we are confronted with are relatively simple, yet, at the same time, daunting, but if we concentrate our efforts where they really count, we are still in with a chance. The solutions to all the above crises, are Political. Fix our politics first, then we can begin on the massive, structural changes to the way we destribute wealth and power in society. It's important not to put the cart before the horse. Put very bluntly, to save time and space, tinkering with a doomed economic paradigm, that is the kind of 'free market' capitalism we know so well, we not work, and certainly not in time, for us, or the planet. We can no longer afford the waste, greed, and destruction at the heart of capitalism, and it simply has to be replaced with another system that's more rational and environmentally friendly, and sustainable.
Obviously the Big Question, is what kind of system will replace old-style capitalism. Well, that can wait, until our politics change, and we introduce a democratic and accountable system which is an intergral part of the structure of society. We have a stark choice. Either we replace capitalism, or it will 'replace' us, with a raped and barren planet. So we don't have a choice, do we? Old-style capitalism is, from another perspective, already on its last legs, and being replaced; replaced by an evern more undemocratic for of 'capitalism' based on the corporate/military state, some call it Empire, so call it something worse, Fascism.
"The solutions to all the above crises, are Political. Fix our politics first, then we can begin on the massive, structural changes to the way we destribute wealth and power in society." Posted by writerman
So true, but the real problem is that, in the USA at least, is that there is no simple "fix" available. Our electoral system has enabled the big Wall Street/multi-national financial big money to capture the political process. This is far too entrenched to be reversed either at the ballot box or by a French Revolution type of upheaval. I see no real change happening until the SHTF sufficiently to cause Uncle Sam to collapse. Only after the current political model has self-destructed will we be able to replace it with something else, or more likely a number of something elses on a regional level that might have a chance at seriously addressing the issues facing us.
And the problem goes far beyond how we distribute wealth. In the past couple of centuries wealth has been distributed in a milieu of more or less continuous economic "growth." But now, we likely face a century of economic contraction, followed by a steady-state situation. There won't be any new "wealth" to distribute. The ground-rules are radically changing under our feet, even as we speak. Issues of wealth distribution are generally social justice/fairness issues. You could have a completely egalitarian distribution set-up, but if it still depends on "economic growth", it is still doomed.
Likely, this is why there is resistance to the idea of Peak Oil or the end of economic growth from both the left and right. For the right, it means that the ride on the greed train is over. For the left, it means that most of their social justice dreams will remain only that, dreams.
Antoinetta III
Antoinetta,
My personal hope has been that we would suffer a wakeup call that knocks bau out of the ring without toppling Uncle Sam, and that faced with collapse obvious and iminent e erybody Uncle Sam might show a little sense over the short term -enough to forestall the Mad Max scenario , at least.
If things stabilized under emergency law, then new laws and policies that make sense just might become reality.
Sometimes I amaze myself when it comes to finding straws to grasp.
I guess I need to get a little more serious about prepping the old home place for a return to the civil war era.Including a rerun of the "Kansas, bloody Kansas" show when organized looters self described as soldiers or citizen soldiers ran wild.
People have lived thru worse many times and lived to tell about it.
Maybe I will live to tell the little kids how we used to pick apples with a pistol hanging on our hip and how we had to sit out in the woods with deer rifles watching the cows to make sure nobody drove them off.
Collapse even with a functioning govt capable of maintaining some semblence of order will be bad enough.
I expect half or more of us will be dead within a few weeeks if tshtf and Uncle Sam and the states are not at least able to institute food delivery and rationing and keep the water and sewers working.
"Antoinetta,
My personal hope has been that we would suffer a wakeup call that knocks bau out of the ring without toppling Uncle Sam, and that faced with collapse obvious and iminent e erybody Uncle Sam might show a little sense over the short term -enough to forestall the Mad Max scenario, at least.
If things stabilized under emergency law, then new laws and policies that make sense just might become reality.
Collapse even with a functioning govt capable of maintaining some semblence of order will be bad enough.
I expect half or more of us will be dead within a few weeeks if tshtf and Uncle Sam and the states are not at least able to institute food delivery and rationing and keep the water and sewers working." Posted by oldfarmermac
I strongly suspect that any “wakeup call” that packs sufficient punch to knock BAU “out of the ring” would likely take Uncle Sam out also. It seems likely that such a shock event would see virtually all public trust of any individuals involved at any level of government, from whomever is president, down through Congress and including state and local governments as well, rapidly evaporate. And nobody can govern for long without a sufficient degree of overall trust.
For some decades, I have heard of “succession movements” in Alaska, Vermont and Texas. For the most part these weren’t really serious, they seemed more a statement of ideals rather than any actual attempt to break off from the union. But if TSHTF sufficiently, I suspect that stuff like this will spring up in numerous places, and be far more serious. It needn’t be limited to particular states either, geographic regions that overlap existing boundaries, even national boundaries seem quite likely. And it likely wouldn't be "succession" in the usual sense of the word as it would be probable that there wouldn't be much in the way of effective government functioning to succeed from.
A more fundamental reason I don’t think Uncle Sam surviving such a crack-up likely, is that quite basically, Uncle Sam, both symbolically and functionally IS BAU. We invade other countries to spread our form of BAU. We utilize outfits like the World Bank to use economic leverage to accomplish the same ends in other places. None of this is anything new, and I see no reason to expect any meaningful change so long as Uncle Sam remains alive. And finally, if there is some “emergency law” scenario, Uncle Sam or his minions are the absolutely last people I would want anywhere near running this.
Antoinetta III
AIII,
I must agree-the odds are high that anything adequate to serve as the wakeup call will also knock Uncle and the states out of the ring as well.
But this possibility is nevertheless the only handy straw that I can see.
I'm really not interested in living out bloody Kansas but if tshtf hard within the next ten years I guess I will be glad I have a lot of old time skills to pass along to the younger folks-who at the moment are totally oblivious to the big picture.
Like your mother, mine is 92 and about at the end. I am sole next of kin and executor.
Right now my wife is doing the care-giving and we are just waiting for events to transpire.
Yet her genetics(Irish) are apparently very strong.
Airdale-if you do ever get a HD be sure its a Twin Cam 88 at the minimum. 1999 was the cutover year,so 99s, and 00s did have some problems being newish. An 03 is likely pretty decent, unless you want Fuel Injection,which I did not, which means far less computerization.
Hi Antoinetta,
Analysis of the "real problem" is, IMHO, sorely lacking. If a critical mass of people in the world (or the US) could pass the "grandmother test" - (convince gramdma in a brief discusssion of the core facts and conclusions) then perhaps we might have a chance for a graceful powerdown. Most folks following TOD probably know the difficulty of explaining "the problem" to other people.
My life experience tells me that "solutions" (particulary important and complex ones) have very little chance of being implemended and succeeding unless most of the stakeholders really understand "the problem" and generally agree on the goals. I have no doubt that there is a large array of potential "solutions" that could be very benefical in the coming years. However, my beliefs mean nothing unless lots and lots of other people hold the same beliefs - unless of course one has moved on to just working on individual or small group survival.
Problem analysis is a non trivial task - I've only found a few people who are really good at this. It is non intuitive for most people to separate goals and solutions from problem analysis. It seems even more difficult to understand the difference between symptoms and causes of a problem. It is also difficult for most of us to narrow the scope of what we want to analyze to a manageable domain.
On TOD we tend to talk about a set of facts (symptoms) that have some probability of leading to highly undesirable consequences for humans (and others) in a time frame that is something in the range of a few years to maybe 50 years (very short in the grand scheme of things).
These facts come from IEA, ASPO, etc that describe FF decline rates, reserve data, etc. We have facts from IPCC that relate GHG ppm to degrees of global temperature change. We have facts from biologists about the rate of extinction of species. We have facts about human population growth and rates of resource consumption. We have facts about global debt. These and others point to a confluence of factors that portend a non-graceful "correction" scenario. We also have facts relating to opportunites to counterbalance - amount of solar energy striking the earth every day, demonstrations of conservation and efficiency, means to preserve biodiverstiy, etc.
We have lots of symptoms/facts that, on the balance, demonstrate that the human race is not taking appropriate action to head off great difficulty in the years to come. But, now comes the hard part - what are the causes of both the symptoms we see and the utter lack of meaningful action to mitigate the trajectory predicted by these symptoms?
My contention is that if you don't have a good understanding of the causes of a problem, it is pretty much a crap shoot for any solutions that are applied - indeed, there is a very real risk of making the problem worse (often discussed here on TOD).
Symptoms, by definition, are relatively easy - they should be based upon facts that are fairly easy to test and verify - by definition, symptoms should be relatively non-controversial. But, "causes" require a lot more creativity to descern, test and achieve some degree of concensus. Causes can also exhibit layers where a given cause is actually a symptom of a deeper cause.
For example, here on TOD we often mention human population (especially growth rate) as a major cause for most of the symtoms we see. But the deeper questions is why is this not obvious and why is it so difficult to implement humane/voluntary programs to reduce human population? We hear all kinds of "solutions" (war, disease, dictators, environmental dieoff, etc) but, where, as in a previous essay, are the most effective "leverage points"? And then, of course, a really deep understanding of the most fundamental causes may argue that there are no such leverage points that can be utilized in a useful timeframe.
At this point - I think "the problem" is the problem.
“If a critical mass of people in the world (or the US) could pass the "grandmother test" - (convince gramdma in a brief discusssion of the core facts and conclusions) then perhaps we might have a chance for a graceful powerdown. Most folks following TOD probably know the difficulty of explaining "the problem" to other people....”
I have no doubt that there is a large array of potential "solutions" that could be very benefical in the coming years. However, my beliefs mean nothing unless lots and lots of other people hold the same beliefs....
But, now comes the hard part - what are the causes of both the symptoms we see and the utter lack of meaningful action to mitigate the trajectory predicted by these symptoms?
At this point - I think "the problem" is the problem. Posted by bicycle dave
Alas, the number of people able to pass the “grandmother test” are a minute fraction of the population. Even if “grandmother” was willing to readily accept the explanation, it is a tiny group that understands our predicament sufficiently to even start to explain it to her, let alone to convince anyone predisposed to disbelieve the explanation.
I agree that there are a number of things that could be done to mitigate some of the damage. But again, the overwhelming majority are not truly aware of the facts you postulated above. I doubt that more than two or three percent have even heard of the IEA or the IPCC, let alone know what they are. Sure, many have heard of some of our problems via mainstream environmental organizations or, (since the collapse of Lehman) our economic issues have been discussed, but almost no one yet considers any of this to be of sufficient scale to even start thinking about some of the possible answers that are routinely discussed here on Oil Drum and over at Automatic Earth. Add to the high level of overall ignorance already prevalent a huge and continuous dose of deliberate disinformation and spin and to me its clear that any idea that some kind of “consensus” will emerge among a critical mass of the population that will in turn force our BAU government to rationally respond to our predicament is sheer fantasy.
Finally, I probably shouldn’t have used the word “problem” in my prior post, as that implies a clear solution. It is more like the Arch-Druid has said, we have a dilemma or predicament that cannot be solved, only (possibly) mitigated for some of us to one degree or another.
Antoinetta III
Hi Antoinetta,
I agree - and "sheer fantasy" is probably not an exaggeration. Notice that I said:
So, given that it is unlikely that large numbers of people will understand the issues and demand appropriate government action, then we are pretty much in "crap shoot" mode (as in rolling dice) as far as rational central planning is concerned.
This is not a conclusion that I want to arrive at. The optimist in me wants to wake up the public before it is too late and turn fantasy to reality. And yet, I can't see how this can happen. I helped Aniya with a petition and a website for getting the National Academy of Science involved - with little success. Although reading the comments from the 600+ people who have signed the petition does show the depth of understanding by a small group of folks.
BTW, today, on public radio, I listened to the author of "3 cups of tea" regarding his work in Afghanistan building schools. He reinforced my opinion that you must have sincere buy-in by stakeholders to accomplish risky tasks. He only builds a school if the villagers contribute personal time, land and building materials to get the project done. With this approach, the village will protect the school even though they educate women and become a target - he has only lost one school to the Taliban while a 1,000 schools have been destroyed in villages where "ownership" was not firmly established.
Only a small lesson, but it speaks to the futility of any "solution" to our problems if the general public does not take ownership. A part of the "predicament" I see is also the futility of individual or small group survival strategies - it is hard to see how large numbers of desperate people will not invade all but the most remote strongholds.
So, given that it is unlikely that large numbers of people will understand the issues and demand appropriate government action, then we are pretty much in "crap shoot" mode (as in rolling dice) as far as rational central planning is concerned. Posted by bicycle dave
Since I expect that as far as any "central planning" is concerned, there will likely be many "centres", each extending it influence over a radically smaller amount of actual geographic territory, I expect that many "crap shoots" will be playing out over the decades ahead. The winners of these crap shoots will be those political systems that can accomplish things on the level of getting people fed, sewage treated properly, etc. The others will fail, and after another crisis another attempt (crap shoot) will happen. Rince and repeat until something both functional and sustainable is obtained.
But Uncle Sam is so integral to everything about BAU, I'm ready to roll the bones.
Antoinetta III
Hi Antoinetta,
Your vision of the future may well be correct - painful as it is to concede that this might be humanity's crowning achievement for this century(s).
I've recently read about the barbaric invasions in Europe - aside from a few places like Rome, mostly Europe was organized as small kingdoms that were relatively easy pickings for large invading armies. I wonder if these small centres would not eventually suffer a similar fate if marauding armies could "earn a living" as the so-called barbarians did? And then repeat the wind down of that era in an also similar way? Would history repeat or would there be something about the post FF era that would fundamentally prevent this scenario? Not that all this matters much - just that this kind of speculation works the brain a bit.
I expect that there will be violence in different areas as the process of larger areas breaking down into smaller ones works itself out. Eventually a sort of equilibrium should be reached and most of this should peter out as an optimum in size, sustainability and more permanent borders for the "small centres" evolves, which will at this point will have morphed into a 21st-23nd century remake of the small kingdoms of the early Middle Ages.
After Romulus Augustus, the last Roman Emperor was deposed in 476, this sort of localized chaos, scattered all over Europe went on for several centuries. As we stairstep our way down the backside of Hubbert's Curve in more resources than oil, I could see this process taking a century or so in our current situation as well. As to whether our situation pans out as violently as the post Roman one, from here on to me, this is speculation. Will these future governments examine the responses and actions of their counterparts in the post Roman times, and avoid some of their mistakes? On this, I cannot say, only time will tell.
A major difference between now and then is the remaining supplies of fossil energy. How the depletion of the downside of the energy curve plays out will have a great, but to me unpredictable effect on the whole thing. The effects of renewable energy is still highly speculative. How much will we be able to build and maintain/replace the physical infrastructure when the fossil fuel foundation upon which contemporary renewables largely depend is unknown.
And as we go further post-peak, I suspect large armies, marauding or otherwise will become increasingly unsupportable. But certainly, as before, a certain level of defence will remain a central responsibility of whatever functioning governments exist.
Antoinetta III
"Fix our politics first,"
You have got to be kidding! Many thought that the last Presidential election was going to do that.
The time span to 'fix the politics' might be toooooo long. Could be. Probably is.
Now we have many czars who answer to NO ONE, at least none of the voters. Or representatives, who are likely complicit anyway judging from the large salaries and perks they vote themselves.
Let them live in a cardboard box for some time and then go into their secret sessions. Let them eat out of dumpsters for a year and then do their 'political game'.
We have reached 'Peak Politics' and it didn't change anything. Just some new faces.
With Palin's runaway best seller? What does that connote? Can someone 'chart' that?
Airdale
Airdale -
As unlikely as it is that the political system is going to get 'fixed', I would still have to agree with the previous poster that this whole mess is fundamentally a political problem, and secondarily an economic one.
Yes, it would be nice if some of these political bastards were made to live in cardboard boxes, but it is far more likely that you and I will be living in cardboard boxes long before they ever do.
Most people in the US think that politics is just about election campaigns, speeches, and legislative deals, but at its basic and most primitive level it is quite literally about life and death. In a zero-sum game (such as the one we are currently playing) that's what it is all about. This notion might be disturbing for an American, but I am sure that an Iraqi, Afghan, or Pakistani would immediately understand .... if you are not on the winning team, then you are automatically on the losing team, and if you are on the losing team, then you are dead.
As inconceivable as it may seem, it is not totally beyond the realm of possibility that Sarah Palin could be the president come 2012. Given the right set of problems, an atmosphere of chaos, and a warped religious right-wing movement to 'restore' America to its former greatness, it just could happen. Then what?
Palin for president. The game would be over.
We(Earth,TOD,Gaia) lost.
Airdale
More likely it would hasten the collapse of the status quo. Or maybe I'm just looking for some Silver Lining. :)
I am not so hard on our way of doing things here in the US. I have observed that politics here is intensely tribal, messy and results in awful fights at just about any level you want to look at it - from the local "school board" all the way up to the Presidency.
However, speaking as someone who is an American by choice - and having lived elsewhere - the system in the US appears to have a potential for stability, fairness and freedom that is difficult to find in most other parts of the world. The balance of powers, including the weakness of our Executive, relative to powers invested in similar offices in other countries, seems to be a good thing.
The above being said, the inbalances wrought by the "financialization" of the US economy over the last 50 years has provided us with an industrial scale problem on the order of ensuring the ongoing separation of church and state.
"However, speaking as someone who is an American by choice - and having lived elsewhere - the system in the US appears to have a potential for stability, fairness and freedom that is difficult to find in most other parts of the world. The balance of powers, including the weakness of our Executive, relative to powers invested in similar offices in other countries, seems to be a good thing." Posted by Therramus
I think this can only work, as imperfectly as it has in relatively "good times." In the era of economic growth, hard problems could always be kicked down the tracks to a future election cycle and as well there were always a few extra $$$$ in one form or another to trickle down to the bottom, sufficient to placate everyone and prevent a political uproar.
But when the underlying situation is different, when the growth is gone and replaced with contraction, and further, due to resource depletion, it will never return, fundamental questions of how people will eat, how sewage treatment will be kept functioning, etc, etc, etc. will come to the forefront. Also these issues will have to decided in a timely manner, we won't have the luxury of months of political grandstanding and obstruction, followed by court challenges, etc, etc, etc. The items you cite as positive about our system will become liabilities, possibly fatal liabilities. And if these fundamental survival issues are to have a realistic chance of being effectively confronted, the crooks and greedmeisters will need to be summarily forked off the table, and if whatever entity purporting to be a government at that time lacks the authority to do this, massive societal failure becomes far more likely.
Antoinetta III
Hi Antoinetta,
You're quire right - at some point the "endless frontier" has to come to an end. This may be an essential test of the American democratic experiment. Tough times may be ahead - but I'm betting the US will pass the test.
Hi Writerman
Do not dispute the general idea that what we are seeing is a manifestation of resource depletion coupled with increasing population.
However, the essay tries to focus on phenomena proximal to and potentially causal of the financial crisis of 2008.
Also, did not write the essay to damn capitalism per se. Capitalism not perfect, but the evidence suggests that it can work well under many circumstances.
I am not against free enterprise, just licentious enterprise.
Dear Therramus,
I understand the focus of your essay. I was only attempting to broaden the perspective somewhat, out from 2008. In theory, as a form of utopian ideal, I too see a lot of benefits from 'capitalism'. Personally, I have done fantastically well out of the global capitalist system, and I've got the royalty checks to prove it!
However, though one can argue that capitalism was a system that was 'necessary' for growth, progress, and change, in a specific historical period; I no believe the very 'success' of capitalism and the ulimited growth socio/economic paradigm; the western model if you like, has outlived its usefulness, and has become a distinct threat to the survival of our planet.
I am not against free enterprise. I am self-employed, and I suppose I am the embodiment of free enterprise, earning a very comfortable living from writing 'trash' that sells well, and 'art' that doesn't, but it's good for the soul I imagine.
Writerman - Thanks again for the insight. Seems you have it figured out on the making-a-living front. Well done - thinks there are tougher ways of paying for the guns, whiskey and painting than by being a sucessful writer.
Best wishes
Hello All
I am an investment professional and find the 'official' history of the oil price spike odd in many ways. Specifically, oil ran up to around $100 on the basis of real and financial demand in the first half of '08, and it appeared (at the time) that we would all adjust to that price. However, like everything, there was an overshoot & prices moved up to $110, at which point most folks were expecting a period of retracement & consolidation. What happened instead is rumours started to float around about a London hedge fund in trouble. Ospraie, Tosca, Peloton, RAB, Red Kite, & Pentagon were all in trouble at around this time. Hedge fund affairs are notoriously opaque, but my understanding is that a commodity fund, based in London, using Goldman Sachs as their banker, was short and in pain on oil in the $100-$110 range. Apparently, this was not the only commodity bet they had recently been wrong on and their capital was disappearing rapidly, which doesn't take much on heavy margin. So they did what traders do in situations like this; they increased their bet. I don't know by how much, but indications are it was substantial. Market chatter had Goldman issue a margin call @ $115, which quickly leaked to the Street, and further caused price movement to $120, at which point Goldman seized their assets. Two things then happened really fast: the margin folks @ Goldman went into liquidation mode, which meant they were buying in size to flatten the shorts. The other traders saw this and quickly stepped out of the way of that train, so liquidity dropped dramatically. This quickly became a self-sustaining upward spiral, until the account was flattened, at which point the buying stopped and oil teetered. Now, if you were a trader on the proprietary desk @ Goldman, and you saw dramatic and senseless buying, with your trade screens showing it was your own house doing the buying, but you know it's not your prop desk, what do you do? Well, you figure it is a margin liquidation, which fits into the rumours circulating, and when you see it has stopped, you go short; massively, really, really massively. If you check you will see huge spikes on the short side of oil in that time frame. You wouldn't need to break any laws or regulations to do this, as everything would be obvious to anyone capable of reading a bloomberg trade screen. So the Street sees that Goldman has stopped buying and has now swung to a huge short position, and you then get a gigantic 'pile-on' effect. Oil was artificially elevated clearing the dumb hedge fund, so a short was a safe trade; you were shooting ducks in a barrel. The oil price slide gained momentum, the Lehman events unfolded, and the rest is public record.
For the record, I will repeat that this is market rumour, but it is always illuminating just how well informed the background chatter turns out to be, after the fact. I found the Therramus article on volatility very interesting, but if you check the historical trade screens and you check the houses involved, the above narrative fits the facts.
Best rgds.
j.
j. -- far from my knowledge base but your tale makes sense. Thanks. I've seen the rumor mill first hand push situations from extreme to the other. Every tarder is looking for advantage, Rumors, if true, offer that advantage especially, as you point out, if the colective response supports the initial rumors.
Hi J,
Thanks for your post - its fascinating to read the details here. I'm intensely curious (in an entirely non-pejorative manner) about the nature of information flow in your profession - in this case a rumor. Your story provides a rare glimpse for the likes of me of such processes.
Regarding your point on the potential role of manipulative trading practices in causing price spikes - consider the discussion of Figures 5 and 6 and specifically pulse 2 in oil price volatility- "the Hurricane Katrina spike" - from the essay.
"Pulse 2 in oil price volatility is interesting. Its initiation toward the end of 2005 corresponds roughly to the timing of Hurricane Katrina. Many in the US will remember the sharp rise in oil prices at this time and how conventional wisdom focused on the hurricane as the primarily factor causing the sharp ascent in gas price. However, the big picture view provided in Figure 5 indicates that the "Katrina-induced" spike in oil price may actually be part of a larger series of volatility pulses, including one that preceded it by a year and a third spike, which followed roughly a year later.
As with 2005, 2004 also had an active hurricane season. However, 2006 was comparatively quiet. The point is that while events such as Hurricane Katrina may act as a trigger or catalyst, they are certainly cannot be the ultimate cause of multi-year instabilities of the type illustrated in Figure 5."
My interpretation of the role of trading in volatility is similar to that of Hurricanes. Market manipulation can act as catalyst for the "activation" of a volatility transient - i.e., a primary volatility spike. However, I'd posit that spike "activation" is secondary to the underlying "twitchiness" of the substrate which results from the availability of oil tightening - as Hubbert's peak is approached and then topped.
Hi Therramus,
In reference to your query about the flow of information, rumour and market intelligence in the financial services industry; like everything, it is variable in time-weighted value, quality and quantity. ‘Hard’ sources are analyst reports, reputable sector-specific gurus like Matt Simmons or Boone Pickens, or fact-checked journalism from institutions. Next would come ‘middling’ information vectors from well connected sources and blogs sa. Carpe Diem, Charlie Gasparino (The Daily Beast), Seeking Alpha, The Biz Insider, The Financial Times (Energy Source & Alphaville), WTRG, and The Energy Tribune. Finally, we get a steady flow of not publically-releasable industry intelligence from various investment pros, informed by experience, information and connections. It is not publically-releasable because it is frequently scurrilous, always irreverent, and occasionally scandalous.
For my next point, I would like to address your use of the phrase ‘manipulative trading practices’. Theramus, there are no virgins in my business, but cheating or outright breaking the law is, in my experience, not only fairly rare, but also an admission that you are probably a loser. Quality investors and traders make far more money than the inside information types.
Kindly allow me to make a few observations about pros and civilians. For a start, all of us have access to a ton of information that is just sloshing around out there; however, a pro pays attention to the data flow all of the time and has a coherent investment/economic model within which to fit the pieces: most individual investors do not. Next, pros have better screens. A trade screen (which is just an expensive data feed) allows you to drill down into the markets and see who is on the bid (to buy), who is on the offer (to sell), the size of the trades, details of the bid & offer queues, and which houses are making which transactions. Add to that real-time news feeds, detailed information on capital structure in summary form, great detail on ownership (& changes), and summaries of analyst views.
Next, a few comments about traders. Therramus, these are relatively odd individuals. They all generally share the characteristics of being lightning fast mentally (unless they are hung over), balls of steel (most are men), with huge shift-to-risk personalities. They come to work very early each morning looking for what is going up and/or what is going down, because their thinking is if it isn’t going up, then it is going down. A good trader ‘shoots’: if he starts winning, he increases his bets and shoots from further out; if he starts losing, he gets smaller and closer to the net. Direction (long or short) is not the issue but size and momentum are. A great trader trusts his screens and doesn’t need or want any other information than the price line. These guys may look at the fundamentals, but they all trade technically.
What looks like insider information or market manipulation, is, for the most part, not. You don’t need it and/or it is not feasible, so why bother? In my previous post, I ascribed a portion of the oil price high to traders capitalizing on an exploding hedge fund; as you can see from the above, inside information and market manipulation is not necessary; everything you need would have been right out in the open.
Now, as to your argument re oil price volatility; well, maybe. Please take a look at the chart below:
... apologies here, unable to paste chart ... pls. go to www.wtrg.com, Oil Price History
The elements that jump out really quickly are that oil was expensive ($70+/boe) early on; then as exploration and reserves expanded rapidly, the price fell to the $10-$20 boe range for 100 years (approx. 1870-1970), then reset to the $20-$30 range towards the end of the 20th century, then took off recently. During the early part of the century demand went up but reserves went up faster.
It is worth noting some facts about oil reserves. When a field is discovered, capital is expended on seismic and exploration drilling. So let’s say you ‘hit’. Cool, your engineers tell you about the geological structures & trends, so you have an idea as to size; now what is your management decision wrt. capital allocation? Likely you go out and buy as much land as possible. Your engineers give you a Proven Reserves number based on the wells drilled to date. Ok., so you have drilled a couple of wells and have a really large number of drill sites; do you go out and prove up the total land position, remembering that you get paid and bonused on production and reserve growth? Likely not: it would be a misallocation of capital to prove-up acreage that you won’t bring into production for 5 or 10 years. Plus, it is somewhat comforting to know that you have all of those ‘reserve replacement’ barrels sitting in your back pocket.
Now go back to the 100 yr. chart above. The really large discoveries were mostly done by the ‘60s, and ‘true’ reserve replacement was actually declining in the back-half of the 20th century. This was masked by the practicalities of how capital was actually allocated and reserves really reported, as noted above. All the while demand was constantly increasing, thus we run into a supply/demand problem, and peak oil.
Fundamental underlying vectors influencing oil price volatility were the Arab/Israeli wars, the oil embargoes, sovereign debt problems, LTCM, 9-11, hurricane Katrina and our recent bubble decade. At the same time as all this was unfolding, information cost was heading towards zero, capital liquidity, leverage & depth was rapidly increasing, and technology was enabling trading. Add into the mix the fact that all of the trade desks were pretty much using the same tools and models: primary trend line, bollinger bands, MACD, RSI, moving averages, volumes, and fibonacci retracements.
My point being that it appears as if real world events are being amplified and magnified by the financial markets. Or, to put it another way, traders are running with the headlines. This doesn’t mean that we are all at the mercy of crazy-ass Wall St. traders: if you check the numbers, total volatility was actually much higher in the ‘70s & ‘80s. All of the trade desks, capital and trading tools cause a quicker, more ‘spikey’ market, but also limit overall volatility.
Bottom line, oil is going up because we are running out. When demand goes up (Chindia) and supply is constrained, then demand must be destroyed by price. In a finely balanced supply/demand model, small changes in real-world variables (your point) will have large effects on price, and these effects will be amplified by traders (my point).
Best rgds.,
j.
HI J,
Thanks for your excellent comment. Getting back to you was one of the last things on my "todo" list for this essay before TOD closes down comments - tomorrow I think. Need to read it a couple of more times - but would like to respond in a little more detail and perhaps ask a question ot two - if time permits.
The overview of information movement in the business you provide is fascinating. Shooting from the hip - ones intuits the potential for long-term self-organizing structures flowing from the behaviors of traders that you describe, independent of conscious "manipulative practices". Incidently, I regret using this latter phrase so blithely.
Best wishes
T
No arguments from this quarter. Same case was made here back in April; excellent job.
High oil prices strand users of oil. In a system where shortages are intermediated by credit, a) prices will rise as consumption power is pulled from the future, b) credit is distorted if the pull is large enough, and c) the end result is still a chronic shortage.
It really IS different this time ...
Hi Steve,
Gail provided me the reference to and explanation of your hypothesis on "peak oil availability" in the essay during editing. As you may ahve seen, your insight helped me with a troubling problem of interpretation that emerged from the normalized plot of volatility spikes (Figure 9).
Tks for your excellent work !
Best
Interesting post, Theramus, but I think that you are perhaps working upon mistaken assumptions.
Like you, I am not an economist, but I do have 25 years of experience in market development and regulation, for six of them a Director of the International Petroleum Exchange, where among other things I managed the IPE's deliverable gas oil contract which routinely saw hundreds of thousands of tonnes of product delivered in NW Europe.
Credit Crisis
In my view the principal cause of the financial crisis and of the volatility are one and the same - to wit, the 'leverage' or 'gearing' derived in the former case by deficit-based credit creation by banks, and in the latter case by both bank credit creation and forward/futures contracts.
The financial crisis was IMHO caused by the evolution of a 'shadow banking system' which is essentially the network of investors to whom banks outsourced credit risk:
(a) totally - through securitisation;
(b) temporarily - through Credit Default Swaps;
(c) partially - through Credit Insurance by the likes of AIG; and
(d) cocktails of the above such as CDOs.
A pyramid of credit an order of magnitude greater than would otherwise be the case was therefore created and property prices grew to ludicrous levels, such that the obligations of property owners far outstripped their capacity to meet them.
The bubble commenced its collapse from a point of "Peak Credit" probably in mid 2007. It is possible that the run up in oil prices which had already taken place by then was a factor in the inability of the average punter to make his mortgage payments, but I think it is safe to say that since the spike to $150/bbl came later it could not therefore have been a cause.
Financialisation of the Market
Since 2000 the oil market pricing and trading mechanism - which is centred upon the Brent/BFOE 'complex' of contracts - has been almost entirely in the hands of trading intermediaries generally and financial trading intermediaries ("Wall Street Refiners") in particular. The purpose of these players is to risk their capital in pursuit of profit through buying low and selling high from and to 'end user' buyers and sellers of physical commodity contracts and derivative contracts.
These intermediary players have a vested interest in opacity and in volatility, and the only bad news for them is no news at all.
Prior to maybe 2002, these players had pricing power in energy markets, but the advent of hedge funds as speculative trading intermediaries meant that they switched instead to pillaging the hedge funds through superior market knowledge, institutionalised quasi-insider trading, and service provision - particularly including the provision of leverage on-and off exchange - part of the service known as "Prime Brokerage".
Hedging Inflation
It was the Goldman Sachs Commodity Index (GSCI) fund - which had a high component of energy - which first introduced the concept of 'hedging' energy price inflation. In other words, people became interested in off-loading dollar price risk in favour of taking on energy price risk. Anyone familiar with futures markets will see that this is directly opposite to the wish of producers wishing to 'hedge' energy price risk in favour of taking on dollar price risk.
The point is that the motive of investors in doing this is the complete opposite of speculation, and in my view, the wave of Exchange Traded Funds that have piled into the market are beneficial in the genuine liquidity they provide to the market. Unfortunately it is they, rather than manipulative producers and speculator intermediaries who have been mistakenly pilloried as the culprits for the 'Spike'.
Perhaps the most important recent development in recent years was the smart move by Shell in 2005 in entering into a joint venture with ETF Securities.
What this enabled Shell to do was to put to work some of their idle capital sitting in the form of oil either in tank, or even in the ground (where storage is free). Essentially investors loan dollars to Shell, and Shell loans oil to investors.
Macro Market Manipulation
Other players were not slow to pick up on what Shell had done, and it is from this point on that we saw fund money - from 2007 on flying from financial market risk - pouring into the energy market facilitated by a great deal of hype, and an arbitrage taking place opaquely inside and by reference to the global market price set by the BFOE complex of contracts. Since there are now only about 70 cargoes (of 600,000 bbls) a month coming out of the BFOE oil fields it will be seen that it does not take too much money on the part of anyone so minded to support the price, insofar as it was necessary - and it is of course the case that oil supply and demand are increasingly tight.
I think that some producers came to realise that oil is more valuable in the ground, and that it may be good business to support the price by manipulating the BFOE price in a not dissimilar way to that in which the International Tin Council supported the tin price pre 1985 by buying in stocks of tin.
Oil producers' motivation to do this redoubled after the financial crisis commenced and interest rates went essentially to zero - - the "zero bound". Why produce oil and exchange it for financial assets yielding 0% ? Producers preferred to lease or lend their oil instead. At this point we were seeing not just oil but all commodities becoming detached from real world supply and demand, and the forward price curve in commodities began mirroring the yield curve.
The oil price became like a car going up a hill with no brakes and no reverse gear. Eventually demand destruction set in for oil products and blew back to the crude oil price, and eventually the market support operation became too expensive to continue. So the oil price collapsed, but since the dollar remains in a zero bound liquidity trap, the car started back up the hill again, and judging by the amount of products currently floating in storage, and the pain for refiners, another correction is probably overdue.
Cui Bono
Who gains from macro manipulation?
On the face of it producers are gaining, and are happy to pay a tax to the intermediaries who facilitate the manipulation, but in fact in the medium and long term this huge volatility destroys their investment programmes and budgeting.
Consumers lose big-time financially to both producers and intermediaries, although the planet gains from cuts in consumption.
Fund investors lose from unnecessary volatility.
The true speculators ie the intermediaries - make sure as best they can that global regulation is minimal and that the market platform is run in their own interests. They make out like bandits, while the fund investors get the blame, and become subject to totally useless regulation.
So in conclusion, I think that it is in essence the factors which caused the financial crisis - especially leverage - which have been a major cause of energy market volatility, and not the other way around.
Hi Chris,
Tks for your response - it seems full of fascinating detail and substantive. Its getting late where I'm at, so let me re-read and think about this some. I'll get back tomorrow.
Best and Goodnight
Hi Chris,
First let me say that your writing is a model of clarity. I presume that you wrote your comment as a first draft with little subsequent editing. If this is the case, then it makes it an even more impressive composition.
Anyway - read it over a few of times and started to form a view that we might in part be saying the same things - but perhaps in slightly different ways. Namely, that peak oil-associated disruptions to the economy were anticipated by insiders some time ago and that this clique used this information to first "game the system" and then to "cash out". Please correct me if I misread you.
As an aside - a provocative acronym I came across while doing my work was IBGYBG - "I'll been gone, you'll be gone".
Suspect that the mind-set of IBGYBG may turn out to be one of the key human pathologies operating in the financial industry during this crisis.
Anyway. I'd like to pose a question - also please forgive the fact that I am going to use a self-coined term from my essay in the question.
Here goes:
Your description of how the system was gamed and manipulated works in the time frame since 2000, but how does the correlation identified in the essay between the 1986 "primary volatility spike" and mysterious 1987 stock market crash fit into the picture you paint - see the section entitled "When Black Tuesday Came" for more details ?
Applying Occam's razor, one assumes that the same mechanism should be operating in both time frames - i.e., during the mid 80s and since 2000.
Hi Therramus
I think that sudden price rises which are caused by supply shocks are an instance of where volatility in supply and price coincides. So it can be - and has been - the case that volatility in price has been followed by economic calamity.
But that coincidence has not recently been the case in the oil market, I think, where supply and demand have been relatively smooth and the market volatility has been almost entirely financially driven.
If you look back at the evolution of the oil market it was pretty stable for generations when the market was stitched up between producing nations and the Seven Sisters. The coming of producer power and OPEC brought with it trading intermediaries, and the increased volatility then led to the need for mechanisms allowing producers and consumers to hedge that volatility, which were in turn bilateral forward contracts and then standardised futures contracts, and option contracts and so on with increasingly baroque layers of complexity.
From the mid 1980s to 2000 the market became increasingly financialised and "geared" . With gearing comes volatility - particularly when the intermediaries are the ones who control the market platform, which is a bit like allowing the submarines to organise the convoys.
Although we are seeing in the short and even medium terms, a market which is detached from the actual reality of supply and demand - in the long term you can't buck the market.
What has been changing is the periodicity and amplitude of the oil market volatility, I think, but we cannot get away from the fact that as carbon fuels become scarcer then energy prices will continue to become a greater component of the inputs of economies, which inevitably reduces the resources available for other inputs.
Hi Chris,
Another lucid de novo post - congrats.
So, your suggestion is that mechanisms determining price volatilities in the mid-80s to 2000s and post-2000 were different ?
On your observation on the post-2000 market that...
"What has been changing is the periodicity and amplitude of the oil market volatility"
Agreed... think Fig 5 showing the 6-7 prominent spikes of the volatility index (controversial to some commenters) between 2004-2009 suggests this.
In essay text accompanying comment:
"However, if one looks at the spaces between the green arrows marking the pulse tops, they are NOT consistent. The time interval between the spikes gets shorter and shorter as 2009 is approached. If this is an oscillating wave, it is rather complex."
and a paragraph or so later:
"A further notable feature of the plots is that the volatility spikes tend to show a progressive increase in amplitude."
You quite evidently have a profound knowledge of oil markets and their workings - and if writing is thinking (which I think is the case)- then you write very well. I know a little about the developmental biology of electrical activity in the heart. Over the years, first as a student, and then as a research group leader, I've learned (often the hard way) that perhaps around 50 per cent of the data from my own studies, and from the published work of others, is useful. In fact, often it seems that what I thought I knew for certain turns out to be a hindrance to meaningful interpretation.
For me, the most gratifying insights come from staring at a biological sample or process and mentally interrogating it over long periods of time. Asking question after question as one stares also seems to help keep prior assumptions at bay or at least down at some unconscious level. During the process of "mental interrogation" things one noted at first may fade in importance - and other things that weren't noticed initially may emerge as more substantive phenomena.
This all sounds terribly abstract and airey fairey, but consider this -
If I saw a pattern in time as distinct from preceding events as that evident on Fig 5 (2004-2009) emerging in one of my experiments - it would get my attention. If a set of 3-4 other variables subsequently were found to show behaviors that were correlated to and downstream of the first pattern - my curiosity would be peeked further. If I then carried out an experiment in which a major factor confounding interpretation of the correlation(s) of interest was controlled for (e.g., the Black Monday experiment), I'd start thinking about what other experiments I needed to do to put my story together for submission to a peer reviewed journal.
This description probably has those physicists and engineers who prefer to work from first principles and predictive mathematical models pulling their hair out. However, observing and intuiting pattern from nature, looking for replicated examples and then possibly carrying out a few confirmatory/control experiments is a reasonable approximation of the approach of most biologists - Mr Darwin included. Admittedly, sainted Darwin was far heavier in the replicated example category than his modern colleagues.
This is not to say that I'm sure I am right -see 50 % rule above. What is posed here is a hypothesis, backed by a smidgen of data (albeit controversial to some) that was hard won over many hours of work during the last year or so. More work, further data and new approach is required to test the hypothesis. Also, with this post by Gail there is now a body of new input and critique on the idea from clever people like yourself. Most importantly, I'm hoping that there is also now a bunch of bright and angry folks out there who have a burning desire to empirically PROVE ME WRONG.
Best wishes
Don't quite get in how this post demonstrate anything.
Ok the oil price is going weird because it has to destroy effective demand beyond supply level (which depending on the reader's view might be in decline or at plateau, undulating or not, dancing the samba or the fox trot depending on everybody's - including my own - personal - and definitely erroneous - forecast.
Every time it does that the economy takes a plunge, the price calms down until it grows again, hits ceiling... like a bug against a glass window. Since the oil pretty much influences everything else, this motion affects other prices, in particular of course gold.
This post sounds like a weird conspiracy theory to me.
The interest comes not from a price correlation, but from the price instability correlation. It may be that the instability spike follows from a price increase alone - in which case it'll still be interesting, but not so dramatic. Only more analysis will tell.
Jaymax,
I am in agreement with you on all counts - especially with the need for more data, better analysis and further productive thinking.
@Jaymax.
thanks for the summary :-)
that's my fourth reading now but I still don't get it...
I don't see any meaningful contribution to this, I mean come on, apart accusations in the air, what are factual conclusions?
Note that I am not trying to say this is all wrong or seeking errors.
I just don't quite get where we are heading with this.
Hi Asgard,
I do walk I fine line don't I... but go to great lengths to emphasize that my story does NOT describe an "organized conspiracy" - more a self-organizing process stemming from resource depletion.
IMO your analogy has it backwards - I picture the sequence more like the heart beat - action potential (think oil volatility spike) followed by muscle contraction (think spike in the inflation rate).
Also, note the discussion of the "Hurricane Katrina Spike" as to my reasons for hypothesizing that transients in oil price volatility triggered by decreasing availability govern over primary volatility spikes in variables such as inflation rate.
Theramus,
To me, your analysis STRONGLY SUGGESTS the correlations you purport, and those correlations are potentially deeply significant.
BUT - it lacks statistical rigour. I am no statistician, but I would beg you to find one, a good one (there are a few floating around here) and work together on tightening up the statistics here so that it would satisfy an expert statistical critique!
I suspect the correlations will hold, and be much more defensible.
Also - in terms of the 'spikes' - find a method to identify (consistently, defensibly, even if somewhat arbitrarily) the start, end, and apex of each spike, and show those overlapping regions, rather than just the arbitrary 'eyeball' highest points.
Hi Jaymax,
Thanks for your insights, support and suggestions...all much appreciated.
All the best.
Gail, I don't know if anyone else has pointed this out , and excuse my pedantry, but the correct spelling is " fin-de-siecle". Great post though.
No, actually the correct spelling is "find the sickle" and the hammer might come in useful as well!
Congratulations Theramus and Gail on this post. It does provide an original perspective and insight about how we got here - and that in itself is really valuable.
The commentary that has followed your post is a reflection of life itself I guess: In general we miss the point, the essence of what (you in the case) were trying to say. So instead of seeing the point and building on it, people tend to focus on what might be wrong with it - the correct or incorrect use of terms etc.
Suggestion to my fellow readers/commentators: let's learn from new perspectives (even if they mix up terms) and CONSTRUCT over the essence of what might actually be excellent insight.
I agree, of course.
Action will save us, maybe.
The clock is ticking. The sand is running out of the hourglass.
Airdale
Hi Joseph,
Thanks for your kind comment. As you have probably seen I've done some "humble pie eating" above for my less than rigorous use of statistical terms. Other commenters are quite correct - this can be misleading. Fortunately, comments provide a means to admit mistakes while still keeping the core essence of the argument intact.
As mentioned above I also wanted to submit the data and essay for a kind of "peer review". I am professionally use to this type of back and forth - and within limits of propriety - think it an entirely good thing. In fact, my experience here has left me thinking that all scientific papers published online should have a live comments section appended- though in my case maybe the worry would be lack of interest rather than too much.
Best wishes
Thanks Theramus for this most interesting article, and thanks Gail, for posting it.
I have nothing to add to the statistical nitpicking except to say that no statistical analysis is better than the assumptions that underlie it. In the case of oil production, understanding what assumptions are correct to understanding how oil production works is the whole problem! An eccentric statistics might actually reveal something heretofore overlooked. In any case the is nothing normal about the normal distribution. It works fine except when it doesn't. Occasionally, it is theoretically justified.
Skimming through the comments I notice one TOTALLY IMPORTANT point has been overlooked: The similarity between the spikes seen here and the volatility in whale oil prices in the mid-19th century (remember that article posted here on TOD?). I would like to see a comparison between these two histories. Offhand, this analogy is the strongest single argument that PO--specifically Peak Light Sweet Crude--must have been before 2005 (the year that up to now has seemed best based on available data).
--Gaianne
Hi Gianne,
Interesting. While I did not discuss whale oil - in my longer essay published at the idea Wiki, did discuss previously published data on changes in the price of whale bone in the 19th century and variance in Atlantic cod numbers landed off New England in the 20th century in relation to my story.
This discussion was pruned in the process of getting the essay down from >20,000 words to <6000 words.
It's hardly nitpicking to call into question the entire foundation of the analysis. Without the stats, it's just pure speculation without basis. This is fine, but I wouldn't go using this thesis for anything other than entertainment.
Crobar-
Your are dogged - and that is commendable. But your questioning of the "entire foundation of the analysis" and statement that this essay is "entertainment" are overdone.
My tack to address the problem was accretive and deliberately simple. The approach is the way it is because of my own mathematical limitations and because we are dealing with the real world in all its glorious messiness. This is NOT high physics and I believe that this problem would not be easily tractable to such an approach in any case. Moreover, the essay is a stepping off point not an end in itself - IT IS A HYPOTHESIS.
What data that is provided is a loose first cut - and maybe the idea will grow into a better fit over time. Experience teaches that the emergence of truth (at various scales) is generally a slow and ontogenic process as opposed to being sudden and revelatory.
It is also pointed out that some other specialist commenters appear to agree that the arithmetic approach used is is NOT without merit.
Groneau -
" I wonder if the arithmetic was provided without the term "standard deviation", if you (i.e., Crobar) would have the same problem with it. The point seems to be to get a positive definite "derivative-like" number to represent the volatility."
WebHubble Telescope -
"We should all open our apertures. The measure of variance is also known as the second moment of a probability distribution and the square root gives the standard deviation...
....."...you (i.e., crobar) were the first to suggest the caveat that the standard deviation as applied in classical statistics really only applies to Normal distributions.
....."Therramus is looking for some correlated indicators to tie some causality to. I usually don't follow this approach as I invariably would rather start from a model that tries to predict the behavior. Therramus is looking for some correlated indicators to tie some causality to. I usually don't follow this approach as I invariably would rather start from a model that tries to predict the behavior."
Gergyl -
"The concept of a volatility impact - as opposed to a price level impact - is interesting, and doesn't get much attention in Hamilton 2009.
My point was just that your chosen volatility index is contaminated with a strong raw price signal, so some of your observations may reflect simple price increase rather than volatility. I saw the rolling average thing and understood it as an attempt to address that, but a better up-front choice of volatility index might have avoided the need.
Jaymax
"The interest comes not from a price correlation, but from the price instability correlation."
Steve from Virginia -
"No arguments from this quarter. Same case was made here back in April; excellent job."
Tislandia
"I find arguments about whether one is using some sort of cannonically sanctioned definitions to be missing the point. A combination of numbers, a statistic, is good for whatever it works well at. I think the use of your particular combination of numbers has lots of pluses and minuses as have been pointed out. IMHO it is not a minus that it pushes the envelope (gently) about what a standard deviation might be."
First, I would address you to Groneau's statement that what is used here is a "positive definite "derivative-like" number to represent the volatility."
A POSITIVE-DEFINITIVE REPRESENTATION of volatility. Please be specific in your response as to the error in this description of the index developed here.
Second, consider - WebHubble Telescope's -"Therramus is looking for some correlated indicators to tie some causality to".
Is WebHubble Telescope (or relatedly Jaymax) wrong in their assessment of what I'm up to ? If so, tell me how in detail ?
Third, In earlier comments you make reference to this being a recapitulation of Professor Hamilton's work. Again I would note Gergyl's comment that volatility impacts don't get much attention in Hamilton's important contribution. Moreover, the core results of my analysis, including the identification of the 2004-2009 volatility spike series, were already posited online in early March 2009, months prior to both Hamilton's publications (see the time stamped post at - http://ideas.wikia.com/index.php?title=Volatility_in_the_Price_of_Oil_si...). Moreover, Professor Hamilton had an opportunity to appraise my work in June prior to his second November 2009 paper on this topic.
Finally, in an earlier you make reference to the "...ludic fallacy of weaving false stories out of the past". I had to to look this one up. What I think you meant to refer to here was Taleb's concept of "narrative fallacy". This is an important concern and a caveat that I openly discuss in the longer version of my essay at the Idea Wiki (http://ow.ly/hSGb).
As Taleb's develops his concept of the "Narrative Fallacy" in his Book "The Black Swan" - we also see a more nuanced definition than represented in your "weaving false stories" statement.
First, a contributing factor to "narrative fallacy" phenomena is the reinforcing role played by authoritative sources in repeating and propagating the accepted stories, conventional wisdom, the party line and so on. As JACK makes clear in comments above, I, in no way, can ro should be considered an authority on the subject area of this post - throwing in deficiency in the exposition of English for good measure.
Second, a defining characteristic of the "narrative fallacy" is our deep-seated reluctance as a species to consider alternative explanations. This need to refrain from thinking of counter-narratives, or considering such narratives seriously when they are encountered is perhaps more emblematic of your own reaction to this essay than the essay itself.
Regards,
Therramus
As a long time reader, I read this article and felt compelled to post a comment.
Many attempts have been made to associate peak oil with this latest recession. But many of them ignore the underpinnings of this recession that go back through several prior recessions. The events that led to this recession are not without precedent in history. Fiat money that expands faster than the growth of the underlying economy always has resulted in disastrous credit bubbles that have burst, and sometimes taken decades to clear from the channels of world trade. For the United States in particular, as the holder of the global reserve currency, growth of debt (credit) has been expanding faster than actual growth of the economy for several decades.
Therefore, while such a hypothesis may sound appealing, one should really find compelling evidence that this time it is different. A good test might be to see if there is similar data for some other commodity or product associated with prior bubbles that burst. For instance, if the data can be found, it would be interesting to compare the inflation of the money supply with the spikes in tulip prices during the South Seas bubble. Likewise, data might be found for the Great Depression, especially in the area of farm commodities and the rates of inflation in the roaring twenties.
If such correlations occur in those prior bubbles, then the question becomes one of proving causality versus simple correlation. If no such correlation occurred in prior bubbles, then perhaps this one is different and oil played some important role.
But it must not be forgotten that long before this recession, the seeds were being sown by the policies of the US central bank (the Federal Reserve) that created growth of debt that exceeded growth in the economy. Karl Denninger has discussed this problem in numerous articles, the most recent of which I recall is Volcker Pulls Back The Curtain. There is a clear graph there showing the growth in debt versus the growth in the economy. Mr. Denninger also discusses what that debt did in inflating our GDP for nearly three decades.
The simplest explanation is usually the most compelling. In this case, the simplest explanation focuses on the growth of debt in the global economy, brought about by deliberate policies of the Federal Reserve. To propose an alternative explanation based on peak oil, you need far more than a simple correlation of data. You would need compelling data that shows the expected explanation is insufficient in this case.
Therramus has written an interesting paper but it will require far more support to make his position plausible than he has now. I don't wish to discourage him from that at all, but I do think it is wise to keep a sense of perspective about likely causes of the recession versus trying to force fit all the events in the world around peak oil.
Hi David,
I've read your comments a few of times and are thinking about them. Some intriguing ideas here.
To be honest, the old batteries are starting to flag some. Since Gail posted the essay Monday, have become rather pre-occupied with pondering and responding to the many excellent comments - including your own. Also, still have a day job.... which is presently suffering.
Give me another day or so and I'll get back with more detailed thoughts.
Take care
T
Hi David,
No disagreement from me that stronger evidence for mechanistic coupling between the variables is required e.g., showing directly that volatility spikes cause increased investment risk. This part of why I am grateful to Gail for posting ... as I hoped to get input on approach from other commenters.
Which brings to me your suggestion -
"A good test might be to see if there is similar data for some other commodity or product associated with prior bubbles that burst...."
and
"If such correlations occur in those prior bubbles, then the question becomes one of proving causality versus simple correlation.
If no such correlation occurred in prior bubbles, then perhaps this one is different and oil played some important role."
This idea is clever and probably worth pursuing. It would NOT provide an unequivocal test of the hypothesis, but it would give descriptive support for one position or the other. Confirmation of the first outcome would have negative, though not fatal implications. Evidence of the second, would be supportive of the propositions outlined in the essay, but would also run into the absence of evidence is not evidence of absence - conundrum.
Later you write that-
"the simplest explanation (for the financial crisis) focuses on the growth of debt in the global economy, brought about by the deliberate policies of the Federal Reserve".
I struggle with assigning the ultimate cause to the Fed. As mighty as the US is, our economy accounts for less than a quarter of global GDP. At the very least, this consideration complicates the case for Fed-spurred debt-growth, ergo blunting Occam's razor.
Also, the "simplest explanation" depends on what part of the proverbial "elephant" one is holding. For example, invocation of Occam seemed appropriate to me when noting how volatility spikes in oil price occurred upstream of virtually every US recession and stock market crash of the last half century or so (e.g, Fig 8). Not clear what Pachyderm part I was grasping when this realization occurred .
WRT to your closing comments, not much more I can do than look at the data and see where they take me. The next step is to figure out a test of statistical significance for the correlations between 2004-2009. One previous commenter seemed to express doubt that this possible. However, I am talking to an outstanding stats professional who has some great ideas on how to tackle this problem.
Best wishes
The problem with fiat based bubbles is they cause spikes of prices in all manner of things. And the question then is whether the higher prices of some commodity caused the recession or the fiat money printing which led to the price increases which ultimately caused the recession. My strong suspicion is on the latter because we have had credit bubbles burst before peak oil with nearly identical results on the macro level. And in each case there were massive increases in fiat money and/or credit which are equivalent entities in today's economy. And further, in each of those bubbles there were commodities that spiked, often repeatedly. And even further, the commodities that spiked were not always oil. Tulips, anyone?
Now I will agree with an idea I have seen elsewhere and that is that once we hit a really bad credit based recession after peak oil, then we have the problem of constantly declining oil production acting as a ceiling against further growth. The only way around that ceiling is to find another energy source to allow us to do the kinds of things that oil has allowed us to do. In terms of raw energy, such sources exist but each has its own inherent issues, which is precisely why we have stayed with oil for so long rather than transition to solar, nuclear, or whatever other source you care to name. The problem I see with these alternative sources is that proponents tend to understate the costs, both direct and indirect, and opponents tend to overstate the problems associated with such sources. This extremism on both sides of the fence makes attempting to understand the real practicality of these sources difficult.
But back to your thesis - it is my opinion that you are likely wrong on this. Now this is clearly my opinion and I'd love to see evidence that could convince me to the contrary. But as I said before, that would take a fairly complete body of evidence. The case against you is that the US Federal Reserve has been running debt growth ahead of GDP growth in the United States since at least 1980 and the US economy is a huge percentage of the world's total economic activity. Additionally, the dollar's inflation has impacted the global economy precisely because the dollar is the world reserve currency. So inflation by the Federal Reserve does not just impact the United States. Inflation by the Federal Reserve acts as a subtle tax on the entire world. As the graphs from Karl Denninger show, that growth of debt (credit) in dollars has reached the knee of the curve and is going exponential, exactly as has been seen in many past credit based bubbles that burst. Thus you have to show why this time, when all the other parameters look similar to past credit bubble collapses, things are different. And it is in that area where I suspect you will have the greatest difficulty.
I do believe that peak oil will make a recovery more difficult after the debt problem is cleared from the economy, which may take years due to government interference. However, there is room for debate about how much more difficult it will be and even that depends to some extent on rate of decline if we have indeed peaked and how practical the alternatives to oil turn out to really be.
Hi David,
Point well-taken on the potential for outsize influence by the Fed. The point I was trying to make was your suggestion that this is the "simplest explanation" (i.e. my interpretation is that you were invoking Occam) is murkied, although not necessarily nullified, by the fact that the US only accounted for ~ a quarter of global GDP in 2008. My argument on this point was squirrely and semantic - so not much use really.
Now to your other interesting ideas on commodities in other bubbles. This got me curious.
I searched for some commodity data prior to other market crashes/bubbles. Reliable information on Dutch tulip prices in the early 1600s were hard to come by. However, I did find data on prices ($/Bu.) received by farmers for all barley types that spanned the period from 1908-2000 (http://www.nass.usda.gov/sd/dnlds/c_bl_tbl.htm). I used the approach described in the essay to calculate the monthly volatility index from this series of barley prices.
A time series plot showing barley price and barley price volatility over the period from 1919 and 1939 corresponding to ~10 years either side of the October stock market crash of 1929 (arrowed) is posted as an appendix on my Wiki site (http://ideas.wikia.com/wiki/Volatility_in_the_Price_of_Oil_since_Hubbert...). Couldn't figure out how to put this plot into this comment - apologies. Maybe Gail could can help with this -will ask.
Now Caveats. First, the plot is only a single agricultural commodity and from a restricted geographical region (i.e., South Dakota). Second, the data has not had a year to gestate and be checked as has the data in the essay - so the probability is higher that there may be inadvertent errors. The data is preliminary and should be treated with caution. I've provided links for all data referred to in this comment, so if you or anyone else wishes to check my workings and logic please have at it. Third, the US barley market may have been subject to some type of weird prohibition-era dampening of variance owing to its use in certain beverages that I (and maybe you) know and love. Fourth, as dramatic as 1929 was, it still only represents a single bubble data point.
These caveats being said, the plot shows that for the 5 years prior to 1929 the prices for barley were relatively steady with little evidence of prominent volatility spikes. By contrast, the few years after WW1 (1919-1921) and before WW2 (1935-1939) did show evidence of heightened price variance transients (2-3x higher) relative to the 5 year pre-cash period between 1924 and 1929.
I also examined at price volatility in English barley prices over a similar period to address the "prohibition" question and prices looked comparably calm to South Dakota prices in the 5 years prior to the 1929 crash. For English barley prices see - (http://www.iisg.nl/hpw/data.php#united).
Finally, I looked at North Dakota barley prices over the period between 1998-2008 (http://usda.mannlib.cornell.edu/MannUsda/viewDocumentInfo.do?documentID=...). I had to use North Dakotan prices, as curiously, South Dakotan barley prices are not made available via the USDA for some months over this time frame. This apparently is due sensitivity of the data to the State of South Dakota - presumably (IMO) a lobby is at work here.
The ND barley time series for 1998-2008 showed evidence that overall volatility levels were around 3-5x higher than those during the 1919-1939 period. The primary volatility spikes in barley price also appear to occur at intervals coincident with the volatility transients in oil price (as shown Figure 4 in the essay) - albeit that the pattern for barley is somewhat noisier than that of oil.
As cautioned earlier, this analysis is on a tiny subset of commodity prices from a single pre-peak oil bubble. Nonetheless, the barley price data are NOT inconsistent with the hypothesis. Again, to paraphrase a previous comment, the absence of evidence of volatility spikes in barley price prior to the 1929 crash is not evidence of absence - transient instabilities in barley price may have been hidden by other factors operating during this period. Further analyses may also reveal price variance transients in other commodities occurring prior to the 1929 - even though none were seen for barley.
This being said, it is the case that spikes in the volatility index were not evident in barley price in the 5 yrs before the 1929 stock market crash, but did occur in the 5 years or so prior to 2008. Moreover, the temporal pattern of volatility spikes for barley and oil price between 2004-2009 shows a correlation that is similar to the correlations seen between the oil index and the other variables looked at in my essay - e.g., inflation rate and gold volatility.
Any difference in pattern that eventually solidifies between the 1920s and the 2000s may be due to the "gearing of commodities markets" since the millenium, as discussed in an earlier comment by Chris Cook. However, an alternate narrative explaining this is also provided in the ideas outlined in my essay.
In conclusion - preliminary data indicate that barley price in the run to the 1929 crash and the crash of 2008 had distinct and non-equivalent patterns of volatility.
Best wishes
Interesting. Again, be cautious. Correlation is not causation, just a possible suggestion thereof.
You state: "The ND barley time series for 1998-2008 showed evidence that overall volatility levels were around 3-5x higher than those during the 1919-1939 period. The primary volatility spikes in barley price also appear to occur at intervals coincident with the volatility transients in oil price (as shown Figure 4 in the essay) - albeit that the pattern for barley is somewhat noisier than that of oil."
Given that these spikes appear coincident, this raises the question of whether the oil spike caused the barley spike, of whether the barley spike caused the oil spike, or whether something else caused both spikes. I follow the FOREX dollar exchange on a short term basis and if you can find historical data on that index over roughly the same period, you might see some patterns there as well. Another place to look is at the reports on the US money supply, specifically M1, M2, and M3/reconstructed M3 after it was discontinued by the Federal Reserve. If you can find spikes in the dollar volatility at about the same time you then have further correlation.
That would raise the interesting question of whether Federal Reserve action was causing the spikes or was a reaction to the spikes.
Man, you are sharp.
What is your line ?
On correlation vs causation. There is comment on this caveat at the beginning of the essay and also a longer discussion of this issue on my Wiki site.
On the oil/barley spike coincidences, I am being cautious at this point - maybe correlation rather than coincidence is the more appropriate descriptor. A (very) preliminary assessment suggests that barley spikes maybe are occurring later than those of oil. But I want to spend a little more time working on this before I'm ready to make a more definite statement.
Also, the historical data for 2008, and for 2009 to date, is not yet available for monthly North Dakota barley prices, so matching it to the same time course for monthly oil price over the last 18 months (where 2 spikes in the oil index occurred) is not yet possible.
Thanks for the further good ideas on currency and the Fed.
All the best for the future and if we don't get a chance to chat again -
Merry Xmas!
T
Hi Theramus,
My biggest comment, as a trained statistician, is that there is a subset of the comments that reflect a confusion of the map and the territory. Statistics is a bunch of squiggly lines on a piece of paper. The whole point of these squiggly lines is to help us keep track (including whatever "explanation" actually is and whatever "prediction" is) of the events around us. Statistics programs hit on this issue in discussions of whether a particular combination of numbers is a "best" estimator. I was taught, with emphasis, that "best" was, is and always will be a very subjective, human-dependent, issue.
With such a background, I find arguments about whether one is using some sort of cannonically sanctioned definitions to be missing the point. A combination of numbers, a statistic, is good for whatever it works well at. I think the use of your particular combination of numbers has lots of pluses and minuses as have been pointed out. IMHO it is not a minus that it pushes the envelope (gently) about what a standard deviation might be.
I think another weakness in the comments comes from arguing about whether a set of highly complex data is a normal distribution. In the currently measurable world there really can't be a known normal variate since we would (1) have to be measuring to the end of time to know for sure and (2) don't usually have useful variates that we are sure go to plus and minus infinity as does the normal distribution. All we have is some degree of confidence that a normal approximation will work "well enough" for our purposes.
I have heard that some economists have been charged with falling overly in love with mathematics and thinking that these equations, in all their beauty, are what is driving events. I get the feeling that that is the position taken consciously or unconsciously by those who complain extensively about mathematical definitions in something whose details are as noisy and poorly understood as economics. Mathematically precise prediction of the interactive motions of objects in the asteroid belt is a simple problem next to mathematical predictions in economics. I think the reasons are obvious. The statistical modeling that is done is mostly descriptive and can only suggest possible causation. It seems to me that determination of causes has to be done by investigation of specific instances of mechanisms, just like in biology. In this case the investigations may overlap substantially with police work.
I will try to bring this comment to a close with some suggestions about your analysis. I would really like to see some lagged correlations done on the time series. How good and sharp a peak can one get from correlations between oil volatility (jumps, changes, whatever) and other price changes? Having a global statistic would be a nice addition to the analysis.
I tend to think that you are trying to find a non-linear filter in your definition of volatility. People hate uncertainty and react strongly to it in clearly non-linear ways with exponential proportionality and/or thresholds. Additionally, the level of reaction also changes based on recent history. This is pretty complicated so perhaps your very simple absolute value of differences is going to work the best (or the least abysmally). You might try some sort of approach with a threshold definition for spike, however.
Last of all, I associate the "cashing out" issue with something I read somewhere in the various, mostly lefto, economics chatter on the net. The phrase was abbreviated as IWBH-YWBH. "I won't be here - You won't be here". In other words, two people complete transactions with a third knowing that the third person will be left holding the bag. This seems like such an incontrovertible part of human behavior that fancy jargon is superfluous. Even the term looting seems a bit to far removed to me.
So that is as much snark as I am inspired to compose at present. It is addressed mostly at the comments. I think your analysis, Theramus, is a good basic start. It draws attention to a possible pattern and now the slicing, dicing and further working can begin.
Mossy
Hi Tislandia,
Nicely reasoned comment. Could not agree more with just about everything you wrote.
Time is running out to respond in detail - comments close tomorrow. But I'd enjoy hearing further about some of the tests you have in mind. Based on what I read in your comment, you seem to have a pretty good grasp of what I'm trying to do.
I can be reached at the email at the bottom of the post. It would be great if you got in touch and we could start talking.
Best wishes,
T
IWBH-YWBH is also known as "I be gone; you be gone." (IBG-YBG) and may have become a conscious attitude to doing financial business by at least the 1980s.
"You might try some sort of approach with a threshold definition for spike"
Tislandia, Think is an absolutely CRUCIAL concept - thankyou for noting this.
In response to other posters have raised the analogy between a "primary volatility spike" and an electrical action potential in cardiology and neurobiology.
In order to "fire" and propagate within tissues, action potentials have to reach a given threshold above the membrane resting potential.
I suspect there is an analogous requirement for variance transients in oil price before they can cause downstream instabilities in other variables such as the inflation rate, the stock market and the price of gold or barley.
Spikes in oil price volatility below a certain threshold are probably not sufficient to propagate effects.