January 2010 US Natural Gas Update
Posted by aeberman on January 27, 2010 - 10:14am
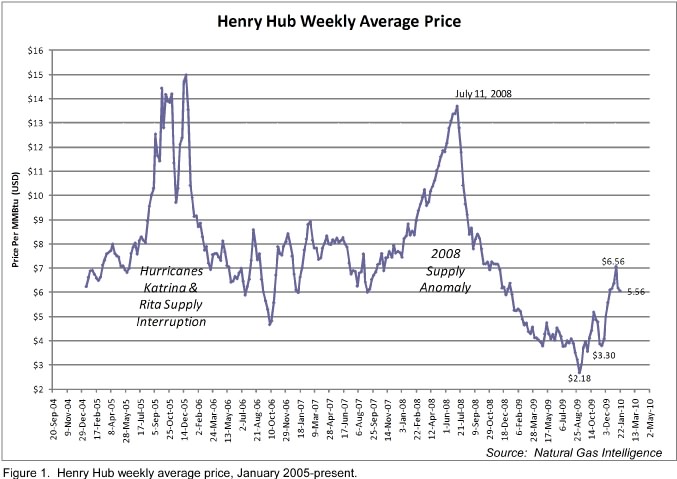
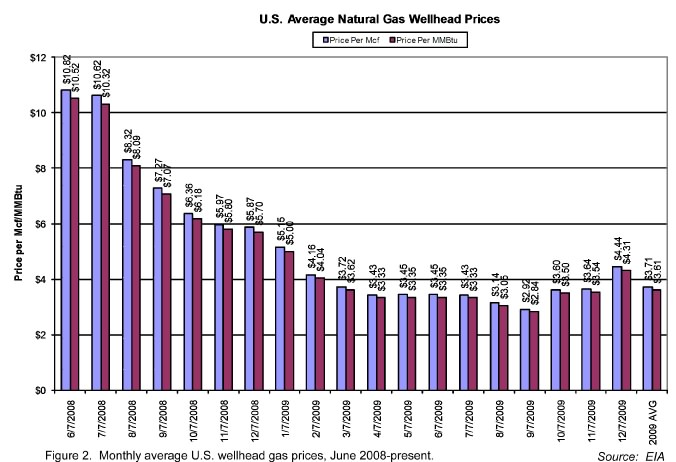
Natural gas prices continue their recovery. Cold weather has caused high levels of space heating that have resulted in reduced gas storage inventories. Henry Hub spot prices have recovered from their September $2.18 low to an average price of $5.56/MMbtu in the week ending January 22, 2010 (Figure 1). The average daily spot price for 2009 was $3.95/MMbtu. Average wellhead gas prices increased in December 2009 to $4.31/MMbtu from a September low of $2.84 (Figure 2). The average wellhead price for 2009 was $3.61/MMBtu.
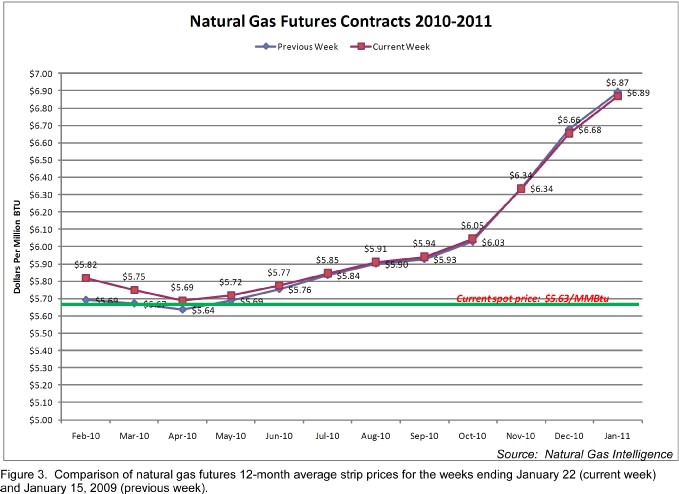
Natural gas futures contracts suggest that gas prices will remain in the $5.50-6.00/MMBtu range through Q3 2010, and then increase toward $7.00 in Q4 2010 (Figure 3). The contract for February 2010 delivery closed this week at $5.82/MMBtu.
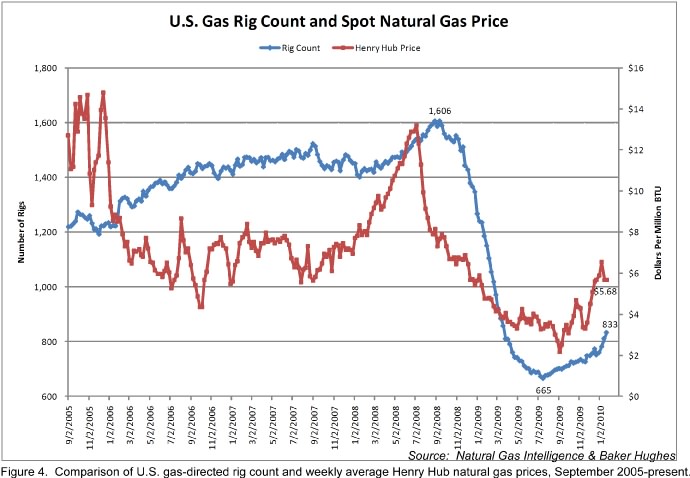
The gas-directed U.S. rig count increased by 22 during the week ending January 22, and is 168 more than the low of 665 rigs in mid-July 2009 (Figure 4). Most of the increase is due to shale gas drilling in the Louisiana Haynesville and Texas Eagle Ford Shale plays. Current levels of gas-directed drilling do not seem warranted by either gas prices or storage inventories, and are likely to contribute to relatively low natural gas prices through 2010, which will probably average $6.30/MMBtu (Bodell, personal communication).
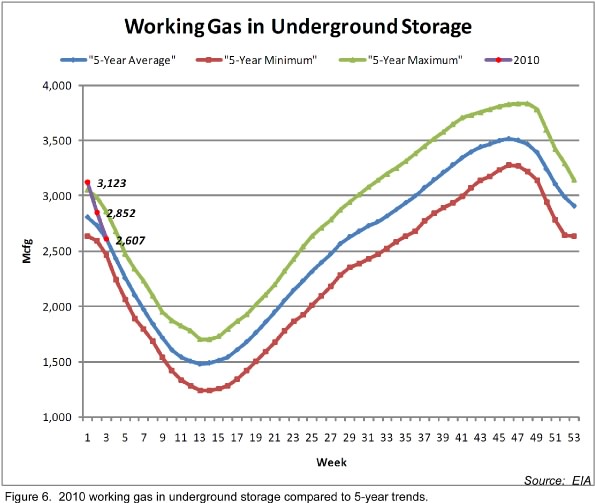
Gas storage for the week ending January 15 was 2,607 Bcf following a withdrawal of 245 Bcf compared to a 176 withdrawal during this week a year ago. Withdrawals have been generally higher for 2010 than for 2009 during the past two months (Figure 5).
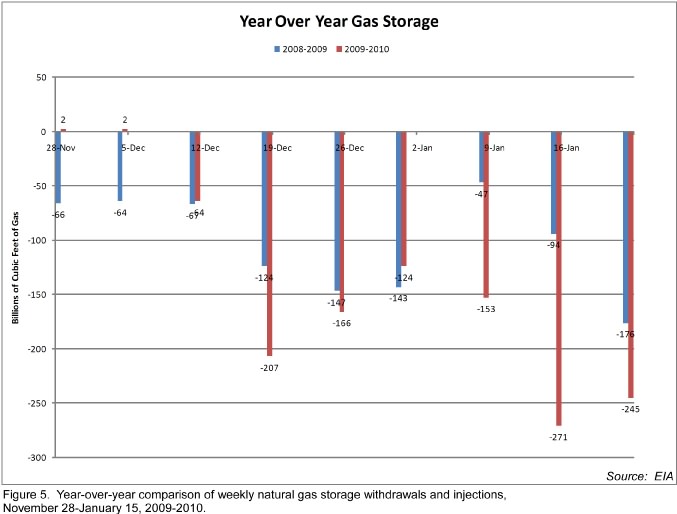
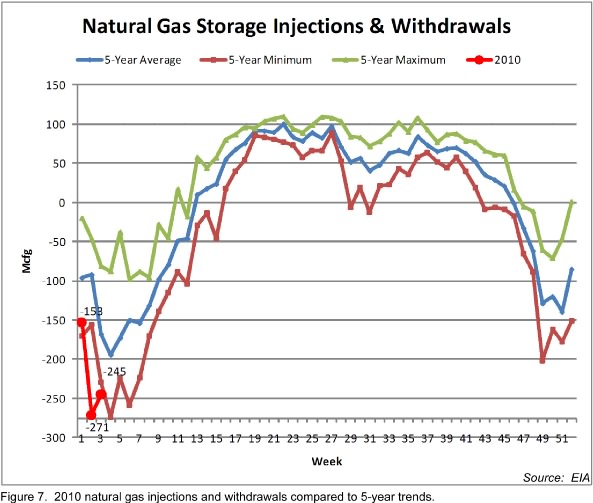
Gas storage inventories are 22 Bcf higher than a year ago, and 6 Bcf less than the 5-year average for this week (Figure 6). The 245 Bcf withdrawal was 69 Bcf more than that of a year ago, and 80 Bcf more than the 5-year average (Figure 7).
It is likely that depletion of gas storage inventories will continue through the winter, and supply will probably be at parity with recent years by the end of the first half of 2010 or sooner. This would ordinarily result in a price increase, and still may, but continued drilling of high initial-rate shale gas wells, and depressed industrial demand because of the recession will probably keep gas prices near their current level through the winter heating season. Additionally, gas prices are now high enough to cause switching from gas to coal for some electrical power generation plants, which will further lessen demand.
At the same time, the long period of declining gas-directed drilling from September 2008 to July 2009 should result in decreased supply, which may cause gas prices to increase. This dynamic balance continues to puzzle analysts, and results in average 2010 price forecasts that range from $5.25 to $9.00/MMBtu.
The wild card, of course, is the economy. Apparent improvements in the U.S. and other leading world economies are probably related in part to massive government spending and support programs that are now slowing or ending. Investors and consumers are worried and skeptical. This week, China indicated that it will decrease lending and increase interest rates. President Obama’s intention to limit investment banks’ ability to use federally insured funds for speculation dampened U.S. and other markets. Finally, concern about the solvency of Greece, Spain and Dubai threatens economic recovery. One analyst stated that now that the college BCS (bowl championship series) is over, we have the economic BCS to live with: banks, China and sovereign funds.
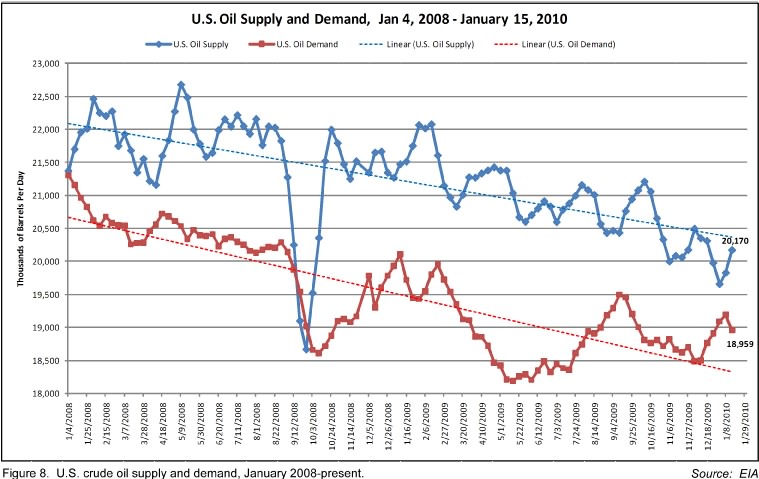
U.S. crude oil demand has been a useful gauge of economic direction for some time, and current trends suggest that the improvements of the past 5 or 6 weeks have reversed at least for now (Figure 8). Crude oil demand is currently 2.3 MMbopd less that levels in January 2008, and is almost 1 MMbopd below levels in January 2009. This suggests that, while the economy is improving, it has a long way to go before re-establishing pre-recession levels. Recoveries are like that.
Contact
- Content: editors at theoildrum dot com
- Tech support: support at theoildrum dot com
License

This work is licensed under a Creative Commons Attribution-Share Alike 3.0 United States License.
Thanks for the update, Arthur!
Here's total national employment in the "Oil and Gas Extraction" sector:
Go to this BLS page: Databases, Tables & Calculators by Subject. Select All employees, then Mining and Logging, then Oil and Gas Extraction. Interesting that things bottomed out in 2003. Of course you can cue up hours, wages, what have you. I see that in October 52.8% of the labor force were production workers.
This would make for an interesting study - the big Achilles Heel with building an NG economy would be the limits of the workforce, it seems to me. How many roughnecks did it take to drill 30k+ holes in 2008? And how many more would we need to supply extra gas for NGVs? To say nothing of managers etc, who require years of training.
Very interesting graph KLR. You probably understand some of the less obvious factors behind the numbers but for the others I'll toss in a few. The big bump in the early 80's was an response to the embargo days. The hype in the oil patch was unbelievable at that time. The rig count topped out around 4600. With a view from the inside I can assure you that at least half those rigs were drilling prospects with little or no chance of working. It wasn't just unsophisticated investors throwing money away. Many company managements where writing checks like there was no tomorrow. I worked for one of the worse at that time: spent $550 million and produced less than $50 million worth of oil/NG.
Even as the hype fell away the carry over affect lasted until 1986 when the KSA opened the valves wide and flooded the market with $10 oil. The decline until 2005 continued despite occasional better price support. IOW, not enough long-lasting hype to feed the greed monster. Now some more critical points to answer your question. But I need some more details: is the employee count that of just oil/NG operators or does it include the service companies? From the mid 70's to today there has been a huge swing in who is employing the actual operational personnel. In the old days a large percentage of the field ops folks were employees of the oil company. Not today...not even close. This is especially true in offshore ops. Real life example: Deep Water GOM well drilled in 2008: 140 souls onboard. Perhaps 2 to 4 were employees of the operators. All the rest worked for the drilling contractor, the service companies and a few consultants like me. No company, not even ExxonMobil, cannot drill one foot of hole with just their employees. How many roughnecks on that job? Two towers of 5 floor hands, one driller, one tool pusher and one derrick hand. But there were about 50 (left out the galley hands) service hands supporting the effort during each shift. Don't want to put down those hard working floor hands but they are the easiest to replace. The hands with the service companies are THE critical component. Many of those jobs are very technical and take many years of hands-on experience.
Onshore jobs are equally dependent upon the service companies but just not as complicated as offshore ops. I was on onshore rigs as the recent employment bust began. This is how the drilling contractors respond: the most experienced (the tool pusher) is demoted to driller, the driller is demoted to derrick hand, the derrick hand is demoted to floor hand, etc. And salaries are reduced with the demotions. But at least they have a job. The floor hands take the brunt of the lay off. And the service companies send many of their hands to the house. Of course, they'll hang on to the most experienced hands if they can afford it. But this is where your Achilles heel may kick in big time: the experienced hands are also the old hands. Many are looking at retirement in 5 to 10 years. If demand kicks back in many of the experienced hands may voluntarily be heading to the house for good. This would only worsen the experience gap as the second tier that was laid off have gone off to more stable careers.
There's an addition problem when drilling demand pops back up: lack of drilling rigs as well as all the support equipment. A drilling contractor or service company with reduced cash flow isn't going to sit there and just watch the equipment rust in their yard. The market for scrap steel is pretty good now. One of my owner's companies cuts up scrap steel and ships in to China mostly. In addition to scrapping drill rigs earlier this year we cut up 10 offshore service boats. Even when demand kicks back in and there isn't enough equipment to handle the jobs we shouldn't expect a big rush of capex back in the rebuild. The memory of this last bust will be fresh and no one is going to quickly throw billions of $'s back into the business unless they expect sufficient stability to last long enough to at least recover their capex before the next recession led bust hits them.
Rockman,
I read your posts with great interest. One strong theme seems to be the cyclical nature of the industry, and how savvy operators can play it profitably.
the old cliche: the best cure for high prices is high prices etc
Question: what do you think it will take for people in the industry to really start to believe in the peak thesis: this time its different. and act accordingly.
could you lay out a possible scenario(s) or sequence of events where suddenly the lightbulb would go on and the industry itself would begin to behave differently.
maybe its an unfair question - i go back to the gold industry, which has been in obvious documented decline for 8 years or so, and only now are the senior people saying - we are definitely past peak.
poly -- Ignoring the CEO's of the public companies (or at least what they say in their press releases), I know of no one in the oil patch that doesn't believe in PO. In fact, when I started in 1975, many were already talking about the inability to keep adding to our reserve base significantly in the future. Though we're one of the few companies aggressively pursuing drilling opportunities, the desire within the industry to do so is very strong. The difference: we have the capex...they don't. Oil/NG prices are more than sufficient to justify drilling many conventional plays. Our biggest challenge now is having enough time to evaluate these prospect in sufficient detail. We've committed to over $125 million in our first 5 months of existence. And there are only four of us. We don't generate drilling projects: we're buying them from generators who have spent thousands of man-years and 100's of million of $'s to generate prospect that they now have no capex to drill. Why, even though oil/NG are down from the highs, is drilling so attractive these days: we're drilling a deep well off the coast of La. that 12 months ago had an estimated cost of $23 million. Due to the drop in drilling activity (and thus costs): current estimate = $13 million. Just a WAG on my part but if there were a sudden capex flow into the oil patch that rig count would go up 50% almost overnight. But then you have that feed back: increased demand for drilling = increased cost to drill = fewer wells drill given the same capex availability.
The oil patch doesn't need a light bulb going on: they need capex. I suspect the crash of the banking/investment industry has played a significant role. And even if the money starts showing up you might not see as big as rush as we saw a few years ago. Look at the rapid rise in rig activity during that time. That curve represents many billions of $'s spent ( much in the shale gas plays). When prices fell (especially NG) the result was that many of those wells won't recover their initial investment. If prices boom again many operators will hesitate to throw money at the situation quit as fast as they did back then. That memory will be fresh in their minds.
Rockman,
Don't you find that capital providers are more willing to invest in shale and, to a somewhat lesser extent oil, than conventional gas plays at this time?
aeberman
Hard to answer aeberman. Since we're internally funded I don't mix much with the capex market today. But for sure the SG plays were a hot commodity with investors/companies. But then when NG prices fell many were burned to death. We still hear a lot about the Marcellus but most of the other SG plays have been dead for the most part. With NG prices rising above $6/mcf we might see some increased movement back into them.
Everyone wants oil plays...conventional or otherwise. But there just aren't that many such projects out there. We're focused on deep NG plays that have big NGL yields. Some of these projects, though technically NG, can produce many hundreds of bbls of oil/day. Just a guess but I think the capex providers might be just as anxious to get back into oil/NG as are the operators. I think that many of them just don't have the capex to do so. As I mentioned elsewhere, oil/NG prices are more than sufficient today. And there are many conventional/nonconventional prospects being offered at big discounts at a time when drilling costs are the lowest they've been in years. Yet we see no big rush back to drilling yet. The projects are there, the equipment is available and relatively cheap, prices are sufficient to make a very good profit, exploration technology now makes finding oil/NG less risky than it has ever been in my 34 yr career. yet we don't see the rig numbers jumping up. All I can assume that while the motivations to drill are more than sufficient it's not happening because the capex isn't there.
Yeah Saudi Arabia has not invested in their timber industry for years
now there is not a tree left to cut in the whole
country.
Generally lack of investment is also a symptom of not having something.
We are cutting very expensive brush with the UNG plays it ain't trees.
I am reminded that Dennis Meadows (author of "Limits to Growth") said in his talk, the constraint that causes us to hit limits to growth is inadequate capital. It looks like that is what we are hitting now.
Gail -- From my vantage point on the inside it's difficult to not see it any other way. And to be clear about the attractiveness of oil/NG drilling today let me point out something I didn't highlight earlier. While we're in the game putting reserves behind pipe with the anticipation of selling out when/if the market spikes in a few years, we don't use high anticipated oil/NG prices to justify the investments we're making today. Since we know we can't predict future prices we just make it easy on ourselves: we're using whatever the current price is when we run our economics. If NG was selling for $4.50/mcf then that's what we use. Right now we're using $6.25/mcf. Prices drop to $4/mcf next summer then we'll use that value in our economic assumptions. And we use no escalation in future prices. And we're not drilling low potential return projects: we won't drill anything that doesn't offer the POSSIBILITY of a 5:1 or better return.
Again the bottom line as I see it: there is no economic restriction nor lack of prospects today. If the capex were there we should be seeing at least a few hundred more rigs drilling IMHO.
the naughts, imo, were and are a lot like the go- go '80's . companies who had no business in the oil business were acquiring e&p's. utilities buying e & p's......just pouring the money in. too many $'s chasing too few prospects. diversification was the name of the game. mobil got in the act by acquiring montgomery wards. a lot of these acquisitions were later spun off, usually at an apparent loss. u.s. steel, on shakey financial ground, acquired marathon. and dont forget t. boone pickens' infamous junk bonds. reagan was our non leader. self regulation.
what else was supposed to happen ?
similar to the 50'$ uranium boom, i am told.
BLS only keeps the URLs for these graphs up for a limited amount of time I see, so here it is on Photobucket:
Thanks for all the replies. Will mess about with this data more in the future; likely the rig count and production employee curves are quite similar. ROCK: Industries at a Glance: Oil and Gas Extraction : NAICS 211
Sounds like that would include your Schlumbergers.
Yes it does KLR. Thanks for pulling that out. Have a well in a little trouble so I've been tied up with it until now. The service companies started dumping hands very quickly. I was on an onshore rig last March and the word was coming in daily that one service company had cut 2,000 hands, the next day another company cut 5,000, etc. By April the in-house consultants started getting tossed fast. By Sept the employee lay offs starting kicking in big time.
All on TOD will understand the impact of employee layoffs. But I doubt many understand how the majority of wells drilled in the U.S. originate with independent generators. In the last 8 years I’ve been involved in some of the most active trends in Gulf Coast La. and Texas. Of the hundreds of wells drilled I did not observe one drilled by any major oil company. The major did dill wells but not on the scale of the independent companies. Just consider the shale gas plays: how many wells wer drilled by the majors? These independent groups are also the source of capex for the majority of 3d seismic shoots. And 3d is truly the mother’s milk of domestic exploration these days. I think most on TOD understand that we can’t drill our way out of PO. But that fact doesn’t discount the fact that domestic oil/NG development is a critical component of our economy. The prospects we’re buying now are from these independent generators who are very desperate to get their projects drilled. Obviously while they are choking on their inventory of prospect and 3d seismic data they are not generating new projects. Just a WAG but 100’s of millions of $’s will be lost on mineral leases that will expire without being drilled. Even if demand for prospects jumps up many of these groups will not have the capex to put the leases back together.
Thus, in a nutshell, if the oil patch recession last much longer we’ll have a serious problem responding to any sudden demand for new drilling: lack of prospects, diminished cash flow as new wells haven’t been drilled, lack of capex for prospect generation, lack equipment that has been scrapped and a lack of experienced personnel. To make matters worse if another price spikes throws the capital market into shambles again there will be that much less capital available to all domestic industries. As I said above, we can’t stop PO by more drilling. But we are today still the third largest oil producer on the planet. U.S. independents might be able to maintain that status. But at this time that “might” seems questionable IMHO.
The problem of all the grey-hairs in the industry retiring en-mass was identified some time ago. I recall the CEO of one of the companies I worked for (a subsidiary of Halliburton) complaining about it ten years ago - he was wondering where he was going to get the people he needed in future.
I've been retired for a couple of years now (sold my house in the city at the top of the market and settled permanently in the mountains.) My brother retired at the end of 2009. I was a oil industry business analyst, he was an oil company VP. Most of the people are close to retirement by now, if they didn't get forcibly retired when this downturn hit. By the time the next boom hits, most of them will be retired and out of the business, particularly geologists.
At the other end of the age spectrum, there are few young people coming up. One of my young nephews is now working as an engineer for an oil company in Switzerland. However, his company was bought by a giant Chinese company, so now he's developing oil projects in West Africa for the Chinese. It's great for him (he's making three times as much as in North America), and it's great for the Chinese, but ultimately it's going to be less great for the United States. Previously, he was developing Canadian oil sands projects that would have supplied oil to the US.
Another nephew, who is studying for his masters degree in economics, spent the summer working on a project evaluating the economics of supplying Canadian uranium to China. Again, this is great experience for him, and great for the Chinese since they've got about 100 nuclear reactors on order, but it doesn't do much for the US.
From this I deduce that not only are the Chinese buying up the world's energy resources, but they are also buying up the human resources to develop them. They don't really seem to care how much it costs. My nephew in Switzerland said the Chinese parent company didn't seem to have decided what it wanted him to do yet, so they spent about $12,000 to send him to a conference in Houston. They're just gathering technological knowledge for when they need it.
That's very interesting Rocky. I've been out of the international circle for over 3 years and had not heard about the Chinese acquiring expats. About 6 or 7 years ago I had a drilling super complain about the Chinese acquisition of his company and replacing the experienced expat night supers with young Chinese engineers who were paid less for the month then the expats were being paid for a day. With your background I'm sure you know how good that plan looked on paper. But then when then added up the costs of all the foul ups caused by these inexperienced hands perhaps the Chinese have seen the light. As you probably know too well that going with the lowest bidder can ultimately cost you more than choosing the high priced spread.
Well, at some point they may replace the Western engineers with cheap Chinese engineers, but at this point in time the Chinese probably probably realize they don't have the expertise to put together some of these oil projects.
One interesting thing I have found is that Canadians are considered cheap labor in the international oil industry. It's not so much that they work cheap, it's that their skill levels are high for the level of salary that they expect. Everybody else at that level expects to make more.
So true Rocky. When lumber prices got so high we started using Canadians to board our locations instead. Wasn't to bad once you got use to all that moaning. Eh?
imo, we are seeing the effects of the lack of experience in nearly every flashy power point presentation being perpetrated (fpppbp).
these clowns, yes, i said clowns present type curves made up of composites of wells "normalized" wrt start date. totally fraudulent, totally bogus.
not once have i heard one of these so called analyists call this into question. only berman has done so. unfortunately, this is not just inexperienced people perpetrating the fraud.
try this experiment: make an excel file with a group of wells with random ip's and random exponential decline rates. sum the wells and what you get is an hyperbolic decline. there is no justification whatever to assume that their newly drilled well with a flashy ip (fip) will exhibit hyperbolic decline, according to their "type curve".
this is the same as claiming that ip is a valid metric for assigning an eur out to 60 years.
maybe web hubble telescope will see this post and prove (mathmatically) the deception, the fraudulence, the slight of hand in these "type curves". then again, maybe web won't touch it with a ten foot pole because my example is empirical.
elwwod -- If you keep letting everyone know about our dirty litle tricks I wouldn't want to be standing next to your car when you start it up. "Accidents" do happen, ya'know.
yeah, rockman, you may want to move even further back:
steve c. posted this on the other thread:
http://www.ogj.com/index/article-display/3739013961/articles/oil-gas-jou...
and my response:
normalized type curve cumulative: 1.2 bcf/well
actual cumulative: 0.8 bcf/well.
tell me there is a misprint here. tell me i have misinterpreted the caption on the curve. the type curve over-estimates cumulative by 50 % ?
there is so much wrong with that curve.
apparently, the article is available to any and all because it is a "white paper".
elwood -- we're always making predictions. Sometimes in a logical and supported manner...sometimes not so much. But eventually the truth comes out. Someone says a well will produce X bcf over a period time then you'll eventually see if that projection is correct or not. I suspect some of the optimistic projections are coming from folks who know they are pushing it too hard. But I suspect many of them are hoping there's enough new drilling to keep their missed projections from being obvious. And many of those optimistic projections are targeted at Wall Street. Next quarter they won't care what you said 4 months ago. They''l be looking for the sizzle of the day.
When I was doing a lot of acquisitions there would often be big disagreements with the seller on future production. As you know it's not an exact science and there's some wiggle room. But when some engineer/geologist would push the projection too far my response was simple: I don't care...I'm using my number. Don't like it? Fine...I'll take my money somewhere else. That usually brought them back to reality.
yep, i am currently working on backtesting a type curve for the parshall bakken field, nd. what i have concluded, so far, is that a raw, unblemished calculation of the data results in a questionable model, i.e. some data filtering (aka cherry picking)is needed and apparently, being perpetrated.
the more i see of these shale play's type curves, the more absurd they seem. or maybe i am just hallucinating.
I will be posting something again on fraudulent predictions. This is going to be very interesting.
Man I thought Lincoln made that sort of thing illegal in the U.S.
?- )
Does that Oil Demand graph really show a recovery is underway? Where on that graph is there an upward trend? The last 5 data points are above the indicated trend line, but that's far too little to be persuasive, and even the last of those is again heading back downwards. Even if you only take the last three months, then tend is negative although less so than the entirety of the series. The only real period giving a significant positive trend would be from the minimum in May 2009, but that's as cherry-picking as it gets.
I am confused by the Oil supply and demand graph. I know how to get EIA's oil products consumption, which I take to be demand, from here. Why would supply be so much different? I can understand with natural gas, there can be big differences in the amount of gas in storage, but that wouldn't be the case with oil.
Gail,
Look at my Figure 8 in my most recent post: http://www.theoildrum.com/node/6155#more.
The EIA sums "Products Supplied" by category (motor gasoline, distillate, jet fuel, residual and other products) to reach Total Demand. Supply is determined by summing different categories (crude production, NGS production, crude imports, product imports, and other supply). Oil supply is different from natural gas supply, as you note, but there is considerable oil storage especially in periods of contango. As more of a global commodity product sensitive to many factors including the strength of the US dollar and speculation, oil price has a higher frequency than oil demand.
The full spectrum of oil supply and demand components is updated weekly and can be found at this link: http://www.eia.doe.gov/oil_gas/petroleum/data_publications/weekly_petrol....
Art
I guess I would be interested in understanding what exactly constitutes Supply. When I look at table H1, which is labeled "Product Supply Summary", I have a hard time seeing an amount over 20 million. The December number seems to be 19,110,000; the November number seems to be 18,484,000. The January to December average appears to be 18,676,000, which seem to be in line with what you show as demand, not what you show as supply. What am I missing?
sjn,
See my post http://www.theoildrum.com/node/6155#more and look at Figure 8.
This shows that oil demand is trying to make a comeback, but is doing so in typical cyclic fashion. Still, oil demand is 2.35 MMbopd (11%) less than it was in January 2008, and 0.98 MMbopd (5.2%) less than in January 2009.
Art
Arthur,
This is a nice and useful summary of the natural gas situation. I'm curious about the comment that current levels of drilling can't be justified by gas prices or inventory levels, attributed to Bodell. At 800+ rigs working, I believe there is a general consensus among E&P CEOs that storage injections will be falling below historical levels going forward (assuming normal weather patterns), leading to much tighter supplies by next winter. What is your view?
Catman,
You are correct that storage surplus is being reduced at near-record weekly withdrawal rates. Most of this is related to exceptionally cold weather, but storage inventories remain slightly (22 Bcf) more than levels at this time last year, and very close to the 5-year average.
Some of this may be driven by reduced production which means that more supply must be removed from storage because less pipeline supply is available, but the weather modelers aren't buying this.
Everyone has assumed that, with the great reduction in gas-directed drilling, supply would fall. This has been delayed or masked by decreased demand because of the recession, the completion of several new pipelines, especially the Rockies Express, that are delivering >2.5 Bcfd of gas that was previously shut-in. Also, there were almost 5000 Barnett Shale wells drilled in 2007-2008 that are now being connected to sales, plus the recovery of production platforms in the Gulf of Mexico and start up of several big gas-producing projects in the Gulf including Thunderhorse. High initial rate wells in the Haynesville Shale are another factor.
That being said, there is still much controversy about the true state of supply. Many think that the EIA needs to update its algorithm that accounts for lags in state gas reporting--the famous "balancing item"--that has probably resulted in reporting more than 100% of gas produced over the past several months.
A friend spoke with someone high in the EIA a few days ago who said that the EIA had done a very thorough re-analysis of all supply regions, and now believes that gas supply will grow with 875-900 gas-directed rigs. My friend remains "stunned". I don't believe it. I think it takes about 1100 gas-directed rigs to maintain supply, but maybe all the talk about efficiency improvements in shale completions has more merit than I thought.
Anyway, that is the current situation. The executive summary is that there should be a drop in supply because of reduced rig activity, but no one can yet find it, and the EIA doesn't think it will happen. I suppose it's a classic, unsatisfying "wait-and-see" situation.
Art
indeed the algorithm needs corrected. afaict, the doe does not take into account the "packing or unpacking" of the gas transmission system.
a year or so ago, i was doing some modelling of monthly gas storage and one of the conclusions i came to was that the previous month's demand was a factor in the current month. i never really got to modelling weekly data. montly data appears in the rearview mirror, weekly data is viewed through a "fun house" mirror.
geewhiz posted a link to texasenergyanalyst below. there is mention there of flow analysis in the gas transmission system.
If you look at the EIA's version of the natural gas storage graph, one thing that is striking recently is how quickly the amount of gas in storage has been falling--at least how fast it is dropping in the range--from above average to barely average:
How do you see storage withdrawals in the next few weeks going? Do you think the recent withdrawals have been anomalies, due perhaps to cold weather?
Your Figure 7 seems to be saying the same thing--a little worrying. Perhaps use (say for electricity) is up this year.
this is an annualized decline rate of 2.3 % from 58.5 bcfd in 02-09 to 57.6 bcfd in 10-09(dry gas production).
net withdrawl from storage increased by nearly 10 bcfd, we 1-15-2010 vs last year.
i am questioning if coal switching and colder weather can account for all of this 10 bcfd increase. lower price may also be in play. it seems like production may be down sharply. fuzzy data.
edit: checking the heating degree days for a composite of grab samples(denver,chicago and ny) from '09 vs '10 it looks like '09 was about 6 deg f colder than the w/e 1-15-2010. so consumption from residential and commercial may have been slightly less this yr vs last. hdd source:
http://www.degreedays.net/
Gail,
Please see my comments directly above to Catman. Gas usage for electric power generation is up this year because of low natural gas prices, but that has already been discounted into the equation, and that is changing now that gas prices are about the ~$4.00-4.50 threshold that determines gas vs coal switching.
Somewhat milder weather will mean lower withdrawals. This weeks draw will be announced later this morning (Thursday). I will report back then!
Art
That graph is one I never quite understood. It would be useful if the storage size were static over time, say the last 5 years, but in reality actual storage capacity has increased over time.
A more useful (at least for financial purposes) graph would be one where gas in storage is plotted as a percentage of available storage rather than an absolute number.
Rgds
WeekendPeak
what is the current volume of North American production? Is it possible to show a graph of production history? Thanks
Here is the longer term historical context from the Energy Export Databrowser:
This databrowser uses the BP Statistical Review dataset which only contains annual data up to 2008. Someone else may have a monthly chart that shows seasonal fluctuations and gets you closer to the present.
Happy Exploring.
-- Jon
This is a graph of US marketed natural gas production, in the way I usually display it. Production for 2009 (the latest year available) is the top line on the graph. It sort of bounces along above 2008. The dip in September 2008 was for hurricanes. There seems to be somewhat of a downward trend to the 2009 line.
Notice how as volatility tails off in oil supplied it picks up in NG; this was due to consumers switching from distillate heating oil to NG for winter heating. I had to extrapolate the monthly EIA data back from 1981, which is the first year they provide numbers for; yet they have series for the component products that go back further, and their sum looks to be the correct number for the total. Why the EIA data has these limitations I'm not sure. If you want annual numbers back to the 40s consult the Annual Energy Review.
Thank you Arthur for an excellent summary.
I have one comment about Figure #3, however.
Because of the large seasonal cycle in natural gas usage and price I think it best to provide a longer time series than your 12 months. For the same reason, a 12 month average price is not that meaningful for short term comparisons. Here is the same information as presented in the Energy Futures Databrowser:
This plot tries to give the user a sense of the volatility both in past settlement prices and in day-to-day futures chain prices. In the last month of trading, the volatility in futures prices has been quite subdued. But, as you correctly point out, the wild card is the economy. From all of the charts you've posted, and with an expectation of further economic troubles ahead, I'd say we are pretty well supplied with natural gas (good for consumers) but at some risk for another drop in prices (bad for producers). I believe the chance of a large upswing in natural gas usage and prices in the next 12 months is very small.
Happy Exploring,
-- Jon
Does anybody know if this is more wet or dry gas? I have been watching propane stock levels plummet...
gog -- By its nature most SG is fairly dry if not completely so. Just a guees but I would think radical stock drops would be more related to consumption then anything going on at the well head.
Rock, good point, the stock drop would be mostly due to consumption (mostly related to the corn harvest being wet this year), however, I think that production has been on the decrease since the turn of the century increasing the possibility of price spikes and shortages in years of high consumption. I was wondering how much more of a decrease was coming over the next year due to ng drilling cutbacks (50% of the propane domestically produced comes from ng).
Are they plummeting beyond the normal seasonal variation? US LPG stocks vary every year from over 100 million barrels in the summer to ~60 million barrels in mid-winter.
Yes, we will almost certainly hit a record low stock level in March -- I would predict 12k-14k barrels based on typical consumptions b/w present and March. The previous low was in March of 2003 at 18k barrels.
The underlying issue is production has been falling since 2000.
indeed, the gas gravity for the haynesville is about 0.57 (air = 1.0). the gas gravity for pure methane is 0.55. so 0.57 is dryer than a pcf.
I hate to disagree, but the premise that began this thread is simply misleading. You often see this mistake in the media among reporters or people who are not familiar with market dynamics. "Spot prices have recovered from their September $2.18 low to an average price of $5.56/MMbtu in the week ending January 22, 2010". While this is technically correct, the price we are seeing for spot gas today are almost EXACTLY what the the futures market was trading it back in september. The average forward price for feb delivery has been somewhere around $5.40, very near to where we are today. Over the last 6 months, the market has rallied as high as $6.40 and as low as $4.50 (round numbers), but it would be a mistake to characterize prices as significantly different than they were in back then. Even with an incredible cold weather event, things basically are the same (which most would probably considered bearish).
and now a daily dose of don't worry, be happy:
DAVOS-Saudis say don't worry about peak oil
http://www.reuters.com/article/idAFLDE60R1LZ20100128?rpc=44
and,
DAVOS-Shale gas is U.S. energy "game changer" -BP CEO
http://www.reuters.com/article/idAFLDE60R1MV20100128?rpc=44
Nat gas prices. i was expecting prices to go higher than $6, but what do i know. it seems storage is at such an all time high, and the shale play (esp with horizontal drilling) has contributed to the storage level surplus, but really with the recession, there just doesn't seem to be any demand. hence storage levels so high. I am reading that nat gas prices are coming down again to the $4 level, possibly even $3 level.
http://www.texasenergyanalyst.com/News_and_Predictions.html
this guy has been spot on for at least 2 years i know of.
this week sort of averages out with last week. fuzzy data, or more likely "packing" and "unpacking" of the gas transmission system.
ng, after all is compressible.
i dont think that is really true, but i could be mistaken or you could be talking about a few weeks ago.
thanks for the link to texasenergyanalyst.
gee -- I don't believe anyone's prediction of future NG prices...especially mine. But my instincts, as well as my partners, is that a significant price drop next summer won't be a big surprise. If it happens we'll choke back production as much as we can afford. But there's even a silver lining for us: more NG prospects for sale at a better price as well as lower drilling costs as other folks pull their horns back in.
thanks for the info Rockman, lower prices for the consumer are one thing, which is always good news, but bad for the royalty owner (thats me) as well as the oil production company. guess it's a wait and see.
Understood gee...that "mailbox" money is sweet.
a nice summary of the state of ng here.
The Century for Natural Gas: What This Means for Investors
http://seekingalpha.com/article/185979-the-century-for-natural-gas-what-...
(dont be thrown off by the title, there is no mention of the threadbare and wrong claim of 100 yrs supply[reserves]).