Dispersion, Diversity, and Resilience
Posted by Gail the Actuary on February 27, 2010 - 10:28am
If we want to have any hope in controlling our destiny we have to understand our environment. In one sense, if we treat our environment as a control system, capable of responding to a stimulus, we need to understand not only its behavior, but how it will respond to the stimulus. One can ask: will it collapse in response to dwindling resources? Or will it rebound and stay resilient? For that we require a good model of the system. And of course, the simpler the model to describe, the better.
The system thinker and cyberneticist Ross Ashby summed it up with two seminal ideas. His simplicity criteria, the "Law of Requisite variety" states, "Variety absorbs variety, defines the minimum number of states necessary for a controller to control a system of a given number of states." Our capabilities thus become limited by the amount of information available to us. The second, the "Good Regulator theorem" goes "every good regulator of a system must be a model of that system". In other words, to regulate any causal system, we should require a model of how the system will behave normally and how it will react to a disturbance. The two relate directly to the classical view of control theory, that of controllability and observability. That may sound a tad idealistic, but that's how an engineer would respond to a problem statement.
The seeming diverse complexity of a system such as the Amazon rain forest, remains in many ways simple to describe. Interestingly, we can actually understand how that system evolves and adapts, given that we have a simple-enough model to work with. To compare and contrast, we can also consider a model of oil resources and how we can understand a seemingly random distribution of reserves.
Further, to have any chance of controlling the behavior we need good observability via good measurements. A human mobility metric is just one example of this, one simple to model, which gives us a good understanding, and one that we can monitor in the future.
For these three cases, (1) biodiversity, (2) oil abundance, and (3) human mobility, I will describe a few simple models based on entropy principles (maximum entropy dispersion, the "entroplet") and working with barest and most minimal information available to us. We will see how far that can take us. The discipline of complex and resilient systems remains wide-open for discussion.
I have a long-running interest in the topic of disorder. When I first approach a problem, I try to characterize the observed behavior according to whether it follows a predictable, unpredictable, or random/noisy process. I rarely use the categories of complex or chaotic. In my mind, if you do that, you give up some hope in solving the problem.
So I tend to rebel against conventional notions of complexity. As defined by the scientific establishment, complexity seems to have taken on a discipline of its own. Once some problem gets characterized as complex or chaotic, the big thinkers emerge from the Nonlinear Institute of Profundity, leaving the rest of us behind. As a more pragmatic approach, I wouldn't mind capturing a complementary world-view to overtly sophisticated models of complexity. I notice that the expert-level mathematical explanations invariably become hairy, while the popular explanations lack common sense or excessively rely on heuristics (see oil depletion analysis as a primary example of the latter). However, the most elegant approaches tend to apply the simplest patterns to concisely describe the complexity. I elaborated on this topic in a previous post, so I won't try to explain the philosophy behind the "simplicity out of complexity" paradigm.
Instead, I want to practically demonstrate where and how some simple and rather parsimonious explanations can go a long way to explaining why disordered, yet seemingly complex, systems have very intuitive explanations. And in keeping with the intent of this post, I will try to show how these system might become resilient against collapse. I believe that we often mistake complexity for garden-variety disorder (i.e. entropy) and that the diversity that arises due to strictly entropic arguments may also demonstrate some robustness. In the end, if we can understand how the diversity arises, then we may figure out how to achieve or at least maintain a good outcome.
As a muddying factor, I sense that people's intuition fails when they try to deal with complexity or entropic disorder. Although I consider the supporting explanations and rationalization for disordered systems rather simple, they do build on some math. Ordinarily, this would get the math-phobes upset, and if this ever gets a wider audience, it may anger some of the experts on the subject as well. As you will see, the premise that I will outline essentially trivializes certain aspects of the "complex ecosystem". What we actually observe amounts to nothing more than our own filtered view on a disordered state. As the key point to retain, the observed disorder runs high enough so as to simplify the entire argument, both mathematically and conceptually.
In my previous post on crude complexity, I used the writings of Murray Gell-Mann to guide the narrative. He basically explained how seemingly complex systems often possess the simplest descriptions. To extend this context, I will use Edwin T. Jaynes research on probability and entropy to help justify the simplicity premise. According to Jaynes, we just scratch the surface of the practical applications of entropy if we consider it only as something that arises out of thermodynamics. Instead, if we treat entropy as a first-class measure of the disorder in a system, it can prove useful in many other scientific investigations.
Of course, we can make a connection to the oil depletion equation as well, as simplicity often proves contagious. The systems thinker John Gall (Systemantics) once said: "A complex system that works is invariably found to have resulted from a simple system that worked".
I will go through a few cases of seeming complexity masquerading as random and disordered behavior. These share the approach of applying some basic ideas and common sense, and then working out the problems as you would in a chalk-talk. The shorter the better in that case, otherwise you risk having your audience doze off.
I tend to use the same math in all these analyses. So if you get stuck in understanding the principles in one of the explanations, something might spark your intuition in another. I apply the same math as a way to unify my understanding, as well as to substantiate the overall approach. As with most effective arguments, the more broadly we can apply the arguments, the more confidence we have in its generality and applicability. For many of the global problems we face, we don't have the benefit of a controlled experiment. The earth itself acts as both the test and the control. For that reason, if we can find unifying global behaviors, we gain confidence by the accumulation of these "proxy" explanations. As a side effect, you may end up finding quite a few interesting emergent results from the case studies.
The first case:
Relative Abundance DistributionIn nature, the diversity of species gets reflected in the samples of various populations taken during scientific surveys. Scientists invariably find, and we get reminded quite often, that a few species predominate in their abundance while the majority of species have relatively sparse populations. Many species remain extremely rare or go undiscovered. This data typically gets plotted as a Relative Abundance Distribution (RAD) histogram.
As a result of these empirical observations -- usually taken in some very diverse populations of a certain category of wildlife or plant -- you will actually see relative counts of the most common species outnumber the rarest species by orders of magnitude. In sampling experiments, the rarest species may actually have counts of only 1.
Most recent research on this topic has concentrated on understanding the relative species abundance (RSA) of somewhat isolated ecosystems. Understandably, scientists approach it this way so that they can limit or control the set of measurable parameters and therefore understand the phenomena on a larger and more heterogeneous scale. This 2007 article in Nature, Patterns of relative species abundance in rainforests and coral reefs, suggests that interactions among species don't have as large an effect as imagined.
Abstract: A formidable many-body problem in ecology is to understand the complex of factors controlling patterns of relative species abundance (RSA) in communities of interacting species. Unlike many problems in physics, the nature of the interactions in ecological communities is not completely known. Although most contemporary theories in ecology start with the basic premise that species interact, here we show that a theory in which all interspecific interactions are turned off leads to analytical results that are in agreement with RSA data from tropical forests and coral reefs. The assumption of non-interacting species leads to a sampling theory for the RSA that yields a simple approximation at large scales to the exact theory. Our results show that one can make significant theoretical progress in ecology by assuming that the effective interactions among species are weak in the stationary states in species-rich communities such as tropical forests and coral reefs.I have no problems with their assertions, only that the math that they invoke goes a bit overboard, and provides very little insight. Practically speaking, with just a few nods to maximum entropy, we can show agreement to the results in a few lines of derivation. With that simplicity, we get the benefits of a significant amount of extra insight. Also note that the authors state that they don't know the interactions; this uncertainty suggest that entropy arguments may work out well. In other words, maximum entropy provides an avenue for reasoning about an uncertain world.
To derive a universal RAD, we start out with a few assumptions.
We first assume that different species evolve as random processes that essentially fill up space. I propose a quantity that, for the lack of a better term, I call the adaptation level, A. This can have the units of, for example, #organisms/acre so it maps to a parameter proportional to sampling some species.
We next use the Maximum Entropy Principle (MaxEnt) to describe the uncertainty in the time it takes for a species to reach an adaptation level.
p(t) = (1/t0) exp (-t/t0)These are both probability distributions, the first a density function and the second a conditional cumulative probability.
P(A,r | t0) = integral of p(t) for all t such that t is greater than A/r
The first expression essentially states that we don't know how long it takes to reach a given adaptation level, only that it has a mean time, t0. This mean time could reach millions of years, but for now the specific value doesn't matter. We just assume that the likelihood of times around that mean has a maximum entropy described by the exponential probability function, p(t). We then assume a rate, r, that relates a time to reach a given adaptation level, A = r*t. Every species that reaches the adaptation level has to evolve for a time t=A/r, so the conditional cumulative probability is described as P(A,r | t0) and derives to the value below.
P(A,r | t0) = exp(-A/(r*t0))We also have uncertainty in the adaptation level, A, assuming only that it also has some mean value A0 with the same MaxEnt probability density function.
P(r | t0,A0) = integral of P(A,r | t0) over all AThis results in the cumulative adaptation rate function as follows:
P(r | t0,A0) = 1/(1+A0/(r*t0)) = 1/(1+r0/r)If we replace A0/t0 with r0, we see that the above relation describes a set of species that evolve with a huge dispersion -- high enough for it to describe a fat-tail distribution of rates. In other words, the large disorder in both the time scale and adaptation level generate a rate function that generates an even larger entropy in the evolution of various species. The two degrees of freedom in uncertainty gives it double the entropy of a single MaxEnt exponential probability density function. This uncertainty results in a very disordered system. I make the claim that diversification and growth of speciation possesses maximum entropy. However consumed energy aids in driving adaptation, it doesn't affect the probabilities, as entropy plays the lead role in generating the dispersion.
The relative abundance comes about when you consider that low values of r will lead to smaller relative population levels than higher values of r. Since probabilities get invoked, we also see the effects of abundance as a combination of population size and rarity. In other words, abundance essentially relates the value of r (proportional to the size of the species population when evaluated over a period of time) to rarity, which states how often that size of population occurs. (To foreshadow a bit, the same argument holds in sizing oil reservoirs.)
At this point, I don't necessarily care how the authors' of the Nature article derived their own model, just that it has greater informational complexity than my derivation. Since the equation for P(r | r0) contains only a single adjustable parameter, r0, it meets the Gell-Mann acid test for simplicity. When we transform r0 to an abundance, we use a proportionality constant, k, and call the result an abundance dispersion factor, D=k*r0*time.
CDF : P(X) = 1/(1+D/X)The basic normalized shape looks like the following histogram plotted on a double logarithmic scale (the log-normal heuristic is shown for comparison):
PDF : p(X) = D/(D+X)^2
That essentially describes the extent of the theory. Simple enough, so let's see how effectively a single parameter fit works with the observed data.
Results. Data of relative abundance usually gets plotted as a cumulative rank histogram (also known as a Whittaker plot) or as a Preston plot (which essentially describes the probability density function (PDF) as a logarithmically binned histogram).
I took data from the Nature article and applied the simple theory on Whittaker histograms first. The following diagrams contain a single-parameter fit to the data, shown as the RED lines. Each diagram corresponds to a different isolated tropical forest region and the RAD for sampled tree species within those regions. The BCI region has a dispersion factor of D=23 while the Pasoh region has a factor of D=14. Since this function has scale-free properties, the dispersion factor really only shifts the location of the knee in the curve along the abundance axis. The BCI has a higher mode for the relative abundance than the Pasoh region, which could imply that the most common species adapted faster for the BCI region or that the BCI region evolved/adapted over a longer period of time. Importantly, we can't tell the difference because we have derived A0/t0 only as a ratio; in other words, we have lost the ability to separate the two effects.
 |
 |
The movement of the mode becomes more apparent if graphed as a Preston plot. This bins the data on a more granular level, yet gives a view that more intuitively shows the most frequent population as a peak value. The same data shows up as BLUE dots below.
The general trend shows some universality. Plotted below in RED dots is the fit to a sampling of moth populations.
Figure 3: RAD histogram for moth population. Red dots show the dispersive model.
Remember, the factor D sets the peak position and provides the only adjustable parameter in the fit. Maximum entropy considerations alone set the width of the curve. For the moth RAD histogram shown above, the black line gives the log-normal fit. This may appear better than the dispersive fit, but the log-normal has three adjustable parameters available for tuning, and has little additional intuitive significance.
Not all of the RAD plots show a mode peak away from low abundance. For example, the adjacent figure reproduced from the Nature article generates data for some localized coral communities. From what I understand, these have gotten somewhat isolated from the larger metacommunity which understandably would show a larger diversity in the coral population. The isolation gives many low abundance species, binned as base 2 abundance categories between 0, 1 and 2 (20=1, 21=2, 22=4).
Qualitatively this also agrees with what the dispersive formulation says if we apply low values of the dispersion factor, D. Again, these populations may not have evolved/adapted as fast or they may not have evolved/adapted over a long enough period. Without additional information, this is all that the maximum entropy principle can tell us.
If we plot a range of dispersion factors on the same binned max rank of samples, the results appear as below. Apart from low values of D, varying the value of D simply shifts the distributions away from the origin. Each shape defines an entroplet, which lacks any parameter besides its position, becoming essentially scale-free. On the horizontal logarithmic scale, the width looks like it remains constant, but it actually spreads out to accommodate a larger range of individuals per species.
This article further describes the extent of the metacommunity diversity. The histogram on the left below shows the dispersion of coral species on a more local scale while the plot on the right duplicates that result while also displaying the large shift (256 much larger than 66) on a metacommunity scale. So even though the dispersion factor changes by nearly a factor of four, the range in number of individuals per species agrees perfectly with the maximum entropy formulation.
 |
 |
The dispersive formulation will likely work on any general population simply because the relative abundance of species results from a principle of maximum disorder in the adaptation rates. With that uncertainty in place, the Maximum Entropy Principle guides us to the correct distribution.
This brings up an interesting situation. What happens when we try to apply this construct on a massively larger metacommunity scale? The tree diversity of the entire Amazon basin provides a situation that we can analyze in context. The distinction here is that the heterogeneous nature of the geography and geological events places the dispersion on a smeared time-scale. As you can see below, the histograms show a much broader shoulder than the isolated adaptation results.
Figure 6: RAD histograms of trees in the Amazon basin. (Ignore the jump between 1 and .01 on the y-scale, as this looks like a typo)
The time integration runs from the first significant event at a time t+T ago to the last significant event t ago (also the maximum entropy result for a range). The value of T denotes a very large ecological time scale in comparison to t.
P(X) = Time integral from t to t+T of k*r0*time/(D+k*r0*time)^2This generates a logarithmic-shaped function that has a much more diverse spread in abundance levels compared to the isolated adaptation result. The values of D1 and D2 correspond to an epochal time range, and C is a constant that normalizes the result to 1 as X goes to infinity. Compare the red line below to Figure 6.
P(X) = C*ln( (1+X/D1)/(1+X/D2) )
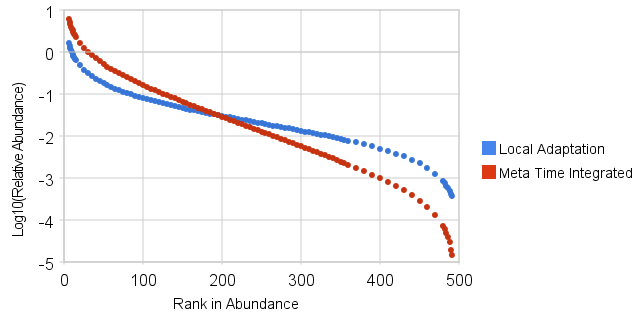
Figure 7: RAD histograms of dispersive models with specific Local start time and smeared Meta start time. For Meta, D ranges from D1=1.7 to D2=3300. For Local, D is fixed.
If you look at Figure 4, you can almost intuit what happened during the time integration. Each of the peak positions for various values of D gets spread out over time so that the linear superposition of the individual curves creates a broad almost flat-topped peak on the binned histogram as shown below. The interpretation for this uniformity makes intuitive sense: if you reach far back enough, every effective adaptation level would be achieved, split equally between each doubling octave. The effects of dispersion spreads out the impact over time so that each generation contributes evenly. In my book, that defines an existential entropy, conceptually similar to the flat white noise spectrum that forms the background radiation in the universe -- in other words, noise as a form of ultimate disorder.
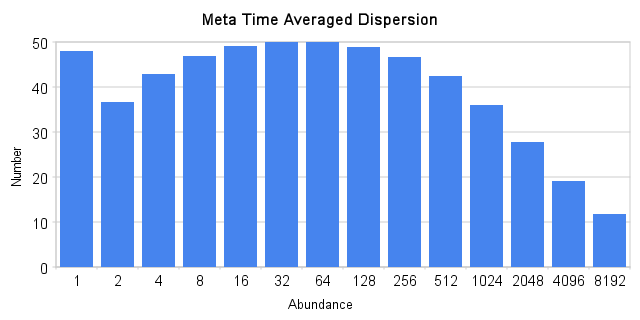
Figure 8: RAD histogram of time integrated metacommunity. Compare with the inset of Figure 6.
That basically explains the diversity of species according to entropic dispersion. Resilience occurs as a result of the shear diversity in the species. If one species becomes extinct, another one will likely take its place. It make take a long time, but it certainly will happen.
If you want to get really overloaded in math, go to the papers written by the authors of the Nature article. They don't seem to mention entropy at all, preferring to use conventional combinatorial statistical arguments (exactly how you can derive entropy, by the way). So you can take the long way around the lake (their approach) or take the scientific shortcut across the water (my approach). I essentially ignored their overly sophisticated derivation because it lacked the simplicity that these problems should demonstrate. Go with the math that I have described and you can actually try out the models yourself and get the insight that I have reached. Recall that this model contains only a single parameter and, quite fundamentally, we have nothing to fear as the results derive from garden-variety disorder and the complexity essentially wilts away.
I especially harp on the math model because the math alone shows significant similarity to what happens when we consider the sizing and abundance of oil reservoirs. That serves as our second case.
The second case:
Oil Reservoir Size DistributionsI use essentially the same entropic dispersion formulation to describe the variation of reservoir sizes in the context of oil exploration. Instead of searching for living organisms and ranking the relative abundance, we sample geological formations and rank order the sizes of reservoirs we find. I go into the details of this approach in previous posts so won't repeat the details here. The fact that a dispersion form works just as well for oil as it does for species has to do with the disordered range in rates that go into reservoir formation. The figure below shows the agreement for entropic dispersion for North Sea reservoir data.
Figure 9: Data of reservoir sizes for North Sea (blue dots) plotted alongside dispersive model.
I find it intriguing the similarity between the the large population of a few species of living organisms and the large size of just a few oil reservoirs. The same MaxEnt math generates exactly the same fat-tail distributions.
Another interesting analogy in reservoir size distribution relates to how the dispersion factor varies significantly in different regions of the world. In particular, the USA has a dispersion factor that appears lower than elsewhere. Fitting the values for the USA, we see a value of around 1, whereas the North Sea has a value of 21 (see Figure 8).
The flattening of the PDF that occurs in the Amazonian case for tree diversity also occurs in the USA for reservoir size diversity. The uniform time-shifted aggregation of the entroplets does not affect the tails but makes the mid-range of sizes more equally abundant. As a bit of insight, this likely accounts for the greater percentage of low volume stripper wells in the USA.

The knee in Figure 10 becomes a flatter top, but the fat-tails remain unaffected.
I suppose that the the USA could have expended more effort in finding small reservoirs than other oil-producing countries, which may contribute to a lower range of values for D. The geological rate of reservoir formation also could have progressed on average much more slowly here than elsewhere. Or, more likely according to this model, it has started from a more recent geological epoch, so it hasn't matured as much as the rest of the world. Whether this has consequences, or remains an inconsequential data point will have to wait until we get better data.
In a sense, the diversity of reservoir sizes around the world has effectively reached that of a set of biological species; the origin of oil formation in geological terms occurred long ago, but geological activity has likely allowed the movement of oil to effectively "restart" many times over epochs. Since I showed that the greater diversity of USA oil follows the pattern of Amazonian tree species, we should also find a more uniform density of oil reservoir sizes around the knee of the curve across the global spectrum.
However, unlike the resilience of a diverse biological population, no rebound effect occurs for oil depletion. Once we deplete oil, it doesn't come back. The size of the reservoir doesn't matter. Other smaller size reservoirs can take up the slack, but unlike the diversity of living organisms, dead organisms do not recover.
Many other analogs exist between species search and reservoir discovery. For example, shown below is the species equivalent of a creaming curve (from Species Abundance Patterns). The rate at which we find oil reservoirs has a close analogy to the rate at which we find species. In terms of the reserve gowth issue, this has the same uncertainty in knowing when you have reached an asymptote..
Figure 12: Species equivalent of a creaming curve.
The third case:
Distribution of Human TravelA final analogy has a purely human element. Human travel and mobility patterns in the USA show the same dispersion formulation with excellent agreement to recent data. We might imagine that human travel patterns would follow some complex behavior, yet if we simply assume that the delta X position changes and the delta T time changes each follow maximum entropy probability density functions, then the travel patterns reduce to a simple dispersive result (shown as the blue dots below).
Figure 13: Human mobility in terms of dispersive model.
The green curve generates a single parameter fit to measured cell-phone usage data. The expression shown in the inset is a heuristic developed by the authors of the original Nature article in which they describe a "magic" exponent, beta. That fits equally well but has no basis in fundamental understanding. The beta term shown happens to come close (1.75+/-0.15) with the entropic dispersion exponent of 2. Unfortunately, the academic discussions surrounding human mobility appear even more sophisticated than that for eco-system diversity and the simple understanding gets lost.
As an interesting experiment, the dispersive function can be generated via a Monte Carlo (MC) simulation drawing from two MaxEnt variants, delta A and delta T, and then dividing the two, resulting in a set of sampled rates. One such MC run looks like the following, with the analytical result overlaid. In the real world, the effect of reduced sample space generates the noise observed.
Figure 14: Generating dispersion rates by deltaX/deltaT MaxEnt variates.
The resilience to human travel patterns in the face of dwindling oil supplies will become important in the future. In terms of the dispersive model, the value of D will likely shift to smaller values without changing the nature of the curve. We will still live in an entropic world, but the energy that allows us to move around easily will inhibit our resiliency.
Discussion
The simple theory defined here certainly does not qualify as blind curve fitting. Although abstractly defined, the assumptions follow from scientifically valid premises. As Jaynes suggests, you use maximum entropy arguments when you face any degree of uncertainty in your numbers. If you have better numbers, you can use those. The Maximum Entropy Principle has a close relative in Bayes Rule in this respect. As it stands, like Bayes, the model helps to manage our uncertainty by including valid prior information.Dispersion : The effects of disorder result in variation of adaptation rates as a form of dispersion. This has more to do with entropy than energy flow.
Diversity : The huge changes in relative abundance comes about from the dispersion. I do not consider this emergent complexity, instead it describes diversity predicated on disorder. One man's perceived complexity is another's effective simplicity.
Resilience : The significant diversity derived simply from disorder considerations leads to the possibility of resilience against potential collapse. Since species may not have as much interdependence as assumed, it seems intuitive that the diversity can act as a buffer against extinctions. If one species becomes extinct, another more slowly evolving species may take over.
Using the same arguments as for species adaptation, we can arrive at similar results for reservoir sizing. The rather simple logical arguments should prove useful in any analytical context that proceeds under disordered, entropic conditions (see case 3 for a largely sociological example). In this regime you can't use deterministic models such as Lotka-Volterra, and you need instead to consider probabilities for all your measures. Jaynes had it right when he titled his final book as "Probability Theory: The Logic of Science".
Besides Jaynes, the pioneers of fat-tail and fractal statistics have contributed some interesting insight, especially in pointing out that fat-tail statistics occur more often than common wisom dictates. Taleb's admonition to not overuse Gaussian/normal statistics becomes very important when working under maximum uncertainty. As an example, the fact that we know the variance of a process, would suggest that we use a normal distribution, yet we have no knowledge of the standard deviation of any of our data sets. We barely have knowledge of the mean as it stands.
A bit puzzling in that I can imagine that Mandelbrot could likely have derived the dispersive model as it has a remarkable similarity to the discrete power-law Zipf-Mandelbrot heuristic. Mouillot (reference below) mentions Zipf-Mandelbrot in an abstract with reference to RAD but I do not have access to the full document. Mandelbrot, and Taleb for that matter, appear to show some disdain for actually deriving any of these distributions, preferring instead to describe fractal or fat-tail behavior as heuristic functions. Although they have very good insight regarding uncertainty and randomness, they seem to prefer the world of descriptive rather than proscriptive statistics. Many of the diversity research efforts appear to think that modelling only involves heuristic fits of previously categorized statistical distributions to the data (reference here) . Only the authors of the Nature article have a model (the Neutral theory) to base predictions on, yet that model will likely prove too intricate to get burned into our consciousness.
Why no one else has previously formulated such a simple model as maximum entropy dispersion would require a separate discussion. It may exist somewhere in the literature but I have yet to find it. I realize that my arguments have some abstract concepts, such as equating uncertainty with entropy, that may take some getting use to. Suffice to say, Taleb may have captured the :
"We scorn the abstract, we scorn it with a passion." from The Black SwanAs any software developer understands, the right abstraction often helps to clean up complexity. It just takes the right insight to get to that abstraction.
References
- Igor Volkov, Jayanth R. Banavar, Stephen P. Hubbell and Amos Maritan, Neutral theory and relative species abundance in ecology, Nature 424, 1035-1037 (28 August 2003)
http://arxiv.org/PS_cache/q-bio/pdf/0504/0504018v1.pdf - Differential Entropy and Probability Distributions
http://www.mtm.ufsc.br/~taneja/book/node14.html - Towards a general theory of biodiversity
http://www.nature.com/nature/journal/v410/n6831/full/410923a0.html - A unified theory of biogeography and relative species abundance and its application to tropical rain forests and coral reefs
http://sciwebserver.science.mcmaster.ca/biology/faculty/kolasa/Hubbell_1997.pdf - Sean R. Connolly, Terry P. Hughes, David R. Bellwood, Ronald H. Karlson, Community Structure of Corals and Reef Fishes at Multiple Scales, SCIENCE VOL 309 26 AUGUST 2005
http://www.reefresilience.org/pdf/1363-Community_Structure_of_Corals_and_Reef_Fishes_at_Multiple_Scales.pdf - Species Abundance Patterns
http://www.life.illinois.edu/ib/453/453lec16spprichness.pdf - The Theory of Island Biogeography
http://web2.uwindsor.ca/courses/biology/macisaac/55-437/lecture9.htm - "Extinction most likely for rare trees in the Amazon rainforest"
http://www.eurekalert.org/pub_releases/2008-08/stri-eml081308.php - MOUILLOT D., LEPRETRE A., Introduction of relative abundance distribution (RAD) indices, estimated from the rank-frequency diagrams (RFD), to assess changes in community diversity, Environmental monitoring and assessment, v.63, 2000.
- Stephen P. Hubbell, Fangliang He, Richard Condit, Luis Borda-de-Agua, James Kellner, and Hans ter Steege, "How many tree species are there in the Amazon and how many of them will go extinct?", PNAS August 12, 2008 vol. 105 suppl. 1
http://www3.bio.uu.nl/peb/staff/personal/htersteege/pdfs/Hubbell%20et%20al%202008%20How%20many%20tree%20species%20are%20there%20in%20the%20Amazon%20and%20how%20many%20of%20them%20will%20go%20extinct%20PNAS%20105.pdf - http://en.wikipedia.org/wiki/Niche_apportionment_models
- Simulated geographic variations of plant species richness, evenness and abundance using climatic constraints on plant functional diversity exponential curve describing rates.
http://www.bgc-jena.mpg.de/bgc-theory/index.php/Pubs/2009-ERL-AK-JA-RP-BR
- The model also has similarities to the Principle of Least Effect, which has both physics and information science origins.
Contact
- Content: editors at theoildrum dot com
- Tech support: support at theoildrum dot com
License

This work is licensed under a Creative Commons Attribution-Share Alike 3.0 United States License.
Thanks, WebHubbleTelescope!
Insurance is of course another area where people are interested in describing what might look like completely chaotic distributions--both the number of claims (often Poisson or binomial) and the size of individual claims (often log normal, or perhaps Pareto--especially at the tail). Very large claims are of special interest, because these can comprise a disproportionate share of an insurance company's costs. Because of this, insurance companies pay particular attention to modeling a fat enough tail. If you are in the black swan business, you can't assume there are no black swans.
But these models are based on BAU. If things start shifting, the parameters could start shifting quite dramatically. For example, it people leave houses vacant, the number of house fires could increase. Or if people start driving less, the number of auto accidents will decrease. I am not sure about liability claims. It may be that if people are out of work, and need money from somewhere, (and lawyers are a bit slack on work as well), they will pursue a claim that might not have pursued before.
So while the distributions are interesting, my experience is that they can change quite quickly. These are just snapshots.
Of course you have a good point. That is why I have not worked my way up to economic models.
Any time that people are involved in making decisions based on outcomes (of themselves and others) we enter the realm of game theory. And game theory models are in general impossible to solve.
Insurance models are of the class that approaches the zero-sum game with everyone trying to beat the system. I know enough not to work that.
Yet, I do know how to model risk in physical systems, which is the field of reliability. I can use the same ideas in terms of figuring out the infamous bathtub-curve. http://mobjectivist.blogspot.com/2009/10/creep-failure.html. And the bathtub curve does show up in terms of risk management, which is people learning how to not get into accidents. I can almost guarantee that we can use my ideas on that topic. That field is very primitive because they don't know how to do fat-tail analysis properly.
Not that I won't try to work my way to the point of modeling more complex human decision-making, but we can learn a lot about how we interact with the resources around us until we reach that point. You see, there is very little game theory involved in that. Nature cannot practice reverse psychology and negative reverse psychology on us. All that humans work on at this level is need and greed, and that is something we have a chance at working on and understanding.
WHT your posts are like a fractal themselves, you can zoom on any part of them and examine them for hours, especially to my untrained mind. I am familiar with some of the concepts you mention but you further my interest in the stuff I have no idea about.
Great post and must read IMO, especially for folks without much background into the work.
Here is another interesting bit that you can stare at. I created a travelling dispersion packet, what I call an entroplet, as an animated GIF.
(Click on the above to animate, its about 1MB in size)
The way you look at this is that you imagine time is receding in space logarithmically and the dispersion of the variant keeps getting bigger (whether it is species diversity or oil reservoir sizes).
The mind blowing part of this is that we are using up our resources in just the reverse manner. The fact that we are actually doing it in exponential fashion means that we are rewinding the logarithm by exactly canceling its effect and we will go through our reserves and resources linearly in time.
log(exp(k*time)) = k*time
That curve is the equivalent view of a Hubbert curve of oil discovery and we are peeling it away in nearly real time, not the tens or hundreds of millions of years it took to create.
Thanks for your interest. This subject is fascinating to me as well.
I didn't read the rest of the article after this first paragraph. There are few things in life which depress me as much as modern man's superimposition of his mentally-fabricated order upon a Natural world which we know so little about.
The scent of a rose, studied, tested, analyzed, reduced to a chemical compound, synthetically made, mass produced, packaged and sold.
A teeming community of bugs, plants, animals and birds, living profound lives which we hardly understand, are known to us as an "ecosystem." Some ecosystems are useful to us. They are studied, analyzed, reduced to biology, turned into mono-cultural crops, modified, patented, sold.
And now, here we are, some 7 billion souls, clamoring for space, food, resources and wealth. So much so that we have reduced all the natural world (aka "resources") to mathematically precise behavioral models, graphs, exact estimates of "inventories," all so that we may know how long this "inheritance" will last and how many human parasites can eat away the surface of the earth, until death do us apart.
shox -
Well put!
My own feeling is that while this sort of stuff can be very interesting from a purely intellectual standpoint, I fail to see how it would ever have any impact on the manner in which real decisions are made regarding how we attempt to deal with future scarcity of energy supply and other vital resources.
Unfortunately, there appear to be but two very simple principles that govern such decision making: i) follow the path of least political resistance, and ii) do things that maximize the benefit for the people calling the shots and the vested interests that put them in power. That's it - no complex distributions, multi-variant control equations pertaining to the environment, or notions of entropy.
Regarding the environment, ultimately, the guiding principle increasingly is: to hell with the environment - we need the goodies now! I also think that the concept of entropy is often over-extended from it's original intent to applications where it is force-fitted to support someone's preconceived notion of the way things are or the way they should be.
The beauty of entropic arguments is that they don't rely on preconceived notions of the way things are or the way things should be. It says that we deal with the limited information that we have at hand and let nature's variability (via the notion of entropy) fill in the gaps for us.
Unless you are saying that the kids are starting to use it as an excuse, by saying "entropy caused me to lose my homework" instead of relying on the old standby of the dog eating the homework.
So I am curious as to how you think the concept of entropy has been misapplied?
WebHubbleTelescope -
I guess my main problem is that I have an engineer's rather narrow view of what entropy is and is not. While, in general, entropy is supposed to be a measure of the degree of disorder in a system, in most practical applications it usually pertains to the flow of either heat or chemical energy through a man-made system, such as an engine or a chemical reactor, or some other sort of process where the energy inputs and outputs are well-defined and relatively easy to determine.
However, it is when the concept of entropy is applied to living ecological systems that I start to feel lost, sort of like the only person at a party who doesn't get the joke that everyone else is laughing at.
Let me start by posing a philosophical question ..... to some degree, is not 'disorder' in a complex ecological system often in the eye of the beholder? Take two of the parameters that appear to be very important to your analysis: number of organisms per acre, and number of species per unit whatever.
First dealing with organisms per acre:
Let us say that we have two different acres of land that are completely isolated from each other. One has a very deep rich soil just teaming with zillions of microorganisms but has been over-hunted, over-farmed and is rather devoid of even small terrestrial animals and is also covered with a mono-culture crop such as corn. Yet, its number of organisms per acre is huge. Let's say this is an acre of land at some farm in Nebraska.
Now the other acre of land has rather poor soil with relatively few soil microorganisms but has been untouched by human hands and has a very large number of surface plants and animals. Let's place this acre in some sandy-soil delta of a tributary of the Amazon. Then let us say that the acre of farm land in Nebraska has 10 times the number of organisms (albeit microorganisms) than the acre in the Amazon delta. If organisms per acre were the criteria re entropy, then would you conclude that the pristine acre in the Amazon has a higher entropy than the acre of Nebraska farmland?
Then dealing with number of species:
If an acre of abandoned Detroit slum just happens to have 50 species of cockroaches, 20 species of flies, and a dozen species of rats; but an acre of Alaskan wilderness only has 6 species of birds, 12 species of mammals, and a handful of different insects (mainly mosquitos and black flies), would you then conclude that the acre of Alaskan wilderness has a high entropy than the acre of Detroit slum? So, doesn't the type of species have some bearing on the question? And who decides which species are important and which are not? And important to whom?
While these may be simplistic and perhaps even silly examples, I hope it illustrates some of the conceptual problems I have in applying the concept of entropy to ecological systems. It strikes me that one can make all sorts of simplifying assumptions and do all the math and generate all the graphs, but does one really know what is going on?
I think we sometimes fail to recognize the limitations of some of our mental constructs. As such, I would remind you that the science of thermodynamics owes more to the steam engine than the steam engine owes to the science of thermodynamics: because first there was the steam engine, and only much later was there a science of thermodynamics.
That is fairly straightforward to explain. It is all about adaptation over time. As long as the adaptation shows dispersion we will get this range of species abundances. All the specific cases get smeared out.
Like you, I too am an engineer. I suppose the only part of the mental model that is missing is understanding probability as the controlling abstract construct. Jaynes almost finished his book Probability Theory: The Logic of Science before he died. In it he explains how many scientific theories can be much better understood by applications of probability than deterministic constructs. And that doesn't just include quantum mechanics. But the big hurdle that one has to get over is to understand probability. Jaynes also thought the approach he advocated had been poisoned over the years by scientists and mathematicians who would not pick up on it.
Taleb essentially is trying to do the same thing from the point of view of soft sciences. That is why I stressed Taleb's quote about hating the abstract notions. The oil depletion analysts are particularly guilty of working exclusively with the concrete, whereby they do all sorts of bottom up analysis and try to understand the specific geological properties underground. That is all meaningless in the sense that it is too much work for too little gain. All that you need is some average values and let the maximum entropy theory to take over.
S = integral of p(X)*log(p(X)) over all X
So this is a bit opposed to an engineering mindset where the concrete is valued. By the same token, phycisists don't like this approach too much because it doesn't expose all the "self-organized critical phenomena" that might be underlying some complex behavior that they may observe. That is why I call it garden-variety disorder. To a real physicist, they don't want to see garden variety disorder, they want to see interesting physics that will get them recognition in their own field.
Statistical mechanics is more fundamental than thermodynamics. I don't see how understanding how a steam engine works helps to understand how a transistor operates. Yet you can use statistical mechanics to explain both.
WebHubbleTelescope -
I guess my main problem is that I have an engineer's rather narrow view of what entropy is and is not. While, in general, entropy is supposed to be a measure of the degree of disorder in a system, in most practical applications it usually pertains to the flow of either heat or chemical energy through a man-made system, such as an engine or a chemical reactor, or some other sort of process where the energy inputs and outputs are well-defined and relatively easy to determine.
However, it is when the concept of entropy is applied to living ecological systems that I start to feel lost, sort of like the only person at a party who doesn't get the joke that everyone else is laughing at.
Let me start by posing a philosophical question ..... to some degree, is not 'disorder' in a complex ecological system often in the eye of the beholder? Take two of the parameters that appear to be very important to your analysis: number of organisms per acre, and number of species per unit whatever.
First dealing with organisms per acre:
Let us say that we have two different acres of land that are completely isolated from each other. One has a very deep rich soil just teaming with zillions of microorganisms but has been over-hunted, over-farmed and is rather devoid of even small terrestrial animals and is also covered with a mono-culture crop such as corn. Yet, its number of organisms per acre is huge. Let's say this is an acre of land at some farm in Nebraska.
Now the other acre of land has rather poor soil with relatively few soil microorganisms but has been untouched by human hands and has a very large number of surface plants and animals. Let's place this acre in some sandy-soil delta of a tributary of the Amazon. Then let us say that the acre of farm land in Nebraska has 10 times the number of organisms (albeit microorganisms) than the acre in the Amazon delta. If organisms per acre were the criteria re entropy, then would you conclude that the pristine acre in the Amazon has a higher entropy than the acre of Nebraska farmland?
Then dealing with number of species:
If an acre of abandoned Detroit slum just happens to have 50 species of cockroaches, 20 species of flies, and a dozen species of rats; but an acre of Alaskan wilderness only has 6 species of birds, 12 species of mammals, and a handful of different insects (mainly mosquitos and black flies), would you then conclude that the acre of Alaskan wilderness has a high entropy than the acre of Detroit slum? So, doesn't the type of species have some bearing on the question? And who decides which species are important and which are not? And important to whom?
While these may be simplistic and perhaps even silly examples, I hope it illustrates some of the conceptual problems I have in applying the concept of entropy to ecological systems. It strikes me that one can make all sorts of simplifying assumptions and do all the math and generate all the graphs, but does one really know what is going on?
I think we sometimes fail to recognize the limitations of some of our mental constructs. As such, I would remind you that the science of thermodynamics owes more to the steam engine than the steam engine owes to the science of thermodynamics: because first there was the steam engine, and only much later was there a science of thermodynamics.
If you go back and go through my posts here and in my blog, you will notice that I have never written a doomer-framed story yet. I still care deeply about and share optimism of us working with our environment in a more harmonious manner.
It's too bad that you didn't read the rest of the article, because IMHO it provides a lot of insight into how nature evolves and adapts. I think it is a beautiful process, and even if things were going swimmingly in human terms, the analysis would still stand on its own terms.
I know it is your right to put forward your own opinions, but as you mention we have 7 billion people on this planet, and we should probably think it OK for one or two of us to try our luck on exploring some interesting concepts.
Like the fat-tail statistics would predict, I am one of the few outliers working this angle.
This post is quite comical, actually. Clearly, WebHubble is proud of himself for being able to create such arcane models and verbiages. But, as shox notes, WebHubble's very first premise is utterly and profoundly wrong! Our problem is not with understanding nature as an expression of entropy, at least not in these super-abtract ways. Our problem is understanding human societies and the power elites who run them, and figuring out how we can gain enough traction within the social situation to help create the _social_ basis for a soft landing in the approaching ecological/energy supply maelstrom. The approaching maelstrom, by the way, is primarily socio-political, not ecospherical in quality. The Earth's ecosystems will certainly survive us, with us (if we learn enough about ourselves in time) or without us. The question at hand is whether we can adapt ourselves to _blatantly obvious_ already well (and simply) explained natural limits. Models of entropy are off the topic, however fun they may be to play with.
Like I said elsewhere in this comment thread, take the premise of greenhouse gases. If no one modeled the effects of the gases on our climate we would remain oblivious to a sudden change. The (soon to be boiled) frog would sense that he was getting uncomfortable but would have no idea what was happening. That is indeed a fine example of a situation that is not "blatantly obvious".
On the other hand, many people claim that everything having to do with natural limits is beyond obvious.
The trouble is that we completely lack the ability to create a controlled experiment with the world's resources and it seems to me that practicing these kinds of thought experiments and intellectual exercises is a fairly obvious approach to take in lieu of that constraint.
So you consider this work as comical by its degree of irrelevance, but I find the fact that no one has previously discovered this particularly simple kind of mathematics and scientific approach equally comical. I keep thinking to myself that somebody must have seen these relationships before.
I really do look forward to see if someone can pick apart the arguments or show that indeed someone has done this before.
Bingo!
Someone is paying attention.
Mental masturbation is fun, but usually not materially relevant.
I started working this topic for the sake of understanding oil production.
I then branched out into other disciplines to see how robust and versatile the basic idea was, and blogged at least one post on each of the following subject areas.
It works well to understand the anomalous transport of carriers in amorphous semiconductors. This has implications for photovoltaics.
It works well in modeling failure rates, especially in terms of the common bathtub curve. This is very useful in design for reliability
It can model transport of solute in a porous media. This has implcation for dispersal in aquifers.
I can use it to model TCP/IP transport times in a large network. Why TCP/IP delivery times can become unbounded w/o having to use queueing models
I can use it to estimate project completion and overruns. Useful for managers and project schedulers.
I can use it to predict heat-activated reactions, which covers chemistry and physics. The interesting case is the dispersal of popcorn popping times, which has been a little understood process.
I used it to model human transport times and velocities. Useful for future planning.
I used it to model species diversity. Of course we need to understand this better.
Then we have the oil-related processes: It works well in describing reserve growth, which was previously referred to as an "enigma". This has obvious implications relating to oil.
I used it to model oil discovery and derive the Logistic Hubbert curve.
I used it to characterize reservoir size distributions. not the same derivation as the logstic.
I have also dallied with it to predict the distribution of population centers and wealth distributions,
I got sidetracked a bit early on in using the approach to predicting the
finishing times of marathon races. This suffered from selective population censoring and I decided to only look at what I consider more materially relevant classifications.
So the main rule of thumb for applying the approach is to make sure that the controlling input parameters are ergodic representatives of the population of interest. Biased censoring will reduce the entropy and make the resulting distribution sharper.
So it seems like it is pretty general. It may in fact prove more useful for domains other than oil.
"Socio-political not ecospherical" is an assumption, and a false distinction. Read Catton.
The part about "understanding the power elites who run" human societies is question-begging: how do you know they're running societies? It sounds like you're looking to place blame for the human eco-tragedy on someone other than yourself.
Catton calls the whole thing "The Tragic Story of Human Success." Looking to place blame--and dishing science in the process--is just immature.
I have read Catton, whose main argument is that we must radically reform our societies, if we are to survive decently.
Meanwhile, sounds like YOU deny that there are power elites and differences in individuals' abilities to alter the course of events. Talk about dissing science! That's social science 101.
As to blaming others: If I were in charge, things would be very different, I assure you. The same goes for most of the people I know and almost everybody on this website. So, duh. Somebody has more say than we do.
Anti-sociological generalizers like you are part of the problem.
I just recently found out that arguably the world's first environmentalist was an engineer by training and an inventor and tinkerer.
He eventually wanted to study the inventions of nature.
I guess he didn't alter the course of events either.
He therefore lived a pointless life.
So I presume you are generalizing too with your previous comments.
edited:
John Muir, that is
I disagree.
The math fits the facts too well.
Humanity itself is a clear example of a fat tail. How many billions are we now?
Our brains are not made to understand probability very well. We became what we are in a world that was much simpler than today, where we only needed a few quick and dirty rules. Now we have created a world that grows fat tails as if there were no tomorrow. Distribution of money, of success, of fame, book and record sales, size of companies, practically everything we do is subject to this fat tail phenomenon. The scale of that kind of probability distribution is rather out of our grasp. We think that coins don't turn up heads more than three or four times in a row, but nine and eleven successive repeat results have been recorded, and even fifty times in a row is not impossible, even though I would begin to suspect foul play.
If we want to understand human societies, it is essential that we have some grasp of how fat tails work.
The distribution of power shows the same characteristics: a graph showing numbers of people according to relative power will show a fat tail. And it works the other way round : very small numbers of people have huge amounts of firepower directed at them.
In a world of uncertainty, we do have to understand probability if we want to navigate our way around.
If Webhubbletelescope is too abstract, try Taleb.
Definitely concur on Taleb.
He is a very entertaining writer.
I've noticed that "reduced" and "analyzed" are code words from anti-science types and may be intimations of mysticism. What's wrong with reducing anything to its components in order to understand the parts and therefore the whole?
You start with "analyze" and "reduce" and then proceed to "patented" and "sold" as if this were a logical, inevitable progression, but this fails to distinguish between science and the applications of science. If you've got something against the packagers of science, then take on the corporations directly. I, for one, am glad that some bacteria and yeasts have been "modified" to produce human insulin.
About those "7 billion souls, clamoring food, space, resources and wealth"...
What makes you think this is any less part of nature than the "ecosystems" you exalt in your previous paragraph?
I am an engineer and a true enthusiast of all the sciences. I love building my own robots, planes and other stuff at home, and I try to keep up with all the latest developments in science and applied science.
What I abhor is the true reality in the world, which is that the very natural environment from which we learn almost all of our science is being systematically destroyed, as though we have no more use for it. Imagine if all birds had gone extinct before we discovered that marvel of flight. What do you imagine is the likelihood that man would have been inspired to learn the secrets of aerodynamics, the aerofoil which is a bird's wing, and once that secret was discovered, that inventions would multiply and culminate in the 747 or the A380? It would probably be very unlikely. We might have remained grounded to this day. Would we have discovered so much of modern medicine if the earth were barren of varied plantlife, and few specimens could be examined for their chemical composition?
We still have FAR TOO MUCH to learn from nature before we can destroy it. Furthermore, nature is still our nourishing mother, as is vividly illustrated by the CO2 to O2 factory which is the Amazon, and all species have as much of a right to live as we do. We have no right to call ourselves masters over the earth, when we depend so much on other forms of life. As has often been mentioned, we must preserve as many extant species as possible, for our own sake if not for the sake of being good caretakers of the planet.
As for the 7 billion, most people who have closely studied the science know that a population of much more than 2 billion cannot be indefinitely sustained from here on, taking into account the enormous degradation of the natural world.
Welcome to the club. Many of us engineers (starting with John Muir) have shared a common basic philosophy:
"If we want to have any hope in controlling our destiny..."
Money is what controls our destiny. Nothing else.
You can argue all you want, make it as complex as you will, but if you can't pay you can't play.
Money is the universal tool we have all accepted for determining who lives and who dies.
Money is no longer just a background incidental means of exchange. Hasn't been for a long time now. There are a relatively small minority of people who decide who gets money, and therefore who does not.
If you don't understand this then you are not paying attention.
Some say just live outside the system. BS! What like the Roma, the indigenous people of the Amazon? Pay attention.
We will control nothing about our destiny until we change the way money works. Unless you want to pull a Stack.
I really don't completely understand this open-loop attitude.
Say that no one took the time to model green-house gases and GHG's were in fact the primary stimulus for rapid climate change. In this case, at best we would be ignorant of controlling our own destiny.
Like I said, the reason we model this stuff is that we want to understand and predict. The stuff that we don't understand will eventually bite us in the butt. Yet there is always a possibility that we will miss something; that's why I can only claim a "hope" in this endeavor.
When a person versed in probabilities (me) writes a subjective lead sentence, it automatically gets the Bayes treatment with unknown priors.
I guess I am saying that for the most part we already know what we need to know, have known for 20, 30, 50 years or more and still can't/won't do anything. Over complicating the issue by creating different ways of looking at does nothing, in fact I believe an argument can be made that it makes things worse, much worse. People end up saying "We can't really know".
We are controled, guided, herded, whatever term you are comfortable with, by the supersystem under which we function as a society. The way money, the #1 supersystem under which all humanity operates, is structured for the worst possible responses that mankind is capable of. What kind of outcome/destiny would you expect knowing the controls are rigged in such a way? Open your eyes folks.
That's an interesting perspective. Making our world more understandable will just make things worse?
so you honestly believe that the only reason that we don't address any of the problems facing mankind is because we don't understand them?
Get real.
I will rephrase what I said in the negative sense. Your claim is by NOT understanding something, it will make things better.
What I said in my original comment is that we ALREADY understand. Try Reading;
Limits to growth, Overshoot, The Entropy Law and the Economic Process, and on and on. Many of which were written 20+ years ago.
People who still want to discuss the details and model it six was from sunday are avoiding reality.
Cheers
So you admit that some understanding did occur in the past, which then allowed us to arrive at some concusions.
Evidently, from the writings you reference (Limits to Growth etc), scientists played a part in this understanding.
But now you say that scientists are not allowed to contribute any more knowledge.
Except for Dennis Meadows of course.
This is going no where. You have misrepresented my comments responded like a petulant child.
Good luck chuck
I honestly want to figure out what your salient point is.
Early on you said that "money" controls everything.
I am working on a new post which analyzes how people perceive money and their investments given uncertainty.
I will definitely refer to your comments when I eventually post it.
You will get top billing for posing the question.
Jaynes has an interesting quote which I got from the Various consequences blog:
Here is my response to your comment that:
"We will control nothing about our destiny until we change the way money works."
http://mobjectivist.blogspot.com/2010/03/volatile-investment-trap.html
To change the way that money works we have to understand what the heck is going on.
One thing that strikes me about your first case, the relative abundance distribution, is that it really says that as one species dies out, another will become more prominent. So from the earth's point of view, it doesn't really matter whether reindeer eat all of the grass on an island, or humans overshoot its carrying capacity--eventually, some other creatures will become more prominent, to fill the gap, and a balance of some sort will continue. So the earth will go on without us.
I think perhaps what is more interesting is to look at the shape of a different curve. What is the shape of the curve of the number of a species remaining before a species dies out (or declines in prominence)? If its source of energy diminishes in some pattern, what is the corresponding effect on the species? Is it overshoot and collapse? Or can there be some slow decline, as the source of energy is withdrawn? If it is a fast withdrawal, it would seem like the result would be overshoot and collapse. If somehow, (1) the energy system goes down only slowly and somehow (2) the whole complex system can be kept together, then there might be a possibility that population would decline slowly, rather than collapse suddenly.
Gail, Good question. I am looking at just this in terms of a few classes of species.
The first question we need to ask about is extinction events. I plotted the dispersion of North American birds and started puzzling over what if anything took over for Passenger Pigeons and perhaps the Carolina Parakeet, which were hugely abundant at one time, until they went extinct.
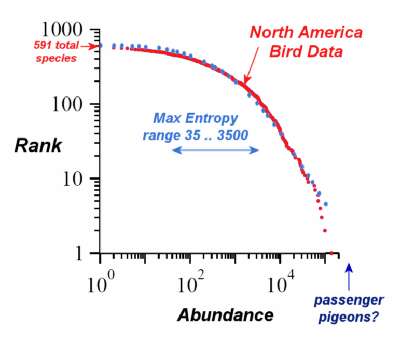
How will that tail end of the piece evolve? I don't think it will anytime quickly.
Or are species like European Starlings taking up the slack? But that is simply an introduced species which is just replicated elsewhere in the world.
The question on energy is a great one because animals get their energy the old-fashioned way, indirectly from the sun, but not prehistoric sun like us. Competition and interaction among species does not appear as important as some might think. At least that's what I have read and infer.
The earth will definitely go on.
What interested me in WHT's work in the first place is the synthesis of doom and gloom and optimism within the numbers and analysis. I could really drop a cliche bomb here about our near future track, but let's sum it up with "the definition of insanity" and "information is power".
I arrived at the Maximum Entropy notion through a wide-range observation of trends around us. WHT's rigorous work confirms my heuristic conclusion that if we are to survive as a species, then we must learn to work within the bounded conditions of the energy (exergy) and rate of entropy available to us. It means we neither run the human herd off a buffalo jump, or we fly around the earth in our flying jet cars at whim.
I wish I could be more diplomatic and get one simple message through to the masses that it's the rate stupid! You know, its not the fall that kills you, but the sudden stop at the end.
Taking it back to systems, if we can stand back and view the human population as a forcing function on the exergy/entropy rate on the planet, then we have very clear understandings of what forcing functions due to dynamic systems. Sure a scalar value (magnitude) of a physical property can cause destruction (i.e. pressure or voltage), but it is the first order rate (i.e. velocity), and moreso the second order rate (i.e. acceleration) that destroys or breaks down a system.
And what are our economic and consumption behaviors but accelerative forcing functions on the planet? (Increase rate of growth?) Sure my level of analysis is not going to stand up to academic rigor - that's why I encourage those much better at it than I to do so - but information is transmitted by various means and I like the analogy/story. Which is kind of weird for an engineer... but my perspective at the moment is simply this:
If you're a molecule bouncing around in a container you are probably not going to figure out Boyle's Law. However, if you have the presence of consciousness to see outside the container and understand the aggregate behavior, then you are a molecule more clever than most and might come up with PV=nRT - just maybe!
I apologize for the poor quality of writing today, not one of my better ones. But so it goes...
I think BC_EE has it exactly correct. I wouldn't get anywhere in my analysis without applying rates. And the disparity in rates of formation of our resources versus the rates of removal causes most of the perturbation to the system.
Yes indeed, its the rate stupid. I would be the least bit interested in climate change if scientists proved that the climate is changing but that it would take thousands of years. But since the effect takes pace over perhaps tens of years, we need a different attitude. But few seem to understand the concept of geological time versus a few years.
BTW, the change in pressure with altitude in our atmosphere comes right out of the maximum entropy principle and it is seen as PV=nRT. V is proportional to height, and then P = P0*exp(-kHeight/RT) with expanded volume the reciprocal of this. This change in pressure leads to weather conditions and some say this ripples throughout as climate change as a maximum entropy production (a researcher claims that is all that is required to understand the Martian climate). But you don't see this change if you stay at the same altitude. Good analogy!
Dryki on TOD tossed out a good line "Like a fish in water, it's almost impossible to see."
At one time I thought I was the author of the same line:
Mine was, "Does a fish know of water?" But then I've learned this philosophical rhetorical question about knowing what is pervasive and therefore not obvious has been around for a long time.
This is the long and short of why I believe WHT's work is very important to our policy decisions in the immediate future: Demonstrating the dispersive limits within a bounded state shows there is no free lunch with techno-fixes. The primary boundary condition we currently enjoy is technology, and that technology could be loosely generalized as chemical-mechanical reactions - i.e. internal combustion engine.
I'm sure anthropologists have looked at the rise and fall of civilizations through the narrow lens of employed technology. It could be described as the carrying capacity of an ecosystem and technology.
The simple take away message for TPTB, and the general populace for that matter, is this is all there is. Given our current state of technology and consciousness evolution we're pretty close to maxing it out and no amount of new technology along the same lines will change that. e.g. Priuses and electric cars are more of the same, we're still in the same state.
Note to WHT, I could have used this mathematical model for defining process states in a continuous pulp digester, which is known as a Kamyr digester. Up to the time of my undergrad thesis, engineers had been trying to define and construct the control systems for the digester by understanding the internal workings of the chemical and mechanical reactions. Since Lignin was only approximated in it's molecular structure at that time, I figured we were probably spinning our wheels thinking we completely understood the chemical reaction; and hence, the degree of wood chip cooking. So I "black boxed" it and came away with the notion of dynamic control modeling. This is now widely used in the pulp and paper industry.
So to answer your question why this hasn't been "discovered" before is simply because maybe it hasn't. This is a hard concept for our Western scientific minds to get around because we have be drilled with credibility relies on references. Be the first one out there and criticism will abound. One has to be truly brave and remember Einstein's quote about if an idea does not at first seem absurd...
BC_EE
I have found some possible interpretations of maximum entropy in the materials process control literature. I remember seeing this after you mentioned your work in a previous comment.
Maximum Entropy Method in Comminution Modelling
http://www.springerlink.com/content/97q4043537141153/
Also for figuring out drop or particle size distributions:
http://www.analyticalultracentrifugation.com/sizedistributions.htm
Thanks for the tip.
WHT,
I note that you mention Taleb toward the end and you posted some time ago that you were reading The Black Swan. I just finished it and I frankly don't have the expertise to form an opinion. I realize this is OT but can you offer yours?
Todd
I tried to give a flavor of Taleb in the post. He is definitely inspirational in his approach and especially through his use of a narrative filled with anecdotes and anti-anectdotes, but he never tried to explain from first principles why the fat tail statistics come about. He is definitely an empiricist in terms of observing the world and making connections.
Taleb writes more in terms of a character study and of why people don't want to confront statistical reality. And these are really placed in the context of manipulation and ignorance. Some people will try to manipulate us with their own misunderstanding while others will be ignorant enough to fall for it. That is the one big theme of his book.
I am really interested in what happens to the whole discipline of conventional statistics now that Taleb has got the analysts riled up. I see us going through a struggle as we start thinking more and more about gray swans and fat tail statistics. The big problem is the sunk cost effect as we begin the transition. Some of that is happening on Wall Street right now.
EDIT:
Another bit in the book is that Taleb is not that big a supporter of the classical entropy measure. He prefers something called Tsallis entropy instead. Some researchers say that Tsallis entropy is only useful in that it gives us fat tails w/o doing anything special. I have some problems with using Tsallis and it is telling that Taleb supports that notion.
Thank you.
Thanks Gail for posting this.
Timely as well.
If anybody is interested in a real fat-tail gray swan activity that is taking place right now, check out the Chilean earthquake (8.8). This isn't a record (9.5) but it certainly will get people talking about probabilities again, at least for awhile.
I do hope the tsunmai dissipates before it gets too far. Often its a fine distinction between a waveform that dissipates, like an entroplet, versus one of these rogue waves, which seems to feed on itself and maintains its order.
I'd take my roque vehicle to the rogue gas station, but I don't have to.
And a quick fit to earthquake data from California using the entroplet model.
Displacements of faults in the vertical direction contribute to a potential energy that eventually will release. All the stored potential energy gets released proportionally to the seismic moment. The two competing mechanisms are a slow growth in the strain with a entropic spread in growth rates, and an entropic (or narrower) distribution of points where the fault will give way. This is also related to the way in which many product components fail.
The result leads to the inverse power-law beyond the knee and the near perfect fit to the data. Anything above that knee in the nearly flat portion has surpassed that stress over the course of time for the local California area.
I also mention this because Laherrere has studied earthquakes quite a bit to get an understanding of oil reservoir distributions. He had some heuristics called a parabolic fractal model and stretched exponentials to try to quantify the effect.
Given you looked at species I wonder how this relates to directed selection.
In this case consider the abundance of species that humans knew about and uses for food or other uses during the long period of hunter gathering. First of course we selected for species that provided some sort of value insitu thence to ones we could grow.
Overtime it seems that the number of species we actually use for food has declined even further with the rise of commercial agriculture.
Especially varieties within a given species.
Trying to connect this to oil perhaps over time we rely for most of our oil production on the largest fields they are the mono-crop commercial agriculture equivalent.
The point is that for species we know for a fact that there is a related exploitation curve which tends towards first a few species then to a few varieties within a species but with large increases in the volume or amount produced.
How is the exploitation curve related to abundance ? Well first and foremost because of sunk costs in agriculture new species are not introduced that often. Of course new world plants and later soybeans are good examples however they where already exploited and it was more a regional expansion on discovery.
I don' see any simple relationship between the dispersive discovery of species and the way we exploited them.
Either there is a fundamental equation and I'm clueless which is possible or the relationship is ad-hoc.
By this I mean at any given time humans have a rich set of species to choose from for domestication so they choose the one that makes
the most sense at the time. Now later discovery and changing conditions might change this choice but biodiversity is so great that
although discovery plays a role its not a limiting factor.
I don't know the answer but at least for plants and animals it seems to be complex relationship at first glance.
For what it might be worth, cultivated plant species early on in cultivation were not 'worth' so much. They needed 'breeding' selection. An example is reduction in toxins in potato, or, following dispersal of potato (just one species) to Europe, selection of a 'long-day length' adaptation that allowed cultivation as a useful crop at higher latitudes.
Of the several thousand plant species that have been used for human food, as you suggest, fewer, only about 150, are in use today. Interestingly, however, prior to the last few decades, the tendency in agriculture was for the number of selected variants within cultivated species regionally, to become very large. For example, a large number of variants of several species of potato were cultivated in the Peruvian centre of origin. Also, over centuries in China, about 10,000 varieties of Wheat were cultivated, and in India 30,000 varieties of Rice. (Since the 1960s when the possibility of using synthetic fertilzer, in particular N, required new 'breeds' that could cope with higher soil N, 90% of Chinese wheat varieties went out of cultivation and 75% of India's Rice cultivation relied by 1995 on just 10 varieties.)
Without human intervention, the situation seems perhaps to have been rather similar (to earlier plant breeding)in the evolving Rainforests, where very high numbers of species accumulated. In the natural forest, as long as rain (regional climate) was/is maintained by the aggregate of vegetation, and while mineral inputs continue to match outputs, numbers of species can accumulate to high levels.
[Regarding forests, and it seems plankton, this week's issue of Science contains a discussion of how intra-species heterogeneity allows species survival by avoiding direct competition among co-existing species.
CREDIT: JAMES S. CLARK
I think (?) some of the above might support the usefulness of WHT's powerful abstractions.
Yes indeed, the seeming avoidance of direct competition among species and the lack of real partitioning is the big mystery that is now partly explained.
Thanks for that very timely Science article. It reinforces the Neutral theory of Ref 1 above.
Much of our schooling taught us that the intricate relationships among the species drove abundance levels, but the data does not support that premise.
Rather my point but the question remains given the abundance of species we selected for a small number of varieties of a few species over time. Thus the exploitation pattern of humans when based with the abundance of choices has resulted in a vary narrow result.
At least for agriculture.
Although the reason this has happened perhaps call it the paradox of abundance if you will is left unanswered it seems at least that we tend towards a sort of shallow and probably less resilient solution over time.
The selective pressure of exploitation is not only quite different from the natural realm its almost at odds with it.
Next I see no intrinsic reason that whatever this core phenomena is that it does not apply across the spectrum of way people exploit natural resources.
Another example fishing we go from generalized fishing where you keep anything edible to species specific mega fleets.
Thus the mapping between the natural world if you will and how its exploited is not direct but passes through this transformation.
Obviously one part of the problem is economies of scale indeed this could well be the root of this transform.
If so then it does not take much to realize that a process based on economies of scale and growth does not fare well against a declining resource. For us at least its not the natural abundance thats the problem but our methods of exploiting it.
To a large extent I think this explains what I call the grass is greener phenomena. People recognize that they just need to change sometimes in small ways sometimes in larger ways and everything will be just fine. Thus they can see the green grass if you will.
What they don't see is the sort of hidden barrier caused by what we need to do to exploit resources extensively and the way it collapses to the large scale but simple system. Diversity is crushed yet the solutions to declining resources in a specialized system require diversity and often on a large scale.
Very thought-provoking article, as always and sufficiently understandable for an interested layman.
Many interesting points have already surfaced:
System feedback from actors (reflexivity) and effects on distributions
=======================================================================
How reflexive is the system being modeled => Is there a change in the distribution? => Can we observe this change and how? => Can we generalize from observations the set of changing of distributions? => If so, can we then model the effects of reflexivity with the generalized set? => Can we back-test this model to historical data?
Perhaps Gail's comment already covered this. I'm not well versed in actuarial insight to really know.
The other point about game-theory and economics is very interesting as well.
Economics, game theory and grey games
=====================================
Human economic systems are reflexive => Game-theoretical pay-off charts and individual weightings of pay-offs are not static and due to distribution changes can be (partially) unknown. Q: can grey game theory deal with issues relating to changing distributions (and information loss/asymmetries) and give results more in line with what happens in reality of economic human actor systems?
BTW, I tend to believe that ecological systems are also games. From economics point of view the actor strategy changes may just be less elastic, due to lower level encoding of behavior. This is a pure guess though. Nature is remarkably adaptable - esp. on the long run. It's just that all the current species necessarily aren't.
Again, my personal understanding on this subject is too limited to really tackle this problem in any meaningful manner. For further study book might give insight.
Grey Game Theory and Its Applications in Economic Decision-Making (Systems Evaluation, Prediction and Decision-Making) (9781420087390), Zhigeng Fang et al
http://books.google.fi/books?id=uh9fEz7M3qUC
Zipf-Mandelbrot and Mouillot et al.'s fractal RAD model
=======================================================
A very quick peek at :
Mouillot, D., Lepreˆtre, A., Andrei-Ruiz, M.-C. and Viale, D. 2000. The Fractal
Model: a new model to describe the species accumulation process and relative
abundance distribution (RAD). – Oikos 90: 333–342.
http://wow.sfsu.edu/download/private/PEaCE%20PDFs/Mouillot%20et%20al%202...
... reveals that Frontier did work on this:
Regardless of this finding, or in fact, because of this - I have to ask:
Have you already written a journal paper on your derivation of your "entroplet"? If not, it begs the question 'why'. The generalizability and applicability seem way too good for it not to be tested by others.
Network Sustainability as a function of Efficiency vs resilience
================================================================
This was buried in another thread couple of days ago by Bertoli:
http://www.theoildrum.com/node/6245#comment-594127
Quantifying sustainability: Resilience, efficiency and the return of information theory
Robert E. Ulanowicz, Sally J. Goerner, Bernard Lietaer, Rocio Gomez
Ecological complexity (2009) 27–36
http://www.lietaer.com/images/Ecological_Complexity_Final.pdf
The authors have further extended the argument to our financial system in subsequent papers:
http://www.lietaer.com/images/Quantifying_Economic_Sustainability_Publis...
http://static.ow.ly/docs/Journal%20Future%20Studies%20final_1ox.pdf
While not directly methodologically related, the motivation is similar: what is the required resiliency (and defined how) in a ecological/economical network for the network's function to remain sustainable.
The authors' argument, afaiu, is that a system's efficiency can be increased too much at the cost of resiliency and eventually system's sustainability. There exists a theoretical limit for maximum efficiency gains, beyond which any additional increase results in lack of resilience and sustainability. Seems pretty evident to me, but would of course require more verification. The good thing is that they now have a model to test and not just a 'negative knowledge' rule-of-thumb heuristic (like Taleb is so fond of using).
In their words:
There appears to be no application of their ideas yet to (liquid) energy flow systems.
Here's a chance for anybody interested in such a task. I'm sure than more than just a couple of stat-geeks at IEA or modelers in informatics journals would be interested in the results if properly packaged. Although I'm afraid the whole situation may run into difficulties fairly quickly due to the Simmonsian lack of even semi-accurate data.
If there's any change I could request for such a wonderful work, it'd be to have plain English enclosure for the article at the end. You ask wonderful questions in easy-to-understand manner at the beginning, but the conclusion remains at somewhat interim-detail and methodological level, and as such may not be easily understood by laymen, which is a great pity.
Other than that, a great article WHT, keep at it! These are always such a pleasure to read, even though I really don't have time for this myself.
Thanks, many good references to wade through. It's nice to have an independent filter on the current research.
The changing distributions over time is the salient point. It will take a while to rigorously test this against historical data. I worked out a case of the mammal RAD plotted as species per genus since prehistoric times and saw no broadening from the initial single entroplet distribution.
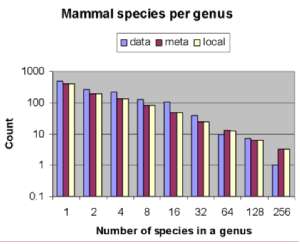
That figure demonstrates that the single localized distribution is the sharpest, and the best fit via a broadened meta population is a slight +/-1% variation about the entroplet value, essentially meaningless. I am thinking that this means that mammalian adaptation has not yet hit its maximum entropy dispersion. It is close perhaps but another bat or shrew species proliferation hasn't filled in the high density tails yet.
1. The game theoretical aspects are admittedly complex. As I indicated, I am working my way up to this point. If you noticed, I in no way work any feedback into the models as actors would provide, which would also imply solving higher order equations.
2. I am glad you caught the fractal route and provided those references. Many of the derivations end up going the discrete math route. The continuous model of entropy actually derives from combinatorics and the p*ln(p) definition of entropy comes about from Stirling's formula for a factorial. So that the approach in this TOD post is essentially a short-circuit around all the discrete combinatorial derivations that you may come across.
Trying to get an academic article accepted in this area is too risky for me. Math and statistics reviewers are brutal. The only paper that I had rejected was focused on math. The entroplet model is more of a pragmatic modeling approach than deep math at this point, so perhaps the detailed proofs can wait. I am willing to go an organic route, and try to gain acceptance through a more public process. If it takes the Wikipedia route and I get enough of a bandwagon it to start a new sub-discipline of math modeling that would work.
3. The Bertolli route is intriguing. Laying out the data (energy) flow models is definitely a path to take. Adding the stochastic elements to this remains the challenging part.
At this point I haven't reached any conclusions. Perhaps the start of the post inferred that I would reach some profound conclusion, but the main take-home message is that of creating fundamental building blocks that are useful for understanding in cases where the amount of prior information is limited.
Thanks
Wonderful to see somone else has read Ashby and Stafford Beer (basically the inventor of managment cybernetics).
Beer's point in the 70's was that a new paradigm of managing complexity was requred, otherwise collapse (or at least decline) was inevitable.
His book "Platform for Change" coined the term "Home Faber vs Homo Gubernator", the first the BAU type, the second what is needed to deal with complexity. Wonderful book, if you can get it .... do.
We either manage complexity or it will bury us (the law of unintended consequences writ large).
Beer: "For the key discovery of cybernetics is that all viable systems may be mapped onto each other under some transformation. That is a technical way of saying that every viable system obeys the same balancing law of information and energy flow, and that therefore all viable systems have structural commonalities".
Try to build a system that doesn't follow and maintain this and it will collapse. Oh maybe not for a while if it has access to enough energy, or the unintended consequences (by not amanging complexity) can be minimised or more likely just ignored.
But to maintain this means more and more energy and more and more sweeping under the carpet just to maintain the status quo.
Finally something breaks and the whole thing goes extinct.
And another non-viable system goes under.
Yes indeed, Cybernetics is defined as the study of complex systems.
It seems like such an archaic term, as it was coined I believe in the 1950's. It disappeared from use in systems and computer engineering for years but is now apparently making a comeback. Most of the early writings still have relevance.
http://www.gwu.edu/~umpleby/recent_papers/2009/2004%20Ashby%20paper%209.doc
A touch of Jaynes philosophy toward the end of that passage.
http://mobjectivist.blogspot.com/2010/01/odds-and-uncertainty.html