BP's Thunder Horse to Under-Perform in the Wake of the Deepwater Horizon Blowout?
Posted by Gail the Actuary on April 30, 2010 - 10:26am
This is a guest post by Seismobob. His real name is Glenn Morton, and he works as a geophysical consultant in oil exploration in the oil industry.
With BP’s Deepwater Horizon blowout in the news, the world’s interest is now focused on deepwater oil production. BP has another deepwater platform in the Gulf of Mexico—Thunder Horse—where it has been working some for some time. My analysis suggests production is not going as well as planned at Thunder Horse.
Thunder Horse field created huge excitement when it was discovered in 1999 in Mississippi Canyon blocks 788 and 822. Partners BP and Exxon announced that the field had a billion barrels of reserves. After nearly two years of production history on the field, it is becoming obvious to most outside observers that Thunder Horse field is not performing as it was expected to perform, if one is to believe the press accounts and specifications of the production facilities. If the field is underperforming, as the data available from the Minerals Management Service seems to indicate, this should be of concern and interest to those in the Peak Oil community, and to the world.
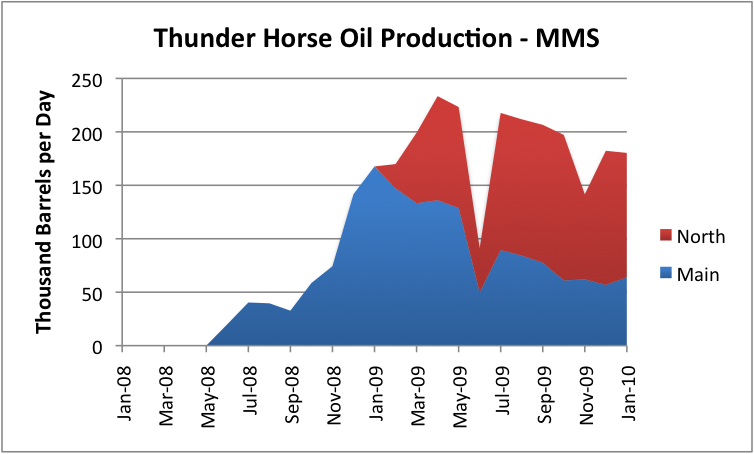
Thunder Horse was designed with an oil production capacity of 250,000 barrels a day. Clearly, it never hit that level, and seems to be already declining. If the field really had a billion barrel of producible oil reserves, it would take 11 years of production at 250,000 barrels a day to reach this amount—something that looks very unlikely to happen. There seems to be no production plateau, and it appears that production may be declining by as much as 25% per year.
Natural gas production capacity for Thunder Horse is 200 million cubic feet per day. Production for natural gas doesn’t look any better.
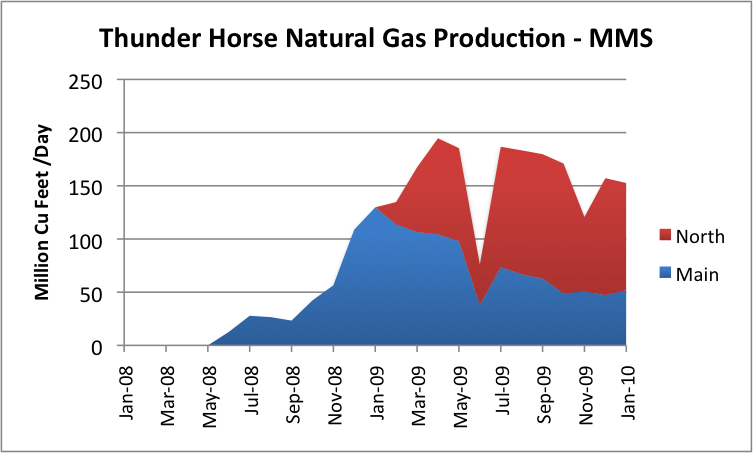
While it was designed to hit 200 billion cubic feet of gas per day, it never really hit that level, and also seems to be declining at around 25% per year.
Background
There are two parts to the Thunder Horse complex as shown on the map below. Each block is 3 miles on a side. An anticline/turtle structure located on MC 778 and MC 822.Then there is Thunder Horse North which lies along the salt wall to the north of Thunder Horse proper.

The main field consists of four producing wells, TA-001, TA-003, TA-004, and TD-001. There is also a fifth field, TA-002, which has not been put on line yet.
There is also production from blocks to the north of the main field, called Thunder Horse North on blocks MC 775, 776 and 777. There are five wells on these blocks, which are producing from sands uplifted against the Thunder Horse salt. These are TC-001, TC-002 (both on MC776) and TB-001, TB-002, and TF-001 (all on MC777).
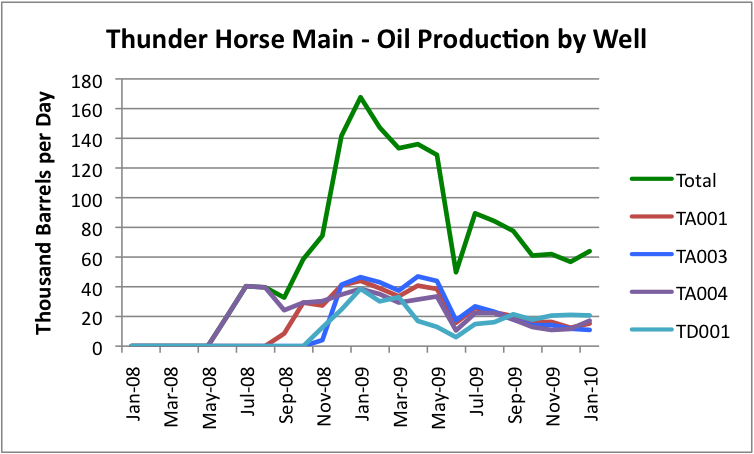
Production on all of the wells in the Main Field has been lower since June 2009.
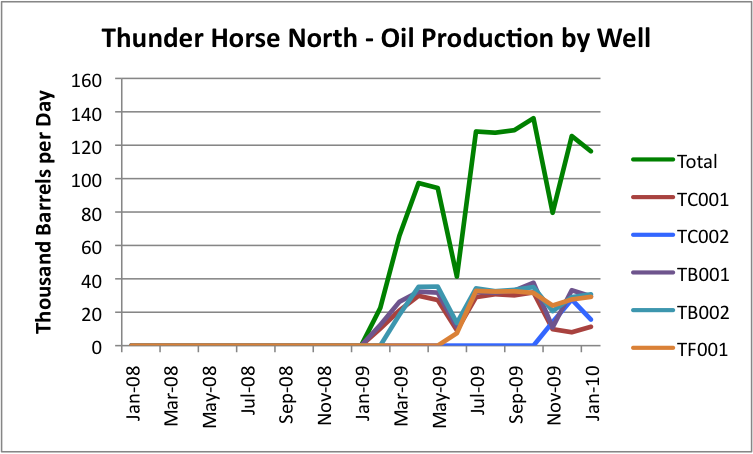
Production from Thunder Horse North started much more recently. So far, except for TC001, production from these wells seems to be holding up, but the length of drilling experience is at most a year.
One of the issues seems to be that BP is now finding that the fluids extracted in the main field include an increasing proportion of water.
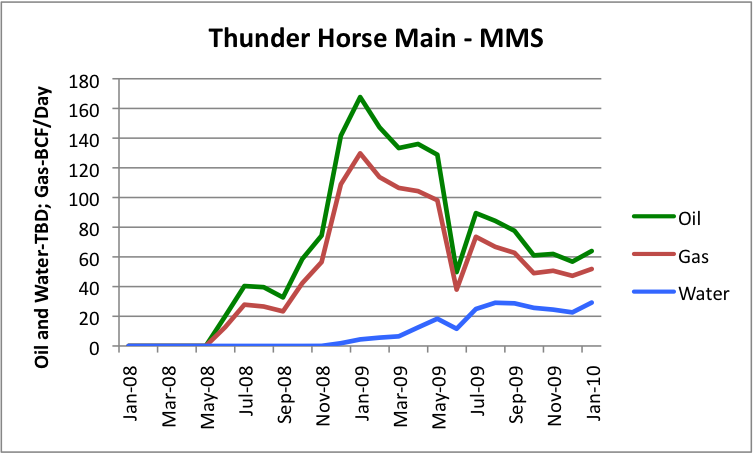
As Figure 6 shows, Thunder Horse main field has rapidly rising water. Thunder Horse North field doesn't have rapidly rising water; indeed it has no water at all. Probably because of this, the wells at the main field have been choked back and the North has been allowed to produce all out.
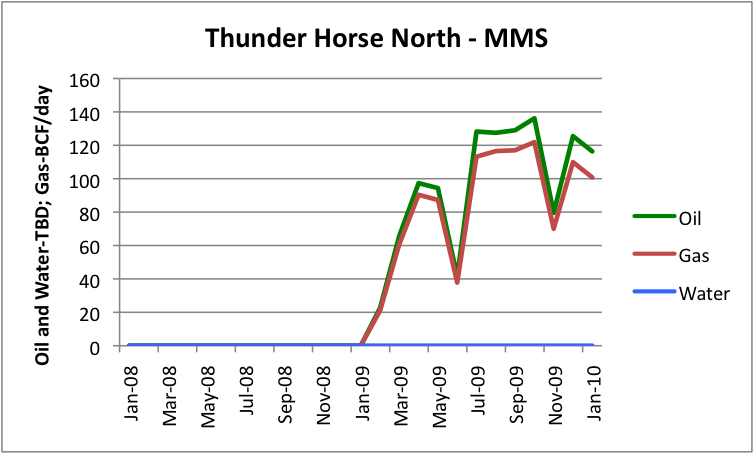
Figure 7 shows Thunder Horse North is behaving quite well—no water cuts so far.
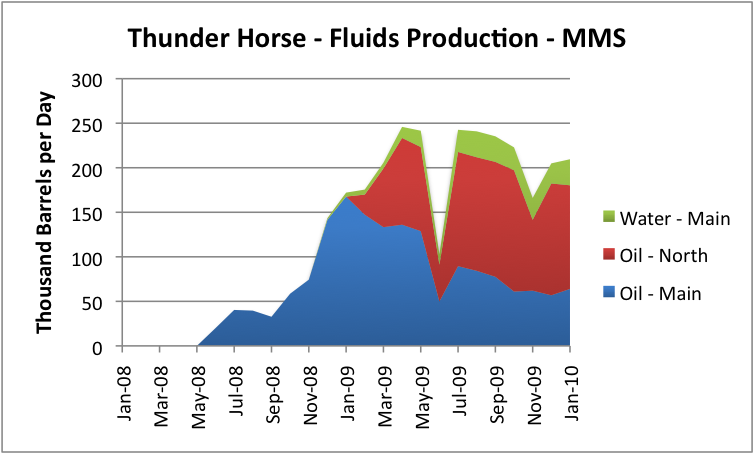
Thunder Horse was built with a total of 390,000 barrels a day of fluid capacity—250,000 barrels of oil, and 140,000 barrels a day of water.
Neither the daily production of water nor gas have reached the limits of the facility handling capacity, so with that in mind, one can view the drop in total fluids as most likely due to the natural pressure decline reducing the flow. Thunder Horse has no injection wells (they initially thought they needed it but then changed their minds). The field is producing just above 200,000 bbl/day of fluids and that is a concern.
It is a concern because the facility was designed to produce 390,000 bbl/day of total liquids. They are not bringing that much to the surface. The fact that the total liquids is slowly declining says one of two things: either the pressure decline is not allowing those flow rates, or they are throttling back on the flow to avoid coning the water into the wells and thus further harming the reservoir. But either way, the field is not performing as it was probably expected.
Implications
What are the implications for the ultimate hydrocarbon recovery for this field? If one could maintain 250,000 bbl/day of oil production until a billion barrels were recovered (something that can't possibly be done), it would take about 11 years to recover the billion barrels. I only make this comparison to point out one thing--the whole complex is not producing 250,000 bbl/day of oil, as shown in Figure 1.
The decline is 2-3% per month and even adding one well per month from October 2009 to January 2009, the decline has continued resulting in the complex producing only around 180,000 bbl/day. The well added in January was MC775, which is not on the main field but against the salt on the northwest side of the basin. If adding new wells isn't stopping the decline, then the underlying decline is quite steep.
When BP drilled the first well and announced a billion barrels, they were announcing that for the main field. Were it not for the North field, it would be clear that this field is not going to produce the advertised barrels. I will not mention numbers that engineers, with whom I have spoken, have suggested as the total volumes that will be produced by the entire complex. Who knows how the North field will produce? But I will say that unless something significant happens to change the situation, the ultimate production from the Thunder Horse complex will fall significantly short of a billion barrels.
Can the North field make up for the deficit in the main field? In my opinion it won't. Almost every well along the salt flank appears to be in a separate fault block and some of the down dip wells drilled along the north salt wall have encountered water-saturated sands. That means that water is coming to the North wells, sometime in the future. Given that the North was the later development and has been producing a shorter time, the delay in the water is partly understandable. That being said, the North field has produced longer without water than did the main field. Let us hope that the wells to the north fill in the deficit that is showing up in Thunder Horse proper.
BP's Thunder Horse to Under-Perform in the Wake of the Deepwater Horizon Blowout?
PDF version
93 comments
BP's Thunder Horse to Under-Perform in the Wake of the Deepwater Horizon Blowout?
PDF version
93 comments
Contact
- Content: editors at theoildrum dot com
- Tech support: support at theoildrum dot com
License

This work is licensed under a Creative Commons Attribution-Share Alike 3.0 United States License.
Seismo-
Excellent Work.
Now plot the Water-Oil Ratio versus cumulative oil on semilog.
Use the Logarithm scale on the y axis for WOR.
Cumulative Oil Cartesian x axis.
Extrapolate to Economic Limiting WOR (say 10), read cumulative oil.
I think it would be scary.
FF
"Excellent Work"
I concur.
Isn't BP caught between a rock and a hard place? Onshore, a prudent operator would have curtailed production as soon as they started seeing an increasing water cut (or produced at a much lower rate to begin with), but in this very expensive offshore environment isn't BP caught between declining production versus extremely high--and rising (because of the water problems)--operating costs?
In any case, as I have now said once or twice, the silence in the MSM and especially in industry trade journals regarding Thunder Horse is deafening, and IMO, very troubling, especially in the industry sector.
Incidentally, didn't the Neptune Field drastically under perform? I wonder if it might be used as a model for Thunder Horse?
Jeffrey-
I am fortunate to be the guy who picks up SPE distinguished lecturers for our local section and drives them to and from the meeting about 45 minutes away.
I remember this one reservoir engineer from Nigeria who worked for Chevron in Houston. He was working the deep water and complained about endless meetings to argue about the strength of the water drive attached to a reservoir. It was the key economic parameter in the decision to set the platform. No matter how much they discussed it, the information never changed.
I really have never been a water coning guy. The older I get the more I see what really matters is the outer boundary condition, not the inner. I sympathize with anybody who has to extrapolate the outer boundary condition (around the control volume of the oil reservoir) from the inner. I guess that's us. That's why I drill for shallow oil and probably surmise that's why you do the same.
FF
You are asking the media to say aloud that the Emperor has no clothes. This, I would think, is especially difficult for the industry media.
Deepwater is the last frontier. In a previous iteration of our civilizational narrative, Hollywood had hope riding into the horizon. Before that our heros sailed towards the prospect of fortune.
The 'Deepwater Horizon'. How ironic is this?
BHP Billiton Neptune Production (Atwater Blocks AT573, AT574, AT575, AT617, AT618) is under lease codes G08034, G08035, G08036, G08037.
However oil is only being produced under lease codes G08035 and G08036 (and the latter is tiny). No production information has been logged since November.
Peak Oil Production on Lease Code G08035 occurred in August 2008 at 1,257,333 barrels. In the last recorded month (Nov 2009) production had crashed to 415,282 barrels. Water cut still doesn't seem to be a significant problem here though as water was only 2,189 barrels in November.
Adding all production for Neptune, Nov 2009 production was 14,374 bpd. Production peaked at 40,611 bpd in Aug 2008. Neptune is designed for 50,000 bpd.
So, from peak production rate at Neptune to no reported production was only about 16 months. The annualized exponential decline rate from 8/08 to 11/09 was 86%/year (based on monthly data).
Doesn't bode well for the main Thunder Horse structure, which peaked in January, 2009. The annual exponential decline rate from 1/09 to 1/10 for the main structure was almost 100%/year. Interesting coincidence that BP is shutting in--15 months after the production peak on the main structure--half of the wells in the field (allegedly because of maintenance issues). I don't know if the shut-in just applies to the main structure or to both traps.
Some news items from back last year say BHP Billiton were considering drilling more wells. Can't find much news since.
Btw, I slightly corrected November production up to 14,374 bpd in an edit as I must have miss added before. Not that it matters much.
Here's a Neptune Field article from August, 2009:
http://www.upstreamonline.com/hardcopy/news/article185261.ece
Marathon feeling heat at Neptune
August, 2009
Hi jeffrey, my understanding is that the shut-in is a pipeline related issue. No doubt though the shut-in will serve other purposes
I understand Seismobob is at work today, but hopefully he can comment a little later. I thought the issue was of enough urgency that we should get the post up, even if he couldn't participate in initial discussions as much as he would like.
Gail iS right I am at work but on my ranch, which I bought because peak oil was coming. I wrote some web pages back in the late 90's and published in a magazine in 2000. Thus I have worried about this since then. I am turning my ranch into a food factory - fish on the lakes a big garden and right now a 60tree fruit orchad-soon to get biggerThese notes are sent from my iPhone
I thought your name looked familiar. You wrote something about Ghawar awhile back. Seems like it was one of the few things on the web at the time.
Happy ranching!
Yes, I wrote on Ghawar. My web page on it is almost always within the top five on Google searches. This week, when I showed a friend that page, it was #2 behind wikipedia. I was pleased.
The rapid influx of water clearly means the field has high vertical permeabilities. Even new wells in the main field wouldn't solve the problem so long as they produce at the same rates. Without solving this issue ultimate recovery will be low
What might solutions look like? Are they using horizontals at this point?
No horizontal wells, and I doubt they will do that.
Thanks, Glenn, for the post!
I am wondering to what extent there is a learning curve in deep-water production, and maybe eventually BP will get this figured out--not to produce the one billion barrels of oil originally claimed, but to at least do a little better than they seem to be doing now.
I know they are making some changes now:
BP to cut Thunder Horse output by half -sources
As I watched President Obama appeal to science students to forward their ideas for solutions to the ongoing deepwater disaster, I couldn't help but conclude that he has been told that the disaster response is inadequately informed.
I wonder how many people BP has who are technically qualified to be part of the team attempting to end the disaster, and how this number compares with the number of people BP has working in 'communications', or with the number on the legal team working to shift responsibility elsewhere. The ratios here might cast some light on where on the deepwater learning curve BP sits.
That sounds like PR on Obama's part to me.
BP, better pray, Barack Praying, big peak, blowout prerequisite, big pardon, beyond pissed. Obama is on the prayer list at the Pentecostal Holly Roller Reformed Baptist Holiness Church of Modern Day Saints and we are all going to hell in a hand basket. I’m off my meds again, sorry.
hotrod
BP, bummed pelican
BP, bygone profits
They will stop the well with a giant Butt Plug.
I hope for Obama's sake, this oil spill disaster isn't his Katrina. If enough oil came ashore, or killed enough of the shrimp off, there sure would be a lot of angry people for a long time.
When I was a kid, there was an oil spill under the Golden Gate in SF circa 1972, during the striped bass influx into the bay. It killed so many their numbers never came back. It use to be a huge catch for commercial fisherman every year and anglers, then suddenly in one fell swoop it was over permanently. The same could happen to certain species, especially if this is their peak time of season like it is for the shrimp right now, and there goes another specie down to small numbers.
People will of course second guess the response time and the efforts taken to stop the oil leak, and there goes some of Obama's political force.
No, I think it was one of those things that slips out when you're pre-occupied with news that nobody has a plan that comes with a high probability of success to deal with the deepwater disaster.
I listened to a spokesperson for BP a couple of days ago. We have many strategies to respond to this disaster, he said, we're going to try them all. We're working with x, y, and z and we all have the same goal...blah, blah.
Obama, like anyone with critical thinking skills, understands this to mean that this is a seat of the pants scramble to find an ending to the deepwater disaster.
But then, Obama does need a PR campaign just to contain the disinformation endlessly dumped on the public by the spawn of satan. Left alone, these evil wretches would soon be fixing the blame on Obama, not just for the current situation, but for the Katrina disaster and every car crash in America. In the meantime, their naive minions are already trying to spread the lie that the federal government played too BIG a role in the post Katrina period, when the problem was incompetence in the falsely self-described conservative leadership of the federal government of the day.
Listen to Einstein. Question authority. But think about what he meant by authority.
toilforoil,
Obama's relationship with the press and media in general has been unique. No one will ask him really tough questions. It's a love affair with the press that I've never seen before, not even with John Kennedy. I don't think anynone except the far right blames him for anything. President Obama will not be hurt by anything that occurs in his term of office. He made five million dollars off of book sales last year. He will do well. I'm not politically modivated and I don't know the spawn of satan. I do know the evil wretches are those who pretend to lead us. The more you care about a political leader the more disappointed you be when you realize they are just front men. Those that pull the strings are not seen.
hotrod
Hi Gail, I have been involved in deep water exploration and production since 1990. We better be past that learning curve. Some fields just don't behave as we expect because we have very little other than seismic data with which to evaluate the subsurface, and it isn't all that great.
B-ware P-ensioners. B-etter P-ut your savings elsewhere, somewhere B-yond P-etroleum.
or as tstreet posted yesterday: Beyond Pathetic.
BP is a British company, and what the price of BP is affects international finances. The United Kingdom is not doing all that well now to begin with. Having BP do badly could be another item pushing UK's finances down (some of this through indirect connections--value of people's pension plans, for example.)
The interesting thing is that BP shares are flat during the British trading day and go down abruptly when the markets open in the US; basically British traders seem to think the Americans are over-reacting. I stop-lossed out of BP at 584p (it was trading at 650 not long ago) and am in no great hurry to get back in.
I doubt they'll reduce the per-share dividend, so if I buy back in at 500 it's an even better money mine.
hi glenn,
what are they doing with the water ?
also, i was wondering what is the nature of the reservoir oil ? the producing gor seems to be in the 800 scf/stb range. do you know the oil gravity and reservoir temperature ?
thanks for any information.
Hmm. Found this:
http://www.bp.com/genericarticle.do?categoryId=9013609&contentId=7021443
Perhaps they decided they didn't need them, but they still have to deal with the water. Overboard?
I believe I've read that currently TH producing wells are designed to be switchable to water injection mode if required but that was only supposed to happen late in the field's life.
It seems like they will use up a fair amount of their natural gas with all of this power generation. I really don't have any idea of gas quantities, but the 100MW facility seems large. Of course, if gas is $4/mcf, maybe it is too cheap to care about. Profit on it has to be negative.
Gail, it is quite common to use natural gas for energy generation on a platform.
I know. Just not this much.
I actually don't know what they are doing with the water. I don't see any records on the MMS of injection wells. they had planned for them because they thought the basin would not provide sufficient water drive--something they were entirely wrong about.
the API according to published reports is about 34 deg. As to the water and what they are doing with it, I don't know.
I don't know the details of water volumes and disposal. But I'll lay out some general whatifs that could have a huge impact on future TH production. You can dumped produced water overboard in the OCS but it has to be cleaned of the oil to a very low concentration. Though this techology is simple it requires a lot of space for the equipment. Produce too much water and the system can't handle it. If high water cut hit them much sooner then anticipated they might not have the facilities in place and, more importantly, not enough room to install the amount they need. The next option is disposal wells. But that's not too simple either. First, they need to have room for the additional wells. They'll still need seperation facilites because the injected water can't conatin too much oil either: it can cause a big drop in injection capability over time by plugging the injected formation.
It seems like drilling injection wells would be expensive too, at great depths. Someone mentioned that they were considering reusing existing wells for this purpose, but of course, they would want them to still be producing for some time.
I am wondering what happened in June 2009 to production. Main especially seems to be doing worse for production after that date. Could there be some kind of damage, that has not yet been repaired? North seems to be doing OK after that date, but had a dip in the June 2009 time frame as well.
That was just about the time the water cut really shot up so I wonder if they may have had to take some physical steps to deal with the extra water which they weren't expecting to have to deal with for years.
It is interesting to note that all money and expertise behind the Thunderhorse project had not prevented something what is in essence a wrong estimate of reserves. What kind of structure and rock characteristics allows production of 250,000 barrels per day? What destroys projects like Thunderhorse is treatment of an engineering problem using paradigms of economy. Rate of return on investement? When one spends $5bn on a platform like a Thunderhorse, is he willing to wait to return the investment in 5 or 15 years? Paradigm of present day economy is to have money flowing fast so the choice is - 5 years as all those years afterwards it will be a profit, pure and simple. Everything is tweaked, one tweak over another until everyone in the highest corporate level is convinced that field will indeed flow 1/2 million bbls per day. It would financially not be a feasible project if that was not the case. What destroys the field fastest and most efficiently? Overproduction. This is why they quarreled about the strength of water drive and decided it is greater than it really was. Pursuing profit in oil production may require a bit more engineering (realistic) approach than is the case with financial officers who finally approve the project.
It strikes me that the financial officers have too much faith in engineering, maybe more than engineers themselves. This results in the underpricing of risk.
The direction in which investment capital drifts in the near future should indicate whether or not the faith financial officers have in deepwater engineering is steadfast.
Several days ago, in an early WSJ article on the Deepwater Horizon blowout, there was a map of rigs off the coast of near La. There was a huge number. Most, I take it were shallow water. The article pointed out the output from shallow water was in decline. It's starting to look like deep water is not going to delay the onset of overall decline all that much.
All I have to say is given the expense of Thunderhorse getting it reasonably right was important. My point is to miss this badly at this level is beyond embarrassing.
Less expensive plays certainly don't have this kind of weight hanging over getting things right as in general that will often cover costs for sure.
Now what does this mean ? I means that discoveries and reported reserves are almost certainly seriously inflated because they don't matter till they do. In general this is often at least ten years after a field is in production.
And even this the fairy of technology has come to save the day over the last few decades as advances in well technology from re completions to horizontal drilling have allowed fields approaching the end of their life to be reinvigorated.
Almost always this takes the form of faster extraction at the expense of future rapid declines but whats important is not that but that any mistake in the reserve estimate is pushed out into the future. Indeed more often then not once the new technology is in reserve estimates are raised not lowered.
Now back to Thunderhorse what happens is exactly what we are seeing except in fast mode in this case reserve projects don't come down until decline is obvious and unstoppable indeed I suspect the reserves have yet to be written down in this case and its still considered a technical issue.
In general from what I can tell real reserves seem to be 70-50% of what used by peak oil modelers and the traditional models. Now that not really the interesting part. My own modeling which does not depend on reserve estimates suggests that these factors result in decline curve that does not match the production curve on the front side. Different for sure asymmetric perhaps aka shark fin.
What seem to be happening is the decline is not some smooth curve but a piecewise collection of linear decline periods. At the top you have a flat plateau for a number of years. Then it seems as if it goes into a fairly shallow linear decline rate of about 1mbd for the last ten years or so. Next I suspect we have transitioned in a piecewise manner to a much steeper linear decline in production.
Technology forcing seems to work in a sort of maximum production level even if this maximum is declining.
Perhaps this is a result of technical innovation have a sort of fixed or finite effect on production. Horizontal drilling for example can increase production for X amount of time from a thin oil layer with and eventual steep decline. Its deployment rate is controlled by both remaining reserves and above ground logistics with above ground factors acting to throttle the deployment rate. I.e the overall production rate is driven not by remaining reserves in any given year but the rate wells are drilled vs the rate other horizontal wells collapse in production.
For whatever reason this seems to be piecewise linear. Regardless the dynamics of the "super straw" seem to be in control at least in the first half of the decline.
I suspect later on fat tail statistics could become important however the economics of exploiting the fat tail are far from clear. As current events illustrate esp thunderhorse. The production rate would be significantly lower than today and the resource disperse and very expensive to extract.
In any case if this is true then US natural gas production should exhibit a faster move through a similar curve. Initial technical advances i.e UNG sources should result in a plateau period followed by a linear decline period with a fairly shallow slope thence I believe the plunge period starts with and extreme slope.
This entire curve should be much faster than oil occurring over months to a few years.
I'm guessing given rig counts we are in the initial linear decline phase however ironically NG prices are low right now. The problem is that prices probably will suppress production leading to a slightly steeper decline but worse perhaps not really responding until the "cliff" hits. The accelerated nature of the curve could well lead to the economic signal happening to late.
We shall see what I find interesting is that if this concept is true then it will obviously generate a major problem with over confidence. The flat period instills believe that technology is a winner the onset of linear decline is a serious cause for concern but not threating as the slope is generally fairly mild however if I'm right then the cliff still awaits and the next turn is abrupt.
Thunderhorse although a single example fits very well with this model given I believe that we are effectively out of oil that can be produced cheaply at high production rates reserve estimates of new discoveries over the last ten years should be in general wildly optimistic and overall production should decline rapidly as the technical advances of the last decades wear off. Thus if we are in a free fall a crisis would have to be developing in the oil industry over the last few years as it becomes clear that we are out of oil producible at a high production rate.
The only change to my original model of a plateau followed by and abrupt decline is the introduction of a sort of Indian Summer period where the old ways still work but lead to fairly shallow linear decline until they fail.
....."in free fall", "a crisis" and what Obama can ask people to do!!
Everyone should drive their car to the nearest junkyard, hand over the keys and walk home, unburdened, lighter, unencumbered. And continue life like this, car-free, no matter how many "deals" the car makers announce, no matter what happens to "the economy".
Everyone.
If everyone does it then no one will be walking alone while others drive past.
Curious as to what your modeling consists of. Is this modeling all in your head?
Kind of a general, abstract model?
If it is based on a realistic situation, it seems like you would have to imagine that the concept of reserves does exist. Extracted oil has to arise from some notion of an imagined supply, otherwise the model would assume ... exactly what?
Or are you saying that your reserve estimates are not estimates at all, but the actual ground truth? In that case, it doesn't sound like a model at all, but the measured result.
Well as you know I've calculated oil consumption from C02 data thats how much we have actually burned. Next as far as ultimate reserves go the bulk of the discoveries where before significant technical advances in general back in the 1960's.
This is 1.2 -1.5 trillion barrels of oil pretty close to what we have burned to date.
Next the question is can we have production levels close to what we have now yet be 70-80% depleted of our primary oil reserves ? My answer is yes.
And finally to finish the model is the fact that I agree with your fat tail model i.e a lot of oil is certainly left in this long fat tail from dispersive discovery however its utterly irrelevant as a resource. The fat tail nature of the system ensures we will never exploit most of the worlds oil as critical resource.
That is not a simple model but a result of EROEI, Financial and other concerns. So called fat tailed systems simply are not exploitable into the tail if you will.
And that really the key point that complex systems are intrinsically unable to transition into the fat tail region of underlying supporting resources.
This is why ecosystems for example can collapse with what on the surface are fairly minor disruptions. The complex system of a refined ecosystem simply cannot make the transition. Probably and this is guesswork the feedback loops from interconnected niches that disappear as the resource base becomes more diffuse and flatlines or contracts lies at the root of collapse.
As far as a model goes well this simply children's game illustrates the concept.
http://www.nickys-nursery.co.uk/seeds/pages/garden-games1.htm
Building the tower is no problem the problem is its impossible to deconstruct without collapse. Assuming the building of the tower represents expansion of a resource and removing blocks represents the transition to a fat tail you see that it literally cannot be done.
Thus my assertion that we are actually close to out of oil at least for our civilization.
For this to be true however there would have to be a sharp transition period from peak into the tail region. There has to be a shock period if you will where our refined complex society goes rapidly from peak ability to extract a portion of the remaining resource to where this portion dwindles rapidly. Thats the fast or easy oil based discovered through the 1960's thats well exploited. Later discoveries are of zero importance once this base goes into steep decline which is should because our ability to exploit it throughly is very mature.
Sure there is a transition period however the time scale of that as short vs the overall period of exploitation if we assume oil has been exploited for 100 years then the transition period is perhaps say 10 years or 10% of the overall period.
We won't know of course the exact numbers until everything is done but basically the system runs fairly smoothly right to about 90% of its final value or so and then collapses in the final 10% transition period. The remainder of the resource is locked into a fat tail distribution and could well be 50% or more of the theoretical total it just is never exploited at least by the system developed in the expansion phase. Given the expense and lack of infrastructure post collapse of the original system I'm not sure it ever is or is worth considering in context of the original complex system.
In any case to continue you can see right at the very tippy top niche removal shakes the hell out of the system in a prelude to collapse even though the underlying fundamental change is initially fairly small albeit accelerating rapidly.
In any case what should happen is our civilization should destabilize rapidly and underneath the resource production level should also fall rapidly. This could even be expressed as a systems failure i.e wars in producing regions there is no intrinsic requirement for the absolute decline to actually occur simply knowledge that its imminent needs to be widespread. What this means is the only signal required to initiate the collapse sequence is recognition that the core resource base is declining rapidly and further gains are in the difficult to acquire fat tail region. Next of course if the acceleration in the decline rate is evident then it would seal the situation.
This assumes a cognitive member in the complex system but not necessarily human like intelligence. I suspect this sort of conclusion is what may drive a predator like a hawk to seek better hunting grounds. They don't hunt a region to exhaustion but leave the moment a region approaches fat tail like statistics. Evolution has refined predator species to the point that our current ones intrinsically recognize this and migrate or at least attempt to migrate to better hunting grounds. Only in cases where this fails does the natural system actually follow the collapse scenario. Our civilization is of course stuck on this final collapse as it has no where left to go.
All your missing in my opinion is the impact of fat tails statistics on complex systems and the effectively impossible to model conjecture of a sharp transition near the peak caused by refined complexity being mistaken as additional resources.
You can't deconvolve the petroleum production based on CO2 data !!!!
CO2 gets generated from coal, natural gas, and even cement production:

How exactly do you intend to remove the uncertainty in the other three sources?
You actually don't have a model. What you have is a very confused circular argument that ultimately will become a tautalogical nightmare.
Let me rephrase what Memmel is trying to do:
Memmel's oil production model is based on CO2 production. The CO2 production is based on carbon fossil fuel sources. He will remove the other sources of CO2 to get at that caused by petroleum. Yet the other sources are just as uncertain as the petroleum, which ends up turning the original oil production twice removed from the data itself.
Just like I figured, there is no model, only a failed attempt at a clever tautology to separate it from the empirical data itself.
I don't care if you or others can't understand what I am trying to explain. The hardest thing in the world is trying to articulate someone else's bizarre world-view. I can't get in your head and I can't tell what you are trying to do. Are you just playing mind-games with us? I give up. My brain now hurts.
WHT, Yes, that was my reaction. There's no way memmel can back calculate oil consumption from CO2 rise. There are even more factors feeding into atmospheric CO2 than you have listed. Agriculture and forestry cause CO2 emissions too.
Some of the other factors show up as the seasonal variations and the pre-industrial level of 280 ppm. I think it is an interesting system, because part of the system is in equilibrium over long periods of time and the other part is showing the extended impulse response from the various human and other (volcano, etc) forcing functions.
You are indeed right that it is hard to separate these out completely.
Not to mention purely natural effects, like climate variations, vulcanoes and so on! Evaluating oil production from atmospheric CO2 would be much like evaluating the income generated by US Federal income Tax based on the evolution of US federal debt :)
Obviously you have not read my paper.
I find your ability to critique a paper you have not even bothered to read impressive.
Your wrong about being able to deconvolve certainly you can.
Right there your already fundamentally wrong about what I did. In fact I make it pretty clear what I'm doing and why. I'm not concerned about uncertainty in measurement I'm concerned about systematic error or simply bald faced lying your ass off.
Your completely wrong in assuming that uncertainty in the data is the issue I've written often enough that thats not the issue the real data is well known and well understood we are simply told a lie and its huge.
The public data for oil is effectively completely fake its trivial to split out this forgery from real data that has no intrinsic political reason to be forged and plenty of supporting secondary sources that more than support the general values for coal and NG consumption.
Indeed I have no real problem with our ability to collect excellent data in regards to coal oil and NG consumption and production and even decent reserve numbers for oil. The data exists and for NG and coal there has been no strong reason to alter the data for political gains as generally both are readily available and abundant.
Not so for oil and as I said we are not talking about error but significant blatant political lying.
Again your wrong I've modeled as well as you can model the situation given the constraints and given the unknowns. Oil reserves in excess of 1.2 -1.5 trillion barrels are highly questionable up to that level is well supported with plenty of data and reserve estimates made decades before there was any reason to alter them for political gain. Using C02 data that you dismiss I can create a consumption curve consistent with this URR. The only open question is our production levels are surprisingly high given our depletion level of remaining reserves. However technical advances especially horizontal drilling and water/gas injection (secondary recovery) are sufficient to support such high production levels against a dwindling reserve base. This can be readily seen at the field level where production at 70% depletion is the same as at 10%. Modern technology allows for a long plateau. The assumption that oil production can be modeled using the central limit theorem rests on shaky ground as oil production is dominated by a handful of fields a few hundred at best. Next we have several examples of giant fields declining rapidly in the public domain. And last but not least we have your work which highlights the fat tail effect. Which I'm also fine at least with the general model its predictions simply suffer GIGO.
The final result is the best model given the circumstances lacking transparent access to oil data reconstruction of oil consumption from C02 data indicates that oil production claims are almost certainly highly distorted for political reasons. Reasonably trustworthy estimates for reserves from when the bulk of discoveries where in the past yet before political corruption of the data are sufficient to support the production profile deduced from the C02 data given technical advances little more is needed. Indeed we have not made a discovery rivaling those of the 1960's and before since.
The result is fairly simple to connect future production with current production levels given a 1.2-1.5 trillion barrel URR requires a period of rapid decline in production especially given it has to match up with a long fat tail period of potential production in the future. This requires that most of our current sources of production have to be at the brink of exhaustion. Even if we assume and additional 0.5 trillion barrels of oil in the fat tail region which is probably correct if not exactly important as it extends over decades. The production rate in the fat tail region is still 50% of the current production level and you have to connect the transition and the oil needed to do this via some sort of gentle decline literally does not exist.
The exact production profile over this transition period is simply impossible to model the timing of the collapse of the the giant and super giant fields plays a critical role in the production profile. Next the end of discovery of smaller rapidly exhausted fields that last less than a decade plays a large role in the actual value. The magnitude of decline is on the order of 30 mbd and the period has to be a decade or less.
Thats pretty easy to figure if the fat tail gives us a production level of around 40mbd for several decades or about 14GB a year into 500 GB for about 30 years and we are at about 30GB a year right now and down to our last 100 GB or so of reserves that can be extracted at a rapid rate then the transition from 30 to 14 has to occur over a period of years.
This is simply a problem of the boundary conditions if you will giving a certain result. Brutal yes but then the question becomes can you dismiss the result ?
The result I've gotten so far is no you cannot no approach I've tried can eliminate this gap. Indeed the flagrant political distortion of the data on oil production that I've uncovered suggests that this gap is real.
And last but not least I suggested several months ago that if I'm right then you will see the truth in the next six months.
I could care less about how much you deride my approach that mean nothing whats important is that the divergence if you will happens now. If I'm right then TSHTF right now.
Now again understand the actual change and rate of change during this period is basically unpredictable all you know is that it flattens out into a long tail over the next few years however given all the data I watch concerning short term oil production the result continues to come back that oil production is declining rapidly now perhaps 2-4mbd over a year which could be 1mbd every four months.
But it could still be as low as 1mbd per year nothing prevents it from being that low and nothing prevents it from being higher the exact number as I said is in the details of when individual giant fields begin steep decline and is thus by its nature impossible to predict.
However it does not really matter there are only so many ways to connect a 50% drop in production over a decade or less the number of physically reasonable ways is even smaller and its just variant of linear collapse with a few different slopes.
The fact its effectively impossible to model this period thus does not matter all that much as there simply are not all that many choices to make. Turns out I actually biffed it a bit till I got the C02 data but once I understood what it meant then the corrected model actually makes a lot more sense than my abrupt cliff conjecture tainted by published production numbers that claim a long plateau right now. The experimental result is far more reasonable and sensible. It still means we need a second much steeper decline period to get everything connected but it introduces a much more physically sensible spread into the data. Its still effectively a cliff but now I can see it has enough of a slope that its a lot more reasonable the original model required some incredible correlation. Not that that some fairly tight correlation is not there with whole swarms of fields going into decline practically simultaneously but its no longer so short that its difficult for even me to believe. Regardless this grace period with a more reasonable physical spread and fairly low decline rate is in the past and correlation has increased dramatically over this period. Indeed once its introduced and you have a generally high priced oil production period it actually induced the correlation required for the follow on more rapid collapse phase.
Here is a prime example of why using CO2 data makes no sense. We could stop burning oil tomorrow and the CO2 curve would not change instantaneously.
CO2 levels are a dispersive impulse response to a given forcing function. In other words, we are seeing changes in CO2 levels from fossil fuels burned many decades ago.
We could be in the middle of a precipitous drop in oil usage, and there would be Memmel pointing to a CO2 curve that is barely showing a change in slope. It is actually quite comical, if you think about it, asking a weatherman to tell if it is raining, when you can just look outside (apologies to Dylan).
I sometimes get accused of waaaay overthinking things, but this one is a no-brainer.
Dude your just slamming me.
Really and what happened after it was burned did the tooth fairy hide it for a decade ?
Your making really really stupid statements to slam work you have not obviously figured out yet. Just because the model turns out to a be a trivial linear function does not change the fact that its a model.
And of course as far as your beloved model goes there is and excellent and natural reason why Hawaii turns out to give excellent near real time data concerning C02 changes in the northern hemisphere.
http://earthobservatory.nasa.gov/Features/Wake/
Notice I mentioned Northern Hemisphere not the world and certainly not the southern hemisphere and not the arctic. Turns out as far as I can tell only the Hawaii data is positioned correctly. And there is a reason for this.
Next as far as the predictive power of making global measurements of and atmospheric gas.
http://www.geiacenter.org/reviews/radionuclides.html
Radon measurements are being used to calculate changes in ice cover.
This is very similar to my approach for C02 if I can't determine large changes in C02 emission then your correct and these people are incredibly stupid.
I honestly have no idea why you do what you do it seems like you have a bit of a personality problem. It certainly interferes with your ability to be a scientist.
As far as your own model goes well after I pressured the hell out of you about the validity of the oil data you finally admitted if its wrong then your prediction is wrong. That took months.
I offer a way to correct the oil data using a secondary measurement with it one can backtrack rapidly to figure out our real URR. The problem is of course I happen to agree with your general work of fat tailed statistics. You have the right high level view however the devil is in the details.
In the end it seems you have certainly succeeded in postulating one thing that is correct and I've never said otherwise. Other than that I don't find your work all that useful and your sarcasm does a lot more harm than good.
I don't really care I'm used to being around scientists and many have simply awful personalities many don't you ignore it and focus on the persons results. If they are useful then you use them. Your work is in my opinion only useful in a highly qualitative why its predictive power is effectively zero. But its very useful as a sort of broad qualitative measure. The fact you think its more than that can be safely ignored and is of little importance.
I've hesitated to make this statement but Web your lake of understanding reaches the level that your claims are detrimental to the readers. The problem is you have a few things right in the general sense but I doubt many people can separate your wheat for the chaff you toss about. And you spread a hell of a lot of chaff.
I'm happy to glean the kernels of wheat out but I know what I'm doing. As I said I doubt many are able to see the difference and understand what you have right and what you have dreadfully wrong. I've found bits and pieces of your work invaluable but its just bits and pieces.
I'm not dismissing the value of your contributions some are valuable but the noise factor associated with them is horribly high.
I don't have a problem. I just actually enjoy doing the science and math more than you do. To some people that looks like a problem.
I will post a full analysis of CO2 build-up tomorrow that will use the pre-industrial baseline of 280 ppm, a conversion of Gtons to ppm of 0.456 and a characteristic dispersion/diffusion time of 5.3^2 years^2.
I pulled data from an aggregation of coal, NG, oil, and cement production. I only had one free parameter, so I tuned the dispersion time until it fit the Mauna Loa curve.
The way this works is one convolves the impulse response with the carbon production data and then add in the pre-industrial baseline. It was a good exercise for me because now I understand exactly what Al Gore, James Hanson, and all those other climate scientists were talking about. I no longer scratch my head on these matters.
For what it is worth, I think the financial system and world trade also get involved in the shift to a rapid decline rate. Even if you have great technology, you can no longer go forward and start going backward pretty quickly if international trade systems start to falter.
Gail, I have thought for more than a decade about what will happen as the oil age ends. I don't think we will gradually go down. I think it will be a sudden shut down. We will probably go to war over the last 1/3 of the reserves. And that will mean that the last 1/3 of the world's oil will not be used to the betterment of the human condition. It will be burned in the wars.
Why? Because humans have this nasty habit of saying, "If I can't have it, then neither can you!"
I can think of some counter-examples. Though they involve dictatorial powers. In WWII Imperial Japan, the USSR, and Nazi Germany all suffered huge decreases in available energy. Yet they all stayed organized and their populaces worked very hard to compensate for the losses of energy.
I'm not saying that military dictatorships are necessary once Peak Oil starts tearing the guts out of our economies. But we ought to at least seriously entertain the question of what kind of political organization is needed to deal with yearly declines in available oil of 2,3,4,5,6%. At what decline rate do the metaphorical wheels fall off of a market economy?
I am thinking that a number of measures short of dictatorship could be used to enable a more orderly and less steep decline:
- Staff up bankruptcy courts to enable bankruptcies to be speedy. Transfer of assets from stock holders to bond holders will allow organizations to survive in shrunken state rather than collapse entirely. Lots of restructurings under bankruptcy will be needed. Time will be of the essence.
- Write national laws on handling state and provincial government bankruptcies. It is my impression that US states, for example, do not have bankruptcy law for them. Also, as Vallejo California's trip thru bankruptcy shows, the courts do not have clear direction on such matters as pension handling of bankrupt government entities. The bankruptcy laws for corporations are much more mature than the bankruptcy laws of governments. The EU is similarly ill-equipped as its handling of the Greek crisis demonstrates.
- Loosen up laws for allowing very small cars and scooters on the road. People are going to need to be able to downshift to small electric vehicles in a hurry. Some jurisdictions are already pretty good on this. But others need improvement.
- Allow very small small room hotels patterned after the very small box hotels in Japan. This will allow workers to cheaply stay near their workplace during the week and make trips home only on weekends. The ability to rapidly switch to using such accommodations will enable more rapid adjustment during the crisis.
- Force reductions in consumer energy usage that are steeper than the overall decline in energy availability and channel the freed up energy toward creating new wind turbines, nukes, geothermal generation facilities, and other capital plant for generation energy.
Force reductions in consumer energy usage
Yes, that's the key.
Food-and-goods freight transportation uses about 25% of oil consumption. Light personal vehicles overall account for 45% of oil consumption: their utilization could be tripled in a matter of months, freeing up whatever fuel was needed by the freight network.
Just triple fuel prices with taxes that are funneled immediately back into FICA reductions, and mandate carpooling, telecommuting and videoconferencing. It's really pretty straightforward - it just requires a social decision to do it.
Loosen up laws for allowing very small cars and scooters on the road. ...downshift to small electric vehicles in a hurry.
Also a very good idea, but longer-term.
Allow very small small room hotels patterned after the very small box hotels in Japan. This will allow workers to cheaply stay near their workplace...
A decent idea, but not needed. Carpooling is very inconvenient, but it beats the heck out of small-box hotels.
Don't forget: freight efficiency can be increased very quickly, overnight. Fuel consumption per mile is roughly the square of speed, so slowing down saves fuel: in 2008, with high fuel costs, most container shipping slowed down 20%, and reduced fuel consumption by roughly a third. For example, Kennebec Captain's ship carries 5,000 cars from Japan to Europe (12,000 miles) and burns 8.5 miles/ton of fuel at 18.5knots, for a total of about 1,400 tons of fuel. At a 10% lower speed of 16.6 kts, the ship burns 21% less fuel (about 300 tons).
Huh? Can you give an executive summary?
Really? IMHO, WHT often overthinks things, but here I think you're the one overthinking. Why not just take the statistics for oil consumption, add 'em up, and be done with it?
Let's try it this way. If you don't trust the oil statistics, I can't for the life of me imagine why you'd trust the coal statistics either. But to deduce the oil, you'd have to subtract out the untrustworthy coal - and natgas - from the total FF-supplied CO2. So already we're done, we see it's a blind alley.
But then there's the cumulative ocean absorption and exchange with the land biosphere. We've got to compound the uncertainty by correcting for that too.
So the deduced oil consumption would be the difference between a total deduced from the measured atmospheric CO2 concentration, and the sum of at least four numbers each of which is probably at least as uncertain or untrustworthy as the oil statistics themselves. Why bother?
My brain may hurt as much as WHT's.
Thanks. My brain feels better now. I figured there was a small possibility that I was going insane.
You have a very limited imagination if you can't even "for the life of" you think of any reasons why oil production stats might be more subject to political/national security manipulation at certain points in history (including now) than gas and coal. Although my imagination, if I run down Memmel's path in a "what if", would suggest that coal and gas figures would likely themeselves become more tainted in the end-game.
"You have a very limited imagination if you can't even 'for the life of' you think of any reasons why oil production stats might be more subject to political/national security manipulation..."
That's a strawman instead of a paraphrase of what I said. Political manipulation is but one source of uncertainty. Cumulative coal consumption is quite large since it has run a very long time and the rate only crossed over oil in the mid 20th century. To get at cumulative consumption one must use rather dodgy (not necessarily because anyone was doing anything nasty, just age, missing stuff, and inaccuracies) historical estimates. And the ocean and biosphere exchange uncertainties may dwarf the statistical ones.
The issue may be that we're talking about cumulative consumption here - not reserves. It's been well and even tiresomely documented that oil reserves numbers are a political mess. The best we can expect for reserves is SWAG (which means that arguments about the extent of AGW that's possible may be resolved only by events.)
But consumption, which is what produces CO2, is harder to hide or to exaggerate by large amounts. It shows up in a great variety of national statistics - economics, VAT, environment, minerals-and-mining, fuel and sales taxes, import-export numbers - kept by governments and agencies that are often at odds with each other - which are cross-checked by enough competing analysts that large discrepancies show up (i.e. we can make corrections or at least plot error bars.) And we even have analysts counting tankers, most of which are too big to hide, as they enter and leave ports.
So, in the interest of cross-checking and making sure the Big Picture is self-consistent, I have no problem with checking that the numbers add up. In fact I think it's a great idea, and indeed I would hope that somebody in the climate-science community stays on top of it in order to help understand the ocean and land to atmosphere exchanges. However, with respect to the narrower issue, I'm still not persuaded that deducing cumulative oil consumption from all those other numbers, as a difference between large and uncertain values, would be likely to deliver much in the way of news that would be a clear improvement over the consumption statistics themselves.
And indeed Memmel argues these inconsistencies do show up and states this frequently. And you know what? If you go and look you really can find other things that appear to support his arguments. Doesn't mean to say he's right but it is enough to make some people think.
I can see it annoys Memmel to repeat the same things over and over again and while I try to read all of Memmel's long and detailed posts, I'm sure a lot of people just skip them due to length if nothing else. I think he should write a book personally then he could just say "Page 37" and make for shorter answers :-)
Btw, could you show me where I can find the "error bars" and how that's calculated for world oil production?
Good question. First and foremost the error term is subsumed in the calculated slope of my linear model. Certainly I have a least squares fit error term but thats not the real error. The fundamental error term which is what I suspect your wanting would be in any nonlinear response to C02 production. Lacking a control i.e we have only one planet I don't know how to calculate this. However I argue that the magnitude of change required to create a planetary scale non-linear response function is huge.
Next the simple fact that life exists on earth suggests that non-linear C02 absorption processes on a significant scale are very rare and unprecedented. Not that it has not happened snowball earth models point towards periods when we had and effective run away event and glaciation periods certainly happen. However in my opinion I see no way for the system to become non-linear without rapid climate change. However I did leave in one potential area where there are probably issues.
http://en.wikipedia.org/wiki/Mount_Pinatubo
Its the only natural event over the time series that even comes close to the magnitude of anthropogenic sources. If there is any hope of calculating any sort of real error term then analysis around this event is the place to look. And in my opinion the data is suspicious around that period. Looking into changes in the Carbon isotopic ratio around that period is probably useful.
http://www.scientificamerican.com/article.cfm?id=climate-change-hiding-m...
http://www.sciencedirect.com/science?_ob=ArticleURL&_udi=B6VND-48YW3B9-1...
Any serious deviation from the linear assumption should leave a mark in the carbon isotope ratios as basically any process one can think of tends to have a differential absorption or emission profile for the isotopes leading to a detectable change if its large enough to be pertinent.
Even more interesting is investigation into secondary pollutants especially radionuclides which can be measured with precision. Given that the nature of the the change is a massive increase in coal usage especially in china it should show up in the trace signature. Perhaps thorium ?
http://www.ornl.gov/info/ornlreview/rev26-34/text/colmain.html
C14 perhaps ?
http://www.talkorigins.org/faqs/c14.html
SO2 of course but this has some problems.
But but your talking real science and thought about the matter :)
In any case the sheer magnitude of the changes in coal production in china are so large unless you can identify a massive non-linear associated sink then the result stand as they are. It would have to be on the scale of the sudden appearance of the amazon basin to even come close to working as a carbon sink for chinese coal production. Your dealing with really really big numbers.
China can be likened to a massive volcano going off that rivals the biggest natural events in history. Perhaps for example equal to a super volcano like yellowstone erupting. Not to mention India.
The only way to reconcile this lacking the sudden teleporting of a Amazon jungle from a sister earth is one of our other sources of carbon had to decline in concert.
Nothing about natural gas suggests its the culprit which leave oil.
This is big its huge and well beyond any error term regardless of what it is. Its equal to the oil consumption of the US shifted as coal over basically to china.
Perhaps the current oil spill can help people visual the magnitude of the numbers I'm talking about. One single well running about 5,000 barrels of day is causing and oil slick that can be seen from space covering hundreds of square miles. Burned of course this would be injected as C02 in the atmosphere. We have thousands of these wells. Consider if every oil well in production was allowed to spill into the ocean it would literally cover the worlds oceans in a thin layer of oil.
Coal production and NG production are on the same order.
My paper suggests discrepancies on the order of millions of barrels of oil a day for recent history its 10mbpd or basically the daily oil imports of the US.
Its either simply completely and utterly flawed and wrong or its right no possible source of error can be this large there simply is no physical feasible process that can cause something of this magnitude. What ever is offsetting the rapid rise of coal production in china has to be huge.
Pundits which are not considering what my paper is actually saying are not doing the trivial and simple math that takes less than a second which points towards my basic thesis as being correct. The magnitude of the change is difficult to comprehend its so large on the scale of all the coal/tea in china.
Finally what error there is is probably less than 2% and well below the general result.
And the real kicker is the fact I match oil production perfectly with price. I find it interesting that the bombshell real clincher super answer that is the real conclusion of my paper that I have a almost perfect correlation with the price of oil with my calculated production profile is left out the probability of that happening if I was doing mental masturbation as suggested by other posters is zero.
I was absolutely stunned at the fit myself indeed I still am. Especially the implications back in the 1980's thats just plain chilling. It took be a while to come to terms with what the results imply about how our real political system works.
It shook me right to the core. I've known for some time that the US was a "bastard" if you will on the world stage but the shear extent of our lies and duplicity simply has left me deeply troubled it made a mockery of my entire life esp my childhood I grew up literally living a lie and did not know it.
Up of course until late 2008 something really really big happened in late 2007 through right now. The C02 data is obfuscated because of the intense winter so at the moment its not all that useful. Above ground financial tricks have heavily distorted oil prices over the short term almost collapsing the global economy even.
We are no longer on the fairly gentle 1mbd annual decline slope we where on in the past its steepened significantly at least for now I don't have any way to really capture the extent of the change. Also it could very well not be a simple change in volume but perhaps and export land effect. I.e the overall rate of decline might have not changed that much simply its Saudi Arabia now in steep decline having a significant impact on exports. I think its a mix of both a significant acceleration in the overall decline rate and a concentration of this change in exporting nations esp Saudi Arabia.
I'm setting right on top of the event of the century indeed the defining event of our civilization that marks its end and I can't friggin see it clearly its driving me bananas. The cloud of obfuscation and lies are simply so large now its almost impossible to discern the truth. This alone suggests the big one happened.
But I just have to wait patiently 2-3 more months and the C02 data will clear from the winter surge and become reliable. All my other indicators fit well with a serious fundamental change estimates of the scale of games that where played with a mix of oil and money over the last two years suggest that they they have probably already failed in general back in October/November of last year.
Theres a very good chance I might not find out exactly whats happened given what I think it is the probability of a obfuscating strike on Iran or some other above ground action altering the worlds oil supply or the demand is steadily growing.
However I happen to think the odds are in my favor and evidence of exactly whats going on will be clear at least to people willing to dig before disruptions fundamentally change our situation. Perhaps not who knows practically nothing is reliable any more the problem is my complexity theory suggest that greater distortions will occur to existing data and worse more sources of data will become corrupted. I'm fighting a losing battle between trying to figure out the truth and having formerly reliable data sources turned into propaganda. I don't know when a source of data is going to get the political massage and by how much.
For example I used to place a lot of faith in US propane data.
But its diverged from price recently not to mention making a questionable move :(
Thats one example of a number that used to be very reliable that became questionable in general damn near everything I look at outside of C02 is under a cloud of suspicion all kinds of data are starting to not add up in different ways.
The various inconsistencies and how they are diverging is irritating to say the least. Numbers are all over the map with things that should be correlated and have been for decades becoming uncorrelated. Some of this could well be the results of trillions of dollars of stimulus money splashing through the economy in and almost random fashion disrupting and distorting the normal economic patterns. Building bridges to nowhere can lead to peculiar changes in economic data.
Of course most people think I'm stark raving mad I think but even this mad man is having a hard go of it at the moment as things have gotten too weird for me to understand outside of something really really big happened.
Interesting answer but I was actually asking PaulS to point me at where I could find details of the calculated uncertainty in the various "official" world oil production stats seeing as how he had brought the subject up... :)
Drawn by the undertow
My life is out of control
I believe this wave will bear my weight
So let it flow
Oh sit down
Sit down next to me
Sit down, down, down, down, down
In sympathy
Now I'm relieved to hear
That you've been to some far out places
It's hard to carry on
When you feel all alone
Now I've swung back down again
It's worse than it was before
If I hadn't seen such riches
I could live with being poor
Oh sit down
Sit down next to me
Sit down, down, down, down, down
In sympathy
Those who feel the breath of sadness
Sit down next to me
Those who find they're touched by madness
Sit down next to me
Those who find themselves ridiculous
Sit down next to me
Love, in fear, in hate, in tears
- James: Sit Down (Partial Lyrics)
Although that's not where the "undertow" handle comes from but it might as well be :-)
Crisis of confidence?... You bet.
Memmel, I moved to the UK as geophysical manager for the company I was working for in 2000. They had a field that became my responsibility. It was a disaster that eventually led to a $400 million write-down. Several things led to this being a problem. Organizationally no one listened to dissent. Dissenters were killed. One manager who tried to stop the project eventually had the blame pinned to him.
Because of the UK libel laws (which allow a scientist to be sued for telling the truth), I will not be clear on who did what.
When I moved to Aberdeen the steel was being ordered for the facility. Two weeks after I moved to the UK, I had 4 geoscientists in my office telling me that the field was not as some managers were telling upper management. These geoscientists wanted me to tell upper management that the field was crap. I thought, "oh yeah, I want to get in the way of THAT train which has already left the station!" At that point in time, I didn't know Jack about the field. I told them to give me the data and I would look at it.
In 3 weeks, I came to the conclusion that we had a train wreck coming, a really really BIG train wreck. Over the next 9 months, I processed the seismic data 42 different ways trying to see what we couldn't see with that seismic data. I became convinced we needed new seismic. The problem was that we couldn't detect the sands, and we couldn't predict them. If we had better seismic, I reasoned we would get an ability to detect the sands. For a year and a half, I told everyone I could talk to that we needed new seismic and told them of the technologies we would use. One manager above my level threw me out of his office in anger 3 times.
At a going away party for a good friend of mine, who was being transferred back to the US, I walked up to the country manager who was discussing this field with an engineer. This was a year and a half after I moved to the UK. I said, "Oh, you are talking about [name deleted] field. Here is what we need to do. We can't predict the sands from any geologic model so we have to be able to DETECT them. We need new seismic, and here is a technology that will give us 100 hertz data at the depth of the field."
The country manager looked at me in anger and asked, "Why in the hell have I not heard this before??" I was stunned. I had talked to almost every manager one level above my grade level for almost 2 years, and these were the direct reports to the country manager, and NONE of them had mentioned this to the managing director.
He talked to the manager who had thrown me out of his office several times and suddenly that reluctant manager was all in favor of my plan. They flew to the US to present my plan to upper management. But when the meeting started, uppermost management told the managing director that he was being demoted and then the manager who threw me out of his office emailed me from the USA and, gloatingly, told me that the idea was dead. I could almost hear the happiness in his email.
A few weeks later they named a new country manager, a guy with whom I had worked for 10 years. I emailed him this email (you need to know that we became vested in our retirement at age 52).
[name deleted], This is a career ending email, but I don't care, I just turned 52. Here is what we need to do at [field name deleted]....
Eventually the company took my plan, we shot the new seismic, it showed that the sands were NOT there on the structure as had been previously thought. That was sad, but we stopped drilling wells which cost 4 times the cost of the seismic per well, which wells didn't produce and no one knew why. We stopped the madness of blindly drilling wells without knowing why they were underperforming. The company took the write down.
When the inevitable witch hunt committee came to Aberdeen, they interviewed me with the idea of pinning the problem on me. Here is what the conversation went like.
witchhunter:"Mr. Morton, you know that subsurface mapping determines the reserves, the area of the field, the quality of rock, and that reserves et al determine the steel that is ordered, the platform that is installed. Clearly there was a mis-estimation of the reserves here and YOU, sir, are subsurface manager."
Me: "The project was sanctioned before I got to the UK."
Him: "The project was sanctioned in September (year deleted)."
Me: "That late!!!" ( I was already in the UK
Him, sounding like he had caught a witch: "Yes, Mr. Morton, that late."
Me: "Well it everything was already on order before I got here. I moved to the UK two weeks before that date. I didn't know jack s..t about that field in those two weeks!"
Him, sounding seriously crestfallen,"I see...Ok, what happened?"
After I escaped the dunking test for witches, the new country manager gave me the promotion I had long coveted, the largest raise I ever got and the biggest bonus--all for risking my career to stop the madness.
I tell this to point out that there are undoubtedly people like me in BP but they are probably being killed.
I have had experience with a bad field and one of the last things I want to list on my resume is that $400 million write-down field. But I am proud of the work I did on it because I stopped the madness. I think that eventually led to me becoming Exploration Director for China.
Why is it beyond embarrassing to get it this wrong? It is not possible to know in advance. So being wrong some of the time is to be expected.
CEO bonus's are dependent upon success. Remember the rule in politics applies to the corporate world as well. Never embarass the King! The 'King' has spoken admiringly to Wall Street about the now miscreant oil field.
Deja Vu all over again:
http://www.nytimes.com/2004/04/08/business/oman-s-oil-yield-long-in-decl...
OMAN'S OIL YIELD LONG IN DECLINE, SHELL DATA SHOW
Published: April 8, 2004
There are two problems: 1. the CEO, 2. the people beneath him.
One reason I never wanted to go higher than exploration director was that in the rarified atmosphere of the top offices, people don't talk with you, and if they do, they tell you what you WANT to hear, not necessarily the truth, and then you go out and say things that aren't true. This doesn't absolve any CEO of the responsibility or even of engaging in truth twisting, but reality is bringing bad news to any CEO is a risky affair so the underlings play the role of the enabler to the CEO's wishes that all is fine. After all, what underling wants to lose his position because he was the proverbial messenger?
I will say this, one of the things that made my rise through the ranks slower than lots of others was that I would tell the truth as I saw it (I could be very wrong and was on occasion). People don't like the truth if it has bad implications(look at how long it has taken peak oil to become mainstream among governments). When it became obvious to one and all that that misbehaving field, of which I spoke, had serious problems, two vice presidents came to Aberdeen to view the situation. I was one of the first people they wanted to speak with because I had a reputation for independence and telling people what I thought of things. That was good in a catastrophic situation, but bad if you want to be a vice president.
Care to speculate on when we will see a report of the TH (main field) production crash in a trade journal like the Oil & Gas Journal?
Only when BP drops the reserves.
BOB -- You've broken one of our most cherished rules (you didn't say what management wanted you to say). Now I'm forced to administer the most severe punishment:
NO SOUP FOR YOU!!!
Glenn,
Could you provide a link to the Minerals Management Services Thunder Horse production data?
I'm not Glenn but,
http://www.gomr.mms.gov/homepg/pubinfo/freeasci/product/freeprod.html for the full database. OGORA is the key file here from that link above but once you know the lease numbers (which for Thunder Horse are G09866 G09867 G09868 G14658 G19997) you can get a subset of the data interactively at http://www.gomr.mms.gov/homepg/fastfacts/production/master.asp
hmm. I tried the interactive download for G09866 and G09867 for 2008 to 2010, and got:
"Searched by Lease Number and Production Year and Production Month and Lease Oil Production, Sorted by Default Sort.
There are no entries matching your criteria."
The full download worked just fine.
I just tried it again. Still works fine for me. For G09866, 2008-2010 I get "our search returned 25 entries"
Well, thanks for both. I guess with a number of leases, it probably makes sense to download the full dataset, and just sort out what you want.
Yes and with the full database you can lookup the lease number(s) from the field location production block(s) plus get additional info such as individual well stats.
Nick, it's tricky. You must enter the lease numbers one at a time, then you must check the right boxes or nothing will happen. For instance check the box beside number and then in the "Lease Number" box enter in the number g14658. Then check the box beside "Production Month" then enter From:1 To: 12. Then check the box beside "Production Year" and enter From: 2008 To: 2010.
Then down below make sure "Default Sort" is set and "100" results per page, then click on "Submit Query" and you should get the results. Then you will have to do the same thing again for all four other lease numbers.
Ron P.
Thanks.
It is a huge database. Glenn sent me his spreadsheet, to help with formatting of graphs. We discovered he had to delete the un-summarized data, to get the spreadsheet size down to something that could be e-mailed.
I found that the raw data was 3MB, and my spreadsheet was 4MB.
In the future, you have an alternative to purging data in order to reduce it's size: you can "zip" the file. In Windows XP right click on the file, and choose "send to compressed (zipped) folder". It should reduce the files size by about 70%.
http://www.gomr.mms.gov/homepg/pubinfo/freeasci/product/freeprod.html
Thanks.
That's good work about crazy horse. It seems many offshore projects never reach their nameplate output, Enfield (Australia) and Chinghetti (Mauritania) comes to mind.
Also, according to wikipedia megaprojects database, Brazil launched new oilfields as follow :
- 2007; 6 projects for a total of 640 kb/d (thoudands barrels a day)
- 2008, 3 projects for 200 kb/d.
- 2009, 6 projects for 465 kb/d.
That's 1.3 Mb/d in 3 three years !
Yet production grew from 1.73 Mb/d in january 2007 to 2.0 in january 2010. That's less than 300 kb/d of real increase.
Of course, there have been declines elsewhere, onshore, shallow water, and first generation deepwater fields (eg, Albacora) but that can't explain the whole million barrels which is missing.
so i guess many of the projects are producing much less than expected!
Nameplate capacity gives only so much information.
I think i'll do a whole article on brazil.
Thunder Horse performance is not an exception. Draw the profile for other deep water fields in the GoM and elsewhere, you will see that most of these fields do not achieve nameplate capacity and decline very fast. This is due to financial engineering not petroleum engineering per se. The target is maximum and early cash flow not maximum production from the reservoir. Short term financial markets mean short term production management. So recovery factors will be lower than one might expect, field life shorter and early returns on capital employed are maximised. Oil companies drill for most money and shareholder value not for most oil. That's partly why we don't have enough crude oil these days. Petrobras has better recovery factors, longer field life and slower decline rates than in the GoM. That's man not nature.