| Renewables to the rescue? | The Oil Drum | BP's Deepwater Oil Spill - An Update on Collection, Evaluating The President's Speech and Open Thread |
The Piggy Driver: Some Empirical Data to Test the Piggy Principle
Posted by Gail the Actuary on June 16, 2010 - 10:40am
This is a guest post by Marco Bertoli. Mr. Bertoli has an economics degree from Bocconi University in Milano and a master's degree in "social and economic disciplines" from the Milano Politechnical University.
At the end of February, The Oil Drum published an article I wrote called Efficiency and Resilience: After Jevons Paradox, the Piggy Principle. Its content was a strictly theoretical discussion of energy efficiency and its impact on the consumption and resilience of societies.

However, the time has come for us to verify that what was predicted by the model in fact happens in the real world. It might be interesting to understand if the conclusions drawn in the article were wrong or are at least somewhat close to reality.
Overview
Here is a brief summary of the basic thesis contained in the article, which we are going to double-check by using some data: according to the Consumer Choice Theory and the Piggy Principle – both concepts being considered as basics in any course of economics, but curiously passed by – it is not energy efficiency in consumer goods, but the price of energy and individual income that determine energy consumption per capita.
Efficiency, however, plays an important role in increasing the level of societies resilience.
Total energy consumption is the product of the consumption per capita and the number of consumers: we cannot help but consider the demographic variable when studying these phenomena – which is systematically ignored by official sources.
It can all be summarized in the following graph:

As a test, it is useful to examine the key variables for private mobility in the United States, for the period post World War II to date. These key variables are gasoline consumption and prices, mileage, car efficiency, and income.
For these variables, it is possible to easily obtain long-time series of data from official sources that are suitable for the scope of this analysis. The spread of these series also lets us observe the ‘big picture’ without drawing false conclusions due to the slenderness of the observed sample.
However, we should keep in mind that the example of private cars in the U.S. is only one of countless examples of energy consumption: we are not referring to universal laws applicable to every type of energy (heating, electricity consumption of appliances, etc.), at differing times and locations. On the contrary, if readers are aware of counter-examples, please post them.
Review of Test Data
So let's go through data in detail.
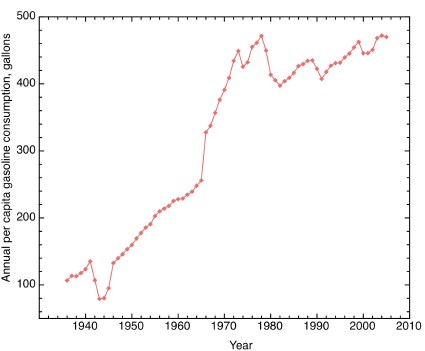
When considering data regarding gasoline consumption per capita since the early 1930s (Source: Federal High Way Administration FHWA, thanks to Metacaffeination) and comparing them with historical series of average real hourly wages from 1947 (Source: Bureau of Labor Statistics, BLS. The series ID is CES0500000032), we have the following result:
As you can see, the correlation is really impressive.
Leaving aside our astonishment after seeing so clearly that real wages – therefore the purchasing power of workers - have been stagnant for over 40 years, we should first clear up some doubts that may arise when looking at this correlation.
First, someone may ask what happened to the price of gasoline. We should not forget that this is included in real wages, which correspond to the ratio between nominal earnings and the Consumer Prices Index. In turn, the latter is a value proportional to the cost for the basket of consumer goods selected by the BLS. And it is well known that gasoline and its price are included in this index and directly influence it.
A second question could be why there is such a strong relation with wages, whereas that disappears when considering the real gross national income per capita.
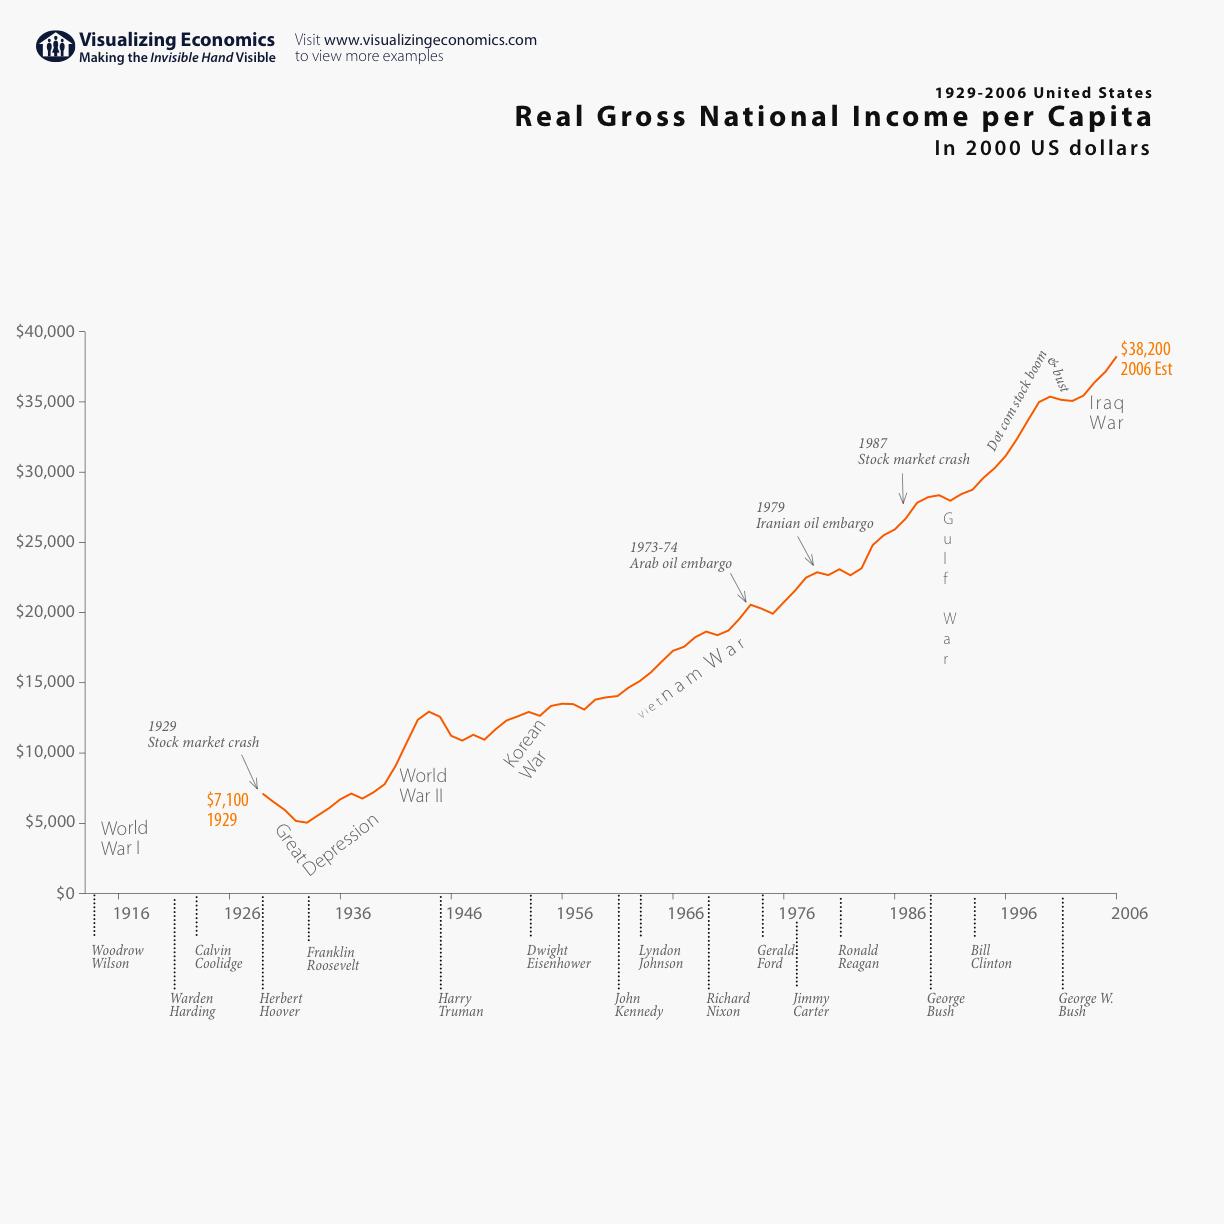
Gross National Income per capita is closely related to GDP; it is the sum of all gross incomes in an economy: wages, dividends, interest, rents and capital gains. As we know, in a society where residence, work, shopping and meeting places are very far away from each other, where public transportation is weak and private mobility is based on the car paradigm, gasoline becomes a basic necessity. As a basic necessity, gas is purchased each year by nearly every family, but for the overwhelming majority of them, the main source of income is wages, (although for the richest the capital gains from investments is to be deducted).
Moreover, the percentage of income spent on the purchase of gasoline and other basic necessity decreases as per capita income increases--in other words, the poor spend a greater proportion of their income on gasoline than the rich. For the poorest groups of population, wages are also the main source of personal income, together with government transfers.
So, to simplify, when the purchasing power of wages varies, the change is largely directed to consumption of basic goods. Similarly, the variability of dividends, rents, etc. can be thought of as determining the change in the consumption of ‘luxury’ goods.
A last criticism to be prevented is the use of ‘gross’ variables. We should remember that consumption depends on personal income, which is equal to net income plus government transfers (pensions, unemployment aids, tax reliefs, transfers to publicly owned enterprises providing services of first necessity like water, healthcare, etc.). In the case of low incomes, and thus of low wages, transfers offset taxes with a redistribution effect. Therefore, gross wages are a good approximation - underestimated - of personal incomes of both the workers and the poor.
So, in this context, which is the role of cars' efficiency?
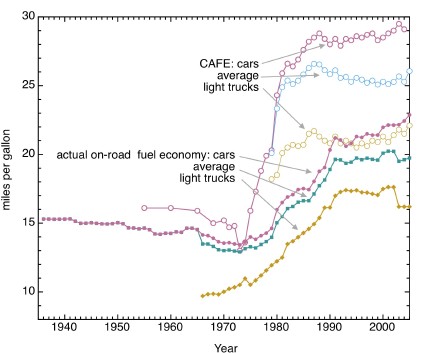
As you can see in the chart as below, the average efficiency of cars in use in the U.S. was constant from the 1930s through the 1970s, rising rapidly till the 1990s (Source: FHWA, thanks to Metacaffeination). It is then clear the correlation with the oil shock and the regained abundance due to the resumption in Russian production in the 1990s. And not incidentally, after the 2008 oil shock, the debate on engine efficiency was back in the news.
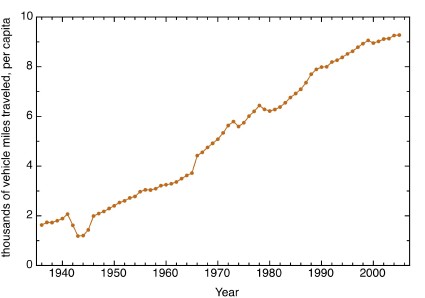
Now, if we approximate the individual utility with miles traveled per capita (see chart below), it can be easily shown that, in this case, the Piggy Principle really prevents improvements in efficiency from reducing gasoline consumption per capita.
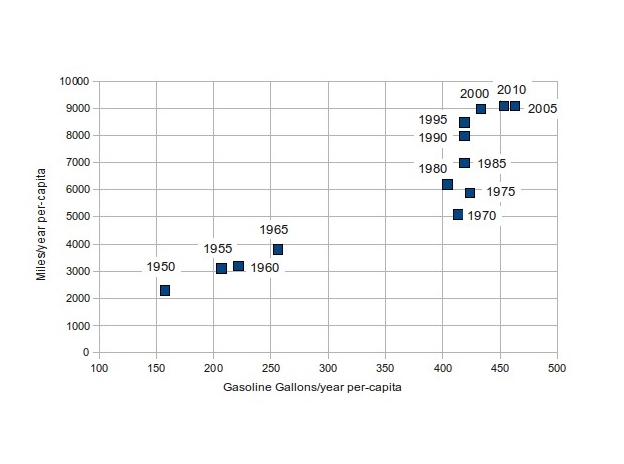
So, if we build a dispersion graph with miles traveled per capita (on the y-axis) and gasoline consumption per capita (on the x-axis), we can get a good approximation of the first chart that correlates consumption per capita and Utility:
Analysis of Results
Going back to the figures, we can identify two different periods in which the variables behave in a uniform way.
First Period: Post-WWII to 1970. Skyrocketing real wages and unchanged efficiency.
During this period, the growth in miles per capita and in gasoline consumption is caused solely by the peak of purchasing power of wages. Efficiency itself has no role in those years, remaining unchanged or even slightly decreasing.
Second Period: from 1970 to the 2000s. Stagnant wages and quickly increasing efficiency.
In these years, wages remained flat for 40 years, causing gasoline consumption per capita to stop rising. Efficiency improvements led to the growth of miles traveled per capita (Utility) that, in accordance with the Piggy Principle, consumers prefer to the reduction of fuel consumption for unchanged mileage.
We can add some controversy to this simple analysis. These data show that for the majority of people, the steady-state economy is a 40 year-old reality. In fact, as long as wages remained unchanged, utility improvements were reached only through efficiency improvements. . .
I guess there is no need for me to go any further in producing here data on productivity (real GDP / employee), which has always been closely tied to the growth of wages.
To conclude the analysis, let’s move from the consumption per capita to total consumption, which is the key variable for both the oil peak and global warming:
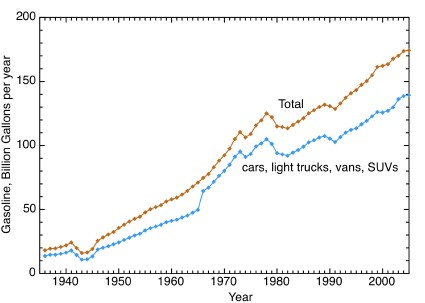
As we see from the chart, for private cars, the total consumption of gasoline is growing.
If consumption per capita has remained constant since 1970, this effect can only be due to the rise in the number of drivers. Obviously this can be ascribed to demographic dynamics only.
Continuing with the controversy, how many times did you find the word ‘demography’ in the ‘proposed policies’ paragraphs of the IEA or EU reports?
Finally, let’s check if it is true that efficiency has an important role in the improvement of resilience of societies.
To do this, we should look for an indicator for the ‘hit’ striking societies with the rise of gasoline prices and check whether the effects are reduced by efficiency. As we said earlier, wages – and therefore the majority of the population - are severely affected by the rise in the price of goods that are necessities. In fact, in these cases, the rich may draw down savings or cut back on luxuries, but the poor have to cut down on other important goods and on gasoline itself. That being said, the ratio between the nominal price of gasoline (source: EIA) and nominal gross hourly earnings (Source: BLS, Historical B-2) represents the time that has to be worked in order to buy a gallon of gasoline. It can be considered to be a good representation of the ‘hit’ suffered by the society.
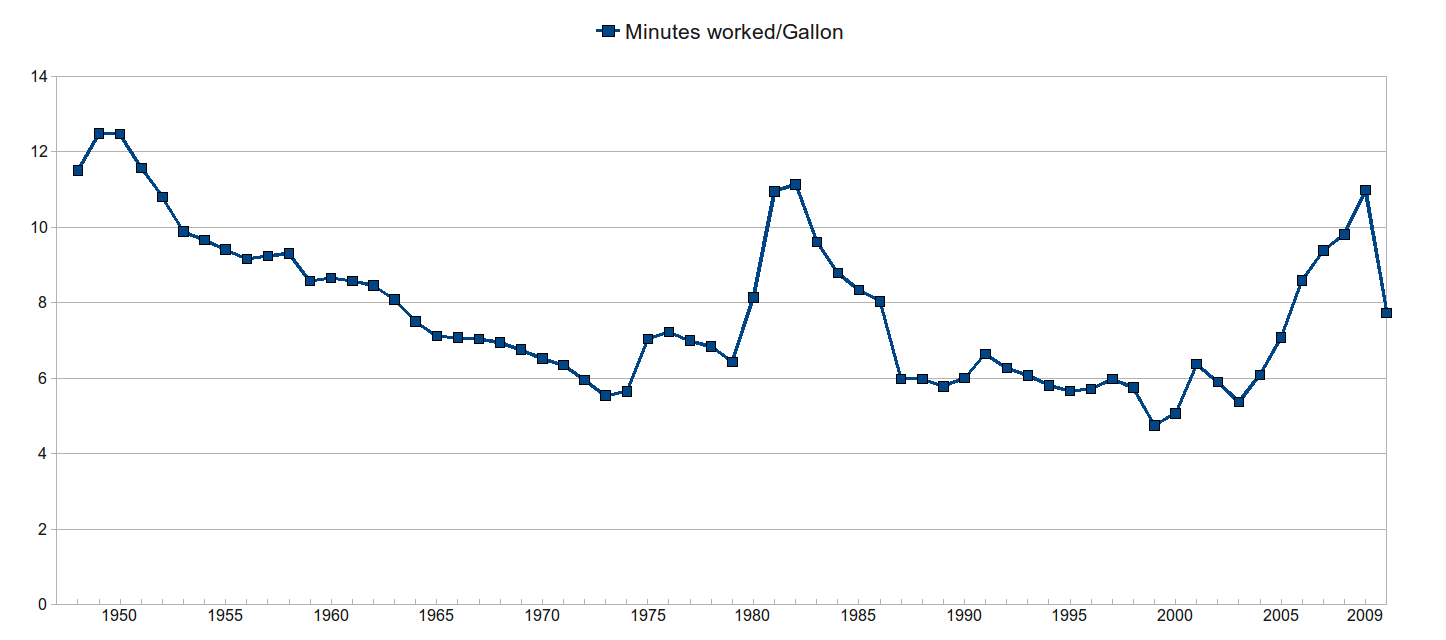
During the oil shocks of 1979 and 2008, to buy a gallon of gasoline workers had to work for 11 minutes, about twice the time needed when gasoline was at its lowest price.
The social effects cannot be quantified unequivocally, but we cannot forget that in 2008, unlike 1979, there were no queues at gas stations and there was no rationing and so on. Above all, this was largely due to the fact that, facing a peak in prices, drivers were able to cut the unnecessary consumption of gasoline (for leisure trips, etc.), which would have never been reached with the 1979 engine efficiencies. Compared with 1979, in 2008 efficiencies increased by 33%.
In conclusion, the theoretical idea has a good match with long-term statistics.
So, at least for this example, the poor practice of some economists - avoiding any comparison with real data and relying on abundant and evanescent speculation - was not followed. And this poor practice is coming from a long-time, noble and glorious tradition – still in very good health, though – which was condemned by Sir William Petty for the very first time: it was in 1676.
Contact
- Content: editors at theoildrum dot com
- Tech support: support at theoildrum dot com
License

This work is licensed under a Creative Commons Attribution-Share Alike 3.0 United States License.
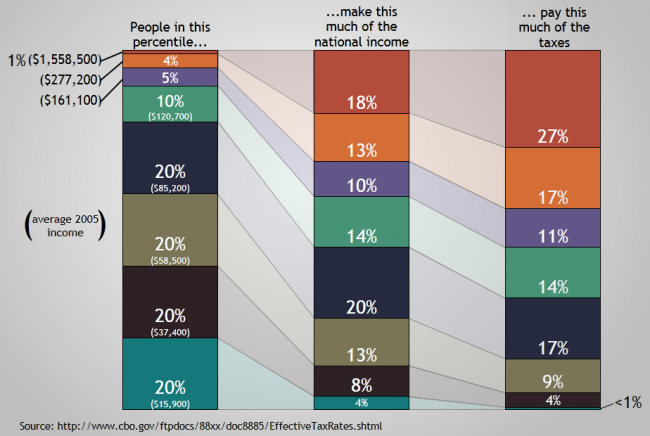
I liked the "visuallizing economics" chart: So the top five percent get more (31%) of the national income than the entire bottom 60% (25%)!
But on average income, it was ten thousand in the fifties when estimates of happiness were higher than in later decades.
To the extent that I followed it, it seems the article is saying that there is lots of room for rapid conservation of oil without imposing much suffering, because of the resiliency provided by efficiency.
Is that it, or am I missing something?
Hi dohboi,
I am with you at being pixxed at the rich getting so large a share of the national income but except for the ones who commute by personal jet I seriously doubt they consume energy , food , or any other resource in proportion to thier wealth.
A man can eat and drink only so much, and if he has a forty room house it is likely that there are a few live on or live in menials, thus lowering the per person footprint of the house considerably.
The top one percent or two percent of the wealthy spend thier money in terms of investing it more so than consumption so far as I can see.In any event the consumption may be mostly in the form of labor and personal services more than physical resources, so it may not be as harmful as it would appear at first glance.
Even though I am poor in monetary terms by American standards I enjoy a few very modest luxuries such as hiring a local girl to clean the house for four hours a week;she REALLY needs the money and I am glad to give up something else, such as a meal out or a movie , for this service.
Or I simply work the four extra hours at something I enjoy more than housecleaning and hope I earn enough to pay her-on average I succeed and end up with a modest surplus-there's VERY LITTLE money in being a semiretired small farmer.
My point(got to it eventually!) is that maybe we need more control of what investments are legally available as almost much as we need income redistrubution......wealth could be redirected to working class people by implementing the right policies.
I think any serious discussion of efficiency has to be prefaced just about every sentence with the time frame intended for the discussion to make sense.
Over a few years or decades time I am perfectly willing to believe that Jevons paradox holds true but I don't think it means diddly in the short term;and we are faced with short term problems right now of such a nature that if we do not solve them fast, we don't have to worry much about the longer term.
A tough fuel economy law implemented in the form of a steep and highly progressive tax tax on low mileage new vehicles could work wonders in the short term on the energy front.A gradually increasing fuel tax would also be quite effective-I suggest that it should be perhaps a quarter per gallon initially and that it be increased by about that amount each year.We could live with such a steady increase without it disrupting the economy too much, if the cost is offset by legally mandated increases in the standard income tax deduction and or social security benefit to protect poor people.
If cars are built to use a lot less gas the public will undoubtedly drive more, but it seems certain that the miles driven total could not go up as fast as mileage per gallon;most people are too busy to do a whole lot more driving than they are doing already.
It might take Mr Jevons several years to catch up -we could use the grace period to good effect.
I might take one or two more short trips a year if gasoline were a lot cheaper but meals on the road and hotel bills cost a lot more than gas unless you are driving a real gas hog.I have never bought into the argument that the price of gas is DIRECTLY responsible for keeping people home.
We can get to town and back in the seldom driven family Buick for five bucks.Two combo meals at any fast food joint with tax cost twelve bucks or more.Except for the public library, there is nothing there that costs less than fast food.
Hi Mac.
I disagree.
I live in an area of Toronto that is undergoing gentrification. What would be a solidly middle-class income anywhere else in Canada puts us at the lower end (30th percentile, roughly) in our neighborhood. So combine my attempts to conserve and curb consumption with being slightly cash-poor from buying a house late in life, and you see the real differences in consumption...11-year-olds note what their friends have and where they are in the pecking order. I am told that "everyone" goes to the cottage on the weekend, that "everyone" goes to the Caribbean on Spring Break, that "some" of the kids go to Europe in the summer...
While it is true that the boy exaggerates, I can tell you how the upper-middle class and the lower-upper class can use that oil in ways the poor can barely fathom:
A. Only big cars (or fast cars.) Halve the mileage of a Prius or Yaris by buying an Escalade.
B. Buy another one. (No need to have to decide i)who gets to drive or ii)who gets the big car.
C. Now buy another one. (a "fun" car, just for driving to restaurants or show and shines.)
D. Now buy another one. (A rally or slalom car, or maybe a road racer.)
E. Now buy a truck. (for towing the horse trailer or boat, or the road racer to the track.)
F. Now buy or rent a motorhome.
G. Now drive 150 miles (one way) to the summer cottage 15 times a year. i)Drive into the closest small town from the cottage for dinner. ii) drive 5 miles to the bait store. iii) drive to the grocery store. iv) don't combine any trips.
H. Now drive 2000 miles to visit your relatives in Winnepeg every year (double the gas used if you use the motorhome.)
I. Both of you commute eighty miles a day. Opposite directions. Separate cars.
J. Drive to a restaurant for dinner every night.
K. Drive to cultural or sports events in the city 2 or 3 times a month.
L. Shop at big box stores 20 miles from home (why would you have a big car if you weren't going to fill it with crap?)
M. Drive the two kids to Cheerleading competitions or hockey tournaments every weekend during the school year.
N. Drive to the chalet by the ski resort (where you are a member) 15 times a year, 100 miles one way. (Usually not even in the same direction as the summer cottage.) Have to work this around hockey games and practices; sometimes you have to take both cars.
O. The kids just turned 16. (They're twins!) Each gets one of the old Escalades (you want a lot of metal around them when they plough into things, don't you?) You buy 2 new ones.
Rinse and repeat until there is no oil.
Lloyd
PS. And you're right about the really rich: the chalet is in Gstaad and the cottage is in Bermuda. Planes and choppers, baby. Plus all the cars mentioned above.
Canuck,
I DO GET your point.
My only quibble is that these people you speak of are probably only living as if they were rich and head over heels in debt.
I know a couple of fairly rich people and they do have very nice cars but they got over wanting to LIVE IN thier cars a long time ago.They go to thier cabins and beach houses but they stay a week or two once they are there.
And I personally know of dozen or so families who are most emphatically not rich who for some reason do seem to be compelled to spend twenty hours per week behind the wheel, living the lifestyle you describe but on a much more modest scale..they are all head over heels in debt for sure as I know what they do for a living and what it pays.
Hi Mac.
I'm sure that some of the people in question are in over their heads. But they're still consuming that oil.
That said, Toronto is home to a massive population of rich people: brokers, bankers, Captains of Industry.
They may have a mortgage, but it's in the seven figures. And they pay it.
It's good to be a Porsche dealer in Toronto, or a Realtor in Muskoka. (I'm sure the same thing holds true in New York and the Hamptons.)
The working wealthy do indeed follow this weekend commute; my in-laws don't understand why I wouldn't want to spend 4 hours on the 401 every weekend to join them (the east-bound traffic jam sometimes goes until 10pm.) They've owned their cottage for 35 years; they're in their 80's.
Lloyd
It feels good to diss the rich, but unless you were strolling earlier today with a water jug on your head to a well a mile from your village, you are also one of the rich. Even ordinary people in industrialized countries live like kings compared to people in the third world, and use vast amounts of energy that any third world citizen would judge as utter wastage. So before you vilify members of your own culture that you envy to excess, you might consider how you look to the rest of the world. Ultimately, if there is a shortage of energy, all will cut back. Such a cut will always fall heaviest on the poorest of our planet. Those writing here are not among them. A better strategy might be to enlist the wealthy in the transition.
It could be intersting to take different poeple from history and their wealth and power and compare them to a "poor" person in western culture for different metrics. I'm sure there would be some surprises.
Hi Richard, you can start that search from this site:
http://www.gapminder.org
http://www.gapminder.org/downloads/income-distribution-2003/
Hi vertigo.
I do not envy them. In many ways I am them (or could allow myself to be them.) You have misinterpreted guilt as envy. I have access to the toys and the perks of my culture. In many ways, trying to change has cost me in my career and personal relationships. Nothing would improve my relationship with my mother-in-law more than buying an SUV and driving to the cottage every weekend; I am sure that the element of nose-holding involved in doing jobs for big banks and GM wasn't entirely unnoticed.
Living in Toronto allows me to see the range of income disparity in our system- my range of acquaintances range from bankers and venture capitalists to shipping clerks and the unemployed. I see close-up a culture of waste and over-consumption. Indeed, it limits me in my efforts to conserve, not only in the lack of, say, a one litre Yaris in North America, but in a culture that would see the lack of a car as a rebuke, and make me even more of an outsider.
I have driven small cars for almost 30 years, usually vehicles in the top rank in fuel efficiency, and smaller than my income would have allowed. I have traveled less and tried to consume less. Consumption is driven by conformity. We are limited in what we can become by where we are born and to whom; we survive best in our natural habitat. I know that I am privileged; I also know that people give up status unwillingly, even when they know that the trappings of that status are harmful to them.
As far as trying to enlist the wealthy, well, we didn't go out on my pal's 38' sailboat last night because of high winds and an inexperienced crew (this is part of my post-collapse planning: I see a strong future in piracy. Unfortunately, we went to a movie rather than have cutlass practice.) We've had talks about peak oil, he's recently admitted that he sees collapse as likely, but that he just doesn't see how he can change with the stressful job, high maintenance wife, etc.
I don't know anyone who does everything on that list, but it's not a gross exaggeration (in the city, parking all those cars would be a problem; my dad's neighborhood in Mississauga would probably yield a few hitting 75% on the list.) To deny that the emperor has no clothes would not help change the problem (though my wife has specifically warned me not to discuss the topic with her relatives.) Just because I know my hands are dirty doesn't mean I shouldn't point out that we are sitting on a pile of s#!t, and that licking one's fingers would be inadvisable.
My original point was that the rich consume energy far out of proportion to their numbers. I stand by that. I see it every day. They will not consume proportionally less without rationing. Which I am in favour of.
Lloyd
Hi Mac,
you're right, you can find data on consumption by quintile in this article that I also linked to in the post
http://www.econbrowser.com/archives/2008/07/why_a_lot_of_pe.html
Just scroll the text to the middle of the article
That should be the point! Just take a look to my previous post. By the end I analyze a carbon tax proposal from the Dutch Government as the one you mention
http://www.theoildrum.com/node/6245
The income inequality is real and always has been. It's called the Pareto Law.
It comes about from having a variation on earning rate and parallels precisely in how we only find a few super-giant oil reservoirs and many more medium ones. And the super-giants contain a significant fraction of the world's reserves, just like the rich hold onto a significant fraction of the world's wealth. Entropy of dispersion causes this and there is nothing we can do about it unless we add energy to the system to counteract the disorder.
I should add that some of the tail effects likely do come from compound savings by the rich
http://mobjectivist.blogspot.com/2010/03/econophysics-and-sunk-costs.html
Speaking as a statistical illiterate, it seems to me that a huge part of the wealth of the rich is easily explained by the fact that once started on the path to riches they have a ready surplus available for investments-long term investments that build not only accumulated wealth but also earning power -they can invest in themselves and thier children.
Maybe the Pareto law works mostly at the level of getting STARTED towards being rich.
There are a heck of a lot of rich people.It seems to me from casual observation that most of them got that way from making good investments rather than by means of a salary.
Yeah, Mac. They ultimatly invest in people who use energy to create a return on the investor's investment. Energy consumed to create wealth, by proxy.
If I realize a million dollar return from my invesments this year, how many BTUs would that return represent that will never be attributed to me? All of that wealth, whether held by the upper 5% or the bottom 60%, represents energy consumed.
While no doubt a small % got that way as a result of shrewd investing, I bet a whole lot more got there by inheritance, insider trading, securities and tax fraud, running Ponzi schemes, bribery, collusion and corruption, and when all else failed... the old fashioned way: stealing it. And once you're there of course, our rigged legal system makes it all but impossible *not* to stay on top.
In other words, entropy. Every conceivable way to make money fills up the state space of possible income pathways. By filling this state space up, nature always tries to maximize entropy. And thats why these Pareto laws exists: there are so many ways to get rich fast and lots more to make money slowly.
Harm,
I am somewhat cynical myself but I think you take it a little too far in respect to cheating and so forth if you mean the sort of cheating that can be prosecuted.Certainly there is PLENTY of that but probably not so much as you seem to think.If you mean the kind of cheating that is morally wrong but legally defensible I must agree that you have a great point.
But when I said investing I also said investing in themselves-as in building up businesses and professional practices.Although I know only a couple few people who are "rich" by current American standards, and know them only slightly due to accidentally becoming acquainted with them, I know a good bunch of millionaires, and several of them are millionaires several times over.
A lot of them had serious help getting started up the ladder to riches to be sure, but most of them got thier million thru hard work and good luck.
One is worth five million due to a life time of investing in the stock of his employer, a couple are lawyers who habitually put a few thousand a year in to the stock market, a few are farmers who bought land at a few hundred dollars - land that is is now worth many thousands of dollars per acre.
One is a an old maid cousin who taught school and bought land for four decades and rented it out while still living fairly well out of her salary.
Most of them got thier million by running some sort of successful business-an uncle built up a small paving company starting out with a single dump truck.
Another man I know owns a garage where four mechanics stay very busy-he probably nets close to two hundred grand in a good year.
My personal physician is rich even though he charges less than half what most doctors charge simply because he works out of an office in his home and drives a Chevrolet and saves most of his money.
I know four or five people who have gotten moderately rich over the last twenty five years by buying up old houses and fixing them up with thier own hands and renting them out.Thier rents are now double or triple thier payments after ten or fifteen years due to explosive growth in thier communities.
I myself have earned enough to have gotten rich-up to two thousand a week in the early eighties as a nuclear maintainence worker-- if I had stayed after it rather than working intermittently and taking it easy for months on end.
I could easily have invested at least half of that , and would almost certainly have put it into land had I chosen to do so -land that is up by a factor of fifty to a hundred today, AFTER the recent crash.I could have either farmed it myself or rented it at rates adequate to cover the taxes.
OFM,
While your anecdotes about old fashioned "bootstrap" successes are touching or even reassuring, they are in no way representative of the norm in America today. In fact, it's somewhat telling that your examples are invariable older people, who presumably acquired their wealth or built their businesses in the mid-20th century, the time of greatest economic progress and expansion of the middle class in this nation's history. Silent Gens and Boomers often forget they were born at the apex of social progess and America's prosperity and power, not to mention ideal demographics (many workers per retiree), ideal cost structures (cheap land, medicine and education), an accident of history that is not likely to be repeated anytime soon.
Social and economic mobility today is by every measure at record lows, while economic inequality is as high or higher than it has been since the Gilded Age. http://sociology.ucsc.edu/whorulesamerica/power/wealth.html
In terms of types of financial wealth, the top one percent of households have 38.3% of all privately held stock, 60.6% of financial securities, and 62.4% of business equity. The top 10% have 80% to 90% of stocks, bonds, trust funds, and business equity, and over 75% of non-home real estate. Since financial wealth is what counts as far as the control of income-producing assets, we can say that just 10% of the people own the United States of America.
Your anecdotes, while reassuring, do not bear out the cold reality of the origins of most wealth in this country.
http://www.faireconomy.org/press_room/1997/born_on_third_base_sources_of...
according to Born on Third Base: The Sources of Wealth of the 1997 Forbes 400. Half of those 400 individuals and 100 families listed started their business lives with at least $50 million in family wealth or by inheriting a large company. This is what most people might call a "head start.
...42 percent of those listed were born crossing home plate, inheriting their way onto the Forbes list. They include familiar names like Rockefeller, Getty, Bass, and du Pont ó as well as descendants from founders of the next generation of retail fortunes like Wal-Mart and The Gap."
I might also point out the obvious futility of assuming that everyone *can* become rich, regardless of how hard one works or how talented one is. We can't all be rich by definition. Personally, instead of the rest of us proles slugging it out with each other for the rare golden Wonka Ticket of extreme wealth, I'd rather that everyone was comfortable, well housed/clothed, had health insurance, inexpensive or subsidized higher education, and paid vacation. But I guess that makes me a Communist... or European.
Harm,
You make excellent and compelling arguments concerning the CONCENTRATION of wealth and I am solidly in agreement with you in respect to the ill effects this concentration has on our culture and our economy.
I have a hard time getting this very point across to my more hard core conservative acquaintances until I point out to them that given the fact that the super rich never need to spend more than an extremely minute percentage of thier wealth, they will eventually - if the SCUMBAG SOCIALIST DEMOCRATS [ ;-)] don't do something to prevent it-and before very long!- be in the position of fuedal lords and the ALL THE REST OF US, like it or not, will be serfs or if we are lucky, vassals.This brings them up cold-the ones of them with brains that is.
I agree that the super rich are very much fuedal lords in most respects already, but for the moment, while they have enormous control over the rest of us as a group , they still have very little control over us as individuals, so most people do not realize just what the true economic score really is.
But the number of super wealthy people is only a small fraction of the number of wealthy people, and depending on how much you have to have to be considered wealthy,there are many MILLIONS of wealthy people as compared to a few thousand super wealthy.
You are correct that it was probably much easier to become well off during the latter half of the last century than it is now.
But the opportunity to get at least moderately rich is still readily available for any young person with some brains, some ambition, and a little luck.I know quite a few young people who are on the road to being well off and barring a general collapse of the economy, which I believe is a very real possibility, most of them will make it.
The formula is simple as falling off a log.You get a job and no matter what you live modestly and invest a serious portion of your earnings every year in getting ahead rather than LOOKING as if your are prosperous.You put the money in something under your direct control, such as a plumbing business, or a farm within fifteen or twenty miles of a growing city,and you learn to get your ego cookies by looking at your balance sheet rather than showing off your new car.
Having your money under your own control means all the expenses paid out by simple "investors" to brokers, lawyers , managers, bookkeepers, accountants, and hangers on mostly stays with you.It means fixing a small problem yourself while an "investor" gets three estimates from contractors.
Not a single one of my actual friends who has gotten to be well off has done so through earning a big salary, although I am acquainted with a few people who earn rather large salaries.
They got to be well off by driving second hand Fords until the fenders fell off, eating beans and hamburger at home, changing thier own motor oil, and pursueing self financing hobbies and recreation.
There is absolutely no reason this formula will not work for any young person today with as I said, a few brains and a little luck, barring a general collapse of the economy.
The laws of compound arithmetic have not been repealed.
But getting rich by simply going to work at the auto plant is a thing of the past for sure.
The reason most hardworking people , on an individual basis, never get to be well off, is that they are altogether too focused on consumption at the expense of accumulation, and therefore the compound math is working AGAINST them rather than FOR them.
Of course under current conditions the ground rules are changing for the worse and I don't see a bright future for the younger generation AS A GROUP.
You are absolutely correct that everybody cannot be rich-it's impossible, but everybody could be reasonably well off, in a fair society, except for one troublesome fact.
There are a lot of people who don't really care about being well off. So long as they don't have to work very hard or very much, they are more than satisfied to take things as easy as possible and live for the moment, even if the moment means playing penny poker with nieghbors and having hot dogs wih beans for supper and cheap beer or pot for the social lubricant.
I know quite a few people who live this way including some relatives, and I pass no moral judgement on them as a practical matter.It's thier life, and what they do with it is thier business,although I fear for thier future.
As far as thier gaming te system andcollocting a few pissant sized subsidies is concerned, they will quite rightly tell you that they are only doing what the rest of society is doing-gaming the system.As a conservative with at least some brains,
I must agree with them that if it is morally ok for the owner of a local furniture factory who is already worth over twenty five million to collect four million in so called incentives this year alone,it is morally ok for them to collect free school lunches, food stamps, unemployment checks, and so forth.
As to the unemployment checks:you get a job, build up your benefit period, quit, get a temporary job that will last over six weeks, get laid off, collect until benefits run out, do it again;this can be done three or four times in a decade, and sometimes more often.
Or you just don't marry your true love and raise so called "love children"while the man lives in in actuality but lives with his brother on paper.In a depressed area, the benefits can easily approach or even exceed the after tax after commute take home of a poorly paid woman with no particular skills and she can always earn a few bucks on the side, not to mention saving a lot of bucks because she has ample time available to cook from scratch, mend clothes, garden, and so forth.
Around here such women paint thier own houses,mow thier own and nieghbors lawns, sell a little produce for cash to roadside marketers,babysit occasionally,do a little flea marketing,sell a homemade quilt once in a while,hire out as cash workers to local farmers during peak load periods , and so forth.
All liberal types please remember that I am simply describing reality, and I AM NOT CONDEMNING THESE PEOPLE as parasites. ;-)
I actually admire them as examples of successful adapters to the the reality they face on a day to day basis.
(To me being a conservative mostly means facing up squarely to evidence based reality and doing your own thinking.)
OFM,
Thanks for expanding upon your previous post. I am in 100% agreement of your "fiscally conservative" policy of living within your means, saving for a rainy day, not getting caught up in futile patterns of conspicuous consumption, and not tying your self worth/imagte to a paycheck. I'm right there with you, buddy, and try to live what I preach (wife & I have 14 & 12-year-old long paid off cars, would like to reduce it to 1, max out our IRAs/401k + save substantial % income, rent close to work vs. buy, avoid eating out, etc.)
I agree that we must all adapt to our environment, including whatever challenges that may present, and not dwell too much on macro things we cannot change (at least in the short run). I also acknowledge that there are plenty of poor people who "game the system" and avoid honest work (a few examples in my own family), though I think this meme is way overblown on the right vs. the scale of "gaming" being done by the top 2%.
I agree with every single word of your comment, one by one... expecially the last one :P
there's a huge empirical evidence indicating that when gdp-per capita reaches 10.000$/year, happiness and well being are not anymore linked to goods and services
I suggest you to look to this video
http://www.youtube.com/watch?v=_hd84ug3T6o
The real challenge is getting a global income distribution very concentrated over that value.
By now, the distribution (in logarithmic scale) is this:
http://www.gapminder.org/downloads/income-distribution-2003/
The ways to reach that distribution preserving the environment (350 ppm) is a great intellectual challenge
Hi Web
mmh... I disagree with that: oil reservoir size is likely to distribute as a Gaussian variable: it's a natural phenomenon.
Hence you'll find a lot of field around the mean and very few fields on the extremities, median, mean and mode being the same.
Income and many other social variables distribute according to Pareto's function.
Hence you'll find a distribution skewed on the low levels: many on the low, very few on the top, with mean being higher than median that's higher than mode.
That's why Mean data, on social variables can be misleading.
Just take a look to the very first graph in page 17 from the article linked in the article you posted: that is the family income distribution in the US.
It is actually the furthest thing away from being a normal Gaussian variable that you can imagine. It is heavily fat-tail.
Here is the acid test. Normal Gaussian variates do not have values that stretch from 0.01 to 10,000+ Million Barrels
USA Data:
http://www.energybulletin.net/node/51768
That is a log range, and logNormals don't even handle it.
Let's go through definitions:
the statistical variable I intend to be a Gaussian is "field size, misured in MB": very few tiny and giant fields, observations well concentrated around the mean value.
You are referrig to a different statistical variable, wich is a transformation of "field size, in MB": "sum of oil in fields measuring x MB", wich can't be a Gaussian!
No I am not confusing that with a cumulative. Here is data for the Gulf of Mexico measuring field size, measure in millions of barrels. Look at the x-axis and it needs to be plotted in powers of 2 simply because a Gaussian doesn't work
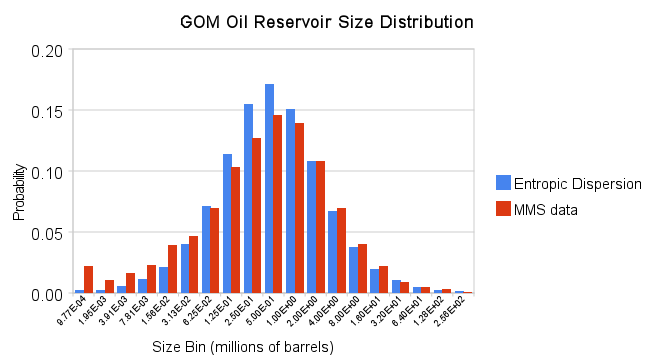
I have studied this behavior quite a bit and the non-gaussian nature of oil field sizes gives us the bulk of the world's oil.
Hi dohbol,
I can't tell if there's lot of room for rapid conservation.
Surely, if oil/gas prices go up because of carbon-taxes or oil shortages, low income people would be hit the hardest.
Thus redistribution policies would be needed: eg, incentives on higher efficiency cars (as the one proposed by the Dutch Government http://www.theoildrum.com/node/6245), lowering taxes on wages, abolishing regressive taxations, and so on.
Within the next five to ten years I expect to see gasoline rationing in the U.S. as westexas's Export Land Model (ELM) starts to bite a few years after oil production descends from the plateau it has been on from 2005 until now.
I hope not - the experience with rationing during the 70's oil shocks was very bad.
Much better to establish a fuel tax, and use the proceeds to provide a tax break for the poor. Heck, a steep fuel tax could pay for a negative income tax. Now, I don't have high expectations for a fuel tax, but maybe we can avoid lines at the fuel pumps.
As for ELM, don't forget the ILM - the Import Land Model. US production is growing, both on-shore and off-shore, and I suspect the US will be able to maintain at least flat production even with off-shore drilling limits. There's no reason the US can't reduce oil imports greatly by going to rail for freight, raising CAFE sharply, eliminating heating oil and oil for generation, etc, etc.
I think future gasoline rationing will be like that during World War II, except that people will be issued cards that work like credit cards to get gas at the pump. Rationing could be an extremely popular alternative to much higher gasoline prices; it means that the rich and the poor can get equal amounts of gasoline per month. Extremely high gasoline hit low-income families much harder than would be a ration of, say, ten gallons per week. During World War II the gasoline ration was three gallons per week, unless you were a farmer, doctor, or minister, and maybe one or two other categories. The national speed limit was lowered to 35 m.p.h., and the limit was enforced.
I can still remember gasoline and kerosine rationing during and right after World War II. I also remember coupons for food rations, and the limited amounts of meat, butter, sugar and some other foods during World War II. Clothing was also subject to coupon rationing.
I wasn't around back then, but I'd wager that today's America is a very different country than it was back in the 1940s --and I don't just mean technologically.
I'd say the odds of getting today's Fox News/Rush Limbaugh/700 Club-listening "adults" to accept WWII-style rationing is about equal to that of the creamy nougat abiotic oil earth-core theory being right. Right-wing pundits regularly attack the very notion of a "public good" or "social & economic justice" as being some kind of Communist conspiracy being rammed down their Freedom-loving throats.
The first politician to even suggest --much less try to implement-- such a scheme would get about the same warm reception from his constiuents as Benito Mussolini did in 1945.
Pedantic quibble: Mussolini was the quintessential fascist who favored a militaristic corporate-ocracy. The current right wing(nuts) in the US would have loved him dearly.
Mussolini was given his parting gift (death by impromptu firing squad ) by the people of Italy who suffered years of corruption and war Mussolini and his Fascist Party created.
Benito Mussolini died April 27, 1945, while trying to escape to Switzerland.
I recall that there were gas lines in the 1970s but do not recall that my gasoline was rationed. To what are you referring? The rationing that is proposed here is credits for so many gallons per person. Ideally, credits could be bought and sold. How does that translate into long gas lines? I would think that would have no effect on gas lines.
Having lived through the 1970s gasoline shortages, the main way gasoline was 'rationed' at retail level was by allowing only those with odd or even license plate numbers (on alternative days) to buy gas. In addition, there were some price controls and some controls as to when gasoline stations could be opened. In addition, gasoline was rationed at the wholesale level by the Department of Energy (or similar unit of government), mostly using a state by state system of distributing supplies.
Altogether, there was a lot of rationing. I should add this also included natural gas rationing, which caused many businesses to close on weekends.
The shortages of gasoline and natural gas during the 70's were at least partially due to price controls. As price controls were eliminated shortages became less apparent.
Marco,
Thanks for an interesting post, and a lot of interesting graphs.
One issue I might raise is that there seem to be a lot of different kinds of impacts of gasoline shortages. In 1979, a mild form of rationing was put in place (odd/ even days, limited purchases), and some parts of the country had lines. Instead of impacts being less this time around, I would argue that they might just be different.
A number of people have shown that recessionary economic impacts seem to come from high prices--and these seemed to be worse in the recent round of price hikes than in the earlier round of price hikes. One reason they might be worse is that income distributions have been getting more and more skewed--more people are in the lower income distributions now than in 1979. Another is that the amount of debt has ramped up in the last 30 years, and many of the poor people are living on the "edge", even before the price hikes.
Hi Gail, I defenitely agree with you.
There's an aspect that can't be seen in my graph on minutes worked/gallon and that's deeply rooted in the financial crisis we're stuck into: it's the subprime mortgages reset flood.
http://dshort.com/charts/mortgage-resets.gif
It's amazing how this contemporaneous double hit from oil prices and mortgage resets knocked-down the world economy in summer 2008.
And resets are not over!
http://www.doctorhousingbubble.com/wp-content/uploads/2009/03/feb-2009-o...
The oil price constrains U.S. economic growth via the total cost of the oil import bill. See http://tinyurl.com/27vuu88.
Marco, who do I need to talk to to get the Piggy Bus franchise for South Florida? Man, I think I could sell a bunch of those around here...Especially since the Hummer Franchise has now become defunct.
If I am right in assuming that resilience is the ability of a system to withstand shocks, specifically in this case a decline in the supply of a key resource, then I am not sure that simply improving the efficiency of that resource's consumption improves resilience.
The conclusion I draw from this key post, is that far more of the US's oil consumption is now discretionary, a result of improving overall wealth. In the 1970s the US drove a lot less, and that was because there was less need to drive. Shops, movie theatres, and other centres of consumption could be reached without driving by more people. There were fewer suburbs. However, the low efficiency of cars meant that there was little discretionary driving, and the oil shock caused real shortages.
However, in 2008, there are more people, driving further, and in much larger vehicles, with modestly improved efficiency. When the supply peaked, forcing up prices, people had more options. People who lost their jobs did not need to drive to work. People could stop driving to go the movies. In multi-car families the more efficient vehicle could be used for the longest journeys. People could even afford to buy a small, dramatically more efficient vehicle in some cases, with a government handout. The piggy was much more fat.
That bodes well for the US. In Europe, cars are much more efficient. Even though we have public transport, smaller commutes and more local amenities, I am not sure so much of our consumption is discretionary. High taxes mean we don't burn much more oil than is necessary. We are more efficient but less resilient.
The key to resilience is flexibility and adaptability. My lifestyle would be much more resilient if I were in a 2 car instead of 1 (petrol) car family as now. My ideal combination would be a small diesel / biodiesel electric hybrid for short journeys, and a larger petrol /CNG conversion for larger loads or longer journeys. That would give me a choice of 5 fuels, 2 or them potentially renewable.
Unfortunately nobody makes either of these vehicles at present.
Which is more resilient ?
A citizen who MUST drive everywhere, for everything.
Or one that has a variety of non-oil transportation options (walk, bicycle, tram) ?
I think the answer is self evident !
Alan
The citizen who has means to travel distances is resilient. The one that can't travel is deadly dependent upon local distribution systems. Thus, those who could not leave New Orleans on their own suffered. Those who could and did leave on their own were far better off.
Thanks for helping clear up why transportation is not optional to a secure and free people.
A special case and your "saying" does not hold generally.
A number of tourists that flew down were trapped as well.
I took out 3 people w/o cars in my car and dropped them off in Birmingham.
Alan
PS: City folk in the USA from, say, 1776 to 1950 were not "a secure and free people" per your definition. Good to know !
Did they lack transportation under thier own control? If not, you have no point.
By your invalid, made up point, the vast majority of Urban residents did not have control of their own transportation till 1950 or so, so they were not a "free and independent people".
BS !!
YOU are a slave to your car and the oil companies. And the noose will tighten soon enough.
Just what would happen if you could not drive (car wrecked, no money, major repairs, state could not repair bridge, etc.) ?
People that live where cars are required, die quickly after they lose their drivers license. Stuck alone in their homes, watching TV, waiting on the charity of others (Meals on Wheels, rides to doctors, etc.)
That will not be my fate.
Alan
Oh, and 'security' is all about "dealing with the special case". In other words, you again, had no point.
This reminds me of an old backwoods joke. You don't have to outrun the bear - you only have to outrun the slowest camper.
By this I mean that if you think of peak oil as the bear, then as an individual you don't have to be the most resilient, but you should strive to not be the least resilient. Those that are the least resilient right now are the ones that deny the existence of bears in general, or argue that any bears should be in hibernation and that we can worry about bears at some point in the future - perhaps after we are gone. They might argue that the bear droppings that we see are not from bears but some other harmless animal.
CNG fueled vehicles would be great. Except: The regulatory environment stinks, the distribution system strongly resembles that of the old phone companies of the 50's and 60's, and there are no companies that make small scale compressor systems to operate consumer fueling stations. The one that did, Honda put into bankruptcy, and those who seeking to enter the market are finding it difficult.
CNG would be FAR more workable if there were no monopolies in distribution and if it didn't cost $2000 to convert a vehicle. The other problem, is that it's illegal to convert a vehicle now, if it's new enough to be still common, and the process to certify a single model/engine/drivetrain/year costs a fortune, which would raise the price to more like $4000 - 5000.
Just thank the EPA for making alternative fuels all but impossible.
-That bodes well for the US. In Europe, cars are much more efficient. Even though we have public transport, smaller commutes and more local amenities, I am not sure so much of our consumption is discretionary. High taxes mean we don't burn much more oil than is necessary. We are more efficient but less resilient.-
Driving 5 miles to work instead of using a bike (the average commute in England or so i'm told) is a luxury in most cases. There is a lot of room for contraction still and the smaller commutes will make it possible in a lot of cases. Americans are in a far, far worse position.
Fascinating graphics -- Kevin Phillips has been talking about this for years, but that graph of income distribution is the clearest I have ever seen.
My question -- is this strictly a human arrangement? What percentage of available sunlight and water is taken up by the dominant species in a mature forest, for example? Seems to me that a regenerating clear-cut is pretty "democratic" -- lots of species get a chance -- but by the time 300 years has passed, the Douglas Fir is the plutocrat and sucks up almost everything. There is a rich life in the forest, but they all exist in the shade, or in specialized niches in the canopy if they want any sunlight -- and they often live off each other.
Is that a model for a mature human society? Are we really different from trees?
Interesting comparison. I don't think you've looked at clear cuts though. For example, Australia, where the aboriginal forests were cut to make room for sheep. Jarrah trees the size of Redwoods kept ground water 7 times saltier than the sea at low enough levels other forest plants thrived. Now, the ground water has risen to the point and is so poisonous in many areas that, for example, sorghum planted in northern Australia kills the cattle it is grown to feed.
Certainly, there is recovery in ecology after a widespread disaster; the introduction of an extra part or two per million of toxic hydrocarbon into a volume of water as large as the GoM, for example. That it will be a recovery our evolved ecology can live within or, one such as Australia's, where Jarrah trees cannot be replanted in now poisonous soil, is the question.
Hey hey NeverLNG,
I don't like the way your question is framed. The African savannas have few small trees and abundant grasses. The grasses capture the lions share of available sunlight. And, speaking of lions, the lion is the dominant species/top of the food chain even though the elephant is larger and needs more fuel. The comparison to stratification of wealth isn't obvious.
Also, I get the impression that you are implying humans society naturally exhibits this high level of inequality. This isn't born out by the data. There are presently multiple societies with higher and lower levels of inequality than the US. All of them are natural.
I think the more interesting question is what drives or maintains specific levels of inequality in society and what are the consequences.
I can't disagree with the criticism of the framing of the question -- on the other hand, I don't think we can ever make a generalization about inequality of resource use that will apply to all situations. People create societies that allow people to fill virtually all the ecological niches, leaving little for any other species, and in doing so, they create vast apparent inequality, because people in society are filling niches that don't exist in "nature". No one would call dominance of Douglas Fir over a trillium a class inequality, and no one would feel sorry for a trillium, but the differences between master and slave might almost be like that.
In some societies, those kinds of differences in access to resources is taken for granted, just as we take it for granted in the forest. But other societies imagine that all people should have equal access, and think it a crime that they don't.
I'm not making any moral point -- I'm just wondering how people might arrive at the conclusion that it is their right to exploit resources that might result in disaster for a huge number of others who have no control of the situation.
That's a good question, that's troubling economist for centuries!
Also Thomas Aquinas though that all men are equal in front of creation.
But this can be a political goal, and cannot be achieved if there's no consciousness about the reasons of inequalities...
The problem of extreme inequalities of wealth and income was taken seriously by both Plato and Aristotle. See Plato, THE REPUBLIC and THE LAWS; also see Aristotle, POLITICS and ETHICS. Aristotle thought that politics, ethics, sociology, economics, and environmental protection were all one big ball of wax.
Plato used law to keep the rulers from getting rich in THE REPUBLIC. Aristotle advocated land redistribution to combat poverty, which he considered inimical to the good society.
About Aristotle, he wrote also that in a democratic system with an initial uneven whealt distribution, the poor majority would enforce laws for redistribution.
http://www.chomsky.info/books/commongood02.htm
One could argue if in a system there's an uneven whealt/income inequality, is that a democracy?
Robert Dahl, one of the greatest political sciencist of our times, says that our systems are not democracies but poliarchies
http://en.wikipedia.org/wiki/Robert_Dahl#Democracy_and_polyarchies
Aristotle advocated what he called "polity" rather than democracy. Both Plato and Aristotle believed that democracy would lead to tyranny, and I think they were correct.
I do think that in U.S. the poor majority has exerted political pressure to create laws that redistribite income; hence in the U.S. we have Social Security, Medicare, Medicaid, food stamps, unemployment compensation and a whole messy panoply of welfare programs. Personally, I favor the negative income tax proposal of Milton Friedman in CAPITALISM AND FREEDOM.
Robert Dahl is one of my favorite political scientists, maybe the very top favorite.
Milton Friedman was the best known economist from the "Chicago school" of economics, and one of the biggest boosters of Wall Street, monetarism, Reaganomics and banking/industry deregulation. As such, his opinions and theories carry little weight with me, Nobel Prize aside.
I won't be so harsh in respect to neo-liberalism THEORY.
Milton Friedman always spoke against all government intervention of any kind, also the so called "nanny-state for the rich": protectionist tarifs, subsidies to monopolies, government bailouts and so on
http://www.youtube.com/watch?v=tdLBzfFGFQU
He also favored government transfers to disavantaged people, beeing free to spend it whatever they liked
http://en.wikipedia.org/wiki/Negative_income_tax
That would be a redistribution policy different from nationalizations to lower strategic goods prices.
That policy wouldn't affect private property.
Always remember that Adam Smith goal was social equity (in perfect competition profits are null) and free markets the mean.
http://adamsmithslostlegacy.blogspot.com/2009/01/smith-on-equity.html
but this is fallacious by different aspects (externalities, information asymmetries, and so on).
What's to condemn is the PRATICE by Regan, Thatcher and so on.
The way THEORY was used to disrupt any kind of redistribution toward the poor majority, is the REAL SCANDAL.
And while keeping live and well all the subsidies for the rich.
I like this idea. It is analogous to the situation where two children have to divide a piece of cake between them. The best solution is to let one do the cutting and the other gets first choice of which piece to get.
There would always be a tension between the urge to acquire wealth and the realization that it would mean losing power.
Plato and Aristotle got just about everything wrong-- from science to human nature.
They are the conservative Greek Philosophers, after 5th Century Athens had its Reagan Revolution, and the conservatives took over.
The Catholic Church assured their importance, and downplayed the people who brought you democracy, atomic theory, medical ethics, geometry, etc.
You get the Milton Friedmen's of Greece.
I must say, Plato's Cave analogy was brilliant.
So, the post indicates that a gasoline tax or the gasoline portion of a carbon tax would reduce consumption, but primarily in upper income groups, since he indicates that consumption is price inelastic in lower income groups. However, I don't think he really produces evidence to support that, in the absence of a graph specifically relating consumption to gasoline prices. But the post does suggest that a gas guzzler tax paid on sale and/or registration for late model vehicles would be more likely to affect the higher income consumers with a more elastic consumptio function than would a gas tax or mileage tax.
Gasoline is undoubtedly price inelastic among working people with low earnings who must commute IN THE SHORT TERM;I would define this as about two to four years which is about long enough for the average low wage worker who commutes to wear out and scrap his clunker.
Excepting a few successful people who conspiciously consume by driving large cars and trucks, virtually everybody I know has downsized his or her vehicle, or will do so, when it is replaced.The full size Ford was the most popular truck around here for decades, all the way back to the late seventies or early eighties, when the previously more popular new Chevy's rusted out faster than they wore out.
Now there are quite a few full size trucks and cars still around;we have a full size 97 Buick but it seldom driven more than a hundred miles a month except when we want to take along five or six people for some reason.It gets well over twentyfive mpg on a trip even at sixtyfive and fully loaded but it drinks gas on side roads and in town.The last big car we had before this one got only about sixteen to seventeen mpg on a trip and half that in town.
Most of these full size older cars and trucks will be around a long time as they not driven often enough to wear them out.
Nowadays there are a half a dozen small pickups sold for every new fullsize pickup locally going by eyeball estimate, if you exclude the ones with contractors signs on them.I believe the ratio is similar for cars.The only people driving late model Crown Vics are the cops.
Of course this is a particularly low income area and is thus not representative.
sf, could you please post where I wrote those things?
The period from about '65 through the '70s shows anomalously high per capita gasoline consumption, well above the trend line that otherwise could be drawn through the remaining data points. There were two factors that could account for this:
These factors decreased MPG while increasing comfort and driveability, leading to the increased gas consumption. They were of great benefit to the oil companies, which were then at the peak of US domestic production. However, the government eventually realized that it had to do something and passed the fuel efficiency legislation.
The government's realization came with the '73 oil embargo. OPEC had been a toothless and ineffective organization for some years after its formation around 1960. However, by the early '70s there was concern that "friendly" regimes in the Middle East required more assistance in order to function as a bulwark against communism. Direct assistance would have been unpopular, both in the aftermath of the Vietnam War and due to the relationship with Israel. Strengthening OPEC would avoid problems with direct assistance by funneling money from US drivers through US oil companies to Iran and Saudi Arabia, which were in turn expected to buy US weapons and US goods to strengthen their economies. This plan failed to work very well, first because of the Arab members of OPEC boycotting the US in '73, and then the later crises when the Shah was overthrown in '79.
Therefore, the period in the data that shows the biggest shifts in key variables is not a period where economic forces are the only factor. Rather, it is a period where government policies exerted substantial influence over events.
"Air polution standards introduced in the '60s limited the percent polutants in the exhaust, and these regulations were complied with by increasing displacement to reduce the incomplete combustion due to cylinder wall effects and by retiming the engines for minimum emissions instead of efficiency."
Merrill, I agree that the air pollution regulations were of extreme importance. Size was also important. The automobile manufactures had a problem producing cars that met the standards but still drove well. Prior to downsizing my big Ford station wagon probably weighed near 5,000 pounds and got about 10 mpg. There was also a time that the progressive elimination of lead affected milage. .
Robert, Quite right about the removal of lead. I think that it also affected the efficiency of the refining process and more barrels of oil were required for a given amount of gasoline.
Most recently, mileage has been reduced by the addition of ethanol. E85 compatible cars are given a break on the CAFE standards.
Fitting the data != success. The danger in reading too much into the historical trends is the fact that there has been a huge shift in housing trends post 2008. To use the example of california, in the pre-2008 period, high house prices in Silicon Valley and Orange country caused people to buy cheap houses in tracy or riverside. Utility was a trade off between commute costs (gasoline) and mortgage payments. Those rules were vaporized by the mortgage crisis and increasing gas prices. It may take several years to stabilize but I think we are going to see more infill developments and clustering around better transit and slowing of building in the ex-burbs.
Will that lead to lower per capita consumption of gasoline? yes, in my opinion.
I propose adding house prices indexed by distance to population centers as a key variable.
Quite an interesting analysis.
I think there are a few variables not really addressed, however. Over the period studied the family and workforce composition has changed immensely. Sixty years ago there were more children per family (which is why it's called the Baby Boom) and often only one person in the family working outside the home. Most people did not go on to college after graduating from high school. Few of those who did go to college went on to graduate school. Today, there are fewer children per family, more single person households, and a many more high school graduates go to college, and many more college graduates go on to graduate school.
I don't know what differences these demographic changes have made to gasoline consumption, but surely it would be substantial. Much more commuting back and forth to college; two or more family members working in different directions; changes in retirement age . . .
Another point you (along with many others) overlook is that within American society the income groups are not static. Most wealth in America is not inherited. Bill Gates' father was an upper middle class lawyer; Warren Buffet's father was a middle class businessman; Paul Allen's father was a librarian; Larry Ellison was the child of an unwed teenager, given up for adoption at birth and raised in a small apartment. Sergey Brin's father is a mathematics professor, who arrived in the U.S. as a penniless immigrant.
And while the poor can become rich, the rich can also become poor. Their stories are usually less celebrated, and so harder to document. But is Bernie Madoff still rich? Or O.J. Simpson?
My personal experience supports this. My wife and I have been in the top 5% and in the bottom 5% (both more than once) within the last decade. Right now we are somewhere near the average. Last year a close family member, who barely made it out of high school and who has been clearly in the bottom 25% most of his life, made enough money to put him in the top 5%. He celebrated by buying a Corvette and a gold Rolex. My wife's widowed aunt, who (with her husband) were the "rich relatives" thirty years ago, lost her mobile home to foreclosure earlier this year.
Two income households increase commuting mileage, both because you now have two commuters and because when one spouse changes jobs, it is often with a longer commute.
There has also been an emphasis on subsidizing home ownership. However, home ownership makes it less attractive for people to move nearer to employment, since moving costs roughly 6 to 7% of the selling price of the house. This leads to commuting patterns where people drive across metro areas to jobs in exurbs on the far side, not just to the metro area's center.
Do you have some data to support this assertion? I believe you may be wrong on this. Read Kevin Phillips' 'Wealth and Democracy.' There is a lot of data out there ( check out http://extremeinequality.org/ ) that indicates that most US wealth was and continues to be inherited wealth.
For the top 1% of wealth, most of it is inherited. For the typical $1,000,000 household (of which there are several million in the U.S) most of it is wealth accumulated through starting a small business and making it successful, though a number of millionaires in the finance area have gotten that way through stock options, bonuses, and salary.
Sociologists and economists have published a great number of solid studies on the distribution of wealth and the distribution of income in the U.S.
You can find some additional data here...
http://yglesias.thinkprogress.org/2010/01/social-mobility-in-america/
That's true for partecipation into the workforce
http://commons.wikimedia.org/wiki/File:US_Labor_Force_Participation_Rate...
but please consider that the data I quoted form the BLS are average, hence per-worker.
All the phenomena you point out shouldn't affect per-worker wage.
Nor one could argue that because of those points a worker need less money now than 40 years ago.
Yes. The graph showing dollars-per-hour is more instructive than generally shown "household income" graphs, which should take into account the smaller size of households nowadays. If households are becoming smaller, then stagnation of household earnings may not be stagnation since it indicates a rising member-per-household income increase.
So your graph was enlightening in view of recent criticisms from neo-liberal economists who insist that in fact, earnings haven't been flat in the US over the last 40 years or so (because of diminishing household size).
All in all, a great article and a very interesting discussion. Thanks from this side of the pond in Portugal (or are you in Italy?).
thanks :)
Yes I'm in Milan
One or two useful graphics, but otherwise an exercise in trivia. The whole thing presumes that automobiles exist, and, given that it's economics, that "consumers" demanded, rather than merely accepted, cars-first transportation. That's highly debatable and requires contact with historical evidence. None exists in this "model."
Second, the grand point here is that people will spend more money on gas if cars-first exists and incomes are rising? You need this model to make that point? Every 10-year-old knows that. It's trite.
Finally, why is this all US data? What happens when there is a serious public transportation or cycling/pedestrian infrastructure? Does this model work for Holland? Does it hold if you control for the automobile-intensity of the overall infrastructure even with the USA?
This is mental masturbation, and an insult to ordinary people. "Piggy principle?" More like ideological slop.
From up top, in the post itself: "However, we should keep in mind that the example of private cars in the U.S. is only one of countless examples of energy consumption..." Apparently it wasn't meant to be an encyclopedic compendium of all possibilities.
The transportation model for Holland (especially Holland proper) or any other place that's wall-to-wall ground-to-sky people may differ. Even in France, where the Massif Central is mostly relatively thinly populated, a quarter of the entire national population lives in high-rises. In Europe, the degree of concentration into concrete boxes is simply incomprehensible to all but a smattering of North Americans. (In Japan, it's beyond all comprehension, even that of Manhattanites.)
And then there's me. Nearest grocery story proper is 11 miles. Nearest doctor's office is 21 miles. nearest hospital is 24 miles. Nearest airport is 26 miles, nearest airport with signficant connections is 180 miles, nearest train station is 57 miles, nearest interstate highway is 24 miles. Nearest bus station is 26 miles. No public transportation of any consequence. Population of town: 700.
Apparently, i am personally hated by many, becuase they all wish to bankrupt me. Think it should cost half my entire income just to go to work.
You should move MUCH closer to work and to where you are less dependent on oil.
People like you are the reason we "had to" invade Iraq. I am sick and tired of subsidizing people like you that use more oil than required because you apparently chose to live FAR from you work and essentials.
Farmers used to "go to town" on Fridays or Saturdays every other week, but only if the weather was good and the dirt roads passable.
You will find out soon enough that reality "hates you". I just would like to speed the process up a bit :-)
Best Hopes for Shrinking #s of Exurbanites,
Alan
I disagree with that. It would be my contention that reductions in consumption are related to unemployment and reduced economic activity. But I live in a rural environment, and reactions there are different from urban. Rural drivers drive very little "for the fun of it". More than 85% of my own travel is purely out of necessity, as in, to get to work or service customers or operate my business. The vehicle in my household that's used purely because we "just want to go somewhere" won't go more than 100 to 200 miles in a month for that purpose, whereas our "get to work" travel is more like 2500 miles each month. In rural areas, practically all businesses are small businesses, and many of them are 1-5 person businesses, with the bulk being 1 person businesses. These are often services that cover a large area. "reduction in travel" occurs directly in "lack of business".
Vast amounts of travel accumulated are for construction and service business purposes. In any given day, a large proportion of the vehicles moving on the road are contractors of various kinds (roofing, construction, windows, electrical, blah), and service rigs - you know, the kind that repairs your HVAC systems, plumbing, pest control, yard service, etc.
Those move directly in proportion to the amount of business they have, and during the slowdown, they do a LOT less than they did. I've directly asked my contractor and service business customers, and all have laid off employees and travel MUCH less than they did 4 years ago.
Anecdotal information is all well and good, but there are quantitative studies being done on all human travel. Researchers either follow the flow of money and more recently by monitoring cell phone calls as proxies for travel metrics (just like in AGW studies, proxies are great tricks of the trade).
I determined that the distance travelled is completely described by applying themaximum entropy principle to mean speed and mean distances. The variation in people's habits and needs fills in all the rest.
http://mobjectivist.blogspot.com/2009/10/verifying-dispersion-in-human-m...
I am not saying you are wrong, just that researchers will watch the cell phone proxy data and see how people adapt.
I guess you didn't quite grasp the implication, that your environment is a direct factor in how prices influence your behavior. Sadly, researchers tend to study small samples and extrapolate what they think is the reasoning behind the data they see.
Take it all with a sizeable grain of salt.
I just wanted to point out how they will likely collect this information, regardless of the influnces behind the behavior.
And my implication was that I hope we don't develop policy based on small samplea and extrapolated reasoning, i.e. anecdotal information.
I think we are likely in agreement.
A reader who is unable to create an account from his computer wrote to me with a question:
"What in the world happened from 1966-1967 to Annual Per Capita Gasoline Consumption? It jumped 23% in that one year. Just curious, and am coming up blank on what happened, since all the other relevant info--to the post--increased smoothly in that period (from the other charts)."
Escalation of the Vietnam war 1966-67 could account for some (perhaps most) of our total increase in consumption of gasoline during that time period. Also, if memory serves, 1966 was a year of slow economic growth compared to 1967.
Massive increase in population, presumably from all those hippies bumping and grinding.
Wait a minute, that would decrease per capita. Far out.
Gasoline consumption only increased 3.1% that year - pretty low for the time, actually.
While we're on the subject of charts, the VMT data is sorely out of date; here's what transpired in the last decade, along with gasoline consumption:
The long term picture:
The recent downturn was the sharpest in history by far, yet didn't decrease fuel consumption anything as much as in the early 80s. Were people just driving around the block all day? Can we chalk this up to ethanol's impact? Data from Traffic Volume Trends - Travel Monitoring - Policy Information - FHWA.
Your missing congestion. AKA sitting in a traffic jam. VMT changes don't include changes in congestion over time.
A start at looking at the congestion effect.
http://americandreamcoalition.org/congestionlocal.html
The "American Dream Coalition" is NOT a valid source of any information.
Alan
Alan it references links to congestion I did not mean to imply it was a worthy site simply a handy way to get to links back into government congestion numbers.
Trust me getting a good handle on congestion is like pulling hens teeth. Its a real pita to get congestion data much less get solid analysis on it. Political as hell.
But for good reason its a big problem and is in my opinion a large part of the divergence between VMT and gasoline consumption.
Over the last ten years our roads have gone from being used over capacity to being used way beyond capacity.
I'd give you a better link but that had enough back to decent data for a good start despite the political spin. Obviously 99% of the people that look at congestion suggest more roads.
Gotta buy this one.
http://pubsindex.trb.org/view.aspx?id=880593
Wiki if you wish.
http://en.wikipedia.org/wiki/Traffic_congestion
http://www.sciencedirect.com/science?_ob=ArticleURL&_udi=B6VH3-41360PK-9...
Rebound effect.
http://www.allbusiness.com/utilities/utilities/4002588-1.html
http://www.cbo.gov/doc.cfm?index=3991&type=0&sequence=6
Not much I can do about the political slant to all this however the data is reasonably valid and all I'my trying to say is its a huge issue that generally ignored by researchers.
As congestion falls off VMT goes up yet overall fuel consumption probably remains somewhat lower.
My opinion is congestion played a big role in flattening and falling VMT not just fuel prices.
Expensive fuel plus heavy congestion certainly made people less willing to drive long distances.
Everyone likes to think it was high fuel costs and only that but if you dig into the data you will see that in many areas congestion was hitting critical levels making it impossible to increase VMT indeed VMT should have been falling from congestion effects alone.
Someone that is missing congestion effects.
http://thecityfix.com/are-vmt-and-gdp-really-correlated/
However notice this.
Lower per capita GDP can have higher VMT. The reason for this is often that congestion has not been taken into account.
If you take into account that areas where incomes are higher are also substantially more congested then this strange result
begins to make sense.
And one more thing obviously incomes could fall substantially and or the price of gasoline could increase substantially before the wealthier areas have to reduce fuel consumption. VMT remains constant to higher over basically a doubling of income.
Oil prices are probably no where close to causing serious changes in consumption.
Thus congestion is such a huge issue esp over the last ten and even more the last five years that its far from clear that high oil prices alone had a substantial impact on oil consumption. The original post did a good job of showing the signature of congestion.
Almost all the changes in VMT may well be from congestion alone !
That would blow away a whole lot of crackpot theorist on the oil drum that have failed to look at congestion.
And Alan please ignore the "political" nature of the data and recognise that the underlying issue is real and a serious problem for auto based transport. This is and issue regardless of how its powered EV's don't solve the congestion problem.
So in the end gasp light rail and trolleys are critical to actually get efficient transport congestion ensures that cars regardless of how they are powered simply are not a solution past certain population densities period.
Indeed they have already failed.
My POV is that congestion is a natural result of a auto based urban form, and without a positive cure. I basically oppose any efforts to reduce congestion. In my personal life, congestion is a non-issue.
Looking forward, congestion will be "cured" (or at least reduced) by higher gasoline prices (summer 2008 several % lower VMT almost immediately) and reduced economic activity.
Looking backward, an exclusively auto based system cannot operate without congestion.
There is a link between density and VMT. More roads and parking, etc. reduce density (see Phoenix >50% land area devoted to cars). Reduced density makes everyone car dependent. Reduced density also increases VMT to make normal trips to work, school and shop. (Sidenote: see the dramatic decrease in children walking or bicycling to school over recent decades).
Ed Tennyson did some ground breaking work on this in the 1960s and 1970s.
Building more roads will result in the same equilibrium congestion with a time delay, as development and VMT habits adjust to the greater supply.
If everyone drives, there will be congestion in urban areas. This fact cannot be changed or ameliorated for long.
And, as you point out, it matters not if the cars are ICE, hybrids or EVs.
Alan
Whew :)
Its not my fault that the congestion sites that have the data are often of the build more road crowd.
Certainly I've read sites which support public transport and have congestion numbers but these tend to be locally oriented ( surprise).
I hope you include what you have stated about congestion and density and cars its a very important message.
Congestion literally breeds congestion using individual transportation its intrinsic. And of course it also drives the need for lower density as roads and parking spaces take up more room. Our cities become places for cars not people.
On the fuel efficiency and efficiency in general front congestion ensures that private transport will be wasteful of resources.
All resources and not just the fuel.
And it bounds how much the system can change as the infrastructure was designed to fight congestion not for efficiency.
I consider congestion to be the C02 of the personal transport world its the elephant in the room that goes unnoticed by many.
In the end its the big one the critical factor etc etc.
Great! I saved that on my bookmarks, still I can't find up-to-date pro-capita gas consumption... can anyone help? :)
I don't think per capita consumption of gasoline is the number that is relevant. What I want to know is how much gasoline is consumed per driver per year.
I'm guessing the data between and after is based on a different methodology, resulting in a "series break."
The United States has not been a steady state economy since 1970 for two reasons. First, and most important, is that population has grown substantially over the past forty years. Second, median wage income has been pushed down by more and more compensation to employees being for medical insurance.
Also, real GDP is a heckuva lot more now than it was in 1970. Real GDP per capita has also grown a lot since 1970, but most of the benefit has gone to the top income quintile.
Don, can you quote these data about median wages?
Relying on memory now (which is what I usually do), median household disposable income has not changed much in real terms since 1973. But as the average size of the household has decreased, individual disposable income has increased somewhat--but not much.
In regard to median wages (not the only source of income), increasingly companies and nonprofit institutions and governmental organizations have been compensating all fulltime employees with increasingly costly medical insurance rather than in money wage increases. This trend began in World War II when wages were frozen but companies were allowed to offer more medical and dental insurance benefits to attract more workers. Thus evolved the unique U.S. system of tying medical benefits to employment, which is not a good thing.
I received the following comment from Pedro A. Prieto, Vice president of ASPO Spain:
Using BP data, I have made a small table that shows some interesting things.
My first impression I am afraid time will prove out, is that when the oil flows increased every year, the rest of the fuels also were increasing. This even held true the first year that the oil fows decreased--still natural gas and coal, which are not yet in their peak, continued growing.
But after a second consecutive year of decreasing oil production, the lower oil production has affected the two other main fossil fuels, coal and gas, either directly or indirectly, and they have also reduced their production.
The direct cause could be the close interrelation among the fossil fuels, which is very asymmetric in favour of oil, which is responsible of more than 95 percent of the world transport, including all motorized activities of mining and the rest of machinery. The indirect cause, is that after the oil dwindles, there is no any possible economic growth, as energy and GDP are two expressions of the same thing: the economic activity requires energy. A very direct relation shown in the last IEA WEO 2009 (page 59 Primary Energy Demand and GDP, page 59). And with no economic growth, many things start fading, among them the financial world, that need economic growth to live; and the financial collapse leads, indirectly, to lower production in many things.
The graphic of the IEA shows the cynic clearly the why the concept of "energy intensity” was created. This invention is to wash some hands and minds and to prove that we can do more things (more GDP) with the same amount of energy, or to do the same things, with less energy. Although this is true for certain specific activities and/or countries, a top-down vision at global level and without prejudices, shows that if GDP grows, there is more energy consumption. If GDP grows, there is more pollution. That the GDP pollutes and the increase of GDP pollutes increasingly. The slope of the OECD (richer) countries is lower than that of the Non-OECD (poorer) countries. What this shows is not that rich countries are cleaner or sharper or smarter, but they are better in spoiling and pillaging alien resources via financial tricks and unjust commerce and by outsourcing the most polluting and more energy intensive and dirty activities, while keeping in the powerful countries the added value. Additionally, this permits to the richer countries to overlook poorer countries and accuse those who are polluting and consuming to produce shoes, T-shirts, and a myriad of consumer goods for us, of being dirty and intensive in energy consumption.
At the end, what prevails is the only one world, the green line of the IEA graphic; almost a straight line, clearly indicating to the HUMANS in general: ladies and gentleman, if you want more economic activity, you will have to consume more energy and pollute more. If global primary energy starts to fade or levels in a plateau, say bye, bye to economic growth.
We have to observe closely how the so called modern renewable energies have evolved. Even with their spectacular growth, especially in wind energy, their efforts and energy contributions to society could be greatly handicapped, if oil dwindles from year to year.
In the table above, the conventional energies fall 150.9 MToes in 2009, with respect to 2009. However, the new contributions of the modern renewables were 30.9 MToes. This is considering an average on the installed power (assuming that all this power has been working for one full year and considering 1,500 peak hours/year for solar installations and 2,000 hours/year for wind installations).This is 5 times less than the fall of fossil fuels in the same period.
If we consider that modern renewable energies are heavily subsidized and underpinned by a fossil fuelled society, if this society crashes, it is very probable that the renewable energies will follow, exactly like it is happening in Spain these days. Spain, with 20 GW of wind power and fourth country in the world, second in wind energy penetration and with 3.8 GW inn solar PV, second in the world and first in solar PV penetration, is debating today to cut, or kill the subsidies to renewable energies. And the government is even proposing retroactive changes, that will substantially decrease the subsidies already granted and approved, with respect to previous premium rates for renewable energies.
As somebody else has noted, in the Middle East oil production has fallen a 7.3 percent in 2009, but some countries like Saudi Arabia and Kuwait have fallen respecttively 10.6 and 11.3 percent. The obvious and main reason for Saudi Arabia is that its internal consumption increased some 9.8 percent. Still to be seen if it is only the domestic net energy to the service of the Saudis, or if it is, most likely, the increasing amounts of invested energy that Saudis need even to produce a 10.6 percent more.
In any case, we should never forget that subsidies, be they for an artificial ski slope in Dubai or in the form of premium tariffs for the modern renewables, are but a form of economic surplus of a fossil fuelled society. And economic surplus, as we can see from the IEA Graph, is a form of energy surplus, obviously coming mainly and fundamentally from the fossil fuels.
Gail,
I think 2010 marks the goodbye to economic growth in the U.S. In the short run, the pressures of debt deflation will cause GDP to fall over the next year or two or three. In the longer term, declining oil production will force U.S. real GDP (and even more per capita real GDP) down, then down more and more over time. I think the descent will be gradual, as predicted in John Michael Greer's book, THE LONG DESCENT.
In the short run, the pressures of debt deflation will cause GDP to fall over the next year or two or three.
Do you mean deleveraging, or price deflation? If you mean deflation, What do you think of James Hamilton's argument that the Fed has the power to prevent deflation? http://www.econbrowser.com/archives/2008/10/deflation_risk.html
In the longer term, declining oil production will force U.S. real GDP (and even more per capita real GDP) down, then down more and more over time.
Are you relying on Greer for this assumption? Why do you think oil can't be replaced by wind, nuclear, solar, etc?
Nick,
I mean debt deflation as described and predicted at theautomaticearth.blogspot.com
James Hamilton is correct that the Fed has the power to stop and reverse price deflation. Out of fear of reigniting inflation, the Fed has not yet exercised its full power to raise the price level. Note, however, that the Consumer Price Index has been increasing at about 1% per year lately. Probably the CPI understates true inflation in price levels.
I do not rely only on Greer. I've been reading and studying The Oil Drum for more than four years, plus I have degrees in sociology and also in finance; I've done a lot of reading over the decades.
Oil cannot be replaced by "wind, nuclear, solar, etc." because oil is an energy dense liquid fuel. There have been many, many, a GREAT many articles on this topic posted over the past four years.
Hi Don :)
On this note I think I've finally figured out how to explain how rising oil prices because of scarcity leads to debt deflation.
Here is the key concept finally laid out clearly although I've been trying to explain it for a while.
http://www.hoocoodanode.org/node/10043#comment-1322252
Once most of your net income has been spent on debt payments and necessities you no longer have any leverage to change velocity of money. Velocity becomes coupled to expansion of credit. As credit falls velocity falls.
Now here is the kicker if your income is fully committed to debt and necessities if the price of oil and thence food rises the only thing you can do is default on debt. You don't have enough discretionary income left to conserve elsewhere. Stopping purchasing using credit cards does not stop the bill same for house payments etc.
Now defaulting on the debt and transferring the money to gasoline payments does not increase the velocity of money it remains constant simply changes where the money is spent.
However its not quite that simple because debt payments are not matched to rising gasoline price obviously if you default on your mortgage your cash flow increase a lot more than is needed to simply cover your rising gasoline costs. And once you start defaulting you just as well eventually default on all outstanding debt its over time and all or nothing affair.
Now although the velocity of money still does not change you get a sort of second wind or Indian summer effect cash flow formerly allocated to debt payments is spent on anything that can be purchased for cash perhaps with a few months savings.
Velocity does not increase but expenditures for anything that does not require debt goes up. Fuel usage goes flat to increasing as cash flow rich defaulters can compete for fuel. These are to some extent offset by those still struggling to pay debts and cut what little free expenses they have. I argue fairly quickly the cash influx from defaulters tips the scales in favor of rising consumption.
At first those that default simply maintain their current lifestyle they don't splurge but as they build some savings they begin to spend more than they did when they had outstanding credit they where maintaining bringing velocity back to the same level as before the credit collapse.
Thus velocity remains constant while debt deflation advances and most important demand for commodities esp oil remains constant to rising. Excess cash is spent on other goods and services keeping the economy perking along. Stagnant but not collapsing simply seeing growth in purchases of goods that can be bought for cash and declines in goods bought with credit in particular housing and thence autos. As in general before you default on your mortgage you buy a new car.
Oil demand remains and most importantly purchasing power for oil products climbs steadily with defaulters becoming the deep pocketed buyers.
Also notice that cash transactions steadily increase and you can bet that reporting declines so not only does the tax base continue to fall but more and more items are bought for cash and these transactions are going unreported in particular of course for small business.
The paradox is that the fact that debt payments for many have eliminated practically all discretionary income ensures that the economy remains functional via default for a bit anyway. As long as the defaults on loans are papered over everything just perks along.
Eventually of course rising defaults can no longer be ignored and if oil supplies are decreasing and demand is constant rising oil prices will pressure even this economy.
Still haven't read the Long Descent but with this sort of transfer of losses to debt given the nature of our currency I'd argue it more a fairly short period of time where default goes unrecognized before the currency itself becomes unsound. Via default your get price inflation for commodities as default allows you to always have more cash chasing a limited resource.
The Fed can stop velocity by falling both by guaranteeing bank deposits and other debts. Furthermore, the Fed can (and will if necessary) create enough money to restore moderate rates of inflation, as it has been doing recently, and also in 2005. Note that the Consumer Price Index is still rising about 1% per year, and the CPI probably understates true inflation substantially. (the shadowstats conclusion)
Thus we are living not in an economy of price deflation but one of inflation, albeit a mild inflation.
By the way, it really does not matter what happens to M3. That is one reason the government stopped publishing the M3 series; those numbers can be highly misleading. M2 is a much better measure of the money supply.
Hang on Don I said velocity was a constant i.e money was simply being spent on gasoline instead of debt.
Government backing for the debt simply wipes out the principal loss which was balance sheet money anyway the interest is not paid.
Sure they can backstop the default by erasing the principle loss but this does not address the interest.
And yes they are playing games on the interest side too paying interest on Federal deposits etc.
If the banks are not lending because no one is credit worthy it does not matter. Once people start defaulting nothing can stop it.
The velocity remains constant and games with banks simply increasingly disconnected from the economy. The only connection is banker bonus's spent back into the real economy.
Without wage inflation nothing can change the situation. Games like the housing tax credit work to simply pull demand forward for housing. Eventually you simply have exhausted the supply of borrowers that are even remotely credit worthy.
Rising defaults ensure further declines in equity and more defaults. Housing loans don't stick most of the FHA loans made in 2009-2010 will probably start defaulting rapidly if oil rises over 100 or so as the borrowers really were not credit worthy anyway.
All the so called cash purchases which probably relied on variants of hard money loans will result in the houses going back on the market once the equity decline as obvious.
In the end very little of the debt extended will stick and result in long term interest payments. For hard money buyers substantial capitol will be lost.
Also consider that opposite this falling debt cash purchases will invigorate the non-debt economy this money will get concentrated and a good bit will flow back into real estate speculation simply to get destroyed. Thus in general the people benefiting from the excess cash caused by default will almost certainly eventually lose their wealth via once in a lifetime good deals in "cheap" real estate.
To some extent this will help slow the price declines at first the problem is that its increasingly speculative money being thrown into a declining market sort of like a permanently collapsing bubble. Same for the stock market for that matter and all manner of investments.
Even as the economy moves to cash the need to actually expand capacity is negligible since we have significant overcapacity everywhere.
Simply parts of the economy for the most part fail to fall they never in general strain capacity leading to growth.
Assuming oil prices keep rising and same for food the absolute size of this default driven economy actually shrinks overtime as despite defaults less and less cash can be diverted to buying non debt based goods.
Whats really interesting is this sort of purchasing demographic eventually puts US consumers in competition with Chinese in the sense that to maintain economic activity we would need to actually gasp start manufacturing these smaller items again. This of course suggests wages would have to become competitive with Chinese wages. Oil usage would begin shifting towards real value add consumption and not simply wasted consumption. The pressure on oil remains surprisingly steady for some time.
Overall its a much smaller economy in the end so you can forget about our outstanding debts they simply cannot be paid.
Depending on the basket of goods and services I'd argue that you should see this at least at first as debt default frees cash flow you do have some small pressure on prices for anything that can be bought with cash. It all depends on the basket of goods and services considered as debt supported items will fall while non-debt based purchases should remain ok to even robust.
Again the key and most important point is that once you have no discretionary income yet a large amount devoted to debt payments defaults will work to keep economic activity surprisingly high. Only rising oil prices work to shrink the overall economy.
Obviously I'm assuming that the US will continue to backstop defaulted debt and pay the principle and perhaps some interest for some time to come just all this does is prevent the collapse of the banking system from taking out this new lower debt economy.
Indeed I expect oil demand in the US to remain at its current level or rising for at least another year or so regardless continued default.
I agree with what you wrote, except that the velocity of money should not be treated as a constant; it varies. For example, a rising rate of inflation increases the velocity of money.
Yes but :)
Thats the point once most of your income has been allocated to debt payments then velocity is constant unless wages rise.
Rising oil prices don't change this the velocity is the same simply more money goes towards goods and services not debt payments.
If you disagree then you miss the main point velocity of money is now a constant. Once most income is allocated to debt payments velocity goes to a constant or more correctly is equal to expansion and contraction of debt.
Rising food and oil prices simply force it into a contraction phase. Overshoot in the sense that defaulting on debt frees more cash flow than needed to cover rising oil and food costs stimulates the economy and results in a constant velocity just changes the allocation.
The transaction rate aka velocity remains a constant only the allocation changes.
In a real sense the large amount of credit outstanding ensures that attempts to inflate will fail unless either wages increase or cash is simply handed directly to consumers. Attempts to expand credit and induce inflation that way are impossible.
Flagrant printing through simple direct payments would simply cause hyperinflation.
I don't care what the Fed does the problem is people simply don't have enough disposable income its all committed to debt service.
Assuming oil prices are rising then then the Fed is powerless to stop people from fixing this issue via default outside of ever more obvious direct cash infusions.
For oil at least given I'm claiming rising oil prices are the problem all this does is ensure demand for oil remains robust against rising prices. Direct cash infusions will first go to offset rising oil prices and thence if your lucky some to servicing debt.
Expansion of debt is a receding horizons problem.
Although I'm focused on oil I'd argue a similar sort of situation happens if you have scarcity of any key commodity.
Its simply impossible for you to change the situation using monetary games that result in bolstering demand.
The only approach that works is one I think was tried you can shock the economy using financial tricks to force it into a monetary panic and if your lucky resuscitate it. Forcing faster shrinkage always works. Afterwards the fake growth from the rebound looks good.
The question is how many times can you shock the economy to the brink of collapse and then bring it back ?
Raising tariffs substantially is quite similar it creates a rebound effect.
http://en.wikipedia.org/wiki/Smoot%E2%80%93Hawley_Tariff_Act
And it should be clear by now that the rebound only takes you back to where you would have declined to naturally.
Printing money cannot change the situation it can for a time alter the rate that the economy transforms away from debt but outside of forcing a faster contraction via creation of financial panics all other approaches work to bolster demand for oil. Indeed since the financial panics artificially reduce the price of oil they keep demand artificially higher after the panic as oil becomes relatively cheap and continues to be consumed with no major changes.
Once again, except for one thing I agree with what you have written. The data show most emphatically that the velocity of money (Look especially at M1 but also M2.)varies over time with abrupt and drastic changes. These unpredictable changes in velocity undermined the monetarist point of view, which focused only on changes in the M2 quantity of money.
The demand for oil will vary depending mostly on the rate of decline in real disposable income per driver.
And here for this thread we will disagree M1 and M2 are the problem they do not define the velocity of money.
They look important but mean very little in a world of debt.
The biggest one your missing is the ability to refinance or roll a short term debt at maturity.
And as I said the ability to actually make the debt payments.
Once you include outstanding debt and debt flows in general M1 and M2 are a gnat on and elephants ass if you will insignificant quantities that have little effect on the real economy. They change rapidly because they are marginal variables not because they are economically important.
So having claimed M1 and M2 are BS I'll pick this up later on in a new thread :)
One more thought think of it this way.
Rising oil prices force you to make your monthly income allotment flexible to cover and unknown increase in costs.
You have no choice but to increase your cash reserves if your over extended on debt payments then you have to default.
Expanding your monthly debt payments is difficult if your facing unknown costs increases.
The intrinsic problem is that fixed payment demands in exchange for credit simply are not flexible enough to deal with
this sort of problem. Indeed if you look the Government has worked hard to try and get lenders to become more flexible.
Credit cards already have the concept of minimum payment expect this to fall in and attempt to prevent default.
But increased flexibility in credit pay back can only go so far. As far as I can tell almost everything we are seeing right now seems to make sense with my thesis. The proof of course will come if we see economic activity resilient to rising gasoline prices with surging debt defaults. Thats of course the true test.
And of course it obviously makes the FIRE economy irrelevant and that will be even more interesting.
For that matter if one looks back at the Great Depression it seems a similar economic shift took place the economy transformed into this daily living economy and rejected debt. Certainly WWII eventually changed matters but if it had not happened I'd guess the economy would have eventually stabilized into one of very low growth rates based on savings not debt.
And last but not least this is a economy that won't or basically can't expand debt even for personal consumption much less infrastructure changes and pension payments etc etc. Viola third world America.
Now the length of time this sort of economy can function seems to be entirely dependent on the rate that oil prices change.
If they change slowly like they have this year the system converts slowly if they change rapidly the system converts rapidly
with debt defaults surging to surprising highs.
So let see what happens if we get a surge in oil prices thats needed to provide clarity.
Faith in the Fed ... or other central banks? I dunno ...
What sort of monetary policy dose the Fed have in mind?
- The central bank can cut interest rates. (Rates now are near zero. See 'carry trade' below.)
- It can engage in Quantitative Easing, that is, buy government debt itself (The Fed is already doing this 'by the backdoor' with its policy of paying interest on reserves held at the Fed where banks are 'straw purchasers' of government securities for the Fed. The Treasury is also the straw purchaser of GSE securities for the Fed under the 'blank check' permanent Treasury bailout of Fannie and Freddy.)
- It can swap dollars for other currencies (The other major currencies trade at a discount to the dollar or are pegged to it such as the China- RMB. There is a currency horse- race to the bottom- which is amplified by the hard[ening] dollar.)
- It can swap Treasuries for or buy outright other securities such as commercial paper (and by doing so signal the market that there are problems with commercial paper and thereby trigger a run.)
- It can open 'special facilities' and lend to all kinds of entities; companies, local- level government, even individuals (which would not accomplish much for the following reasons:
a) Firms and individuals with high- cost debt would refinance and the interest accrual would shift from the borrower to the lender, there would be no net gain or new money; and,
b) those lacking the means would reject the loans as unpayable, or,
c) would prefer cash as the apparent increase in loaning would devalue credit and revalue upward cash, the exact opposite result to what the central bank intends!)
The central banks cannot create value, only keep the '3 card monte' game going (while hoping for things to improve for exogenous reasons) by issuing more IOU's. While these banks attempt to obscure the place in the money pyramid where they and their products reside, the users of money and credit have no such illusions.
If a person does not have money, the know completely what it is they do not have. Giving that person a loan is an exercise in futility unless there i the cynical and tacit understanding that the loan is really a grant. This 'loan v. grant' issue is central the Eurozone crisis, where more (unpayable and soon- to- be unserviceable) debt is offered where grants WERE needed. (And grants they shall be as Greece and the other Eurozone countries default one after the other.)
At best the central banks can keep the carry trade going which is no cure for deflation. Outside a currency - say dollars sold for euros bought - a carry trade is one nation's investment in another for short term gains by speculators. Within a currency - selling dollars to buy Treasuries - the end result is irrelevance and the destruction of the markets which require more than one player to function.
This is at bottom the difficulty of expecting the central banks to effectively counter deflation. They become the entire market and the discovery of value drifts off somewhere else ...
People then look to what they know and can hold in their hands; gold, paper money, tools etc. Commerce, which requires more participants other than one giant bank (to rule them all and in the darkness bind them) and a closed cycle of money exchange.
The United States now is in roughly the same position as was Great Britain during the Long Depression of 1873 to 1896. In each case we have a nation which has been ascendent for about 60 years since the last world war (Napoleonic and WW II), is still militarily dominant, is economically uncompetitive, and in decline relative to other countries.
Other nations may not experience the same decline as the United States will when we can no longer afford to import oil by borrowing more money.
The US and China will probably mine and burn our coal reserves in spite of objections about global warming. Other countries will probably move to breeder reactors and nuclear fuel generation despite our objections about nuclear proliferation. The developed nations of the world will not give up their use of high levels of energy without a fight. The developing nations will want their share.
Merrill,
The U.S. need not borrow from China or anybody else to finance purchases of foreign oil. The Fed can create all the dollars needed simply by monetizing the national deficit and debt (quantitative easing). Even if the Fed decides at some point to hyperinflate so as to repudiate all existing debts, all that would happen is that the U.S. would have to pay a sh*tload of dollars for each barrel of oil.
I agree that both China and the U.S. will both burn all their coal. My guess is that both countries will invest heavily in coal to liquid (CTL) facilities over the next twenty years--say as soon as oil gets to $150 or $200 a barrel and stays there for a year or more. If memory serves, China is already building some CTL plants.
China might well burn all of it's coal - the US would have a very hard time doing that, because it has so much coal.
I think the US will build some CTL, but probably not very much - CTL plants have to be very large to achieve economies of scale, and investors find that very risky, especially in light of possible carbon taxes/costs.
EVs are the way to go, and the US is going that way.
I expect the U.S. government to subsidize and guarantee the profitability of CTL plants. Indeed, given a wartime mobilization effort we could probably produce half the oil we consume from CTL within five years. Shortage of private financial capital need not deter investment in CTL. If we were to construct the equivalent of 500 or 600 Sasol plants we would greatly increase our consumption of coal, and our reserves would not last many decades--maybe only 25 or 50 years.
I expect the U.S. government to subsidize and guarantee the profitability of CTL plants.
It's possible. Such guarantees were requested very recently, and refused under the Bush administration. Such an effort would face a very, very big backlash from environmentalists. It would be far, far better to drill for oil in ANWR, the Arctic offshore, heck in the middle of every national park we've got, from an environmental perspective.
If we were to construct the equivalent of 500 or 600 Sasol plants we would greatly increase our consumption of coal, and our reserves would not last many decades--maybe only 25 or 50 years.
It would be interesting to do the calculations. If we were that willing to trash the environment, I think we'd find we had something along the lines of several trillion tons of coal available - there's about 250M tons available in the lower 48 assuming current access limitations, and that might double without those limits. Further, there's something between 250M and 5T tons of coal in Alaska (we don't know, but it would likely be nearer the higher limit if we didn't care about what environmental damage we did).
Far cheaper in every way to ramp up EREVs dramatically.
If we were in danger of running out of coal, ramping up wind power would free up coal from electrical generation.
The Hirsch report gave much longer lead times, even with war time urgency. The modeled the situation where the South Africans feared an oil embargo and built a duplicate plant to one just finished as fast as possible.
Building efficient Non-Oil Transportation would be faster and a netter use of resources.
Alan
I agree, Alan, but I still think the U.S. is going to invest massively in CTL so as to keep BAU as long as possible. Yes, it will have grave environmental costs, but we'll do it anyway.
Perhaps, but as Alan notes, non-oil transportation can be built much faster and more cheaply.
There may be some CTL, but it will only be a part of the response, and it will arrive well after EVs and other substitutes have ramped up.
Don, the US can enjoy the benefits of seniorage only so long as the dollar remains the world's reserve currency. So far, we have been able to keep that particular scheme afloat, but when it comes to an end, world trade will decline abruptly.
A dollar spent on oil has to find its way back to the US through the purchase of goods and services, as investment income, or as investment in dollar-denominated assets. Or it has to be parked off-shore in Eurodollar funds or equivalent where it is used as working reserves for global investment, trade, and speculation. If investors lose faith in the dollar and its international reserve currency role is questioned, the demand for dollars will drop precipitously.
Note that the dollar has been gaining in value against the Euro, the British pound, and the yen. It would gain about 40% against the yuan in a free market, but the Chinese peg the yuan to the dollar.
Thus the U.S. is in no danger of losing its reserve currency status as far as the eye can see into the future.
For investors to lose faith in the dollar we would first have to hyperinflate, and there is no evidence that the Fed would allow extreme price inflation in the U.S. Quite the contrary.
The US Treasury is attempting to get the Chinese to let the yuan to strengthen against the dollar. It is the artificially weak yuan that is thought to contribute to the trade imbalance with China.
Of course, with a stronger yuan, imported oil would cost them less and us more, if oil exporters adjust prices to maintain purchasing power of their revenues.
A close coupling of fossil fuels with other sources is unlikely. The continued rise of hydro probably reflects new capacity (Three Gorges Dam?) and the zero cost of "fuel". Once installed, the hydro generation would be operated to the full extent of available water.
Nuclear and coal probably reflect installed capacity and base generation load for electricity. The recent decrease in nuclear would reflect decommissionings of old plants and possibly less base load demand in heavily nuclear countries like France and Japan.
Oil and gas are most heavily used for transportation and industrial puroposes, at least in the US. Therefore, they are most sensitive to the level of economic activity.
When oil becomes scarce and prices rise, the prices of energy delivered from other sources will rise as well. That would imply that the transportation and industrial demands of the gas, coal, and nuclear energy industries can be met from the dwindling supplies of oil, since those industries will be more profitable, able to pay higher prices, and outcompete other uses of oil.
Interesting post, with quite a bit of truth to it.
There are some limitations with the model, as has been pointed out in the comments. I would emphasize three:
1. The assumption that the economy is composed of individual consumers, whose behavior determines energy consumption. In fact, industry, government and military are a huge chunk of the economy. Their behavior is rather different than that of individuals. I'm struck by Americans' blind spot in regards to the impact of our military; I'm not sure why Marco overlooks it. Here's a recent article summarizing its role: Call the Politburo, We’re in Trouble .
2. The particular variables chosen (income, gas prices, etc.) do not explicitly take structures into account. Commenters have pointed out the lack of good mass transit in the US and the long commutes required of workers. By overlooking structure, the model provides little guidance as to what structural change would be beneficial.
3. The "per capita" approach becomes problematic with highly skewed populations. Within the United States, income and assets are concentrated in the upper brackets. Even more so for the world as a whole.
Pace WebHubbleTelescope, this skewing is not a natural law, but is a human construct. The differences in wealth/income vary tremendously between societies and historical periods. Within my lifetime, the polarization in the US has dramatically increased from the somewhat egalitarian 50s.
WebHubbleTelescope says that it would take energy to change the inequality. I would counter that a large portion of our society's wealth is spent maintaining the inequality, through the police & military, public relations, corruption, lobbying, etc.
Bart / EB
OK, the income disparity narrows down a bit from what you would get in the wild kingdom, but I contend that there always will be disparity. The Japanese have done some amzing studies on labor productivity, which is not exactly the same as income or wealth but it does have some relation to it. One Japanese research group collected millions of data points and generated these ridiculously noise free histograms. In any case, I tried to make sense of the data and came to the conclusion that productivity matches very closely to a "learning curve" ramp and a law of diminishing returns.
http://mobjectivist.blogspot.com/2010/04/extracting-learning-curve-in-la...
Within the learning curve constraint it still follows the prnciple of maximum entropy because there is still and always will be a huge variation in human skill levels.
Read the post and you can see the good agreement.
The chosen means for reducing inequality is debasement of the currency. This forces those who have wealth to invest in various assets that increase in value through inflation, with the capital gains being taxed. Return on capital has declined over the years as we approached natural limits (see note) of the productivity miracle (basic and applied science, steel, scientific management, electrification, mass production, internal combustion transport and highway system, synthetic materials, fertilizers and high yield plant varieties). This has depressed the rate of return on capital, seen as high PE multiples on stocks and negative real bond yields.
Declining productivity plus lack of investment opportunities coupled with debased currency caused distortions that are the root of the financial crisis, of which we are in the beginning stages.
Staying on the gold standard would have at least given people the option of holding cash without confiscation. Ultimately fiat currency will fail because the interest payments will go parabolic. The day of reckoning is close at hand for Europe, and it will quickly spread to the rest of the Anglo world.
Note: Natural limits can be thermodynamic efficiency, available sunlight in the case of crop yields, or that almost all the labor involved in making a product has already been replaced by machines. In most basic materials production people never touch the product. Animal work was equal to fossil fuel work in the US in 1870 while today FF provides 200 times more power than it did then.
I deliberately used only private mobility data, and you can see that from the very first lines of both my articles
Sure they don't... can anyone really show me that the structure in private car mobility is different from 1947?
this critique really surprends me... I spent many lines dimonstrating the importance of low incomes in respect to overall GDP in determining gas consumption....
Grazie for replying Marco. As I said, I think there are some good insights in the analysis. There are also significant limitations which should be specified.
1. Yes, you made it clear what data you are using. I am saying that by emphasizing these data and not others, you omit significant aspects of reality. This vitiates the meaningfulness of the conclusions. "It's all in the assumptions."
In particular, this data emphasizes individual behavior and not the behavior of government, industry and the military. Change the scope, and I think different conclusions will emerge.
2. Actually, if you are presenting a case, it is up to you to show that the structure in private car mobility is the same as in 1947. That is an assumption on which your case depends.
On the face of it, transportation systems in the US have changed significantly since that time. Railroad and urban mass transit have declined in importance. The Interstate Highway system was built, which has made long distance car travel much easier.
The problem is that structural change is of key importance. The most important changes in transportation now are taking place in India and China, as the car supplants lower impact forms of transport.
3. Yes, I know you paid some attention to the different behaviors of the different income segments. This is good. I think, however, the differences need further examination. This is particularly the case when looking at the world as a whole, where the differences in income and behavior are much greater.
**
Although I don't mention it in my previous post, I think one needs to be careful about making generalization about human behavior based on contemporary U.S. data. The U.S. from 1950-2010 is an abnormal case, with a particular political-economic system in a time of energy abundance. I don't think we will "pass this way again."
best wishes
Bart / Energy Bulletin
In Switzerland, all the measures listed below have risen steadily, together, in gentle or steep (depending on your pov) slopes upwards without bumps - with a few trivial exceptions, such as the costs of plane trips which vary.
The statistical and rather brief precis linked is in French and only takes off in 1995, but these trends are historical. After all car use in 1920 was zero.
GDP per capita
Traveller (private, not goods) kms
> 61% increase motorised traffic 1970-2006
> 23% increase since 1995
> 2005: 45 % trips are leisure trips, since then 50% in many places (not in the linked text.)
Price of traveller km (all transport)
Number of motor vehicles (includes SUVS, motorbikes) per household:
> in 2005 20% have = 0
> at present, more than one car for one citizen
> in *absolute motor vehicle nos*, not per household, increased more than 50% (!) since 1980 (pop growth to be figured in.)
Length of roads, and land area devoted to transport. (Often left aside.)
HP of cars
> recent data does show a tiny dip, not in the linked text, concurrently with weight of cars (ditto), and presumably their size.
-----------
If you scroll to the bottom of page 17 you can see that public transport (train, tram, bus, trolley, boat, cable car, etc.) accounts for only a small %, 17 - 20% at the very most in 1970 and then sinking, of personal traveller kms; that the line is almost flat; and that personal car use has exploded from 1970 on.
CH is often cited as having fantastic public transport. I think that reputation is deserved, one can indeed travel all about (with some planning), and do quick, easy commutes, and the price is affordable as it is very heavily subsidized, specially for all those who cannot stretch to a car: students, oldies, and in some cantons the ‘working poor’, etc.
My young relative, as a student, has a 50% discount on train trips, at a one time cost of 110 dollars a year (about), and can travel for free between 19.00 and 6.00 or 7.00 - that is to make the bad/early/late/commutes free of charge, so that students are not penalized or prevented from studying. Or that they can go on rave parties to Zurich!
The geography and terrain of CH is very arduous, with corridors of communication between mountains, long commutes, etc. Public transport is (mostly) on time, clean, until recently very pleasant to travel in. It basically runs on electricity (nuclear, hydro) and diesel for country buses.
The Swiss love their public transport.
But they don’t use it, when they can afford a car, they give it up.
Leasing and hiring and ‘mobility’ car cos. have also seen to it that status wise, hire a nice a car for the w-end is super-cool.
Now let me come to the point: in the picture painted for CH, the efficiency in energy use, or cost of personal transport is not a factor. It is not figured into Gvmt. analyses, at all (see link) and they are quite right not to include it.
If a car can be paid for, gas can be paid for, that is it. Not one single person I know complained of high gas prices when it spiked.. rising GDP > rising no. of cars, some of them monstrous SUVS. India and China, to mention just those, are, at a different level in a similar situation. Ppl don’t care about the price of gas (or their expenditure on the car as a whole beyond the first buy of the shiny carcass) if they figure they can pay for it, or can get rid of the expense easily if they decide to.
Economic development leads to more cars. Less cars only comes about in extremely bad down-turns, political crack-down or deprivation (how many cars in Gaza and where can they go?), hyper severe Gvmt. regs. or just general chaos, such as war.
http://www.bfs.admin.ch/bfs/portal/fr/index/news/publikationen.Document....
Thanks for your points!!
I you had anymore data about CH, could you please emailing me? marco.bertoli78atgmail.com
I'd like to elaborate them
Am I missing something?
It would seem obvious that the stagnation in average wages since the 1970's was caused by the enormous increase in the % of women who work. Average household wages are what's important, and they've gone up almost as quickly as overall GDP.
I kept expecting women's labor force participation to be mentioned, either in the article or the comments. It looks to me like the correlation between average wages and average gasoline consumption is spurious - a false correlation, caused by coincidence.