| BP's Deepwater Oil Spill - Is the Well Dead Already? - and Open Thread | The Oil Drum | Drumbeat: August 14, 2010 |
This Week in Petroleum (TWIP) for August 11th
Posted by Heading Out on August 13, 2010 - 10:30am
Before the Deepwater Horizon incident I would follow the EIA weekly announcements known as This Week in Petroleum and occasionally comment on what I thought to be important. At the same time, trying to discern how the economy was improving, if at all, I would look at the data from the FHWA on the vehicle miles travelled, and include that each month. For a variety of reasons it looks as though I haven’t done that since February at which point the US demand for gasoline was falling below that of a year ago, inputs to refineries were below that for 2009, and the VMT (which appears three months later) were showing that November numbers were somewhat more positive.
So with this 6-month hiatus, and being now towards the end of the summer driving season, how have things progressed?
In terms of the demand for gasoline, this is up close to 200,000 bd over last year:
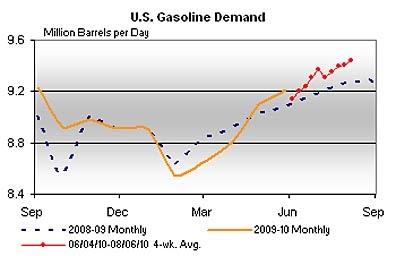
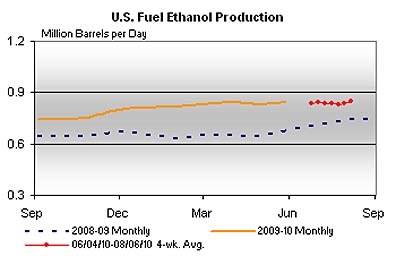
Just to see how it progresses over the next few months, as corn and grain prices may rise due to the problems, inter alia, in Russia I am going to add the ethanol production curve from TWIP to the mix I will look at.
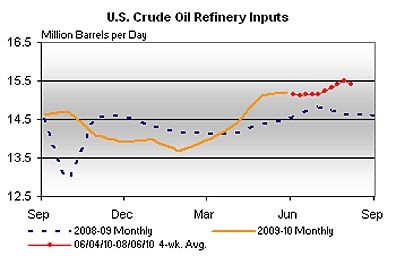
Gasoline comes from refineries, and looking at the input to those refineries, this has been increasing, relative to last year, though it may have peaked, a little later than last year, for this season.
Domestic production of crude remains quite flat, and for the next couple of months may depend on how relatively calm the Hurricane season remains, remembering that it was predicted to be more severe than usual.
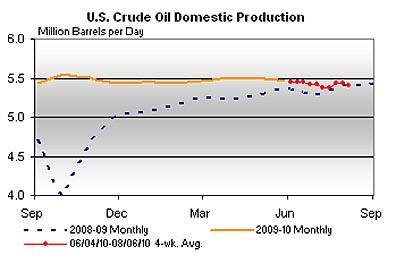
Which means that the increase in demand must be met by increased foreign imports, which is what is being reported.
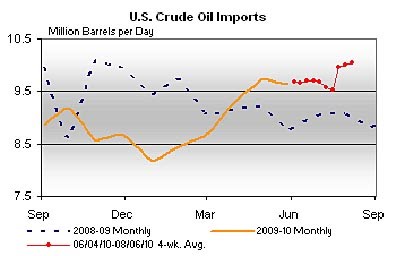
The increase in imports indicates that there is a growth in the economy that it is rising to meet, and this is recognized in the Short Term Energy Outlook that the EIA released August 10. They anticipate that, overall, demand will rise by 140,000 bd this year, and by 170,000 bd next year.
With the global economy also growing, the question arises as to where this oil will come from. The EIA notes that while non-OPEC production is expected to rise by 0.72 mbd (million barrels a day) this year (based largely on increased production from the USA, Brazil and Azerbaijan) it will drop by 0.16 mdb next year (mainly due to falls in production in the North Sea and Mexico). Which, with an overall estimate of world demand growth being 1.6 mbd this year, and 1.5 mbd in 2011 raises the reasonable question as to where it is going to come from.
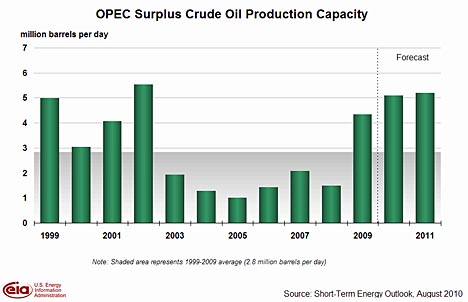
The only answer is OPEC (which, as I’ve mentioned before, is why it is their production which is now controlling the price of oil). The EIA see their spare capacity as being around 5 mbd. I personally think this is about twice the real value, but that is a discussion for another day. (But if the growth rate continues for 3 more years it may well be consumed.)
So will growth rates be sustained? Well, the main story at the front of the TWIP this week was on the rising demand for jet fuel, for the first time since 2007, and having just come from a total of 3 flights that were all “full to the gunwales” the demand for travel may be picking up.
But if one goes back and looks at the VMT for May, that recovery that I was beginning to see in February, hasn’t continued through the spring, but rather reached a plateau. We will have to wait a couple of months to see whether that number has picked up as well as the air travel.
Contact
- Content: editors at theoildrum dot com
- Tech support: support at theoildrum dot com
License

This work is licensed under a Creative Commons Attribution-Share Alike 3.0 United States License.
13/8/2010
Saudi Arabia lost production share to Russia
http://www.crudeoilpeak.com/?p=1800
11/8/2010
Australian election 2010: next phase of peak oil ignored
http://www.crudeoilpeak.com/?p=1763
Many thanks, Heading Out. With the oil spill and everything, we haven't been watching TWIP too closely.
One TWIP graph that I thought was particularly interesting (in addition to the ones you show) is the distillate demand graph.
My interpretation of the graph is that distillate demand (mostly diesel, but also some home heating oil) is falling rapidly. The two demand lines on the graph (the orange one and the red one) do not connect up well for distillates, because distillate amounts have a lot of re-export amounts in them (because Mexico, for example, cannot make low emission diesel, and depends on us to process its oil to do this--we also export diesel we don't need to other countries), and the weekly data doesn't estimate these well. Mentally, I connect the two lines--my guess is that the weekly numbers are probably high, and would connect up with the monthly numbers, if properly stated. If this is the case, recent properly-stated distillate amounts may be below last years'. But we will need to wait until monthly data is out to find out for sure.
If distillate consumption is dropping rapidly, this could be an indication of a business slowdown in the third quarter.
This is a graph of total twenty foot equivalent units or "TEU"s, the standard size bulk shipping containers we all are familiar with, handled at the Port of Long Beach; and No. 2 Distillate supplied for PADD 5. This is a post of mine from March showing a graph of the same TEU data plus California on road diesel supplied - this tracks better but the EIA only have numbers up through mid 2008, for spurious confidentiality reasons. That post also has links to more info on TEUs as a leading indicator of economic well being. From the looks of things globalization is chugging along nicely for the time being, meaning increased demand for diesel.
I must comment here. My business is picking up containers from the port of NY(NJ actually :) ).
Mind you, I've been something of a perma-bear the last five/six years or so. Well, since I stumbled upon the concept of peak oil anyway.
For the last 15 months or so all we've been hearing from the noise machine of the MSM is "green shoots" and "recovery", which was mainly a bunch of BS. Since April, which juxtaposes nicely with the last leg up of the blue line, my average weekly billing has increased about 40%!!!
Now, for one or two or three weeks one would just consider this a blip but we're going on four months now. And it was very sudden, like throwing a switch. I've been picking the brains of my customers and other draymen(drayage is the specific form of trucking into and out of the piers) and most have been completely in agreement with this. I actually had to turn down work several times recently and a few months ago that would have been inconceivable. Other truckers also.
Ironically, a year ago we were hearing all this green shoots talk and things were total kaka. Now the official govt stats have turned south for the last couple months and if I believe my eyes I have to say there has been a real rebound going on under the surface.
I don't know if this means anything, the future will tell, but it is the first real positive news to me since the depression began.
Thanks for the reply. That's weird how real rebound would be under the radar. Check out my graph in that other post if you haven't - diesel=TEUs, just like gasoline=VMT. The correlation is quite strong, in the above graph it's merely firm I'd say. All I pay attention to are solid trends like these; rest is noise. How many flip flops on the economic outlook have we heard this year? With attendant velocity in energy prices.
All of this uptick could be largely stimulus driven, of course, hence fleeting. Perhaps new job losses will eventually bring down shipping through decreased demand, although what's to say that won't take years to unfold? It's quite bizarre how BAU keeps staggering along; I'm always picturing a motor with smoke coming out of it. Maybe we'll come through this with just a ding in a piston or two.
If you look at business borrowing esp junk bonds.
http://globaleconomicanalysis.blogspot.com/2010/08/junk-bond-indigestion...
http://globaleconomicanalysis.blogspot.com/2010/08/are-corporations-sitt...
You have your answer. In my opinion a lot of the economic pain from the 2008/2009 crash was artificial many valid business needs for credit went unfunded for a time. Letters for credit withdrawn. Credit lines frozen and short term lending stopped in its tracks. This created a bit a back log and also has resulted in companies taking on credit while they can once markets thawed. A good bit of the result is simply bounce back from and overshoot collapse of the credit markets and also of course now and overshoot condition. Businesses are a a real sense stocking up to weather the storm many I suspect fully expecting a return to tight credit conditions. And everyone with the financial ability wants to be the guy owing the bank billions not millions. The moral hazard situation right now is tremendous.
Got deep into debt stock up and get your bailout when things go south.
If I'm right expect what your seen to dry up as suddenly as it started. Probably rapidly once the credit spigot is finally forced off.
The consumption side is probably just not there so this channel stuffing is almost certain to result in significant oversupply in the coming months collapsing prices esp as the weaker companies go into bankruptcy. In short its going to make things worse not better.
Even if the governments manage to keep the credit lines open I don't think it will do much good this time around as everyone will find themselves with way to much inventory and no way to clear it and thus simply no need for credit.
In short a lot of business's are stupidly fighting the last war if you will which was a fast financial collapse and will find themselves in bad shape for whats probably on its way which is simply no buyers at any price.
Perhaps you will find yourself loading all the stuff you unloaded the last several months back onto ships to be sold in emerging markets for rock bottom prices. I'd not be surprised in the least to see a lot of the excess inventory rexported.
The upticks on KLR's graph look a bit like the "hope rally" stock peaks in these graphs on TAE yesterday:
http://theautomaticearth.blogspot.com/
Folks will always attempt a desperate return to BAU profitability, clawing their way upslope for a while and causing a new (though lower) peak.
Well, since OPEC is supposed to be the answer I beg do discuss it on this day.
I personally think OPEC spare capacity is somewhere between 1 and 1.5 million barrels per day. I base this on the fact that when oil prices were at their highest point in July of 2008, every OPEC nation was producing flat out.
And by flat out I mean they were then producing every barrel they possibly cold. then late in 2008 the call went out for all OPEC nations to drastically cut production. And they all did, but some more than others. Since then 9 OPEC nations have returned to producing every barrel they can. Three OPEC nations still have some spare capacity though depletion has undoubtedly cut into their production ability.
Saudi has added Khurais which is producing about half what they originally planned or about 600 kb/d. But Saudi's old fields are declining fast and that addition has probably been used up by depletion. Anyway here is one of the charts I keep on OPEC. The "Flat Outs" are Algeria, Angola, Ecuador, Iran, Iraq, Libya, Nigeria, Qatar and Venezuela. 'The Rest" are Kuwait, Saudi Arabia and the United Arab Emirates. The data if from January of 2005 thru July 2010. In thousands of barrels per day.
Notice that the nine "Flat Outs" peaked several months before July of 08 and were already in decline when the price of oil hit $147 per barrel. You can draw a line through that decline and it intersects today's production.
I think it is obvious from this chart that any spare capacity must come from the three nations, Kuwait, Saudi and the UAE. They just might manage to produce an extra 1.5 mb/d and get back almost to where they were in July of 2008, but I seriously doubt it.
The data is from OPEC's Monthly Oil Market Report, the latest issue is out today.
Ron P.
Ron:
Thanks for the ref, the new report has quite a bit of difference from the EIA prognosis. They see a slower growth in demand (1 mbd for 2010 and 2011) and that non-OPEC can meet more of it - o.8 mbd this year and 0.3 mbd next year). That would reduce demand on OPEC production. Be interesting to see which forecasts are the more accurate.
Yes, I expect their predictions for 2010 to be pretty close. Of course we are already over half way through 2010 so they should be close. But I find the EIA's predictions for non-OPEC liquids quite interesting.
Table 3b. Non-OPEC Crude Oil and Liquid Fuels Supply (million barrels per day)
They are predicting non-OPEC liquids to drop by 160 kb/d but OPEC non-crude liquids to increase by 680 kb/d, thus non-OPEC liquids + OPEC non-crude to be up by 580 kb/d. That is a 12.55 percent increase in OPEC non-crude liquids! But then they, according to the EIA anyway, had a 13.39 percent increase in 2009, a year when their crude production was down significantly.
The reason non-crude liquids are growing so much is because these are not covered by quotas. So they will produce every barrel possible. But this means that their natural gas production is increasing. But I don't track natural gas production so I don't know how much OPEC natural gas production has increased, or is expected to increase next year.
Anyway, the EIA is predicting that non-OPEC liquids peak this year. I think that is significant.
Ron P.
I wonder why Kuwait, Saudi Arabia, and UAE are producing lower--I am skeptical that it is just to keep the prices up for everyone else. I am not the one that knows the details. One guess is that they are waiting for prices to be higher to pump it. Another is that they really have reasons to keep it off line--perhaps they were having troubles producing the amounts they were earlier.
When I look at Kuwait, it depends very much on production from Burgan--half of its production is from this one field. They are undertaking a big program to add new production in the north part of the country. Why would they be adding all this production capacity, if they are not producing at capacity now--it seems strange.
Saudi Arabia recently brought Khurais on board. This should have increased production, but it is hard to see that it has.
Anyone else have thoughts about this?
I don't know but I have my suspicions. I believe that all three were straining to keep production up in 2008 and saw a huge drop in production coming. They welcomed the chance to cut production in order to work over their old wells. At any rate they needed a rest period and a deliberate cut in production would squelch any rumors that they were actually in decline.
I do not believe these three will ever get back to their July 2008 production. But no doubt they could produce more than they are producing right now. How much is just a guess and I have already gave my guess to be somewhere between 1 and 1.5 mb/d. But this spare capacity is disappearing rapidly. By mid to late 2012 it will all be gone. Or at least that is my opinion.
Ron P.
and your evidence of this disappearing capacity ?
Elwood, you have not been paying attention. I have been posting URLs on Saudi for several years that show their decline rate. Here is what one ARAMCO Vice President says.
But a few years ago they managed, by infield drilling of horizontal wells, to get their decline rate down from this average of 8 percent to just above 2 percent.
But that was in 2006. Infield drilling can get the decline rate down from 8 percent to just over 2 percent for only so long. And remember while with these horizontal wells they got their decline rate down by almost 6 percentage points they increased their depletion rates by as much. This means that when the water hits these new horizontal wells the decline rate will be much greater than 8 percent.
And that is just Saudi. Virtually all other OPEC nations have similar decline rates. Iran for instance:
It seems that all the old fields in the Middle East have a natural decline rate of 8 to 12 percent. Heroic efforts are being taken to keep the decline rate down. But in doing so they are increasing the depletion rate. And when that fact hits home it's light out, or damn near so.
Ron P.
ok, you posted many urls on decline from existing fields. is that the extent of your evidence ?
how 'bout some of the megaprojects ?
http://www.aramcoexpats.com/Articles/Pipeline/Saudi-Aramco-News/Industry...
http://www.entrepreneur.com/tradejournals/article/169325389_1.html
Elwood, most of these projects are downstream projects. And the few upstream projects are mostly many years old. That is the effect of their production is already stirred into the mix. Only Khurais is recent.
But all in all it is really only my opinion. I have never claimed that I have hard evidence. No one has because Saudi is so secretive. We all know that all the old fields, the lions share of production, is in steep decline. After all when an Aramco Vice President says as much you have to think that carries some weight.
Saudi, the UAE and Kuwait are running out of new projects. Iran has already ran out of new projects. Iraq has let out bids that are supposed to dramatically increase the production from their old declining fields. Many doubt that they will really see that much increase.
Anyway if you think OPEC has 4 to 6 million barrels of spare capacity, I would like to see your evidence. I know you can show me where the IEA or the EIA says as much. But that is the point of contention.
Ron P.
many of the projects are recent with completions or expanisons going on through 2011.
Manifa Field Development (2006–2011)
Under the Manifa program, Saudi Aramco plans to install central facilities at Manifa to process 900,000 barrels per day of Arabian Heavy crude oil. The Manifa Central Processing Facilities (CPF) will include gas and oil separation, wet crude handling, gas compression, gas conditioning, crude oil stabilization, produced water disposal and water injection facilities. The CPF will be designed to process 900,000 bpd of crude oil; approximately 120 million scfd of associated gas and 500,000 bpd of hydrocarbon condensate will be produced by this crude increment.
manifa's crude oil gravity averages around 28 deg api, not arab light, but not cantarell either.
Right, but whatever link you quoted from is way out of date. Manifa was put on hold when the price of oil collapsed in 2008 and has only recently been revived.
Manifa will start production in early 2013 and not reach full production before 2024.
I keep up with these things Elwood. You should try it too. It is great fun, especially if you are retired like I am and have nothing else to do.
Ron P.
so then you meant to say that spare capacity was temporarily disapearing ?
if you are keeping up with these things, how did you completely miss the expansion of deep gas/condensate production at ghawar,etal,khuff, etal ?
frankly, i wonder why it took me and seemingly everyone else on tod to so long to understand the significance of deep gas/condensate production and resources in ksa. i am expecting any day now someone will come in and claim that they were aware of the potential for deep gas/condensate resources in ksa all along.
this one is not off the press yet:
Stimulating Khuff Gas Wells with Smart Fluid Placement
http://www.onepetro.org/mslib/app/search.do
Elwood, I can understand why Saudi is trying to produce more gas. They desperately need the gas because they are currently burning very high priced oil in their power plants and desal plants. Yes they are shifting oil rigs to gas rigs. The reason is that they desperately need the gas. More gas means less oil burned and more oil they can sell.
The old fields are so full of holes now that more holes will not yield that much more oil. So why not use the rigs where they can give their best return? That is just common sense. And for the life of me I cannot understand why you think this is big news?
Ron P.
up to 250 gb condensate in place in ghawar permian khuff and older rocks not big news ?
what would qualify as big news ?
ok, you don't believe the calculation, right ?
you will have to read my previous posts on the subject to begin to understand, briefly:
1) the permian khuff of ksa is analogous to the permian khuff of s. pars/n. dome of iran/qatar.
2) the permian khuff underlying the cretaceous arab d at ghawar is as large or larger than arab d production area in ghawar.
3) the condensate yield in ksa is up to 10 times that of s. pars/n. dome.
4)assume the characteristics of ghawar permian khuff are similar to s.pars/n. dome, the permian khuff at ghawar could contain up to 250 gb condensate.
what part of this don't you believe/understand ?
you still don't believe it because ksa is still burning oil for electrical generation ?
try this. was rome built in a day ?
the oil industry in ksa got about a 40 year head start on the gas industry. for most of these 40 years gas was almost a nuisance and much of it was flared or vented. exploration for gas in ksa didn't get any real boost until.......drum roll please.....the discovery of n. dome in the early '70's.
this has all been posted previously.
if you cast off those doom colored glasses, you too may see.
it seem impossible for you, darwinian, to understand something if your pre-concieved ideas depend on not understanding it.
go ahead, question my calculations, but please don't try to trivialize my arguments by saying:
that is an old trick, at least you could try some new tricks.
Elwood, as long as you continue to make such beyond the pale silly statements, no one is ever going to take you serious. 250 gb is really about two to three times the recoverable crude oil remaining in Saudi Arabia. They do have some gas but not nearly as much as they would like to have. Not even as much as tiny Qatar. And the amount of condensate in gas is only a fraction of the totally energy content of the gas.
The world's largest gas/condensate field, the South Pars / North Dome Gas-Condensate field that sits directly straddle the Qatar-Iranian border in the Persian Gulf, holds about 50 billion barrels of condensate. And you continue to suggest that the pockets of gas in Ghawar holds 5 times that amount. Good God man, that is beyond the pale.
Notice that the field holds about one billion barrels of condensate for every one trillion cubic meters of gas. If the condensate in Ghawar is the same proportion, this would mean that they have 250 trillion cubic meters of gas or five times the gas in the world's largest gas field. How is that possible? If they have that much gas then they can produce electricity and fresh water for the entire Middle East for a long, long time in the future.
Ron P.
Possible, the size of fossil fuel fields follows a power law that suggests that there may be one field of ten times the size for every ten fields of equivalent size. So if there were about 10 fields of 50 trillion cubic meters in the world, probabilities would say that one of 250 was possible. This goes for discovered and yet to be discovered fields.
This is just a natural result of entropy considerations of growth rates and dispersion and the only mitigating circumstance is that a field of that size was not given enough time to grow on a geological time scale.
Possible if there were ten 50 trillion cubic meter fields in the world. But thar aint! Your theory is pretty close but the one largest is South Pars/North Dome averaging 11.5 times the size of the next 10. There is no larger field in the world.
World largest gas fields
So you see Web, South Pars/North Dome is five times as large as the second place field and 10 times the next, almost 18 times the 10th place field and 62 times the size of the 20th largest field. Notice that Saudi Arabia does not have a single field in the top 20.
The original Wiki article on South Pars/North Dome says the field holds 1800 trillion cubic feet but I will not pit one Wiki article against another. ;-) But I suppose the uncertainty here is quite large.
The very idea that Saudi has a field five times larger than the largest documented field in the world is absurd. But then no one knows about this huge field except Elwood. Perhaps he can email them and inform of this fact. ;-)
However Web, your post was interesting but you need to google for facts before you post such things again.
Ron P.
Yet, I have been one of the few people that have actually been doing the analysis of oil field sizes and I just never got around to doing it for NG. Cripes, I pointed out the fact that the 1 times ten rule of entropic growth should hold and then you go ahead and dig out the data that supports my conjecture. So I take your scolding as a gentle ribbing to my great skills :)
Still, I suggest that we plot out the entire set of field sizes before we make too many more claims. One of the problems on fat tails is that the tails may be fat but the few data points available make it susceptible to statistical noise and you can never assert anything until you do as complete a data reduction as possible.
That's one thing that we all should learn from Taleb and The Black Swan.
In any case, here is the rank histogram for the incomplete Wikipedia data (which I just made with my great Google skills)

Your call if we can squeeze more supergiants in the chart. Remember, we are not done discovering all the gas fields in the world and should we discover more in ~100 Tcf and under range it would mean the likelihood of more fields 10 times that size.
darwinian may have succeeded in debunking his misunderstanding of what i have said.
based on the figures i have posted, ghawar permian khuff may contain 1600 tcf or about 45 tcm. darwinian is operating on the assumption that the condensate content of the gas in s. pars/n. dome is the same as in ghawar permian khuff. the condensate content of the gas in ghawar is up to ten times that of s. pars/n. dome. (as documented in the spe articles linked below).
it would seem that a person can make all kinds of dopey mistakes by assuming darwinian know what he is talking about.
Statistically, I don't see anything that would totally discount the possibility of an uncounted large field. If we found one 1200 TCF then one 1600 TCF isn't inconceivable, but I would predict that the odds of finding many more that size would fall rapidly. We could easily change the Wikipedia entry to reflect this data if you think the research is solid.
I get your point on the relative content argument which does sound intriguing.
i have never made any claim that the 250 gb of condensate that could be in place in ghawar permian khuff are proven reserves. that would take years of drilling and many simulation studies to even design the sour gas processing equipment. after that, the equipment would need to be built and installed to move these reserves into the proven catagory.
aramco is steadily going about this process, but as i have pointed out before, rome wasn't built in a day. darwinian wants to debunk my statements by making them seem outrageous when in fact it is clear that he doesn't even understand what i am talking about.
this discussion came about because some on here are absolutely convinced that "aramco is lying" and no other explaination is possible. if aramco indeed has a ghawar sized permian khuff gas resource, they can pretty much recognize reserves whenever they want.
and indeed, if "aramco is lying" why assume that they are overstating and not understating their reserves.
no thank you, i don't have any desire to make the claim on wiki of what ghawar permian khuff proven reserves are. at one time the claim was made on wiki, that the haynseville shale of la and tx held 250 tcf reserves, making it, i believe the 4th largest gas field in the world.
You say Ghawar has 250 billion barrels of condensate, Euan says perhaps 250 million barrels of condensate. You estimates, according to Euan, are 1000 times what the figure should be. Seems like I am not the only one who thinks your statements are outrageous.
Ron P.
yeah, and not the only one who hasn't bothered to read or understand what i have linked over and over. for if you had, you would have no doubt caught this gem about the qatif field,
qatif is not even part of the ghawar permian khuff complex and contains 200 million barrels of condensate in place. this is a minor accumulation of condensate. so how accurate is that 250 million barrel figure ? i don't know what euan is talking about and apparently niether does he.
the condensate yield of qatif is 12 bc/mmscf. the yield for s/pars/n. dome is about 28 bc/mmscf and gahwar permian khuff is from 30 to 300 bc/mmscf.
you see darwinian, all gas condensate reservoirs aren't created equal.
ok, disprove it. disprove it point by point, not just with your lame attempts at trivialization.
no 250 gb is a little less than ksa's currently recognized reserves. reserves are recoverable amounts of oil or gas(period). oil in place is just that,oil in place.
now we are making progress.
i am not suggesting anything. i am stating that ghawar could contain 250 gb condensate.
and how is that possible ? easy, the condensate content of ghawar is up to 10 times the condensate content of s. pars/n.dome. that is the part you seem to be having trouble understanding. read the spe articles i linked to.
you seem to be stuck on the idea that gas/condensate is gas/condensate and that the condensate content of ghawar is the same as the condensate content of s. pars/n. dome. i have a news flash for you: it ain't so and you could educate yourself.
again, educate yourself.
by my calculation, ghawar permian khuff could contain 1600 tcf of wet gas -vs- 1800 tcf in s.pars/n.dome.
ask me about ksa's 280 tcf of recognized reserves, and i will gladly whack you on the head on that too.Elwood read my reply to Web above. Saudi does not have a gas field in the top 20. They do not have a gas field that has even half a trillion cubic meters, let alone the 35 to 50 trillion cubic meters of the Qatar/Iran field. The gas, and consequently condensate, in Ghawar is absolutely peanuts when compared to the other giant gas fields of the world.
And read Euan's post below.
Nuff said.
Ron P.
maybe there is hope for you, at least you appear to understand - stop digging.
there, you may have succeeded in debunking your misunderstanding of what i have said.
Yes, Elwood - Khuff gas and condensate have been well documented here in the past and included in Aramco mega projects lists. Maybe its 250 million bbls - I can't remember the details, but its nowhere near the figure you quote.
just one of the fields discussed in the links posted below is reported to contains 200 million bc. you really need to come up to speed to understand what i am talking about.
don't you know better than to make a statement like that without facts, links, documentation, after all,this is the oil drum. and after reading the linked articles, feel free to discuss in an informed manner.
and exactly what figure are you alledging that i quote ?
to clarify, what i claim is that ghawar could contain up to 250 gb condensate.
again, i beg leanans forbearance in posting these extensive links, but here goes anyhow:
a study of ghawar permian khuff condensate has to start with the south pars/north dome field of iran and qatar:
http://en.wikipedia.org/wiki/South_Pars_/_North_Dome_Gas-Condensate_field
you are probably aware of this aapg article:
Ghawar: The Anatomy of the World's Largest Oil Field*
http://www.searchanddiscovery.net/documents/2004/afifi01/index.htm
Figure 1 shows the khuff permian gas reservoir covering nearly all of ghawar.
and a pdf showing the figures from the aapg article:
http://www.searchanddiscovery.net/documents/2004/afifi01/images/affifi01...
and of course, greg croft has this available for $850 which has a section on the permian khuff.
The Ghawar Oil Field, Saudi Arabia
http://www.gregcroft.com/ghawar.ivnu
here are three articles discussing khuff gas condensate in place in a general historical sense:
Khuff Gas Condensate Development
http://www.onepetro.org/mslib/app/Preview.do?paperNumber=IPTC-10692-MS&s...
“This paper addresses some key reservoir and production issues related to gas and condensate recovery from Khuff reservoirs in the Middle East – namely Ghawar Khuff, North Field and South Pars. These fields represent somewhere between 1,000 and 2,000 Tcf initial gas in place , with 30 to 70 billion barrels of condensate in place.”
[1]1 Potential Petroleum Resources of the Paleozoic Rocks of Saudi Arabia)
http://www.onepetro.org/mslib/app/Preview.do?paperNumber=WPC-24101&socie...
“Although these `retained areas' constitute only about 15% of the sedimentary basins of Saudi Arabia, they include 255 billion barrels (40 Gm3) of oil and 181 trillion cubic feet (5.1 Tm3) of gas, or 27% and 5% of the world's oil and gas reserves, respectively (Tartir and Shamlan, 1990). The first Paleozoic hydrocarbons were….”
Paleozoic Gas Exploration in Eastern Saudi Arabia during the Last Decade
http://www.onepetro.org/mslib/app/Preview.do?paperNumber=WPC-30102&socie...
from there, we move on to the condensate content of ghawar permian khuff and devonian jauf:
Modeling a Rich Gas Condensate Reservoir with Composition Grading and Faults
http://www.onepetro.org/mslib/app/Preview.do?paperNumber=00068178&societ...
“The Hawiyah Jauf Reservoir is a complex structural-stratigraphic trap located along the east flank of the uplifted Ghawar structure. The two important aspects of this reservoir are fieldwide composition variation and reservoir compartmentalization. The reservoir fluid samples obtained during developmental drilling show remarkable differences in fluid properties and condensate yields. The condensate yield of collected samples varies form more than 250 STB/MMscf to less than 100 STB/MMscf, and the reservoir fluid at the gas-water contact exhibits the near-critical behavior. Furthermore, the complicated fault system subdivides reservoir into several major compartments.”
Quantifying Production Impairment Due To Near-Wellbore Condensate Dropout and Non-Darcy Flow Effects in Carbonate and Sandstone Reservoirs With and Without Hydraulic Fractures in the Ghawar Field, Saudi Arabia
http://www.onepetro.org/mslib/app/Preview.do?paperNumber=00077552&societ...
“As the gas bearing formations are found across the greater Ghawar area, the gas quality varies considerably from North to South. The condensate yield varies from 30 bbl/mmscf for lean gas to 300 bbl/mmscf for very rich gas. Lean gas has been in production for more than a decade. Gas from condensate rich reservoirs has entered the production stream recently.”
Compositional Grading in the Ghawar Khuff Reservoirs
http://www.onepetro.org/mslib/app/Preview.do?paperNumber=00049270&societ...
“It was found that both condensate content and hydrocarbon compositions decreased with depth and/or temperature while acid gas composition increase with depth. The composition of hydrogen sulfide varied from zero, at a threshold depth and temperature, to over five mole percent at greater depths. The observed variations of composition with depth were contrary to what would be expected from gravity-chemical equilibrium considerations.”
It doesn’t appear that much is published about basic reservoir properties except many references to the variability of rock porosity and permeability.
this one gives pressure and temperature estimates for jauf and khuff formations in the ghawar area:
Sensitivity Study On Geomechanical Properties To Determine Their Impact On Fracture Dimensions And Gas Production In The Khuff And Pre-Khuff Formations Using A Layered Reservoir System Approach, Ghawar Reservoir, Saudi Arabia
http://www.onepetro.org/mslib/app/Preview.do?paperNumber=00072142&societ...
“The reservoir is deep with an initial pressure of 8,750 psi and temperature of 301° F. The fluid gradient is on the order of 0.15 psi/ft.”
“Khuff reservoir in South Ghawar, Saudi Arabia is a heterogeneous tight carbonate formation. There is a wide variation in formation permeability and porosity within 100 to 200 ft of formation thickness. The formation constitutes mainly of dolomite and limestone with streaks of anhydrites that act as non-producing sections and possible barriers. The reservoir pressure is on the order of 7,500 psi with a fluid temperature around 280° F.”
this one from october, 2007 gives an overview of some of the gas condensate projects going on in ghawar:
SAUDI ARABIA - The Arab Light Producers - Ghawar Group
http://www.entrepreneur.com/tradejournals/article/169325389_1.html
and here is saudi aramco’s discussion of their mega projects, june 2008
Saudi Aramco's Mega Projects
http://www.aramcoexpats.com/Articles/Pipeline/Saudi-Aramco-News/Industry...
and ironically, my first knowledge of ghawar permian khuff is contained in this link:http://www.theoildrum.com/node/2456/179010
from april, 2007. i ran across it in a google search for 'ghawar permian khuff condensate'.
it seems "bunyonhead" brought up some articles about ngls in south ghawar. there seemed to be some confusion about whether this was refering to ngl or lease condensate.
Thanks for the links, it s been a long time since I read most of this stuff. Here's my links:
Saudi production laid bare
GHAWAR: an estimate of remaining oil reserves and production decline (Part 1 - background and methodology)
GHAWAR: an estimate of remaining oil reserves and production decline (Part 2 - results)
Ghawar reserves update and revisions (1)
I'd also point out that for the greater part of my working life I worked on reservoir connectivity, conducting studies for over 60 companies world wide, including Saudi Aramco.
I also gave a talk on Saudi Oil Reserves at the ASPO conference in Houston - damned if I can find the link to the talk.
I could give you a 60 minute talk on the challenges of producing retrograde condensates - but I can't be bothered.
----
Forgot to say that you are observing that the Khuff reservoirs are thinner, discontinuous and have poorer reservoir properties than the overlying Arab D (which is a truly world class reservoir) whilst at the same time suggesting they contain more hydrocarbon liquid - go figure.
i could too. - aramco is doing the modeling runs to optimize the recovery shcemes. i have never claimed that this is easy oil, it is not deep water or nanodarcy rock or bitumen either.
and higher pressure and possibly lower water saturation and lower viscosity too. i don't get the sense that khuff is necessarily lower pososity, but certainly more heterogeneous. i have seen references to 5 to 30 % porosity.
one of the paleozoic reservoirs aramco is exploiting in s. ghawar is reportedly an unconsolidated sand.
my guess is that some of these compartments are not water driven. given the right recovery scheme, the recoveries could approach 90 %. water driven compartments would be more challenging but could also exceed 70% recovery.
qatar is looking at about 35% recovery of the condensate and 70% of the gas in place - but qatar is not recycling and i take it, n. dome is also water driven.
i had an opportunity to work on a proposal for cycling n. dome (with no gas sales) way back in the early '80's. we concluded that there was not enough data to even make a proposal. qatar has elected to sell the gas as lng and recover their 35% of condensate.
qatar may also be looking at recycling. qatar put a moritorium on new gas export projects to allow them to study recoveries. i don't know the status of the moritorium.
at least we are getting somewhere here but i don't think it is in tod's or anyone else's interest to just ignore this significant resource. i would like to know how extensive the condensate in place is too.
thank you for the reply and possibly getting this discussion off dead center.
It is in no one's interest to ignore any fossil fuel news coming out of the Middle East. However when one wildly exaggerates the quantity of any resource it serves only to turn people off and leads them to take with a grain of salt anything that person writes about anything in the future.
Wild and silly exaggerations not only diminishes the credibility of the person making such claims but it also diminishes the credibility of the list as a whole. That is why it is very important for people with far more knowledge on the subject, like Euan Mearns, to quickly debunk such wild exaggerations.
Ron P.
you have never offered anything that would actually debunk anything i have said. so if you have anything -bring it.
in the old days we would say: "your ass is hanging out" when someone made a statement based on a lack of knowledge.
you have no idea of what my knowledge on the subject is - your ass is hanging out.
He he. You get funnier every day. The problem Elwood was you claimed that Ghawar contained 250 billion barrels of condensate. Common sense dictates that this claim is totally absurd. Well, anyone with an ounce of knowledge about fossil fuels anyway would realize what a totally absurd claim that is.
Extraordinary claims require extraordinary evidence.
You have made a claim that no other person with an ounce of knowledge about oil and gas reservoirs would make. No, by God I will not bring evidence to show that this very silly claim is absurd. You made the claim, a claim so extraordinary that it must be supported by extraordinary evidence. You have not done that. You have just made very stupid statements about someone's ass hanging out.
Well, what the hell could I expect from a person who made such an absurd claim?
Ron P.
i claim that gpk could contain up to 250 gb condensate. i have seen nothing to indicate that statement is inaccurate.
all your misunderstanding, misinterpretation and obfuscation on the subject won't change that, but i do enjoy watching you flog yourself, so please continue.
Elwoodelmore, u been around here a long time. It seems like you have sound technical knowledge, but yet claim 250 Gbs condensate in Khuff of Ghawar (resource or reserve?) and lay down a challenge for that to be disproven. The Arab D in Ghawar forms a continuous blanket across the structure beneath a thick, perfect sealed, anhydrite.
My mental picture of Khuff is that it as a formation will occur as different facies across the Ghawar area, but has multiple traps - much, much smaller than Ghawar itself. The saudis we know are short of nat gas and have been trying to produce from Khuff for decades. Joules Burn I believe is able to distinguish between Khuff gas wells and oil production wells on Ghawar. Reading between the lines, I'd guess that Khuff wells perhaps die early owing to compartmentalisation and liquids dropping out in reservoir killing rel perm. As you know, cycling is the only way to overcome this, but to cycle gas condensates you need sufficient lateral connectivity between your producers and gas re-injection wells. No doubt they will find some pockets / sub-structures that enable this. But these IMO are more likely to be normal sized fields, not the super super giant you propose.
If you find any SPE papers on Khuff upload them and post them here. I just don't have time to follow this up right now.
my claim is and has been that ghawar permian khuff(gpk) could contain up to 250 gb condensate in place.
my approach was rather crude, i took the gross area of ghawar, divided by the gross area of s. pars/n. dome(sp/nd), multiplied by a wag average condensate yield for gpk (160 bc/mmcf) and divided by the condensate yield for sp/nd(28 bc/mmcf).
a crude approach, but no one has come forth with anything more refined (only that my statements are outrageous, beyond pale - you get the idea).
i have also proposed a monte carlo simulation with the objective of estimating gas and condensate in place, i dont have the resources to do that.
joules burn no doubt has the capability to identify developed areas of ghawar.
i plan to do just that.
A little too crude for my liking. I'm not sure if North Dome reservoirs are Khuff equivalent, but we do know that they are continuous HC filled reservoirs across most of the structure. In Ghawar as I already noted, the actual HC saturated reservoir is discontinuous, with lots of sub-traps and structural complexity. So I don't really think your methodology is valid. Stuart S and I managed to do a lot with the Arab D cos it is a "layer cake" and Greg Croft and others gave us rudimentary reservoir properties. The main problem we had was getting an accurate map and area for the structure.
Take your 250 Gbs max resource. Divide by 10 for actual area of HC saturation in Khuff and divide by 10 again to get recovery from crap, complex reservoirs you get 2.5 Gbs of reserves, maybe.
http://www.searchanddiscovery.net/documents/2004/afifi01/index.htm
Figure 1 shows gas covering nearly all of ghawar.
the sources i have seen put permeability in the range of 10 to 3000 md - not exactly crap, imo. i have never made the assumption that aramco wasn't capable of developing and operating large complex reservoirs efficiently.
i will tally up the published installed sour gas/condensate processing capacity in ghawar and see what that looks like.
edit: installed capacity since 2001 would account for over 1 gb produced. aramco is really just getting started.
really, euan, don't you consider dividing by 100 is a little on the crude side also ?
Well I guess I'd want to be careful to not confuse a secondary gas cap in the Arab D with primary gas condensate in the Khuff.
If the khuff is so stuffed full of gas, why is KSA so short of gas?
yeah, that ground has been covered.
1)ksa's needs are vast.
2)developing sour gas production takes time.
this from an spe paper not off the press yet(spe 131917 to be presented in florence,italy in september,2010):
yes, i see that and suppose that means aramco will have to drill wells closer than 5 km apart !
I completely agree with your analysis of OPEC spare capacity, and in addition, a good portion of that spare capacity is in lower grade oil. Due to some recognition of the lower grades, refiners within KSA and India have made some adjustments or added suitable capacity for lower grade oil. So that 1.5 mbpd spare capacity is usable by refiners fairly indefinitely.
However I doubt that OPEC is willing to provide that extra capacity just now, with prices less than $100. So it remains a bit of a problem just where the oil needed will come from.
Let me also be clear: the EIA and IEA are intentionally understating US and world demand. Simply looking at year to date use in the US, which is already growing twice as fast as their estimates, should make it clear they are not basing their forecasts on reality.
Also on another subject, distillate demand was increasing at a 10% rate earlier this year, so a return to more levels does not mean distillate demand is "collapsing", as one recent media article stated.
No one has commented on my recent contention that the EIA is intentionally understating probable US oil demand in 2010, coming out with a prediction of a 140,000 bpd gain this year when the trend is already about a gain of 400,000.
However OPEC issued its monthly report yesterday and its projections are more in line with mine:
http://www.opec.org/opec_web/static_files_project/media/downloads/public...
So if the EIA can bend the facts, why are we having this calm discussion accepting what the EIA says at face value?
Note that even OPEC itself is not buying into the expected 2011 OPEC output gains that the EIA expects.
It seems fairly intuitive that the economy has a huge momentum, regardless of hardships, and that the demand will tend to stay relatively constant in the face of decline. An object in motion tends to stay in motion and sociological feedback mechanisms are in place to return us to BAU. At this stage we are still dealing with perturbations.
"An object in motion tends to stay in motion ....."...in the absense of politicians.....
Do you have any evidence that Khurais is producing at less than nameplate capacity? This is intriguing: Naimi says No OPEC Boost Until Stocks Fall: Report Asharq Alawsat Newspaper (English)
Yes, keep that output "steady" at all costs. NB: this is dated 30/05/2009 in the article itself but Google News shows it as June 23rd, 2010.
I saw the article a month or so ago but cannot seem to locate it with news.google right now. I will keep searching though.
Ron P.
Posted this link on the U.S. Army's consensus on this topic earlier, but I think you'd like to see it again if you missed it before.
http://www.guardian.co.uk/business/2010/apr/11/peak-oil-production-supply
Dave, I was going to comment on the OPEC spare capacity chart, and see there is already good discussion about this, most of which I disagree with - so this is a contrarian new thread.
The run up in oil price, ending in 2008 is IMO closely linked to OPEC spare capacity << 2 mmbpd. There are those who chose to view this << 2 mmbpd as fiction - and then there are those, like myself, who know that Saudi Arabia has super giant heavy sour crude fields like Safania lying largely idle because there is not global capacity to refine this grade of crude (high S is the problem). KSA, together with Total are now building refineries to correct this imbalance.
High price led to a drilling frenzie (don't have data to hand, but will soon for a post on this) and such drilling frenzie does of course lead to increased capacity.
Ron makes some good observations, but applies false logic:
Not sure what is meant here - but Khurais added 1.2 mmbpd new capacity - fact that it is producing half of that means other fields are throttled back and that Khurais still has 600 mmbpd to give.
Little evidence to support this statement. Its just not possible to apply the traditional view of field decline to Saudi Supergiants that are developed incrementally. Sure Abqaiq, Berri and N Ghawar are declining, but S Ghawar, Shaybah etc are not.
I'm not going to nail colours to the mast and say that there is 5 mmbpd spare capacity in the system, but would go with 5±2.
These IEA figures from Rembrandt today:
May 2010 production 86.78 million b/d
June 2010 production 86.36 million b/d
July 2010 production 87.22 million b/d
My conclusion, if wheels stay on world economy, then we will easily see a new peak in global oil production in the months / years ahead. Peak liquid fuels was 88 mmbpd - we are almost there.
But can the increased capacity--in response to higher oil prices--offset the decline from the older, larger oil fields?
Didn't seem to work for Texas & the North Sea, which accounted for about 9% of total cumulative crude oil production through 2005. The initial Texas & North Sea declines (1972 Texas peak, blue, lined up with 1999 North Sea peak, black):
From 1972 to 1981, US crude oil prices rose at an average rate of 25%/year, and from 1999 to 2008, Brent crude oil prices rose at average rate of 19%/year (EIA, annual prices).
Sam noted that the peak of the North Sea oil fields whose first full year of production was in 1999 or later was in 2005 at about one mbpd, equal to about one-sixth of the 1999 overall peak production rate. We can see what effect these post-peak North Sea Mega Projects had on the total production curve.
And of course, the all time record rig utilization number in Texas was in 1980.
Jeffrey, you know we agree in broad terms, and so this really has to do with details. Back in 2004 / 5 Saudi was barely drilling at all - cos they didn't have to. Your point that drilling frenzie in mature province has little / no effect is well made, but I'd question if that point of maturity has been reached yet in KSA. They still have many productive areas to drill. For example, the vast wet area of Ghawar, its really a question of when they can be bothered to drill that - it does produce a vast water management problem for them though.
Most Oil Patch types in Texas, excluding Hubbert of course, were shocked when crude oil production fell slightly in 1973 after the RRC went to a 100% allowable (except for two fields) in 1972. In any case, my Saudi net export/price analysis follows, but I agree that we are basically arguing over precisely how fast the Titanic is sinking.
Saudi Cumulative Net Oil Exports Versus US Oil Prices
2002-2005 & 2005-2008 (EIA, Total Liquids)
One of the primary contributors to the 2002-2005 increase in cumulative global crude production, followed by the 2006-2008 decline was Saudi Arabia, but let’s look at Saudi net oil exports, which are defined in terms of total liquids, inclusive of natural gas liquids and refined products.
Here are the average Saudi net oil export numbers per day by year, versus average annual US spot crude oil prices:
2002: 7.1 mbpd & $26
2003: 8.3 mbpd & $31
2004: 8.6 mbpd & $42
2005: 9.1 mbpd & $57
2006: 8.4 mbpd & $66
2007: 8.0 mbpd & $72
2008: 8.4 mbpd & $100
Relative to the 2002 net export rate of 7.1 mbpd, in the following three period, 2003-2005 inclusive, the cumulative three year increase in net exports was 1,716 mb, versus a three year increase in oil prices of $31.
But then we have the 2006-2008 data.
Relative to the 2005 net export rate of 9.1 mbpd, in the following three year period, 2006-2008 inclusive, the cumulative three year decline in net oil exports was 841 mb, versus a three increase in oil prices of $43.
Note that in early 2004, the Saudis reiterated their support for the stated OPEC policy of maintaining an oil price band of $22 to $28, and they made good on their promises to support lower prices as they significantly increased net oil exports in the 2003-2005 time frame.
But then in early 2006, they started complaining about problems finding buyers for all of their oil, “Even their light/sweet oil,” even as oil prices continued to increase. Apparently no one thought to ask them in early 2006, as oil prices traded over $60 per barrel, why they didn’t offer to sell another two mbpd of oil for $28 per barrel.
How do you know Khurais actually added 1.2 mb/d of new capacity? Granted there are a lot of thing I do not know about Saudi production capacity but there is one thing I do know! Remember I lived there for five years. But back to what I know. I know they have a tendency to exaggerate everything. They exaggerate their proven reserves, that you can be sure of. And I believe they exaggerate their production capacity. And I believe they may have exaggerated the production capacity of Khurais. And until we have some proof that they are indeed producing 1.2 mb/d I will continue to believe that.
I wrote: "But Saudi's old fields are declining fast." You replied:
Nonsense! Euan you know better than that. I posted a link where an Aramco Vice President stated Saudi fields were declining from 5 to 12 percent per year.. It was reported by Petroleum Intelligence Weekly, one of the most reliable publications in the industry. And I posted another link where an ARAMCO agency stated that via their new drilling program they had gotten the decline rate of their old giant fields down from 8 percent to almost 2 percent.
Does anyone think that just sucking the oil out faster changes anything? Well yes, it does. It dramatically increases the depletion rate. Is this not a concern to anyone? Catton gives the example of being able to fill out bank withdrawal slips much faster gives some people the idea that this increases their wealth. Saudi, and apparently a few others, seems to think that this actually increases the longevity of their fields. No, it does not. It has the exact opposite effect.
And I posted another EIA link which stated that Iranian decline rates are from 400,000 to 700,000 bp/d per year. OPEC consist of 12 nations, 9 of which are producing flat out and declining. New production from Saudi, Kuwait, and the UAE must not only to overcome the decline of their old fields but it must overcome the decline of the rest of OPEC nations whose combined production is declining by about half a million barrels per year.
One more point, that 87.22 mb/d July production of all liquids is not official yet so don't count your chickens before they hatch. The IEA has had to back off their production numbers many, many times. And I do not believe the July numbers will be that great. At any rate August promises to be a huge down month. Russian production dropped considerably in August and the US numbers will be down also.
Ron P.
Ron, had to go to bed. Read your posts a bit more carefully now.
First, in the chart you post showing "Flat Outs" and "The Rest", I think the observation of decline in the "Flat Outs" is a good and valid one - no spare capacity there anymore - have you calculated the decline rate?
So we have "The Rest" (Kuwait, UAE and KSA) that dropped 2 mmbpd in response to crash. Lets say we had 1.5 mmbpd spare capacity in heavy sour pre - crash (noting that Rune does not feel this should count) and 1 mmbpd windfall new capacity from Khurais (when did that come on incidentally?) We end up with 4.5 mmbpd spare capacity assuming that declines are being compensated by drilling and minor new field developements - its time for me to catch up on all the details.
This is really at the heart of the issue, and relates to Jeffry's comment. KSA are not yet at the end of the rope when they can have such dramatic impact on decline simply by drilling. As Jeffry points out, in Texas and N Sea, once decline set in, nothing could be done to arrest it. In KSA there are likely a myriad drilling opportunities in mature areas to arrest decline. 2% is not a rapid observed decline rate. I think infield drilling will provide scope to keep things going for decades in KSA. But the real question is at what cost? If this oil comes at a price higher than OECD can pay, then it technically stays as resource. And we need to remember Saudis need massive margin to pay for state infrastructure.
I understand your comments about Saudis exaggerating, I'd bet on reality lying somewhere between the extremes of views we are discussing - which are not really that far apart in the first place. Fire away, I'm aware of the weaknesses in my math:-)
Finally, I'm guessing N Ain Dar has now watered out and that S Ain Dar is close. The big event for Saudi is when all the dry areas in S Ain Dar and Uthmaniyah are gone - then they, and we, are in a whole world of hurt.
The three are down 1.83 mb/d from where they were in July 2008. All three were straining to get every barrel possible then. It is unlikely they could have kept that level up for very long. I estimate that they are down 1.5 mb/d from what they could produce by October of 2008 if prices had stayed at that level.
The Saudis were producing sour crude and selling sour crude in July 2008. They did have a lot of other sour crude that they could have produced but it was heavily contaminated with vanadium and no one in the world could refine crude with so much vanadium in it. That is why they did not produce it. They are building a special refinery just to handle it. It is all in a reservoir called Manifa. They will begin producing that in 2013 but will not be in full production until 2024.
But in 2008 Saudi was producing all the sour crude they could possibly produce, sour crude that did not contain vanadium. After all it was only discounted about $15 a barrel at the time.
The question remains; how has Saudi's Kuwait's and the UAE's production capacity declined in the last two years. Has it declined more than the new production from Khurais? My guess is that it is pretty much of a wash right now. But how much can Khurais really produce? I doubt very seriously that they can really produce 1.2 mb/d, not for very long anyway. And my guess is that by 2013, when Manifa is due to come on line, they will be down to zero spare capacity.
I believe all three, because of infield drilling, will see a shark fin decline curve. By keeping their decline rate down to between 2 and 3 percent, they will hit a much higher decline in just a few years. They have been doing infield drilling for about a decade. The shark is due any day now.
Ron P.
Ron:
Don't know if you're still watching this thread...
Question: Didn't the Saudis add about 500 or so infield wells during the run up in 2007-2008? And did not increase production at the time?
Or am I imagining things?
Craig
Yes, I think that is correct. I don't know exactly how many infield wells they drilled during that period but 500 sounds about right. However they had been drilling infield for several years before that. Anyway here is Saudi's average yearly production for the last several years. The 2010 average if through July. The data is from OPEC's Monthly Oil Market Report. In thousands of barrels per day.
As you can see they did not get reach 2006 levels in 2008 and did nto get even close to 2005 levels. It is my opinion that they could not get back to 9,000,000 barrels per day even if they started to produce flat out. I realize Khurais came on line in 2009 but they are declining at about 7,000 barrels per year and I think the Khurais addition has been offset by decline.
Saudi claimed, a few years ago, that with infield drilling they had gotten their decline rate down to almost 2 percent. I think that now however that is no longer the case if it ever was.
Ron P.
Hello Euan,
Interesting thread.
The diagram below shows developments in crude oil production for each of the OPEC members, total OPEC lease condensates and total OPEC NGL’s production between January 2001 and May 2010 as these was reported by EIA in their International Petroleum Monthly as of August 2010. The diagram also have the monthly oil price (Brent spot) plotted into the primary y - axis.
What is interesting is that total OPEC crude oil supplies did increase with around 0,72 Mb/d (using IEA’s criteria of a production that may be sustained for 3 months) during the oil spike in the summer of 2008 relative to the summer of 2005. It required more than a doubling of the price to bring this increased supplies around. This suggests that OPEC had little spare crude oil capacities during the summer months of 2008.
As long there is no refinery capacity for oil qualities, well why then add it to global spare capacities. There is not much use of crude oil, refined products is a total different story however.
Looking at the historical data from EIA, these very much suggests that OPEC now and relative to the summer of 2008 has a total spare crude oil capacities of around 2 Mb/d. Then adjust for new fields and declines since then.
To count productive capacities for which there presently is no market for does not sound right.
Yes, I am in the process of producing a post anchored in EIA data about this, which further details why there is good reason to claim that present OPEC spare crude oil production capacities is around 2 Mb/d.
Just one comment my own work indicates world oil supplies are declining at a rate of at least 1mbd per year.
This makes the belief in 2mbd of spare OPEC capacity interesting and one reason why I can't accept that oil is in abundant supply right now. Obviously we don't have a shortage but how much do we have ?
Well assuming a 1mbd linear decline puts us down 2mbd very close to 2mbd vs 2008.
Given OPEC share of the world market export land etc etc then the amount of real spare capacity right now would then be very small. And the balance between current consumption and production esp exports should have been already going in the red.
Thats not to say OPEC might have retained a small emergency spare capacity but I'd argue that its probably no of a similar nature to what they had in 2008 something possible only under extreme duress.
However that does not mean we will find out the economic indicators are pointing to another slowdown so it might be a long time before production and consumption cross. Consumption could well already be falling globally so we might already be backing away from the danger zone making any attempt to guess what the real supply side constraints are fruitless.
Or not. But my point is you can look ant current consumption and do a few scenarios making various assumptions about basic oil supply and exports and come up with the result that most indicate the need for OPEC to turn on spare capacity unless the economy slows sharply and also reduces oil consumption significantly.
Given whats happened looking at both supply and demand going forward is important.
Rune, looking at that chart something struck me, and that was the similarity between the run up in price before the 08 crash and the run up afterwards.
If you take the price as shown on the chart post 08 crash, it is similar in price to Dec. 04, and the price today is similar to Sept. 07. The time between those two dates was 34 months.
After the crash the price dropped back down to the Dec. 04 level and rose back up to the Sept. 09 level in only 21 months, or about 2/3 of the time. Now the chart only shows up to May 2010, so I had to add 3 months to bring it up to Aug. 2010, which is how I arrived at 21 months.
21 is a little less than 2/3 of 34, which indicates that the price of oil is gaining a higher price faster during this deep recessionary period, than the pre-crash period. Which probably means high oil prices leading up to the 147 in July 08 were not speculation, but rather supply & demand driven coupled with increasing cost of extraction and or refining.
Now, if we take the post crash price, which is the same as Dec. 04 price, up until the high water mark in July 08 of 147, that run up in price took 44 months.
So if we want to estimate when the oil price will once again reach the 147 per barrel amount, our answer should be 2/3 of 44 or 29.5 months. Rounded off call it 30 months.
Since the post crash oil price occurred in July 08, then 30 months hence puts us in February 2011 for the next time the price should hit 147.
Now, of course that is based on a similar rise in price at the 2/3 quicker pace as shown above, which could be lengthened in time by a double dip or just the same pace we are on now. As strange as it may seem, what is being advocated here are negative economic indicators to stretch out the time until the next big run up in oil price, because it will cause another big step down in economic activity.
But if each run up in oil price takes approx. 2/3 the time it took for the previous run up, then that puts a numeric picture on the situation painting a seriously scary, shrinking set of time frames. Just like when your car is skidding or sliding and your mind says, "Time's getting short!"
Perk Earl,
I believe supplies were running tight (this is supported by actual data) during the summer of 2008 and this was a contributing factor to the price increase in crude oil prices. The driving factor here seems to have been growth in Non OECD demand/consumption.
However looking at other studies that shows that the financial demand for oil was 12 - 15 times higher than the physical demand also suggests to me that huge speculative forces was giving a helping hand. It seems like speculators spotted a tight market.
(Perhaps speculators read The Oil Drum and the discussions ;-))
However there is another thing that strikes me. Last year I made several estimates based on US GDP data and end user expenditures on energy that showed that the US economy (and possible others as well) then (and most possibly now) could absorb an annual oil price of around $60/bbl and show some GDP growth. A higher oil price would suggest a redistribution of consumption within the economy. This would be more money being spent on energy and less on other consumer goods and services.
Oil prices has so far this year been around $70 - 80/Bbl and US and OECD consumption seems to have stabilized at a lower level prior to the 2008 run up in prices. This could suggest a higher willingness and ability of consumers to pay for higher oil prices and could suggest a new “normal” for oil prices.
OPEC succeeded in holding back oil capacities (after the recent price crash) that gave support for $70 - 80/Bbl oil. What I have found interesting is that consumers seem to have accepted this range, honestly I earlier would have expected consumption to show some decline if oil prices remained at $70 - 80/Bbl which I believed would bring oil prices down to a new equilibrium (if I may call it that) of around $60/bbl.
Just my 2 pfennig.
Hi Rune - great chart - you must get bored listening to that phrase:-) The fault lines are particularly interesting since these mark events. Suggest you maybe play around with plot order a little, grouping Ron's "The rest" - KSA, UAE and Kuwait, and it may work plotting them at the top of the stack - which would group together Ron's "flat outs" at bottom of stack and this may show them collectively in decline. Know this is much work, and often its not possible to get a plot order that's perfect. Also suggest putting the legend below the plot area.
Since Safaniya has production infrastructure on it, I think Saudi are justified in counting this as reserve capacity. This can get switched on at short notice when refining capacity is available - and that is being built many places as we speak. It is not going to require a new field development and lots of new drilling.
If you see 2 mmbpd spare capacity excluding sour heavy, and we add 1.5 mmbpd for sour heavy, then our positions are really so close so as to not warrant further discussion.
I still think that from current position a new peak will be easily reached so long as the wheels stay on. Commentary on economy is getting increasingly polarised, but are the bears not supposed to win in a bear market?
Hello Euan,
First of all global spare crude oil production capacities are in my honest opinion not a static number. This is subject to change with time and as the market is ready to take heavy sour crude (that is refineries that can turn it into products the market wants) with high vanadium content etc., well, then it becomes part of the global capacities whether it is spare or productive.
Well I have played around with the numbers and used differing groupings, and some of this I am presenting below.
First of all; a closer look at what Ron refers to as the “Flat Outs”. I have grouped these further (not shown here) into a group of Angola, Ecuador and Iraq (that presently is not subject to OPEC’s quota system) and the remaining 6 OPEC members. In the diagram above these three are stacked above the yellow columns (in an effort for clarity). Angola has recently shown a growth in crude oil supplies, after it was reduced following OPEC cut back of supplies (as of January 2009?) to support the price.
Between July 2009 and as of May 2010 Angolan supplies grew with 0,19 Mb/d…or more than 10 %. Supplies from Ecuador have seen a slight decline. Supplies from Iraq grew a while during 2009 and recently these have declined as well.
This brings us to the remaining 6 (the stacked columns from the yellow ones and below).
EIA data shows the total from these 6 had a high back in 2005 as oil prices started to grow. Note that these 6 never reached the same high during the summer of 2008. More than a doubling of the oil price could not stop the total from these 6 to decline. That suggests that these 6 was in decline and most recent data suggests that the declines from these 6 have continued (ref the diagram above).
These 6 have combined reduced crude oil supplies with roughly 1 Mb/d from a total of 13 Mb/d in less than 5 years.
The evidence above supports Ron’s claim that the 9 OPEC members described presently are producing flat out.
The diagram above shows crude oil supplies (based upon data from EIA International Petroleum Monthly) as of August 2010) from January 2001 and as of May 2010 (data may be subject to future revisions) for Kuwait, Saudi Arabia and United Arab Emirates.
Total crude oil supplies for the three oil producers showed some response to the price growth of 2008 and the three was able to increase their total supplies with 0,20 Mb/d (if only monthly data is used….0,05 Mb/d if IEA’s definition of sustainable capacity is used) as a response to more than a doubling of the oil price.
Actual data suggests that most global spare crude oil capacities are to be found amongst the three producers presented above. And if the most recent data is to be believed it looks like they as of May 2010 have started to eat into their spare capacities.
As of May 2010, and based upon what is presented of data, the spare crude oil capacities for the three above seems to be around 2,0 Mb/d.
Presently OECD increases it imports. This is both due to declining supplies within OECD and a slight growth in demand. The increased demand thus formed from OECD will one way or the other have to be made up from spare capacities from elsewhere and then most likely also from OPEC.
Demand from non OECD countries continues to show strong growth and this growth is also most likely met by increased supplies from OPEC.
In a situation where both OECD and Non OECD are growing their demands for liquid energy as a combination of declines and growth in consumption; 2,0 Mb/d of spare capacities will not last for long…..as long all the wheels of some big economies still stays on.
Well from the little of what I understand; do not bears feed on bulls?
Rune, thanks so much for the charts. I got hi jacked up thread.
I guess the main difference between your chart and Ron's for the "flat outs" is that your chart is zero scaled making the apparent decline less apparent. And looking back to 2005 we see a bumpy plateau.
As for the rest - your chart shows amazing control.
Do we need another big Saudi debate?
CW
One factor I've started tracking is BIDY the Baltic Dirty Tanker Index.
http://noir.bloomberg.com/apps/cbuilder?ticker1=BIDY%3AIND
Take it with all the other data and you come it gets interesting.
Given that it seems to have peaked and is in decline I'd argue one of two things is happening right now.
Either we don't have enough oil to run our economy at its current levels or our economy is already sliding into recession. Or perhaps a mix of both who knows.
Although whats going to happen next is by no mean clear if you look at all the economic data oil data etc it seems to me that we have indeed entered a new phase different from late 2009 first quarter 2010.
I expect that a lot of the couplings between oil gold bonds stock market etc will being to break down over the coming months. Thats not to say its clear which way anything will go just yet simply that I think that in time it will be clear that whatever the new trends are they started now.
At the moment everything is pointing to a renewing contraction which suggest oil prices will fall substantially assuming events repeat 2008-2009 but we shall see.
My opinion is that we are not and cannot run out of money resources esp oil are the critical issue.
Mike, thanks for bringing Baltic Dry back to my attention. No doubt it has turned back down. Multiple mixed signals in markets right now. The bull signals I'd interpret as the delayed impact of billions of government money (i.e phony money) getting pumped in. The predominant bear signals = gravity, and your Baltic Dry charts point in that direction.
I think the mix is spot on. The post I did on Chinese coal, combined with reports China economy is slowing, got me thinking about this. Its just not possible for China to continue to grow at past pace without ready access to cheap coal. The thing is that the check and balance happens via our sophisticated market system and no one realises what the underlying cause is. There is no shortage of oil right now, but there is a shortage at a price required to promote growth in our economies - and this may forever be so.
Perfect way to say it. What I'm trying to say is we have already moved of the equilibrium point where effectively zero growth was possible or stimulus induced false rebound but really overall basically flat within the inherent noise of a global economy. I think people don't pay enough attention to how growth in one area is often offset by declines in another area. Flat is a better description on a global basis.
Now I argue we starting to enter the what happens next stage. Indeed have probably already entered it over the last 2-3 months. I think given that oil prices have remained robust its clear any real growth would have resulted in rising prices retarding growth. The glass ceiling seems very real from recent economic moves. The floor is still uncertain.
Whats not yet clear is exactly what happens next do we really have enough oil will economy shrinkage result in declining demand allowing something similar but probably milder than 2009 a relapse collapse of oil price followed by a probably lower stasis period as prices recover and growth is halted ?
Of course my own theory is oil supply is significantly more constrained then it looks like on the surface the availability of some surplus capacity of some sort has allowed steady prices with underlying supply levels perhaps moving more than most realize. This need not be considers some sort of crazy conspiracy simply assuming claims of a several hundred barrels of crude stored offshore and unloaded periodically which is "official" is perhaps enough.
http://www.businessweek.com/news/2010-07-30/traders-unload-oil-in-gulf-a...
http://www.arabianbusiness.com/594518-arabian-gulf-tanker-income-drops-m...
Obviously the official line is plenty of crude and probably a slowing economy.
I don't agree of course but my main point is the conditions which resulted in high but stable oil prices and a basically flat economy are no longer present today.
I have to think that I'm probably the only crazy bastard that long crude at this juncture. However if you recall I predicted that VMT would trend sideways and it has. Underlying that prediction is my believe that the world economy is very close to its inelastic limits for oil usage and only real collapse could drop it much lower.
Thus my opinion and belief is that what will happen is that even as the financial markets start losing steam energy usage and oil usage will remain very close to their current levels. Thus we should see declining finanancial markets while commodity and esp oil at least retain their pricing.
Now depending on the real details of the global oil supply if I really have it correct not only will prices remain near current levels but we will see oil prices rise. What I think happens next or actually is happening now is that energy supplies including coal and esp oil are actually falling faster than economic contraction thus prices will rise as long as we don't enter serious economic collapse. On the financial front the mechanisms are now in place to avert another outright financial collapse although they can't stop the intrinsic contraction.
Thus we are now I think entering a sort of classic situation of a immovable object meeting a irresistible force.
Time will tell how this plays out but no doubt in my mind that a new act is in progress moving us much closer to the final scene.
This means that the recent issues with wheat and food and any other above ground factor such as a gulf hurricane or something in the Middle East will occur with the system in ever more extreme tension. A trigger event could result in very rapid changes in the overall global economy from now on out. Thus I argue that the stress in the global economy is far higher than it seems at the moment and the weakening of economic indicators are really weak signals of a system thats got a lot bigger problems than it seems on the surface.
We ain't entering a relatively milder "double dip" situation. However the real situation with oil supply plays a big role in this assessment thus there would have to be real strain in supply under the covers for this to be true.
If its not then I'd argue we are going into another dip with a lot more financial controls in place and we will successfully kick the can down the road for a few a bit longer months for sure years perhaps as oil prices fall and the economy can again rebound from a lower level. The point of actual collapse would then be to far out to really determine.
Thanks to all for these fascinating analyses. The multiple slippery what-ifs sure make it tough to figure out which horse to back. I've lost a few investment bets by putting faith in sound fundamentals and rational behavior. Like putting money into Pharma on the logic that people will always get sick and the companies were both rich and resourceful and well managed. Who knew these great companies would be taken over by a bunch of aggressive, lying thieves?
The oil patch is a great place to practice the gift of prophecy. Secretive Saudi is either understating or overstating its capacity. It's past peak, or maybe not. Production will fall off a cliff, but maybe not soon, or maybe taper off and then plummet, or hit a plateau, depending on the demand picture. Enhanced recovery could buy us some time, or that could turn out to be a mirage if there's just no more oil in the ground we can reach.
I can't see what's on the table that would goose the US economy forward much for years to come. Business seems to be waiting for the consumer to open his wallet, but how can he? The last expansion, so far as I can see, was financed by credit-card debt and consumers being encouraged to buy everything they could lay their hands on, right now, and save nothing. So today the government is trying to take up the slack by pumping the billions into the economy that consumers no longer can. Whether we approve of that policy or not, extended unemployment checks alone are keeping a hell of a lot of Main Street businesses afloat.
So without consumer borrowing or government borrowing, where is the new spending needed for economic growth supposed to come from? Normally it would come from rising incomes, rising expectations and a growing population. Do we have any of those? (Maybe illegal immigration isn't such a bad thing?)
So for totally different reasons from y'all, I see energy demand in the US as basically flat in the next few years. A permanent mild recession, as it were. Am I missing something?
All the money is sitting idle in the hands of the big banks (small ones are still failing); they are not loaning it out. Would you loan money to a business that was making wigets to sell to the American Consumer?
Extended recession leads to depression - psychological and economic. When people realize that there is no recovery, more layoffs will happen. No money will be available for anything, including drilling those enigmatic oil wells, especially deep ones and expensive ones.
Right now the stock market is being bid up as wealthy investors buy and try to create a boom. It is a shallow market (not big numbers of shares changing hands) and all stocks are going up/down together, meaning there is no real diversity. Just spin. Tarp money and stimulus money are being snarfed up by big business, who declare profits are up...
Now, the Tea Party is about to scuttle the ship of state by forcing the weak kneed Democrats into capitulating and abandoning any form of positive intervention in favor of QE. Since the economy cannot respond, the newly printed greenbacks will end up alongside the tarp and stimulus funds, and the race to the bottom continues.
Since it would take huge quantities of very cheap energy to produce the goods, services, food and things that make up the GWP, and since the energy that is left is already very expensive, and becoming more so, I would guess that the term 'mild recession' is a bit off. We never really came off the recession in 2001 (it was all smoke and mirrors, done with credit and debt instruments and the like - it was a 'jobless recovery' then, and worse now), and to call this a W shaped recovery, or double dip recession is nonsense. The only letter that looks like this is either the letter "L" or the "backslash"(\).
But, we keep hoping, and refusing to admit the truth. And the truth is that we blew it! Now it is too late to make the fundamental changes it would take to keep more than 6 Billion people alive on planet Earth. There will be a die off of many species. Perhaps we will be lucky and escape our own conundrum, that I cannot know. If we do, there will be many fewer of us, and conditions will be very different from what we see today.
There is no super technology that could be deployed in anything like the timeframe needed to help. God is dead, or deaf. Our leaders are still worried about reelection money, and won't disturb their regular donors. The wealthy saw their average net worth increase by 17% in 2009! And the dumbies in the Republican Party still talk about tax cuts for those guys?!
We have converging crises, any of which could overtake us at almost any time. Disease is becoming resistant to our efforts of control; the global climate systems are disturbed by AGW; we are running out of oil, gas, and coal (the latter of which only sounds like it will last when you forget that it would need to be used to replace the former), several important minerals to agriculture are depleted and declining, our soil is depleted, our water is poluted and compromised, and our economy is well into a deflationary depression.
Am I missing something?
Craig
As I mentioned further up, the EIA is misleading the public and the current oil/supply demand situation is a lot more finely balanced than most think - and for exactly the reasons mentioned, above mostly concerning demand. US demand is being pushed up higher than what would be expected based upon economic conditions due to 1) an import surge (probably related to:) 2) better business credit leading to business restocking inventory 3) more vehicle miles as workers search further for jobs, or get second jobs.
Also on the supply side, judging from recent reports, 'floating' storage is gone around the world - with the exception of Iranian oil. Even then, the Iranian oil in floating storage is thought to be the lowest quality of oil available from Iran.
Granted the US import/inventory surge could be temporary, but the latest import figures indicate that it is not finished yet.
Also with US employment already cut back to the bone, I do not think we are entering into a 'double dip' scenario. That is assuming we don't get another Hurricane Katrina or similar event that blocks physical supplies of oil imports.
While I do not consider myself an optimist, the US and world economy could struggle along for another year or two until the invisible supply wall is hit. I still think we will also know when we hit that wall because oil prices will keep rising then in the face of a middling world economy.
Responding to the exact same quote as memmel did, but in a different way. This is what I keep harping on and that's price. What many people forget is civilization, including its infrastructure was built on really cheap oil energy, and the economic system got fiscally spoiled on the really cheap stuff. So the transition to an economy operating at a relatively much higher price is not evident. And if we are at that price point or higher, you may be right when you say "this may forever be so".
Nothing as they say substitutes for experience. I remember in 74 a downturn in the economy due to higher oil prices in 1974 dollars and it was not until the price dropped back down that things got buzzing again. That's why the expectations of a 6% plus growth following this recession are only petering out a much milder 2.8% growth rate. And I really wonder about that 2.8% figure depending on what it is relative to - a period of recession or prospertity?
I will see if I can locate the post I read in the past few days about economic growth being adjusted to 1.2%, and perhaps lower. I think it was on TOD in a comment.
The danger today is that we are in a truly deflationary depression... meaning that prices, wages, and everything are dropping. If so, then negative growth will certainly result, by definition.
Obviously, serious stimulation has failed... I mean, 0.25% rediscount rates, Trillions of direct government spending in stimulus funds. In any other economy we'd be neck deep in inflation! Instead we have ... this.
I keep trying to explain to family and friends why things cannot go back to 'normal.' Any time a few people take all the money from the economy and hoard it, the economy is going to collapse. But then, there are so many things that will cause our economy to collapse today that maybe something else will do the job.
It is when food shortages hit that the real fun will begin!
Craig
Got it! It was today.
http://www.davemanuel.com/2010/08/12/will-q2-economic-growth-be-revised-...
I've noticed at the grocery stores recently that the number of sale items are up and the prices on the sale items are lower than they were before the increase in prices that happened in 2008 - early 2009. It seems that these sales happen before the list price of the items go down, like the stores are testing the water before committing to lowering the prices permanently. In my area I believe this is the second round of a large decrease in grocery store prices since 2008.
This news item talks about rising energy prices being responsible for the most recent rise in the Consumer Price Index, in this case a mere .3%.
http://www.msnbc.msn.com/id/38689781/ns/business-eye_on_the_economy/
This is a complicated scenario we face. On one hand it looks like we have deflation at hand due to the economic picture, but on the other hand we would expect inflation due to rising costs of energy. Perhaps the deflation picture is largely obscured by the inflation picture. I am not so sure that this is a balancing act that will be successful. More like two kids meet in the middle of a teeter-totter then turn around and run toward the ends. Who will get there first?
DD
Blue Twilight, you need to close your blockquotes. You obviously put a blockquote after the Euan quote but you did not put a slash or / before it. That just opened up another blockquote. Now you have two, one inside the other with neither of them closed.
And you can test before you post with the "preview" button. You can make corrections in your original that is always kept below the preview window, then preview again until you get it right. Then hit the save button.
Ron P.
Baltic Dry Index has shot up again the past couple weeks. Look at your own chart.
LOL good one.
You should at least spend some time learning about lower highs and lower lows.
I have my own pets but here is a good intro.
http://technicalanalysis.us/swing-highs-swing-lows.htm
I'd be interested if any technical method yielded anything but a bearish result.
In other words the peak is in and the bottom has not formed.
For that matter oil prices over the last several months have been fascinating blowing out all the technical approaches I know which is highly unusual to say the least. And of course stock market also since these are tightly coupled. Thats not prevented and obvious peak from forming in the stock market but it does suggest both markets are probably not being driven by any known normal market forces in my opinion.
A site I like.
http://dshort.com/
Fake is really the only good definition for the stock market since March.
And a quick edit here is oil.
http://stockcharts.com/h-sc/ui?c=$wtic,uu[w,a]dalayyay[pb200]
Oil is following similar patterns but reversed. One market held up by mysterious forces
and one held down with very tight coupling. Nothing normal about it.
Obviously I have my opinion about whats going on but its certainly starting to show up via various technical methods.
The London FOOTSIE looks just like this too. Its a pretty good had and shoulders just formed since october last year.
Looking at what has happened in real world UK. Following our election, new coalition government has set about axing public spending with a vengeance. This has given confidence to money markets averting for time being a Greek style currency and interest rate crisis that would have led to a fast crash. Instead we need to wait and see what effect several hundred thousand newly unemployed public sector workers has on economy together with withdrawal of life support.
Yeah the closest analogy that I can come up with for many of the worlds major markets is where your watching a medical TV show and the heart monitor flatlines and the patient is dead.
Certainly it seems that efforts to shore up the markets have prevented a more natural decline but all its done is flatline them. The problem is of course once this happens then they just as well have crashed as there is no sense in investing in a market thats effectively making random moves about a supported price point its just as effectively dead as if it had crashed. Trading volume goes to zero and eventually extreme volatility is introduced. The flash crash of the stock market highlights the lack of human traders aka real volume.
I actually find it fascinating that attempts to manipulate markets seem to result in the velocity component going to zero few want to play a rigged game. This suggest a very deep coupling between velocity and or volume in markets and the onset of the end game of a moral hazard.
If one assumes oil and perhaps other commodities are also part of the rigging if you will its even more interesting because people can't stop playing the game for commodities and they are needed.
The volume after a point begins to hit a lower bound thats price insensitive and structural.
My opinion is that this eventually induces the onset of shortages and rapid price increases regardless of the nature of the manipulation. For example if we assume that OPEC really has ample spare capacity and is artificially maintaining prices high then the market would have adjusted to this and passed on the higher prices down stream shrinking other parts of the economy until it could not only handle the price but actually grow demand this means that OPEC would have had to steadily bring spare capacity online. Thus if it was true I'd argue OPEC's spare capacity would have steadily dwindled as the market absorbed the cost of higher prices.
If the OPEC spare capacity assumptions are wrong thats not to say they don't have some that is usable for short periods but in general that they did not cut deeply then given the above you will still hit a wall at a fixed price point demand will still absorb the cost and expand.
What this mean is demand becomes ever more inelastic or tougher if you will and immune to further price increases. Price spikes required to actually impact demand would be even larger. Next we have already had and extreme price spike and collapse over a period of months if another occurs many market participants will tighten their belts and absorb the higher costs assuming that they are another temporary spike just like last time.
The only downside force seems to be a actual lock up of the financial system preventing demand for oil by literally cutting off supply of cash and credit. Thus the only way I see to actually crash commodity prices is exactly what happened a financial crash. Intrinsic demand seems relentless as long as the economy is capable of passing off commodity prices to other parts of the system.
Thus with the onset of moral hazard conditions velocity/volume which are key economic variables remain outside of the control of any artificial efforts and become the driver variables for the economy. Eventually if commodity inputs are constrained the system hits a sort of inelastic demand wall for needed items and collapsing demand for others that have been kept inflated. In a real sense nothing can stop the system from evolving back to basics and focusing on profit from fundamentals.
I think its pretty neat really and of course similar arguments explain why absolute dictatorships always fail as command economies steadily revert to staying alive spiraling commodity prices.
As far as I know every single attempt to institute a forced economy has eventually resulted in explosive increases in food prices and often oil prices before the system collapsed.
I can't find the cost for gasoline during the collapse of the Soviet Union but I suspect it was high.
I'd be very interested in a graph.
EDIT: Duplicate
And you should at least spend some time learning about the reasons for the highs and lows rather than burying your head in the charts.
To wit: The reason the BDI crashed in the spring was not because of a crash in commodity demand, but because of a glut of new ships - largely ordered in 2007 and before - which came online in the first half of this year. An article from July 16:
Global Steel Demand Shows How The Collapsing Baltic Dry Index Is Absolutely Nothing To Worry About
And now, the reason why it's headed back up the past couple weeks is not because of some short covering or some reason like that, but because actual demand has picked up again.
Baltic Dry Index Climbs 4.6% as Iron Ore Shipments Accelerate
The is beyond funny ! Look what popped into my inbox.
Memster! We're saved! Alls we gotta do is take some a them surplus dry Baltic boats and wet 'em down. Start hauling Mr. Michael's cheap oil in shipping containers. He sounds like a trustworthy sort, no?