| BP's Deepwater Oil Spill - Still Important things to discuss - Open Thread 2 | The Oil Drum | Drumbeat: October 3, 2010 |
This Week in Petroleum for September 29 and July Vehicle Miles Traveled
Posted by Heading Out on October 2, 2010 - 9:30am
One of the metrics of the economy that serves as a marker to me on how we are doing relates to the use of vehicles, and as a consequence the amount of gas that is being used. Prices of gas haven’t changed much over the past months, nor has the price of crude. Thus without price fluctuations confounding the causes of change, it is possible to get some measure of how we’re doing from how much gas is being used. Recognizing that the summer driving season is now over, but that information is now available on how the patterns of driving went.
This Week in Petroleum, where I get the data on this, has, this week, focused on the impact that Canada is having on imports, given that it is the largest supplier to the USA at the moment. Part of the story they told this week was that the impact of pipeline problems between the two countries had not ultimately had much impact, and service is now resumed.
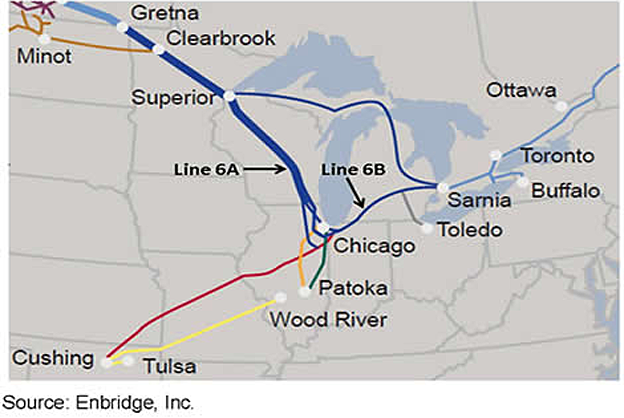
The Canadian supply has remained relatively steady over the years, and not been much impacted by the declines in demand recently, though as a seasonal event, the demand for crude is currently falling.

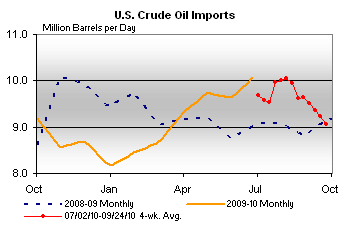
If one looks at the TWIP monthly figures rather than the annual demand, the fall in demand that started some months ago, is continuing, and given that domestic production remains relatively level, it will be interesting to see when this turns around.
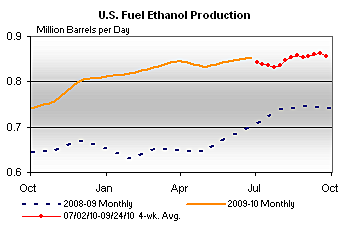
The amount of gasoline produced from this crude input would, logically, also fall, as it has been though it has just recently had a little uptick, relative to the trend of a year ago.
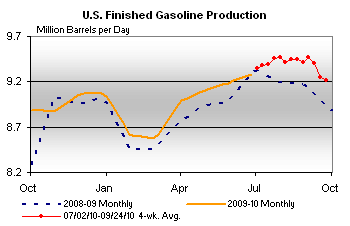
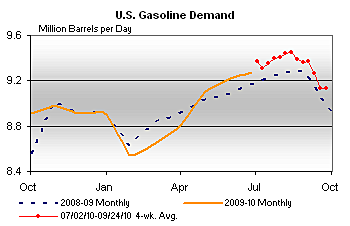
That is as a result of an increase in demand that can also be seen in the TWIP figures.
One week’s data should not, of course, be construed as having much import on its own, but it is worth watching.
Ethanol production, after a relatively steady, though small increase, concurrently had a slight dip, though this is, I suspect, likely to be insignificant in the longer term.
Looking at vehicle miles driven, the last report for which relates to July numbers, the curve (bearing in mind that it is a 12-month rolling accumulation) has picked up and is now past the early “bump in the road” which we saw earlier in the year.
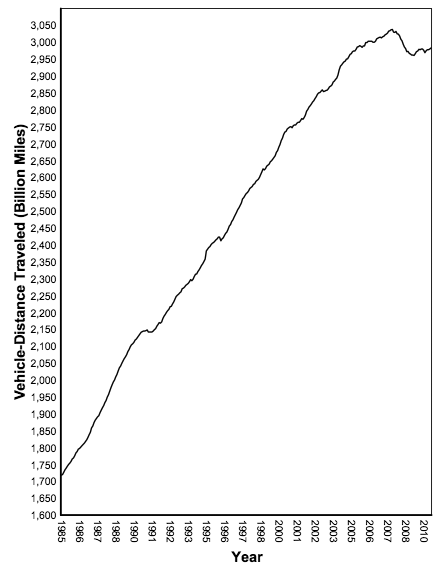
The slope is not yet that exciting, with the overall levels still equivalent to those back in 2005, but it is upward and a recognition that things are doing better. And it appears to be an across the board increase around the country, and in both rural and urban driving.
The question however, will likely arise before too long as to what impact the increasing demand is going to have on prices. For while the demand in the US and Europe has seen anemic growth, that in Asia is much more robust, and has been consuming the “slack” that had been left in global demand. We shall see how this impacts the capabilities of world suppliers to continue to meet this, in the months ahead.
Contact
- Content: editors at theoildrum dot com
- Tech support: support at theoildrum dot com
License

This work is licensed under a Creative Commons Attribution-Share Alike 3.0 United States License.
Last night was 80.00 plus per barrel. That slope may be a-changin before too much longer.
Cheers
Falling dollar on plans of more "quantitative easing" seems to be a contributor.
seems the Fed is hell bound on making the same mistake over again. Of course when you think your infallible that tends to happen. IMO it was the Fed easing in 2007 at the first signs of financial market turmoil despite inflation looking like it was ticking up that caused the dollar to collapse and oil prices to sky rocket. Ultimately it was $150 oil that was the straw that broke the camels back.
It looks to me as though ethanol production flattening relative to a year ago.
In the past, it seems like there was an upward trend, with the "bend" coming after the summer harvest. But so far this year, that doesn't seem to be happening. That may be because the US market is pretty well saturated, because of the 10% "blend wall". It could also be because at the current price of corn, ethanol is pretty high priced.
And the high price of grains is due to an unprecedented heat wave in countries like Russia. As per the greenhouse effect theories, temperatures will continue to rise raising the risks such as what we saw this year. Whether ethanol production rises or falls is dependent on a tug of war b/w AGW and peak oil. This year AGW wins. I would expect as the Arctic melts we will see significant temperature increases in the Midwestern corn belt making ethanol uneconomical.
The slope of the line of miles driven is incredibly straight from 1985 - 2007; I calculated an average annualized increase of 2.6% over the twenty-two period. If that is no longer to be the case, we really have entered a new era.
Over that period miles driven increased about 75%. Population (which really needs to be included for any per-capita value) grew about 30% - and continues to grow.
http://www.google.com/publicdata?ds=uspopulation&met=population&tdim=tru...
So, per capita, the decrease in driving was actually more profound, as the number of potential drivers continues to grow while total miles have declined, and the recent slight increase may actually be due more to population growth than any rebound of driving by existing drivers.
It does indeed appear we are entering a new era.
Births minus deaths increase the population at about 1 / 24 seconds, while immigrants arrive at about 1/27 seconds. http://politics.usnews.com/opinion/blogs/robert-schlesinger/2009/12/30/u...
But the age distribution is shifting towards more old people, who drive less.
And a fair number of immigrants take public transport, bicycle or are picked up by employers. It may be that they have difficulty in getting driving licenses and/or buying cars.
Highway engineers use an annualized growth rate of two percent per year for design purposes over a twenty year period. This accounts for general population trends, though not necessarily a high growth area. The slope from 1986 to 2005 is just over two percent per year. The break in the trend occurs in 2005, right about the time of the recent peak in conventional crude oil production and prior to the recession. In looking at the source document I am not convinced the "normal" trend has returned at all.
Hi timetobike,
It's been about 20 years now since I had the pleasure of the daily rush hour commute into the "big city" (Milwaukee, WI in this case). Yesterday, it was necessary for me to revisit this mode of transportation at 8:00 AM.
If we could find the one person most responsible for this insanity, it would be a good idea to hang this person over the steps of city hall.
This commute process really highlights the mass delusion under which we suffer. Instead of sitting in a comfortable train or bus reading the morning newspaper and sipping coffee, we endure this goofy dance of private automobiles lurching, stopping, waiting, and then lurching forward a few more yards. Wasting fuel, time, safety, and tranquility all in the name of "personal freedom". Getting fat and frustrated because we seem to believe the hype about cars as proffered by those who profit from our stupidity.
Perhaps we could come up with a GDP type metric for monthly miles driven to equate with national stupidity. This metric could be enhanced by factoring in the weight of the vehicles - bigger car equals more stupidity.
Prof Phil Goodwin of the University of the West of England has postulated that the UK has seen 'Peak Car' in terms of the number of vehicle miles travelled. He puts this down to various factors, including the growth in the price of fuel, obviously, but also the increased tendency of people to work in cities where the proportion of trips made by car is lower, and the reduction in the proportion of young people obtaining driving licences.
Read more here:
http://www.rudi.net/node/22123
Streeter.
It would seem that miles travelled will not start to increase much until our high unemployment rate drops. Currently there are about 15 million unemployed in the U.S. and another 9 million underemployed. That puts a crimp in how much people drive.
Paleocon is right--it would be nice to look at these figures per capita.
If the U.S. economy takes a strong upturn any time soon there will be upward pressure on oil prices, but that upturn looks to be a ways off.
Converting vehicle miles of travel to reflect population is more difficult than may be apparent. State highway departments collect vehicular traffic counts by count stations; some are permanent stations used for this purpose. The number of miles per vehicle counted is then applied using other state or region specific data collected over time. What these numbers actually reflect is a break in the rate of growth in the volumes collected at those stations. Look at the source document in the various regions and you will find the highest growth rate is in the Dakotas and adjoining states, the area least impacted by the economic downturn.
The miles driven per vehicle or per person has not changed much in the last couple of decades to the best of my knowledge; low fuel prices in the 1990s together with a rising economy removed most of the latent demand. Moreover, the number of persons without an access to an automobile dropped to new lows, and many public transit systems struggled during that decade.
The change in the vehicular counts at these count stations occurred as a result of the rising fuel prices, particularly from 2004 onward, and the slope really changed once the economy stalled and unemployment increased.
I would not think that unemployment being high will curtail miles driven much.
Case in point: my friend was working for our company five days a week, then the econpmic downturn reduced that to two days per week. He found new employment for two or three days per week at a company 100 miles away. So when he worked full time for us he was travelling 100 miles per week. Now he travels 240 miles per week at least, provided he stays in a motel at the far-away work site. I know other people in similar circumstance that are working less hours and travelling farther to do so.
If people have less money, they buy less goods, so fewer goods need to be transported, so fewer trucks.
Note that your friend is not unemployed.
While your mileage may vary (pardon the pun), many of us drive more to haul kids around and run errands than for commuting, at least here in wide-open suburbia. When you get unemployed the activities list gets cut, so the travel does too. No more driving to go out for dinner, etc.
Our country USA, is going into debt deeper every day. We can make our own energy to power cars, and it's not ff based power, but instead conversions of sustainable energy. The cars will be powerful and convenient. Read the Tripe System Report at www.environmentalfisherman. The report is illustrated. I have been on theoildrum for two months.
Is this meant as a serious idea ?
If so, you should look at
http://www.urbandictionary.com/define.php?term=Tripe
and you might want to re-think that name, to a more globally viable one.
However a read of your report, does show a very good many fundamental flaws.
One hint: shifting large numbers of passengers, over a high pressure fuel pipe,
might not sell too well, in err, San Francisco for one.
Missing completely is any fan-out information. The connections from these huge pipes, need to fan-out to the much lower final use volumes.
Seems a massive NEW infrastructure build, more suited to a fiction book, than anything that will survive a cost/benefit analysis in todays world.
Using rail lines as fuel delivery system is an old idea that has been abandoned, and justifiably so. Or in this case the fuel delivery system is the rails themselves. But it becomes doubly silly when the fuel delivered is hydrogen. But Hydrogen is a Hoax!
We have pretty much stopped discussing hydrogen as a fuel that will mitigate peak oil on this list. The Hydrogen car is dead. What killed the hydrogen car is the fact that for every 100 kWh of electricity used to generate hydrogen fuel at its source, only 23 kWh of is delivered to the wheels as torque. Well, that and a lot of other things.
But your system is aptly named, TRIPE!
Ron P.