OPEC quotas and crude oil production
Posted by Luis de Sousa on January 31, 2011 - 11:20am
This is a guest post by Jean Laherrère, a long-time friend of and contributor to TheOilDrum.
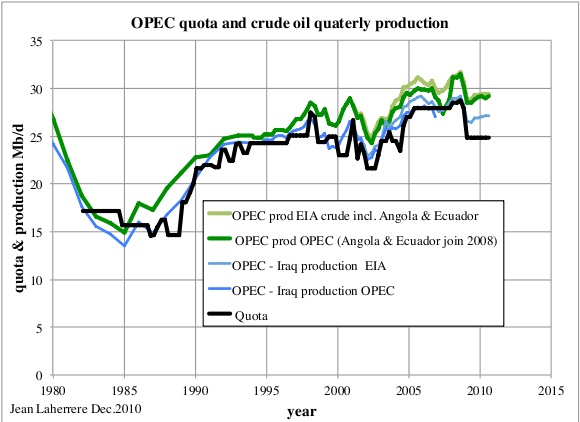
It is hard to obtain reliable graphs and quotas on OPEC oil production and to know how these quotas are ascertained. The few graphs that I found are incomplete and inaccurate. OPEC's website reports the oil production allocations (quotas or ceilings) from April 82 to Nov 2007. OPEC's 2009 annual report extends the data up to December 2009 but only with the total (24.845 Mb/d); there's no detail since January 2009. Energy Intelligence provided this missing breakdown by country as targeted since 2009. Quotas are agreed upon by each member during OPEC's meetings, but the detail of the compromise is not given, only the results.
Thus I decided to plot OPEC's quotas, comparing them with production. The outcome is interesting.
Quota estimations started in 1982 and are now called production allocations or ceilings. The basis for estimating allocation quotas is given by Rafael Sandrea [1]:
Proposed Formula for Allocations
In 1986, OPEC conducted an in-depth analysis of their system of allocating quotas with the view to set up a durable formula, equitable to all members. They defined eight criteria that fall into two categories: oil related and socio-economic. The factors considered were:
- Reserves
- Production capacity
- Historical production share
- Domestic oil consumption
- Production costs
- Population
- Dependence on oil exports
- External debt
A previous paper by Alsalem et al. [2] indicates the main factors: proven reserves, productive capacity, GDP and domestic investment needs. The conclusion on the mismatch between quotas and productions during the March 1982 to June 1990 period was that “Venezuela seems to be the only member to violate the production agreement even though apparently fair quotas were assigned”.
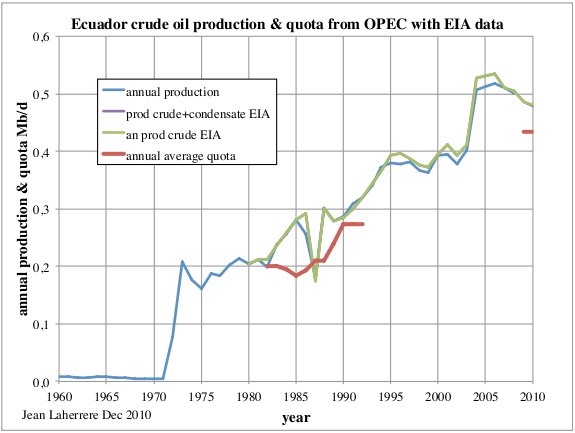
The comparison between OPEC's quotas and crude oil production is disturbed by the variation of the number of members. OPEC started in 1960 with 5 members: Iran, Iraq, Kuwait, Saudi Arabia, and Venezuela. The other members joined progressively: Qatar in 1961, Indonesia in 1962 (suspended in 2009), Libya also in 1962, The UAE in 1967, Algeria in 1969, Ecuador in 1971 (suspended between December 1992 and October 2007), Angola in 2007, and Gabon from 1975 to 1994. Iraq's quota was suspended briefly in 1988 and permanently since 1999.
In its annual reports, OPEC publishes the annual and cumulative crude oil production figures of its members, but not the other liquids; in particular, condensate is excluded from the quotas. Monthly OPEC bulletins report crude oil production up to November 2010. In contrast, the USDOE/EIA reports for each country - the crude oil and condensate production - are reported since 1980 because in the US, condensate at well head is not distinguished from crude oil production as for OPEC members. (table 42).
With the number of members varying, a graph of OPEC's overall production is not the best data to review. It would be more interesting to show a graph with each OPEC member ranked by peak production.
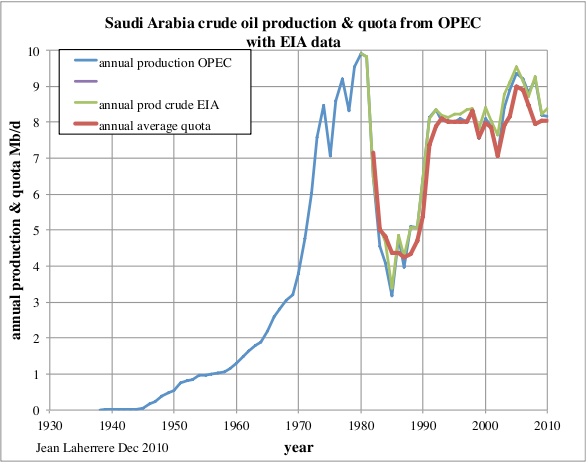
The largest producer, Saudi Arabia, has played the role of swing producer, responding to price with large output variations. Its production follows the quota fairly well, overproducing slightly since 2002:
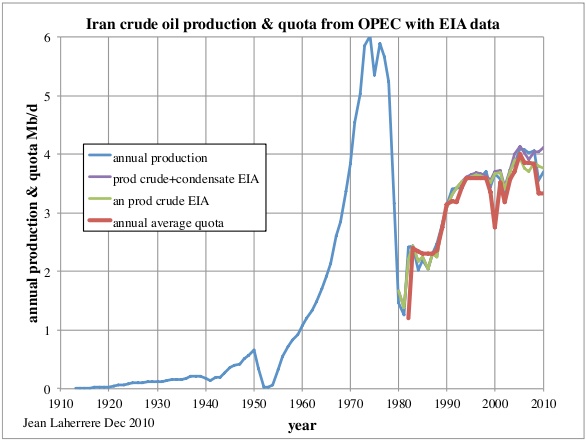
Iran's production has followed its quota except during the last two years!
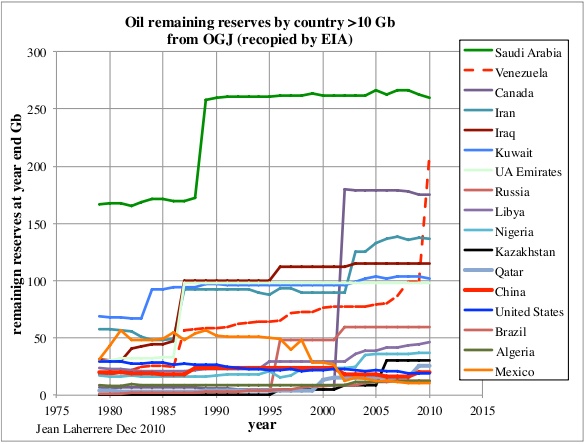
Venezuela had been overproducing until 2001, but with the collapse of production after Chavez's row with PDVSA and consequent nationalisation, production data became unreliable with a large discrepancy between OPEC data and EIA data! The Oil & Gas Journal (OGJ), in its Worldwide Look at Reserves [3], has increased Venezuela's reserves at the end 2010 from 99.38 Gb to 211.2 Gb, including the extra-heavy oil, like it made for Canada!
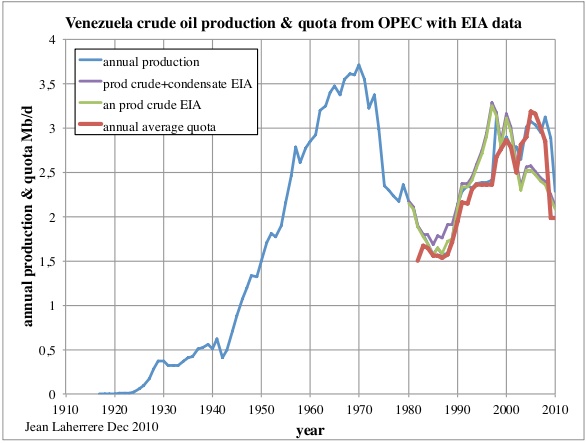
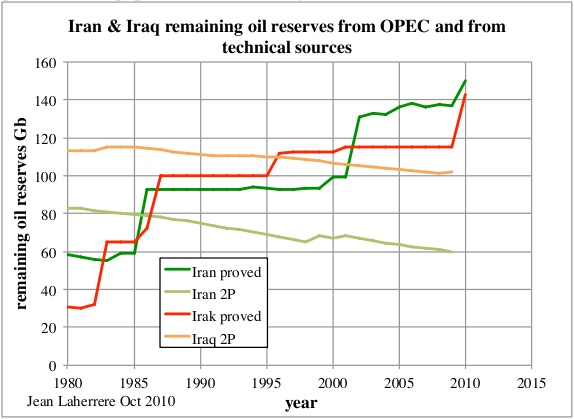
The remaining reserves (also called proven reserves, estimated before the end of the year with an enquiry carried out by the OGJ and later recopied by the EIA) is plotted here from 1979 to 2010 for countries with more than 10 Gb. Venezuela's political oil reserves increase, but production decreases!
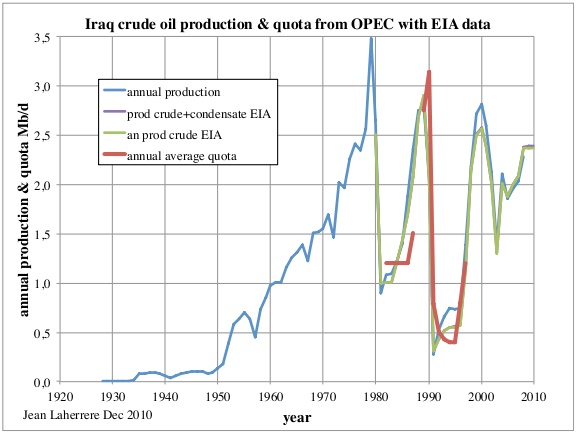
Iraq's quota has been suspended since April 1998.
Libya has been overproducing lately.

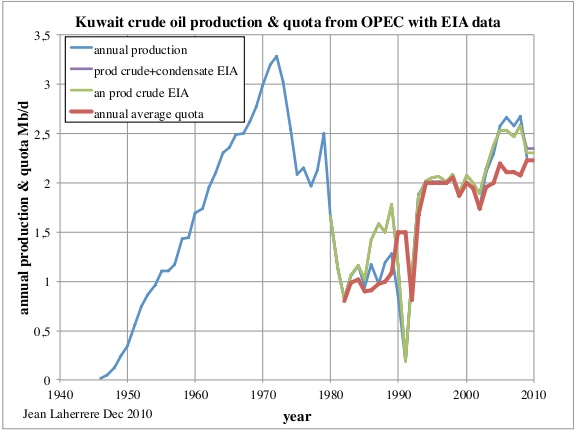
Kuwait has been overproducing since 2003.
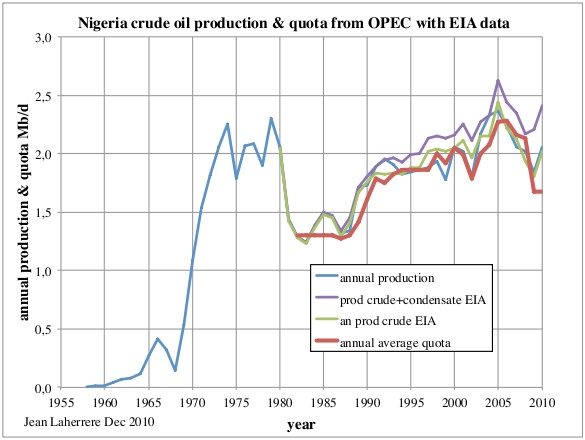
Nigeria was underproducing in 2007, but not anymore.
The UAE has also been overproducing since 2006.

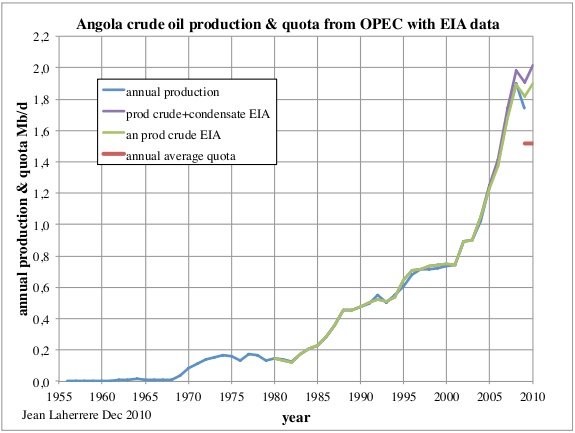
It is strange for Angola, having gone through a large oil production increase since 2001 and joining OPEC, to then get a quota imposed after 2009!
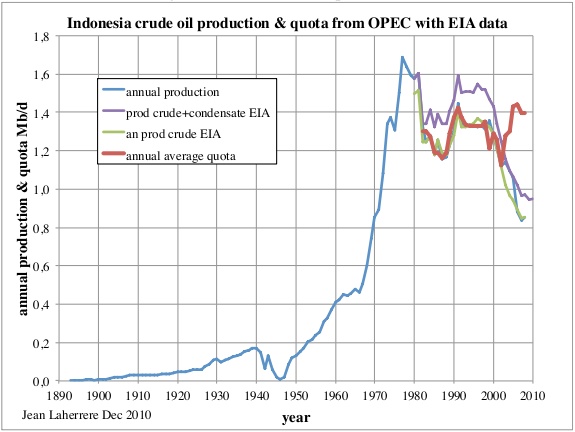
Indonesia left OPEC in 2008, unable to reach its quota.
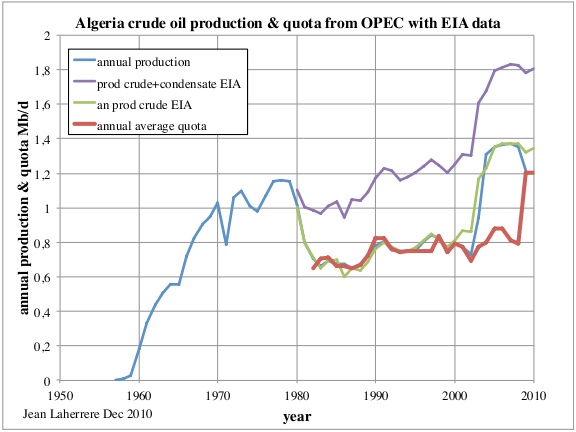
Algeria overproduced from 2003 to 2008. In fact, Algeria produces a large volume of condensates, stripping Hassi R’Mel field's rich natural gas and re-injecting. Algeria's target was increased in 2009 to diminish this overproduction.
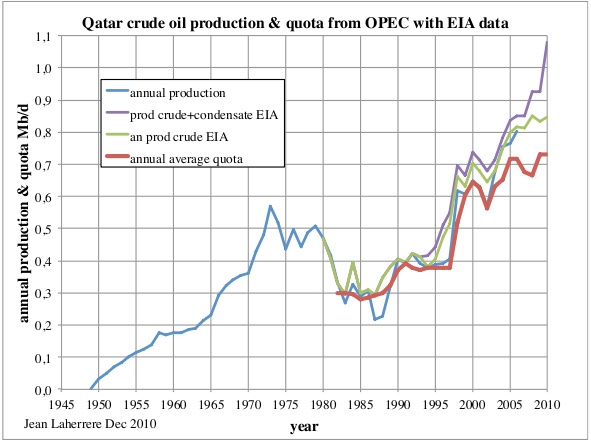
Qatar is overproducing.
Ecuador rejoined OPEC in 2009 and overproduces!
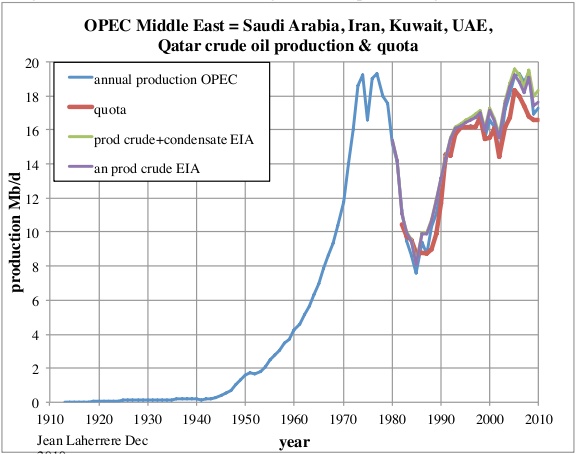
The OPEC Middle East countries, excluding Iraq, have clearly overproduced their ceilings, showing that quotas do not matter much as long as the oil price is high.
Conclusion
Quotas are still the rule in OPEC and haven't changed since January 2009. It is difficult to find out how these ceilings are ascertained.
It is well known now that OPEC increased their so-called proven reserves by 300 Gb from 1986 to 1989 (which Sadad al-Husseini called speculative resources in 2007) because of a fight for quotas in a low price environment. Despite that, quotas are now agreed upon in OPEC meetings without any reference to reserves; the recent October increase of Iraq's reserves followed by Iran's reserves increase indicates that OPEC members are still keen to stay at the same rank. It is not surprising to find that the technical remaining reserves are quite different. In its last estimate of proven reserves (on 6 December 2010), the OGJ did not accept Iran's and Iraq's updated values, waiting for further discussions!
As long as quotas prevail, OPEC's members will cheat on reporting reserves and even on reporting oil production.
References
[1] Rafael Sandrea, OPEC’s Next Challenge – Rethinking their Quota System, Oil & Gas Journal, Volume 101.29, July 28, 2003.
[2] Ahmad Saleh Alsalem, Subhash C. Sharma and Marvin D. Troutt, Fairness Measures and Importance Weights for Allocating Quotas to OPEC Member Countries, The Energy Journal, vol. 18, issue 2, pages 1-22, 1997.
[3] Worldwide Look at Reserves, Oil & Gas Journal, 6th of December, 2010.
A list of all of Jean's posts can be accessed here.
Contact
- Content: editors at theoildrum dot com
- Tech support: support at theoildrum dot com
License

This work is licensed under a Creative Commons Attribution-Share Alike 3.0 United States License.
Interesting that the quota formula does not include the most obvious factor: profit. Yet, based on how many of the OPEC countries overproduce, the greed motive is obviously there.
It would probably be interesting to plot net oil exports versus annual oil prices for various countries. I thought that the Saudi net export response to six straight years of of year over year increases in annual oil prices from 2002 to 2008 was interesting:
In early 2004, the Saudi oil minister proclaimed their support for the $22-$28 OPEC price band, and they did in fact significantly increase their net exports in 2004 and 2005, but in early 2006 he complained about a lack of demand, "Even for their light/sweet oil," as annual oil prices continued to increase from $57 in 2005 to $100 in 2008.
Through 2010, the cumulative shortfall between what the Saudis would have net exported at their 2005 rate and what they actually net exported is on the order of two billion barrels of oil, despite the fact that annual oil prices showed year over year increases for four of the past five years, with 2010 being the second highest annual oil price on record.
Some speculative questions for any of you guys who study both the geology and the politics:
How long will it be until another OPEC country gets into such a situation that it's quota is meaningless,meaning that it couldn't produce it if it wanted to, due to depletion? Which country is it going to be?
Which one(s) other than Venezuela are going to see their production collapse in the near or mid term more for reasons of mismanagement than lack of oil in the ground?
Of course I understand that any answers can be no more than educated guesses, but all you professionals, plus all the regular guys such as Darwinian, are infinitely better informed in this area than I am.And truth be told, Darwinian probably meets the practical definition of the word.
But after a year of thorough study of everything posted here, I AM beginning to think of myself as being well on the way to becoming a well informed layman. ;)
As noted up the thread, I think that net oil exports versus oil prices tells us a lot about individual oil exporting countries, but as an example of the problem inherent in focusing on production versus net exports, consider the ELM and two case histories:
Production declines of 35% for the ELM, 26% for Indonesia and 38% for the UK resulted in the model and the two case histories showing 100% declines in net oil exports. Egypt is of course another example, where a 20% production decline, plus rising consumption, resulted in a 95% reduction in net oil exports (BP).
Good Morning, Westexas,
There is no doubt in my mind that you and your buddy Sam are the bridge lookouts who spotted the incoming torpedos of declining exports , and you deserve medals-the high class sort of medals given to admirals for winning big battles.
So which country is most likely going to be next, after Egypt?
mexico mexicoho!
olé
I would plot it Year against ($/Barrel)*Exports which gives total money. You will then see a monotonically increasing function. The year-over-year profit motive is usually there, no matter how they try to hide it.
qatar's crude oil production was less than 500,000 bpd in '95. most of the increase since that time has undoubtedly come from n dome (condensate) and not subject to quota.
Hello,
The diagram for Qatar shows both crude and (crude + condensate).
2009 eia crude oil production 0.927 million bpd(includes condensate)
2009 eia total oil production 1.214 million bpd('all' liquids)
doesn't seem to match the graph. wonder if the graph was actually iea data ?
X axis ends at 2010, not 2009. Average for 2010 through October is 1104.56. EIA haven't provided 2010 annual numbers yet, at least not through the data browser; probably Dec numbers were in the last IPM. Literally the last IPM, as we all know. Is the idea that the Statistics portal will now have the latest numbers, however preliminary?
brilliant ! but the graph includes 2009.
the graph, the graph that alledgedly shows qatar exceeding their quota, doen't match 2009 eia data either.
crude oil production, the subject of opec quota which does not include condensate is probably not much greater than in 95, so qatar is probably not exceeding there opec quota.
Really now! Not according to OPEC's own Oil Market Report. This report puts Qatar's December production, crude only, at 814 thousand barrels per day, over 60 percent higher than their 95 production and above their current quota but closer to it than most other OPEC nations.
Ron P.
i take that to mean crude oil production includes condensate.
opec's annual report (table 1.2) shows 733 mbopd for qatar for '09.
http://www.opec.org/opec_web/static_files_project/media/downloads/public...
in any case, the graph doesnt match eia annual data either.
Yes that does mean crude plus condensate. But look at the subject you were quoting from. It was World Oil Supply! Then right below that they gave the estimate of "World Oil Supply" that includes OPEC crude, OPEC NGL's and non-OPEC liquids.
Now look at the subject just prior to that. That subject is: OPEC crude oil production. That does not include condensate, it is Crude only!
And that report says Qatar produced, in December 2010, 814 thousand barrels of Crude Only!
Ron P.
Also note that the graph shows "Annual Average Quota," as these numbers change on a semi-regular basis, not neatly every Jan 1, and these production numbers are annual. I brought up the way '10 is preliminary because it might make the graph look a bit skewed. The mean between the two figures for Qatar's Jan '09 and Jan '10 quota given by Jean's source is 770.5 kb/d, close to what's represented - perhaps this is a moving average or the like.
In any case, I'm puzzled why anyone would be shocked - shocked! - to find either gambling in a casino or OPEC nations exceeding quota. Check out some of Staniford's updates on production to find out just how widely these data sources can differ, too.
Hello,
EIA IPM for January 2011 lists Qatar with 0,833 Mb/d crude oil (Table T12) for 2009.
EIA IPM for January 2011 lists Qatar with 0,927 Mb/d (crude oil including lease condensate) (Table t11c) for 2009.
Same numbers in the data browser.
The EIA data browser lists Qatar NGLPs production as 0,263 Mb/d.
This is useful information in a nice overview.
Jean, does the difference between quotas and actual production tell you anything about spare capacities?
Husseini's graph with 300 Gb reclassified as "resources" is here:
http://www.crudeoilpeak.com/?page_id=2402
What an extraordinary coincidence - I just posted about OPEC Quotas and Reserves Revisions on my own blog. Jean's work leaves mine wholly in the shade, of course.
Most of my post was a ramble through Google News Archives, attempting to pin down precisely when countries claimed boosted reserves, and then seeing if their quota increased as a result. Here is a link to a download of my spreadsheet of OPEC Quotas (Open Office .ods format). This has the OPEC quota page data laid out by month, with US spot price and OPEC actual production, which I've sussed out quarterly data for from the EIA - the numbers on their website only go back to '94 but these quarterly numbers are available via old issues of the STEO - today's project will be to render those into one big .pdf or text file, so as to be able to search all of them at once - did the EIA have anything to say about these reserves revisions?
The most startling thing I found in the OPEC quota data was when I calculated the change from meeting to meeting - the percentage of the total allocated to each member country hasn't changed since July 2000! In other words, at these general meetings all OPEC does is decide whether to change the total - nobody cares how big a share of the pie they get. Of course Jean has documented quite neatly that none of them really care for the pie in the first place...
This is a drastic shift from the past, for instance at the Jan '89 meeting Iraq gained 4.09% and KSA lost -4.60%, with all other members gaining/losing share by smaller amounts. Also on the table for today is to find out via Google Scholar whether any recent analyses of OPEC have noticed this rather glaring anomaly.
Comparing the July 2000 quotas given by OPEC to the numbers on Jean's Energyintel.com link, the diff is as follows:
Ecuador now account for 1.75%. The average for these numbers? 0.00%. I laughed out loud at that one.
Yes...all very interesting. Can't help but think back to a far different time that really wasn't that long ago in the big picture scheme of things. In the mid 80's the KSA kept cutting sales in order to keep prices up as the rest of OPEC cheated on their quotas. Until the KSA had enough of the cheaters, opened the taps and flooded the market. The result: oil down to $8/bbl in some markets. The experts (after the fact, of course) said it was inevitable: had the KSA kept their cut back rate going they would have had to shut in 100% of the production in just another 18 months. Granted 25 years isn't an overnight change. But now think about how sure so many folks are about there being adequate oil supplies in just the next 10-15 years. Probabaly some of the same "experts" who didn't see the KSA oil flood in '86 before the fact.
If you search for archived news items on the terms 'OPEC cheat quota' they reach an asymptote in 1988. That figures! Quite bloodthirsty, literally in the case of Iran and Iraq. Stuff like this, from June 1988:
Whereas, if the OPEC numbers are bona fide, they just gave up on any kind of debate in 2000, for at least 6 years. But then again maybe some flunky just generated a simple algorithm to generate some phony numbers...
you are drilling a dry hole.
only iraq's quota increased following an increase in stated reserves. uae's quota decreased following an increase in stated reserves.
Actually I dug up a lot of interesting copy from that era and gathered a good deal of useful data, including the fact of the ossified proportions of quotas, which I'd think is the real news item here, and which no one seems to have any interest in. But thanks for the words of encouragement!
BP has UAE boosting reserves in 1986, EIA in 1988. They had to suffer the ignominy of a 6 month long 48 kb/d cut in 1987, yes. By Jan 1989 they were up to 6.94% of the total. Venezuela announced increased reserves in Apr 1987, at the Jan '88 meeting they were up to 10.70%. So there's a weak correlation - which was subsequently rubbed out in later negotiations anyway. Still, it's entertaining to pile up all of this data.
the case can be made that ksa lost % of allocation coincident with an increase in stated oil reserves, depending on when the restatement occured. if the restatement occured in 1988, then ksa lost quota to iraq in 1989 following an increase in stated reserves.
on the other hand, if the saudi aramco's restatement occured at the end of 1989, that would be after the nationalization of aramco.
the nationalization was accomplished by purchasing the former partner's(chevron,texaco,exxon,mobil and gulf) assets at book value. i think you can see how ksa would have a motive to understate reserves prior to nationalization. chevron states on their website that the nationalization was completed in 1989.
i dont know when saudi aramco's restatement occured. eia shows the restatement in '89, while bp shows the restatement in '88. i havent been able to find saudi aramco's annual report that far back.
as you can probably tell, i dont agree with the complacently smuge who insist that opec reserves were increased to garner a larger slice of the pizza pie quota.
Yeah, why would they just blatantly make up numbers? These assessments must be wholly bona fide. Petty fights over quota have nothing to do with it, nor the ramifications for estimates of global peak. It was all done in the name of science and being on the level with their local government agencies overseeing standards of reporting in regards to resources. Heh, put it that way and it really sounds ridiculous. Maybe Armaco were honest johns but the rest?
Iraq Expected to Seek Increase in Its Oil Quota - New York Times, September 05, 1989
Here's a handy pdf from the latest OMR, showing each country's production and target: link.
So conversely wouldn't it have been in the former partners interest to state as big a reserve as possible to raise their book value at the time of nationalisation?
Personally, I think that the OPEC reserves are not seen in the cash-in-the-ground way of western capitalism. They're used more for a show of state strength to other OPEC members and the rest of the world.
The difference between us is that they don't think it matters, and we know it does.
for a basis for nationalization, yes.
us based companies had an incentive to understate reserves because of how depletion allowance is calculated in the us tax code.
the former partners were notoriously conservative in their estimates. for example, abqaiq had already produced its 70's era stated eur in about 1995, according to statements by saleri. ghawar has probably already produced it's 70's era eur.
the purchase of assets occured primarily between 1973 and 1980, retroactive to 1976, according to saudi aramco's website. a final concession was relinquished in '88 and according to chevron, nationalization was complete in '89.
the nationalization required both finesse and brute force on the part of saudi aramco.
beyond that, engineers of that era were by nature conservative, iow it was ok to underestimate. imo, that changed in the early '80's when boon pickens made a run at a takeover of phillips petroleum because phillips was undervalued based on understated reserves.
there are many differences between us and them. one difference is that saudi aramco operates to maximize recovery of oil in place while public traded companies operate to maximize present value of oil in place.
Good point about the tax. It did occur to me after posting, that the companies involved had to deal with US laws for reporting, whereas the Saudis can report what they like.
I think you're right that the balance of evidence points to the reserves being originally underestimated, but now I think that has swung the other way and now they're overstated.
Stated reserves do not really matter, especially now. The only thing that does is how much is extracted, now and in the future. The things that are going to determine that are: how much it costs for exploration, drilling, extraction and transportation and EROEI.
If costs exceed available monetary resources, no exploration and drilling happens. Production would decline in that case. If EROEI is less than 1.0, there is no point in extraction (Canadian oil sands are problematic on that basis, as are shale oil extraction sites). You are better off without the energy expenditure.
World economic events will probably have more impact on Peak Oil than geology; TEOTWAWKI will leave much oil in the ground. If enough hairless apes survive, some brilliant member of the new species may one day figure out how to use it to leave this resource depleted planet. Otherwise, we and our genetic progeny will one day fail. At which time, it will really not matter how many BBL of oil Iran, Iraq, KSA or Venezuela have in the ground, will it? It is not what you have, but how you use it that counts.
Craig
I dont know how many times I see comments that say when the EROI is 1 (or less) then there is no point continuing with extraction.
It seems to me that when things reach EROI=1 we will still extract oil using any form of energy which is not liquids because it will not matter to some people if we use 10 energy units of say wind power to get 1 energy unit of oil just because the oil liquid is so valuable for other things.
Exactly. I bet the EROEI for Duracell batteries is way less than 1.0. Does that stop us making them or buying them? Hell, no.
The energy used to extract oil is oil. Drill ships, drilling platforms and even drilling rigs on land use diesel power to power the ships, platforms and drilling rigs. And when it takes more oil to get the oil out, there is no point in extracting the oil.
Also the power used to look for oil is either diesel or gasoline. And refineries use primarily natural gas to heat the product to refine it. Fossil fuels drive the oil industry, they always have and always will.
I am waiting for the drill ship or drill platform powered by solar or wind or solar. I suspect I will be waiting a very long time.
Ron P.