| After Fukushima: a new dash for gas? Really? | The Oil Drum | Fukushima Dai-ichi status and slow burning issues |
A gentle correcting cough for Dr Saleri
Posted by Heading Out on March 24, 2011 - 8:16am
On March 9, Dr Saleri (who debated Matt Simmons at CSIS in February 2004, on Matt’s concerns expressed in what became “Twilight in the Desert”) had an opinion piece in the Wall Street Journal in which he said:
"In the context of global liquids production, the civil strife in Libya represents a minor disruption (less than 2% of the total, approximately 85 million barrels of oil per day). Nor is there any evidence to suggest that even a protracted scenario of instability will result in a sustained reduction of crude supplies. Iraqi oil production dropped by 30% at the start of the second Iraq war in 2003, and then it quickly bounced back to the prewar level of two million barrels of oil per day. Currently, Iraqi oil production stands at 2.6 million barrels of oil per day, with much higher levels projected during this decade."
Since I recently commented that neither Iran nor Iraq had bounced back to pre-revolutionary levels, I will let you decide who is correct. Here is the EIA plot of Iraqi production since the 1990 invasion of Kuwait.
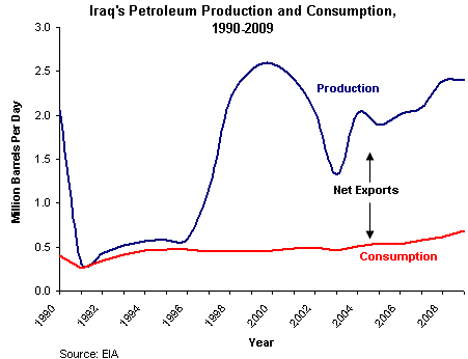
I would suggest that the figure shows that Dr Saleri is being a bit of an optimist. It is interesting to note that the pre-invasion of Kuwait production level of 3.5 mbd in 1990 collapsed to a level of 300,000 bd as a result of that invasion and has not been re-established 20 years later.
The results for Iran are similar.

Prior to the 1979 revolution that deposed the Shah, Iran was producing nearly 6 mbd of oil. It has not returned to those numbers since.
Based on these two examples, I continue to believe that it would be foolish to anticipate, as Dr Saleri would suggest, that we pretend that Business As Usual will continue. The popular protests are continuing in a growing number of states, and whether those countries go through civil war or merely social re-adjustment, it is likely that more money will be spent on their rising populations. This will leave less money for investment in fossil fuels, at a time when sustained production requires increasing levels of investment in exploration to find the needed new resources.
With the short-term loss of Libyan oil plus the anticipated increase in demand this year, the world is looking to find 3 million barrels/day of production to maintain adequate supply in the face of demand. Reduction in production from countries with other priorities will likely make that number larger. It does not matter what resources are in the ground if the producing countries do not, either through will or ability, increase production this year to meet those shortfalls.
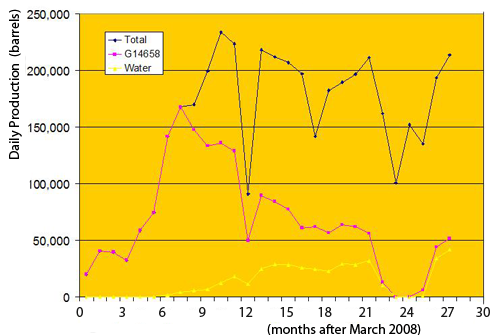
Dr Saleri points to technical progress allowing an increase in oil production from the United States – while that is true, it is a relatively small gain when placed against the coming need. And one has to recognize that, for example, the inability of Thunder Horse to live up to its anticipated production of 250,000 bd. warns that not all technical progress will provide the reward that was promised. The plot below (h/t Darwinian) shows the total flow of liquids from Thunder Horse over the last two-and-a-half years (the top line) and the amount of that flow which comes from the main field (the red line) - and then the amount of water being produced, which is the lower yellow line). The difference between the red and the black in the latter part of the plot is because of increased draw from secondary fields due to the premature collapse of production from the main field.
There are other technologies - micellar flooding was a popular topic back in the last Energy Crisis, and the use of horizontal wells that can control flow through the formations well enough that the fluid can be subsequently recovered (mandated because of its cost) may make this a viable option in the future.
But it is not an option that will yield a significant volume of new oil today. And this is the point that Dr Saleri skates around. It is a realism that the OPEC nations would have us ignore in their current response (under an Iranian chair) that supply is, and will remain, adequate. Tankers take weeks to deliver cargo, so losses are not always immediately evident. The summer driving season is still a couple or three months away, although demand has not shrunk this year the way it usually has. Thus the likelihood of significant shortfall may still be a month or more away from public awareness. (Other than through the approach to $4 a gallon price for gasoline in the United States, and similar relative experiences elsewhere).
However, in conclusion, perhaps it is time that Dr Saleri read Dickens. My first post on The Oil Drum, (though Prof G later moved it up) and one of my first when I then started Bit Tooth Energy recalls a rememberance of my youth and Dickens’ character Mr. Micawber. Since it is now about six years since that first went up, let me repeat some bits of the post.
When I was young I was fascinated by a small china statuette that my Grandparents had of Mr Micawber. He is a character, and a sympathetic one, in Charles Dickens's book "David Copperfield", in the course of which he goes into debt. His explanation of his financial condition can be compared to the coming world experience as we now live through Hubbert's Peak. You might, in today's phraseology, call this the Money quote:
'My other piece of advice, Copperfield,' said Mr. Micawber, 'you know. Annual income twenty pounds, annual expenditure nineteen nineteen and six, result happiness. Annual income twenty pounds, annual expenditure twenty pounds ought and six, result misery. The blossom is blighted, the leaf is withered, the god of day goes down upon the dreary scene, and - and in short you are for ever floored. As I am!'.
In this case consider that our expenses, i.e. the world use of oil, went up last year to around 83 million barrels every day (mbd). (A barrel is 42 gallons). Now as long as our supplies (income) can match this outlay then we are in happiness. This was, in relative terms, where we ended last year.
However this year our expenses are going to go up. It is a little difficult to predict exactly how much but current predictions are for this to be around 2 mbd. Let us equate this to the old English sixpence (which was back then worth about a dime. Twenty pounds being worth about $100).
We follow the Micawber example if our income, world oil supply, is equal to or greater than our expenses, and then we can stay happy. But here is the rub.
. . . . . . . . .while our income (supply) is nearly at a peak (twenty pounds), our expenses (demand) are still going up by this sixpence a year. So that some time this year expenses will have gone from twenty pounds to twenty pounds and sixpence. . . . . (the considerable needs in China and India . . .drive this increase.). . . . . .And if we are now at the peak of production, then our income cannot increase above twenty pounds and and may indeed fall back below twenty pounds, while our expenses will continue to increase to twenty pounds and sixpence. It is not the absolute size of the market that will now drive, but the relatively small fluctuations that take us out of balance.
The result is misery, and we are forever floored.
It is the small volumes that hold us in balance that are critical, rather than the relative small percentage of the change. If demand is growing at 1.4 mbd a year, and Libya loses us 1.6 mbd for only two years, then together they take demand on remaining supply up over 3 mbd this year and 4.4 mbd next year. If the world surplus is 3.5 mbd, and Saudi internal demand is rising at nearly 10% p.a. with the country holding to a 12 mbd total cap, then we are going to be in Mr Micawber’s unhappy predicament within 2 years. Let us hope that we have at least that long.
Contact
- Content: editors at theoildrum dot com
- Tech support: support at theoildrum dot com
License

This work is licensed under a Creative Commons Attribution-Share Alike 3.0 United States License.
Thanks for posting my plot Heading Out, but I had a slight error in it plus there has been some developments since that plot was posted. I had neglected to include one contract of Thunder Horse main field that had came on line after I started my data collection. Here is a new plot that includes that contract plus the two months of data that has been published since then. The data runs from June 2008 thru December 2010.
As you can see Thunder Horse main field has continued its decline since the maintenance that took it almost to zero. Combined production for Thunder Horse Main + North was 189,000 bp/d in December 2010. Production from main alone was just under 61,000 bp/d down from a peak of 167,650 bp/d in January of 2009.
Ron P.
Ron - Interesting to see the water cut getting to around 30% before they cut back production. By you graph they clearly only shut in the wells with water production. Just my WAG but that tells me their "maintenance" was to improve their oil/water separation. Eventually ever water drive reservoir reaches a tipping point when the designed separation is overwhelmed. Not a big problem onshore...just add more separators. With limited space on offshore facilities it's not so easy. Additionally there's another factor that can't be offset: time. Separation requires a breakout period of time regardless of the equipment. Eventually production rates are not determined by the ability of the wells to flow but the limits of the production facilities to process the flow. Notice when they ramped production back up the water cut increased by 1/3 to about 40%. Also typical of water drive reservoirs: shut a well in but the water level continues to move upwards towards the perforations. There's a time lag for the oil/water contact to move as the reservoir is produced. Another reason you do everything possible to not shut in less the water "catches up with you". Just guessing but the last two data points seem to indicate they were only able to improve separation to a small degree and now they've cut back on production again due to separation limitations.
Rockman, the maintenance on Thunder Horse Main in May and June was to replace a cracked undersea manifold. Wells on contract G14658 was completely shut down during those two months.
Thunder Horse main has two contracts, G14658 and G09868. The former, G14658 was the first to come on line and that contract alone reached a peak of 167,651 bp/d back in June of 08. In December that contract produced 21,835 barrels per day of oil and 21,119 bp/d of water, down from 43,769 bp/d of oil and 44,184 bp/d of water in November. The other T.H. Main contract, G09868 peaked at 47,981 bp/d in September 2010 and was down to 39,007 bp/d in December. That contract doesn't have any water yet.
Your comments on water in offshore wells is very interesting. I had not thought about that being such a problem before but now that you explain it I can clearly see the problem. Taking that into consideration I suppose they will be completely shutting contract G14658 down in a few months.
T. H. Main, G14658 oil and water production in bp/d, June 2008 thru Dec. 2010. Notice that water and oil production for November and December 2010 is almost exactly the same.
Ron P.
Ron - This is the same curve as you had above except now production was brought to zero during the maintenance period....correct? Looks like an even worse problem with water encroachment: last data point appears to be a 50% water cut. One of the keys is to plot total fluid vs. water cut. Before the maintenance they were doing a total of around 95,000 bfpd with a 1/3 water cut. The 30th data point shows a rate of around 86,000 bfpd with a 50% w/c. That shut in period looks like it badly hurt the production stream. The decreasing ability to separate oil/water is not linear. IOW it takes a lot longer than 2X to separate a 50% w/c than a 25% w/c. I've seen many onshore reservoirs at this stage classified as "walk-aways": the diminishing oil cut with ever increasing water separation/disposal costs means you would pay next to nothing for the wells. At least offshore you can go overboard with the produced water BUT it has to virtually have all the oil separated out. Again, takes more equipment and time. What will typically happen is that the higher w/c wells are completely shut in to max output of the wells with lower w/c. Increases efficiency but at the cost of total production. Typically those shut in wells never return to profitability.
If I were to have to put a net present value to those wells in an acquisition evaluation I was offer a very low balled value. Just too much risk/uncertainty.
And again, I'm somewhat over reaching in my analysis without all the detals. But BP has them and they should have some very clear expectations for the field's future.
No, incorrect. The chart above labeled "Thunder Horse Main" includes both Thunder Horse Main contracts, G14658 and G09868. This latest yellow chart is only one contract, G14658 and the only Thunder Horse Main contract with any water. The other Main contract, G09868, did not come on line until June of 2009, exactly one year after G14658 came on line. And yes the last two data points show a 50 percent water cut for G14658. I would guess that they are cutting back production on the other contract in hopes of avoiding water encroachment, at least hoping to get more production from it before the water hits.
Apparently G09868 has a different manifold and did not need replacing.
Thanks for the info on water removal. That is very interesting. I guess a very high water cut would be the death knell for an offshore field. And a rising water cut would say that the end is in sight.
Ron P.
Eventually ever water drive reservoir reaches a tipping point when the designed separation is overwhelmed. Not a big problem onshore...just add more separators. With limited space on offshore facilities it's not so easy
Can't oil with a higher water cut be shipped to shore and then run through seperators--there would of course be a a cost, but it would seem some onshore fields would be able to handle the water and reinject it into their fields. At hundred plus $ a barrel you'd think some of the more costly options that were not formerly considered might prove attractive--far more attractive than abandoning a super expensive project like Thunder Horse prematurely because of high water cut. There of course will always be a tipping point I'm merely suggesting it might be quite a bit higher these days.
*cough* amplified. If you look at growth of China's car fleet, it is at 60m growing at 18m per year. With a middle class population of 300m people, the demand is huge. They could reach 120m cars in four years!
India is behind China but has a similar huge population.
Where is all that oil going to come from? US drivers.
I guess we better start buying hybrids, against Russ Limbaugh's advice.
That's a great chart; where's it from? I assume it isn't the work of Robert Baertsch, whose server was hosting the file - he seems to be strictly working in genetics.
Agree all the way about China. They'll have to efficiency themselves to the moon to not be equal to the US in demand very soon.
Yes, it is Robert (me). This oil stuff kept me up at night and delayed my PhD by two years. Hopefully someone will find the chart useful. The genome stuff is very interesting but working on transportation is urgently needed. Check out my latest project at NASA http://www.plumtv.com/videos/masters-of-innovation-space-age-green/index.html starting at minute 14 that was broadcast on plum tv.
We are looking for good engineers.
Another important point is that of the 18 million cars that will be purchased in China this year more than half are from a first time car buyer. This means at least 9 million new consumers for oil in China just this year.
Now everything goes toward electricity. Plug in cars, motorbikes, heatpump for home heating, electricity cooking... Where will that electricity come from? we are more or less at maximum production capacity. The only solution is to reduce energy needs, or energy efficiency if we can afford it. In Europe, electricity is 10% up since the Fukushima disaster.
Energy efficiency is a big winner. We need to move toward transportation systems where the ratio of the weight of the passenger to weight of the vehicle is 1:1. Currently we drive around in vehicles that weigh 20x more than the passenger.
 Safety or societal suicide?
Robert, Got any use for a physics graduate from MIT? One of my lovely daughters finishes there in May and has spent time working on electric car research. Bill
I read "hybrids" in the above as "bicycles". Funny how your brain plays tricks on you.
A presentation of the various post peak nations would be instructive, perhaps. As you say they're almost to a man below their historic highs, and it would be a simple thing to project their experiences onto other countries, to see what would unfold, along the lines of Kopits's projecting Chinese demand based on what other developing nations have gone through in the past.
Also Staniford dutifully documented that Iraqi production is at a Post-Invasion High. Big deal, you say, they've been creeping up for 7 years now - but this latest month is a sharp deviation up from the trend. Most agree that Iraq will be good for something in the way of gains down the road, which could well entail them overtaking their most recent peak.
In poker, we'd call Iraq's oil production boasts for the future a flat out bluff.
I also learned a little literature here:
"Wilkins Micawber is a fictional character from Charles Dickens' 1850 novel David Copperfield. He was modelled on Dickens' father, John Dickens, who also ended up in a debtors' prison (the King's Bench Prison) after failing to meet the demands of his creditors."
If Micawber is right, the solution to oil misery is to produce slight oil surpluses by developing unconventional oil reserves, which will be seen as more competitive at times of high prices anyways.
Today worldwide unconventional oil represents about 4 million bpd. If that were doubled it would spare the world economy a good deal of anxiety(although it cannot replace conventional oil outright).
Most unconventional oil resources are in Canada, Colorado and Venezuela.
Would that it were that easy.
Of course it's that easy but TPTB, particularly Big Oil have a lot to lose if oil prices are kept low by plentiful supply. The object is to keep them as high as possible. And the objections to unconventional oil are the same---oil prices are too low!
Have you forgotten about the Synthetic Fuels Corporation?
http://en.wikipedia.org/wiki/Synthetic_Fuels_Corporation
http://www.fas.org/sgp/crs/misc/RL33359.pdf
No, it is not that easy and there is no unconventional oil in Colorado. Kerogen is not oil. Also so-called "Big Oil" is not holding oil off the market in order to keep prices high. OPEC's national oil companies are claiming to do that but there is now a great deal of doubt if they actually have any spare capacity. Also, The Powers That Be is not Big Oil. Big Oil or Exxon, Shell, BP, etc. are just large corporations answerable to their shareholders. They are not "The Eletes" or "TPTB".
Only in dreamland are there any simple answers to the world's complex problems but it is obvious that you live in dreamland so I can understand very well why you think there are simple answers.
Ron P.
Well, my reference shows that the Synthetic Fuels Corporation actually produced thousands of barrels of oil and that the program was halted because of low crude prices.
You claim that it is impossible because 'Kerogen is not oil.'
Then you claim that the oil companies don't conspire to fix prices
and don't fight against alternative fuels.
Tosco produced 100000 barrels of oil.
The Stuart Oil Shales pilot plant(mothballed) produced
1.5 million barrels of shale oil.
Supreme Court Spikes Oil Price-Fixing Case
http://www.foxnews.com/story/0,2933,186289,00.html
Big Oil vs Ethanol
http://www.consumerfed.org/elements/www.consumerfed.org/file/Ethanol.pdf
Big Oil vs Electric Car
http://en.wikipedia.org/wiki/Who_Killed_the_Electric_Car%3F#Oil_companies
Instead you maintain the innocence and helplessness of the Big Oil companies(ever hear of Dick Cheney, ever heard of Iraq?)who own Congress while screaming about the OPEC cabal which has proven totally feeble, since 1980 unable to control oil prices worth a damn.
Ever read the history of the oil industry?
You're a plyoot, Ron.
Maj, could you be a little civil?
And how is it that oil companies have an interest in high oil prices when they don't own the oil? Most production is owned by NOCs and it is they who get most of the benefit of increases in prices.
The exploration companies, now they are the ones who have an interest in high prices.
And, puleaze, spare me on the who killed the electric car story. If the EV1 had a chance of making money, it would have been produced. Now that gasoline prices are much higher and EVs are much better, they have a fighting chance for a niche market, but ten years ago, forget it.
Maj, you forget about demand growth. Even if we could put 4 million barrels of unconventional oil onto the market today, that would only make up for what, two years of demand growth? And to put those 4 million on the market is a hughe effort.
Add to that the continual decline of conventional oil, that has to be offset to.
Huh? Somebody needs to look at some more recent data. 2009 just doesn't cut it as "recent."
From Stuart Staniford's blog:
Iraqi Oil Production Reaches Post-Invasion High
Now, it still hasn't reached the 3 million bpd peaks in 2000-2001, but it's easily over the average of 2.5 million bpd of that time period. In fact, it started bumping against that number the middle of 2009.
Methinks someone else needs a gentle correcting cough.
Cough, cough. What about internal consumption?
Besides, where is this really headed. Sharistani said 12mbd. Informed industry observers say 6mbd would be the best case. Iraq isn't exactly headed in the direction of a best case scenario. So let's be optimistic and say they can reach 4mbd in two years. In that time, world depletion will have removed something like 10 mbpd from current production (my estimate, others may disagree).
Of course, things could change. Iraq's government could become functional, sectarian fighting could disappear, massive deteriorated infrastructure could repaired or replaced -- all those things needed for a big jump in Iraqi production could happen, but I think it unlikely.
And if it does happen, there are millions of Iraqis demanding electricity and fuel. Will they be denied?
What you say is spot on, KF. If we don't repair Iraq, oil production can not be sustained and will not grow. If we do repair Iraq, everyone in Iraq will benefit and internal consumption will eat a larger and larger share of production. In nither case will we see a significant growth in export from Iraq.
I live in a country that have no domestic oil, I only care about export volumes.
The pertinent word was "quickly", since Dr Saleri implies a rapid return to pre-revolutionary production. I remain unconvinced that, as revolution sweeps through some of the oil producers that we will, very shortly after the major dust settles, be back at pre-revolutionary levels of production. And I cite the above figures as evidence thereof.
Jeez, guys....Where's WT when we need him most?
Since you asked. . .
Some longer term data for Iraqi crude oil production:
http://www.wtrg.com/oil_graphs/PAPRPIQ.gif
And 2009 (and probably 2010) net oil exports from Iraq were below their 2008 level. Given their recent rapid increase in production, they have to increase their production at a pretty rapid clip--just to maintain constant net oil exports. If we skip the invasion year (2003) and measure from 2004, Iraq has to increase their total liquids production at about 5%/year, just to maintain constant net oil exports. Iraqi total liquids consumption (EIA):
I could view the image only by hitting the reply button. So, I'll reply. Great graph, thaks so much WT. Look at that hockey stick increase! Wonder what 2010 numbers will show.
Corrected typos:
Given their recent rapid increase in consumption, they have to increase their production at a pretty rapid clip--just to maintain constant net oil exports. If we skip the invasion year (2003) and measure from 2004, Iraq has to increase their total liquids production at about 2%/year, just to maintain constant net oil exports.
Your chart shows a whopping 400K bpd increase in consumption over almost 30 years. The chart on Stuart's blog shows an increase in production of almost that same amount in just 3-4 months.
I just doubled the production from one of our fields, over a period of about three months. If I extrapolate this rate of increase out, with time I guess could exceed Saudi Aarbia's production.
Incidentally, it's always possible that monthly numbers are distorted by variations in inventories, but in any case, the 2004 to 2009 rates of change in Iraqi production and consumption were as follows (EIA, total liquids):
Production: +3.6%/year
Consumption: +4.7%/year
2009 Iraqi Data (EIA):
Production: 2.4 mbpd
Consumption: 0.6
Net Oil Exports: 1.8
For the sake of argument, if we extrapolate the above rates of change for production & consumption, the projected Iraqi net oil exports at 10 year intervals would look like this (assuming 40 years of non-stop increases in both production & consumption):
2009: 1.8 mbpd
2019: 2.3
2029: 3.1
2039: 4.0
2049: 5.0
I wonder if post-Soviet Russia might serve as a model for post-2003 Iraq? Although Russia's production rebounded strongly, they have still not exceeded their Eighties peak. In a possibly similar fashion, Iraq has a way to go before their annual production will exceed their 1979 peak rate.
Incidentally, including Iraq, our analysis (based on BP + minor EIA inputs) showed that nine countries (with 2005 net exports of 100,000 bpd or more) showed increasing net oil exports from 2005 to 2009. Their total 2005 to 2009 increase was 2.9 mbpd (including 0.5 mbpd from Iraq). Here are the 2005 to 2009 global net export data, along with the "Chindia" problem:
Note that increasing net oil exports, from some countries, have so far only served to slow the post-2005/2006 rate of decline in global net oil exports. Also, note that the combined increase in exporters' consumption + Chindia's net oil imports from 2005 to 2009 was 3.4 mbpd, versus Iraq's increase in net oil exports of 0.5 mbpd over the same time frame.