Tech Talk - The East Texas Field Develops
Posted by Heading Out on May 8, 2011 - 5:21am
Last week I discussed the start of oil production in the United States and the evolution of the Appalachian fields, which, for a while, were the most productive in the world, but are now largely depleted. It was possible, however, to take the odd well to show that where production is largely managed, so the ultimate recovery from a reservoir can be continued for decades.
Appalachia was displaced as the production leader by the East Texas oilfield. This field, with oil held in the Woodbine sandstone, was first discovered in 1927, though there was no significant production until the end of 1930.
The first oil leaving the field went in thirteen tank cars of 10,000 gallons each to the Sinclair refinery in Houston. Later, in December 1930, Ed Bateman, a Fort Worth promoter who ran a poor-boy operation called Bateman Oil Company, completed a well ten miles to the northwest of the Bradford No. 3 in the E. G. Sevier Survey, Rusk County. It was the Lou Della Crim No. 1, and it flowed 22,000 barrels of oil per day from 3,653 feet. With four producing wells at the end of 1930, East Texas field reported a yearly production of 27,000 barrels of oil and no gas.
This led to an immediate frenzy of drilling, which in turn led to the first controls on well production, with the Texas Railroad Commission preceding OPEC by decades in the moves that it made to define targets for production. There are a couple of other relevant stories about the field, and so it is a useful second stop as we look at the evolution of American oil production.
There are (as with many things) rather a lot of oil and gas wells in Texas. In 2005 there were still 66,951 active gas wells and 151,605 active oil wells.
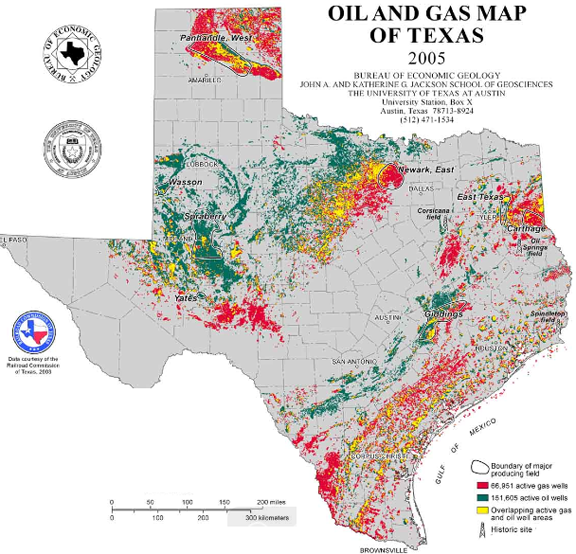
The state, and surrounding regions, have a number of different oilfields within their borders, with East Texas being where you might think.

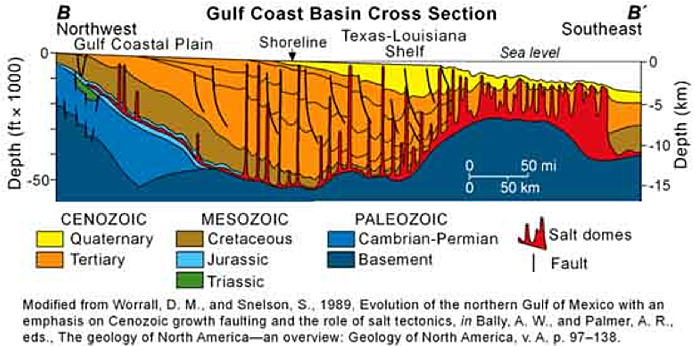
A section along the B-B’ line gives some idea of the formations, and will be a useful guide when I come to talk about reservoirs associated with salt domes later in the series, although they were the cause of the first great Texas oil rush at Spindletop.
East Texas was not the first oil field in Texas to be brought into production, nor the most famous. That resides with Spindletop down near Beaumont in Southeast Texas which is remembered as the most dramatic, when it blew back in 1901.
On January 10, at around 10:30 a.m. the Lucas Gusher at Spindletop blew. The oil spray, which could be seen for ten miles, was fully six inches across and rose to over 200 ft above the derrick. . . . . .
Nine days and 800,000 barrels later, they cut the gusher off.
Over 285 active wells were drilled into the formation under Spindletop Hill. But the field rapidly declined in production over the next five years, although it was a major contributor to America being able to reach a production of 1 mbd in 1919.
The overabundance of wells at Spindletop led to a rapid decline in production. After yielding 17,500,000 barrels of oil in 1902, the Spindletop wells were down to 10,000 barrels a day in February 1904.
In 1926 there was a second surge in production, which was more controlled and gave the field peak at 21 million barrels in 1927 (out of a total field production of around 153 million barrels), but this had petered out by 1931, just as East Texas was surging. Spindletop is credited with being the first well to use drilling mud, rather than water, as the cooling and transportation fluid to get the cuttings out of the hole, while keeping the hole itself stable.
The production potential of the Woodbine sandstone in East Texas, in contrast, was greatly helped because the oil lay over water, and this underlying water helped to sustain the driving pressure that helped keep the wells in production over longer time intervals. Of course that only holds true to a degree. And back in 1931 there was little constraint on how close wells could be.
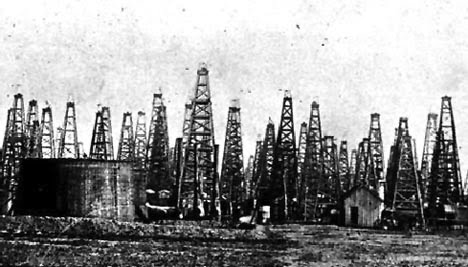
This led to a great rush to bring wells into production, given that the this production was governed by what is known as “the rule of capture.”This, in essence said that if the well came into your well by flowing out from under your neighbors yard, then that was just tough for him/her, providing that your well remained on your land all the way. That ruling came about ultimately through an 1889 Pennsylvania Supreme Court decision. However it should be noted that the well has to remain on your property. There was a considerable scandal in East Texas in 1962 when it was discovered that some wells had “bent” so that instead or remaining on the owners property they ended on someone else’s lease, and took that oil. That is not allowed, and became a scandal when the scale of the mischief was discovered.
It was learned that operators had drilled slanted holes from barren acreage beyond the limits of the field back into the Woodbine formation, tapping into productive leases owned by major companies. During a series of investigations, inspectors found 380 deviated wells in East Texas field and shut them down. An estimated $100 million worth of oil was stolen over several decades from legal owners. Many of the oil pirates were leading citizens of East Texas communities.
Yet this wasn’t the greatest problem with the field. So productive did the wells become that the amount of oil available saturated the market available, and within months the price of oil had plummeted. It began the year at $0.99 a barrel, but by July was down to $0.13 a barrel, and something had to be done. The industry answer had been to increase production at individual wells as the price fell, but the problem with increasing production can perhaps be illustrated by example.
If you take a cup of black coffee and very carefully pour cream into the cup over the back of a spoon at the level of the coffee, you can “float” the cream on top of the coffee. (And if you are of that frame of mind you can do this with various types of alcohol in a bar). If you put a straw into the cream and suck gently you can pull most of the cream into the straw, and thence into your mouth (production) without getting any coffee. But if you suck too hard then the coffee comes up through the cream into the straw and you can’t reverse the situation.
So it is with an oil well. If there is water under the oil (as there is in East Texas) then sucking too hard (relatively) will pull the underlying water up into the well rather than the surrounding oil. The process is called “coning” and can be illustrated.
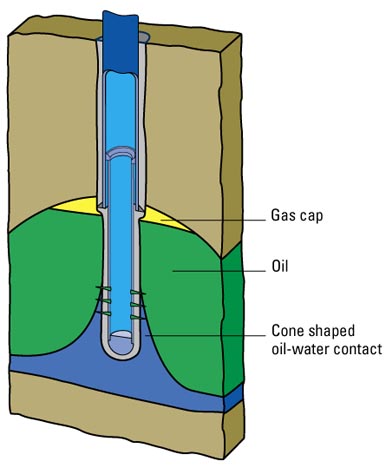
Obviously this is not desirable, but if the alternate to pumping like crazy to get all the oil out from under your derrick before it all flowed to your neighbors was to lose the production to them, folk just hoped coning wouldn’t happen to them. The combination of damage to the field, and the glut of oil that this produced had an immediate effect on price. Something had to be done, and it was.
On August 17, 1931, the governor ordered the Texas National Guard and Texas Rangers into the ten-month-old field to shut in all of its 1,644 wells and to maintain order. The field resumed production on September 5, 1931, under a new proration order that limited its production to 400,000 barrels of oil per day, permitting each well 225 barrels and giving no consideration to its potential or to the characteristics of the lease. New wells came on line, and by October allowables were reduced for each one to 165 barrels per day.
And it was from those days that the Railroad Commission of Texas acquired its power. But that is a sufficiently interesting story that I will go into it more next time.
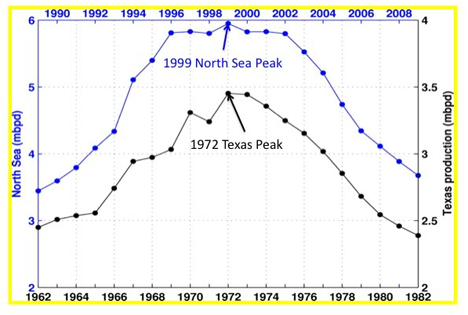
In the interim, let me leave you with this thought. The production of oil in Texas peaked in 1972, and in March of that year the Railroad Commission lifted restrictions on produced volumes for individual wells.
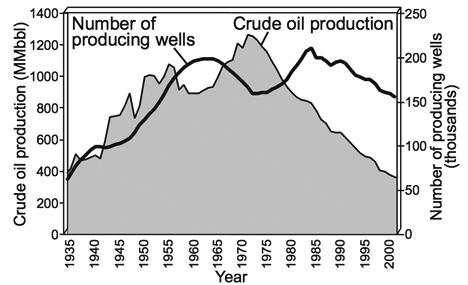
However the profile of that peak, and the resulting decline (in which period there were no longer regulatory restrictions) has, as Westexas has noted, been similar to the decline of other fields. It thus allows modeling and a prediction of future oilfield production post peak. But that too is a topic best left for another day.
Contact
- Content: editors at theoildrum dot com
- Tech support: support at theoildrum dot com
License

This work is licensed under a Creative Commons Attribution-Share Alike 3.0 United States License.
Thanks again, for more good info.
http://www.theoildrum.com/node/7874#more has the statement, "(And the indications are that it ["the next crisis"] may well hit right around the next election)."
There was a piece which commented that, at the ASPO conference last October, the forecasts seemed to converge on about late 2012, for the timing of the world’s next big “oil shock” (2008-9 having been a preliminary to it).
Looking forward to the piece on the Texas Railroad Commission -- it's certainly an interesting bit in the history of energy regulation.
Jean Laherrere on East Texas. See figures 11 a,b and c
http://jayhanson.us/page178.pdf
The following from WTRG Economics suggested that the Texas (primarily East Texas) peak increased the effectiveness of the 1973 OPEC embargo.
"Throughout the post war period exporting countries found increasing demand for their crude oil but a 40% decline in the purchasing power of a barrel of oil. In March 1971, the balance of power shifted. That month the Texas Railroad Commission set proration at 100 percent for the first time. This meant that Texas producers were no longer limited in the volume of oil that they could produce. More importantly, it meant that the power to control crude oil prices shifted from the United States (Texas, Oklahoma and Louisiana) to OPEC. Another way to say it is that there was no more spare capacity in the U.S. and therefore no tool to put an upper limit on prices. A little over two years later OPEC, through the unintended consequence of war, obtained a glimpse of the extent of its power to influence prices.'
http://www.wtrg.com/prices.htm
I recall the controversies during the declining years of Texas production over restrictions on the importation of oil from the Middle East. One could hear inflammatory political statements such as "Burn America First" and "Strength Through Exhaustion"
Here's how the Texas peak was announced in the papers:
The Bulletin - Mar 17, 1972. Not very "OMFG!, TEOTWAKI!" you notice.
Lots of interesting statistical data. From the chart it says that there were 181,000 active wells in Texas in 2005. This table from the EIA http://www.eia.doe.gov/pub/oil_gas/petrosystem/us_table.html gives the distribution of production rates from existing oil rigs in the entire USA. The total number is 363,459, and integrating the rates for 2009 gives a total production of 4.7 million barrels per day for 2009. The other EIA data from http://www.eia.gov/dnav/pet/pet_crd_crpdn_adc_mbblpd_a.htm gives 5.361 million barrels per day. So it works OK except for an extra 660 thousand barrels coming from something other than a tally of individual oil wells.
From the previous year (2008) there is about a 400,000 barrels per day increase. Trying to correlate this with the oil well data, 300,000 barrels per day difference comes from an extra 17 high rate wells that produce on average 18,000 barrels per day. These are the top of the end producers from the histogram below:

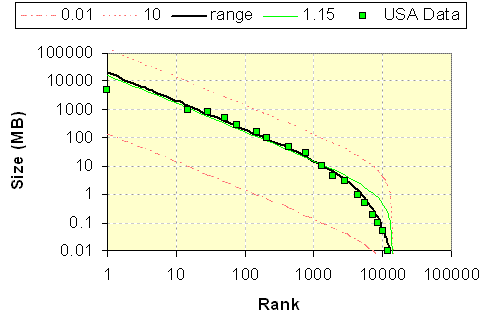
The model fit shown is based on a dispersive aggregation of reservoir sizes and an assumed constant proportional drawdown from the reservoirs.
The two curves have the same basis and are related just by the assumption of an average drawdown. When you start with a distribution of reservoirs initially and a given drawdown rate, then some years later the same distribution would remain as an invariant. The same relative rates would remain while all the reservoirs shrink in size proportionately. That is the beuaty of a proportional drawdown model and why HO shows that it is so important not to get greedy on extracting the oil -- there is a natural proportional rate that the reservoirs should be extracted at.
The bottom line is that this weird uptick in USA crude production from 2008 to 2009 is likely due to an extra 17 wells that started producing. (I don't think they are Bakken oil fields as these wouldn't be individually large producers would they? Are they Gulf fields?) This is either a real thing or it is due to miscounting in the statistical data collection.
(in thousands of barrels/day)
So the fluctuations in the data are possibly accounted for just from the high end. This either can be substantiated or the EIA practices sloppy bookkeeping and can't keep track of the producers.
In other words you could not predict this, what a big surprise.
No wonder you do not try to tackle Brazil or Russia or Iraq or any other country that makes a difference.
It is a lot more than that. The number of high-rate wells more than doubled from 2008 to 2009 going from 13 to 30. Reservoir size distributions are very fat tailed so anything added to the mix will show up in the bottom-line numbers.
I bet that these are all GoM wells and probably explains what is happening. Look at the %production and one can see how important these are to temporarily slowing the decline. They also have a higher extraction rate; I plotted this curve last year from data off the historical (back to 1975) Maximum Production Rate numbers from the former MMS (http://www.gomr.boemre.gov/homepg/pubinfo/repcat/product/MPR.html). This is a tough site to get data from as the data is embedded in PDF's.
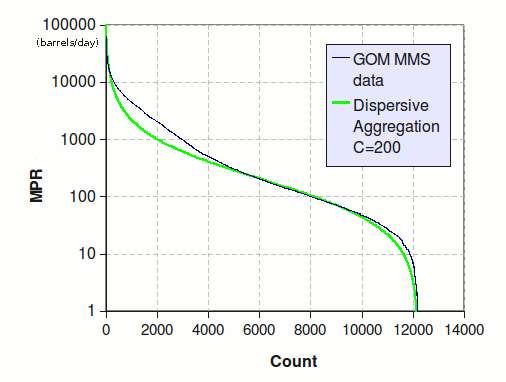
Notice that this is in terms of a maximum production rate and the median of 200 barrels per day reflects the fact that companies are only going to extract from a GoM well if it can provide a high initial return. Still it shows how few wells produce at over 10,000 barrels/day (maybe 3% of them).
BTW, the missing oil from the previous tabulation was due to crude oil collected from wells classified as mainly producing natural gas. You can see that on the EIA table.
This is cool stuff because all the models fit together like interlocking jigsaw puzzle pieces and if one piece is missing you can reconstruct the missing data from the pieces around it. What makes it difficult for most analysts to deal with is that the jigsaw pieces are statistical in nature and the fitting is done in terms of probability distributions of various observables.
Uncertainties due to Brazil and Iraq are missing pieces that fit into the global discovery data fat-tail where a good model includes a projected statistical distribution.
Ron - I'm pretty sure those high rate wells are DW GOM. I know of nothing with those types of rates onshore. And yes: DW wells are designed for max rate. They'll also come on line in batches. Maybe 5 to 10 at a time when the facility is finished. But that makes the sudden increase deceptive: these wells are not going to produce 20+ years like Ghawar. It varies of course but most won't last more than 6 or 7 years. And not a those high rates. Unlike much of our mature production the decline rates of these DW wells will be much greater. Unfortunately it may happen just when PO effects reache serious levels.
Minor correction amid the top notch comment: we used to have these kinds of rates onshore. Legend (i.e. Wikipedia) has it that Spindletop had a high maximum production well:
Interesting how the discussion wraps back to Texas.
So true Don. There were some very high rate wells in sone of the carbonate west Texas fields way back in the day. But sadly those days are long gone. The Eagle Ford play has been reporting 1,200+ bopd initial rates. But a 70% decline rate goes along with those big wells.
The fields that have the hyperbolic decline characteristic drop down fast but then can drop off slower than exponential. This appears a property of a big field having a mix of decline rates, some fast and some small. The big fast ones make their initial appearance quite strikingly and then the slower rates bring up the rear.
For those interested in an analogy, the same thing happens with nuclear waste dumps. The high rate decay materials make it appear that radioactivity and waste heat will quickly go to zero (see Fukishima) but then all the slower rates contribute and extend the tail for years. What makes the oil depletion analysis interesting is that this same kind of dispersion in rates occurs and it varies even more because the geology varies. Every combination can occur:
(1) slow initial decline, slow long term (damped exp)
(2) fast initial decline, fast long term (damped exp)
(3) fast initial decline, slow long term (hyperbolic)
(4) slow initial decline, fast long term - usually when something goes wrong, due to overdrawing or a decision to shut in.
And then of course the common
(5) reserve growth, which can give a field the appearance of new life or replenishment.
The nuclear decay analogy is not that simple. Many of the fast decaying atoms is reduced to other - still radioactive - atoms, wich decay at a slower rate. So it is not (only) the matter of the faster runners dieing leaving the slower runers to keep the race going, but the faster runners getting tiered and joining the slower ones.
Of course, that is why I labeled it an analogy instead of an equivalence. The decay of radioactive is to the -0.2 power while the hyperbolic decline for oil wells is just a -1 in the cumulative. I don't really care to solve the radioactive piece but the derivation for oil is bloody simple.
"DW wells are designed for max rate: these wells are not going to produce 20+ years like Ghawar. It varies of course but most won't last more than 6 or 7 years. And not a those high rates. Unlike much of our mature production the decline rates of these DW wells will be much greater."
I am in the industry but new to posting on here, why is it they are running these well at such high rates? Why would they not cut them back to prolong there life?
Because you have to rent a very expensive floating rig to operate deepwater oilfields. And if they don'tproduce oil (ie money) fast enough to pay the rent, your out of buissiness. The well is plugged the same day financial net gains hit zero (or even sooner). There is no offshore stripper wells.
LA - Also it's the way economic value is calculated in the oil patch. NPV (net present value) is one of the key metrics. Think of it as a reverse interest rate. A very simple example: two projects, A & B. Both cost $800 million to develop and A will recover 300 million bbls of oil and B 350 million bbls. But A does it in 7 years and B in 12 years. Thus A has a much higher NPV than B. Assuming oil prices say fixed B will generate more income than A. But the rate of return (another very key metric) is much higher for A than B. So if the operator has just enough capex for one project he does A.
Even more simply: would you put your life savings into CD earning 3% or 5%?
WHT
I think that you're making a very basic mistake here - start your data series in 2002 or 2003, when US production was around 5.7mbpd, and then consider the effects of the 2004, 2005 and 2008 hurricane seasons on GoM production, and by extension, total US production.
Basically the 2009 and 2010 rebounds are largely due to GoMex production coming back to full stream ( 2009 ), and then increasing a bit ( 2010 ). Increases in ND are a subsidiary reason - if you net off the declines in Alaska production, it really only accounts for about 80 kbpd in the increase.
In a broader sense, the big question is whether US production, in spite of record nominal prices in the post-2005 era, can surpass 2003 production levels of, IIRC, 5.681mbpd.
I don't think I am making a very basic mistake. If my mistake was that I didn't analyze every last bit of data, then you are asking for impossible perfection. The answer to that is to do some of the analysis yourself and then post it here.
In reality, I think the tragic mistake is that the EIA does not make available the complete set of data so that we don't have to do all this reverse engineering to figure out what is going on. I was able to gather the incomplete data, compare it against other known data and come to the conclusion that the increase was due to doubling the wells in the Gulf of Mexico. That is called the scientific method.
For people interested in more of the history of the East Texas field (and a few other major fields) the book "The Big Rich" is fascinating. It doesn't get too much into the mechanics of the fields, but the wheeling, dealing, and stealing involved in the early years of Texas oil is amazing.
FOR ALL - Just a little additional romance to Texas and the TRRC: the primary law enforcement arm of the TRRC is..Ta Da!...the TEXAS RANGERS. Yes...Chuck Norris himself rules the oil patch. In addition to cattle rustling they take care of oil field thievery. They also hunt down oil patch frauds and hang them on the spot. Well...they don't hang them anymore...damn liberal judges! I’ll skip the details since I’ve told the story before but years ago my partners and I turned the Rangers loose on some scumbags selling a bogus drilling deal. As I’ve mentioned one of my biggest disappointments was not being there when the Rangers hauled them off in cuffs. Would have been a good day for hanging too…unseasonably cool and dry.
I also helped catch a couple of haulers illegally dumping oil field wastes. Unfortunately the Rangers let the state troopers handle that...too small to wake Chuck up for.
I remember reading somewhere that an industry analyst was asked why OPEC's production limits weren't as effective as those of the TRRC. His answer was that OPEC couldn't send the Texas Rangers out to enforce their decrees...
mc - And enforce them they did. Not old enough but have heard stories. One way to beat the TRRC's production limits was to over produce one well and allocate it to a lesser well that had a false hight rate potential. So you had Texas Rangers staking out oil tanks in the middle of the night watching out for covert oil movements. Also worked undercover as oilfield hands on occasion.
Between Pennsylvania and Texas there was California.
Oil had been discovered in Northern California in the 1860's, but that was in small quantities. The Los Angeles field was discovered about 1898, and led rapidly to the discovery of additional highly productive fields in Southern California.
‘Oil!’ and the History of Southern California
The juxtaposition of the oil boom, the real estate development boom, highway and road building, the development of the car culture, and the movie industry to popularize the new American way of life make the "Kuwait of the jazz age" sociologically important to where we are today.
Don't forget the California Water Wars in the first quarter of the 20th century, and the Hoover Dam/Lake Mead impoundment. Absent those very large water projects, Southern California's population growth would not have been possible.
Aqueducts and water systems were also important to California north and south, along with roads and bridges such as the Golden Gate and Oakland Bay Bridge, railroad bridges and tunnels, port and naval facilities, etc.
California epitomises the triumph of civil engineering over common sense.
I am sure the Martians, when looking at earth, have seen the California aqueducts and speculated about a quasi-intelligent/civilised race of beings making canals to take water across their drying patch of planet.
As a civil engineer I have to say I resemble that remark - but claim the Nuremberg Defense of "just following orders" - it was the politicians of the day who made the decisions, after all.
I am yet to see anyone of note in California say they need less water, not more.
IMO, now that most of its oil is gone, Southern California is one of the least sustainable areas in the world--right up there with Saudi Arabia.
Can you imagine what KSA will look like when its oil production is less than a quarter of what it is now? Unless you are old, like me, you will live to see that day.
Texas is running out of oil and water at the same time--not, IMO, a good time to live in most of Texas. Shortage of water will hurt Texas even more than declining oil and gas production has.
I wrote a piece on the Texas drought a couple of weeks ago. It doesn't seem to have improved, with 25% of the state now in a "severe drought" condition. And, unfortunately, it doesn't look as though it is going to get much better soon.
What I had in mind mostly was the depleting of the great Oglalla aquifer. That is going to greatly hurt not only Texas but also several other states in the Great Plains.
We need oil to run our machinery (now), but we shall always need lots of water to grow most crops, including pasture and hay for cattle.
Texas is way past peak oil and also seems to be past peak water. It is amazing to me, however, how the state continues to generate jobs. My guess: Peak Jobs in Texas within three years--then decades of decline, going along with declining oil output (even counting deep water offshore) and declining water resources.
The longer term Texas outlook is bleak indeed.
Maybe Don but most of the job growth in Texas has been non-ag and cattle. As long as the cities have water I don't think job growth will be hurt too badly...but just a guess. Decades ago the cities cemented their claim to water resources. For instance there's a 200 mile 60" water line running from a lake west of Houston to Corpus Christie. Been there at least 30 years. Houston will never go dry: lots of surface water coming down from east Texas. Dallas is probably the largest city at risk. You recall T-boon's plan to ship windmill electricity from the west to Dallas but also acquired the right to lay a water line along the route. And what a coincidence...he had also acquired a lot of water right in the area of his wind farms.
Dallas has been struggling with a long term water plan (50 years). Maybe 80% supply is "likely," with 20% "in doubt."
http://www.google.com/search?client=ubuntu&channel=fs&q=dallas+water+pla...
Seems to me his wind farms are in some pretty dry areas. I know that Texas seems to allow some pretty liberal use of Ogallala waters, but I doubt this can continue. So, where does T. Boone get all that water?
http://www.texastribune.org/texas-environmental-news/water-supply/how-ba...
Anyway, the Pickens Plan is to divert your attention while he makes his money on NG.
Craig
As Mark Twain famously opined; " Whisky's for drinking and water's for fightin' over" but I don't think I'd even want to be on the sidelines of an intra-Texas fight for water!
It will end the same as it always does - the cities will outbid the farmers for it, and the farmers will gradually (and grudgingly) go back to being dryland farmers. The cities always produce more economic value from the water, which is indeed the optimal allocation of resources - as long as you are not a farmer.
Monetary value perhaps, but from a utilitarian perspective it depends on whether the cities use the water for drinking, washing, etc, or whether they use it for filling swimming pools, watering lawns and plants, misting systems to cool patios, etc.
Merril - "Monetary value" - Is there any other? Sometimes you confuse me, brother.
This is a fairly obvious point, but I'll make it anyway. Cities can quite easily ban people from using water for filling swimming pools, watering lawns and plants, misting systems to cool patios, etc. If they are short of water they will do that, and they often do so.
In Seattle in the wintertime it's kind of pointless. People want much less water on their lawns and plants, not more. You get sick of nothing but endless mist on the patio after a few months of continuous rain.
Actually on a list of annual rainfall in major US cities Seattle is #54. Portland is #56. Houston? #14. What PNW have in copious amounts is overcastness. Is that a real word? Grey skies. We had a false alarm of two sunny days in a row last week, next day was grey again and I overheard some student on the college campus sobbing away on her cell phone about how she couldn't take it any more; what "it" was I didn't find out but wouldn't be surprised if it was the 9 months straight of dim monotone drizzle.
KLR- We might lose our spot this year. The usual rain we get when the spring cool fronts blow thru haven't materialized...at least not yet. I think I heard we were around 15+ inches behind for the year. Grass isn't browning up yet but it's only starting to hit the 90's.
Also, the total evapotranspiration (that is a real word) is much greater in Texas than the PNW, which is why it is perceived as being a "drier" state (in terms of water, anyway).
But Texas is having a (water) drought at the moment. Here is a "drought map" , using the NOAA Standardised Precipitation Index showing the rainfall for the US over the last 3 months - so, as often seems to be the case, the Rockman is right;
Too bad the black area isn't oil!
As with all US maps, The World Ends at the 49th parallel, so you dont know what is happening up north, where much of the midwest weather comes from.
The full collection of maps, going back for 24 months is at the NOAA site linked above.
I notice that all the maps show the PNW as being "abnormally moist" - it probably always is!
Yeah, had heard about the TX drought - thanks for the link/graphic and on-the-spot report, guys. Grew up with 15"/year myself, on Oregon's dry east side. Can be done. 'Course the county's population was <10k.
Aren't these deviations from a norm on your map, Paul? That county I grew up in shows as "abnormally moist," which it certainly isn't. My link is for rainfall 1949 to 2006, too. Presumably TX will be nice and soggy again soon...well, the merely large parts of its hugeness that are soggy, that is. Unless we are truly in a new norm, natch.
AGW forecast for my area is more precipitation in the winter, and more violent at that, plus hotter summers. Sounds like time to move into a burrow...
KLR, keep in mind this map is showing what has happened overt the last three months, compared to "normal", so abnormally moist just means they have had a wetter than normal Feb-Apr. If your county has a median rain of just 3" for those three months and got 3.5", it will show up as "abnormally moist", even though it is obviously a dry climate.
The normal is actually the median precipitation for the period, based on historical records. but in all the maps from the last month, to the last 24, the PNW coast is in the green, meaning above normal. People in Vancouver always say it has been a "wet year", regardless - which really means wetter than they would like, not wetter than normal.
The actual definition, from that website, is the sort of thing that WHT eats for breakfast;
WebHT would fall asleep reading something that bothered to define what median is! I can grok that no problem.
It's been a pretty typical year from my perspective. Little in the way of snow, whenever anything sticks at all I ask people how they're coping with the Blizzard of '10 etc. The news coverage is scarcely less frantic...
Odd that "abnormal" is less severe than "moderate" on that map. Seems like it should be the other way around. And it shows that this neck of the woods has been a bit wetter.
I eat this stuff as snacks.
Certain distributions are only defined by a median. The one that I use for reservoir size distributions, for example, is best characterized by a median size (half bigger and half smaller). The distribution is so fat-tailed that the mean value diverges to infinity unless the distribution is truncated at high values. So the majority of the points follow the median profile accept for the big outliers, which can come and go.
That curiously explains why the production rates of all the wells in the USA have a median of only 1.6 barrels per day but the mean is actually closer to 13 barrels per day -- see that figure I posted upthread. The future in oil is all about a convergence toward this median.
Rainfall has similar statistics but not nearly as fat-tailed. I have a section on extreme values in rainfall amounts in The Oil ConunDrum, p.572. My working theory is that huge rainfalls are really an accelerated build-up and trigger phenomenon. If you can follow the argument, the distribution actually looks very similar to a Logistic.
Yeah. Who the heck needs food anyway?
Craig - Texas doesn't "allow some pretty liberal use of Ogallala water" per se. Water rights are essentially like real estate: if you own it you pretty much get to use it as you wish. T-boon started buying up O. water rights years ago. But I'm not sure his plan is still progressing. One reason his wind farm was going to be commercial was that the tax payers of Texas were going to foot the $2 billion bill for the power lines to Dallas. I'm not sure that part has worked out for him...yet.
Most of the fighting over water rights are for "riparian" rights of downstream owners on flowing streams. Riparian rights for down reservoir owners are not so clear. Downstream from San Antonio, and upstream from Corpus Christi, there are some fish farms and the like that are 'allowed' to take by the lack of discernible ownership farther on down the ogallala stream. I need to update my research on this area of the law; used to be that it was pretty much, if you can see it you have rights. That is why AZ and CA can take part of the Colorado River waters where they are diverted.
Way back when, the upstream owners would dam up the creel, and the downstream folks would (at least in the old cowboy Western movies) blow up the dam. Today they litigate.
An offshoot you may be more familiar with is the legal expectation that upstream owners will not dump oil into the river...
As we become more complex in society, these types of disputes become more involved, and more expensive I guess. Two ways to handle things... legislate it, or let us lawyers take care of it. We're the original Libertarians, ya know!
Craig
You know, you have to wonder if the Old West way was not a better way to solve these things than either lawyers or legislation?
Almost certainly was cheaper.
Thanks zap. Didn't realize you were much more up on the subject than me. I know this has been a big issue for San Antonio for decades. Whenever I pass one of those "Edwards Recharge Zone" signs in that rather arid landscape I think: And this is what SA is dependent upon? That also reminds me of driving through the near desert lands around Bakersfield CA, and coming upon a lush green rice field. Man finds a way...at least for a while.
Ja, Rockman. CA water has been oxymoronic "legalized crime" since the beginning. What was done to the Owens Valley is unspeakable!
http://en.wikipedia.org/wiki/California_Water_Wars
And it continues.
http://www.counterpunch.org/colorado.html
Craig
Not sure LA sucking up the water is so bad. It's a safe bet someone else would be using it if LA wasn't, and while I'm not keen on LA's waste, I'm somewhat happy that the blight of Palmdale doesn't extend the entire way to Bishop! I'm less than optomistic that the valley will ever be "restored", but what is there now would be much easier to work with than some alternatives.
-dr
No mention of Dad Joiner?