After The Gold Rush: A Perspective on Future U.S. Natural Gas Supply and Price
Posted by aeberman on February 8, 2012 - 11:05am
U.S. Shale Plays
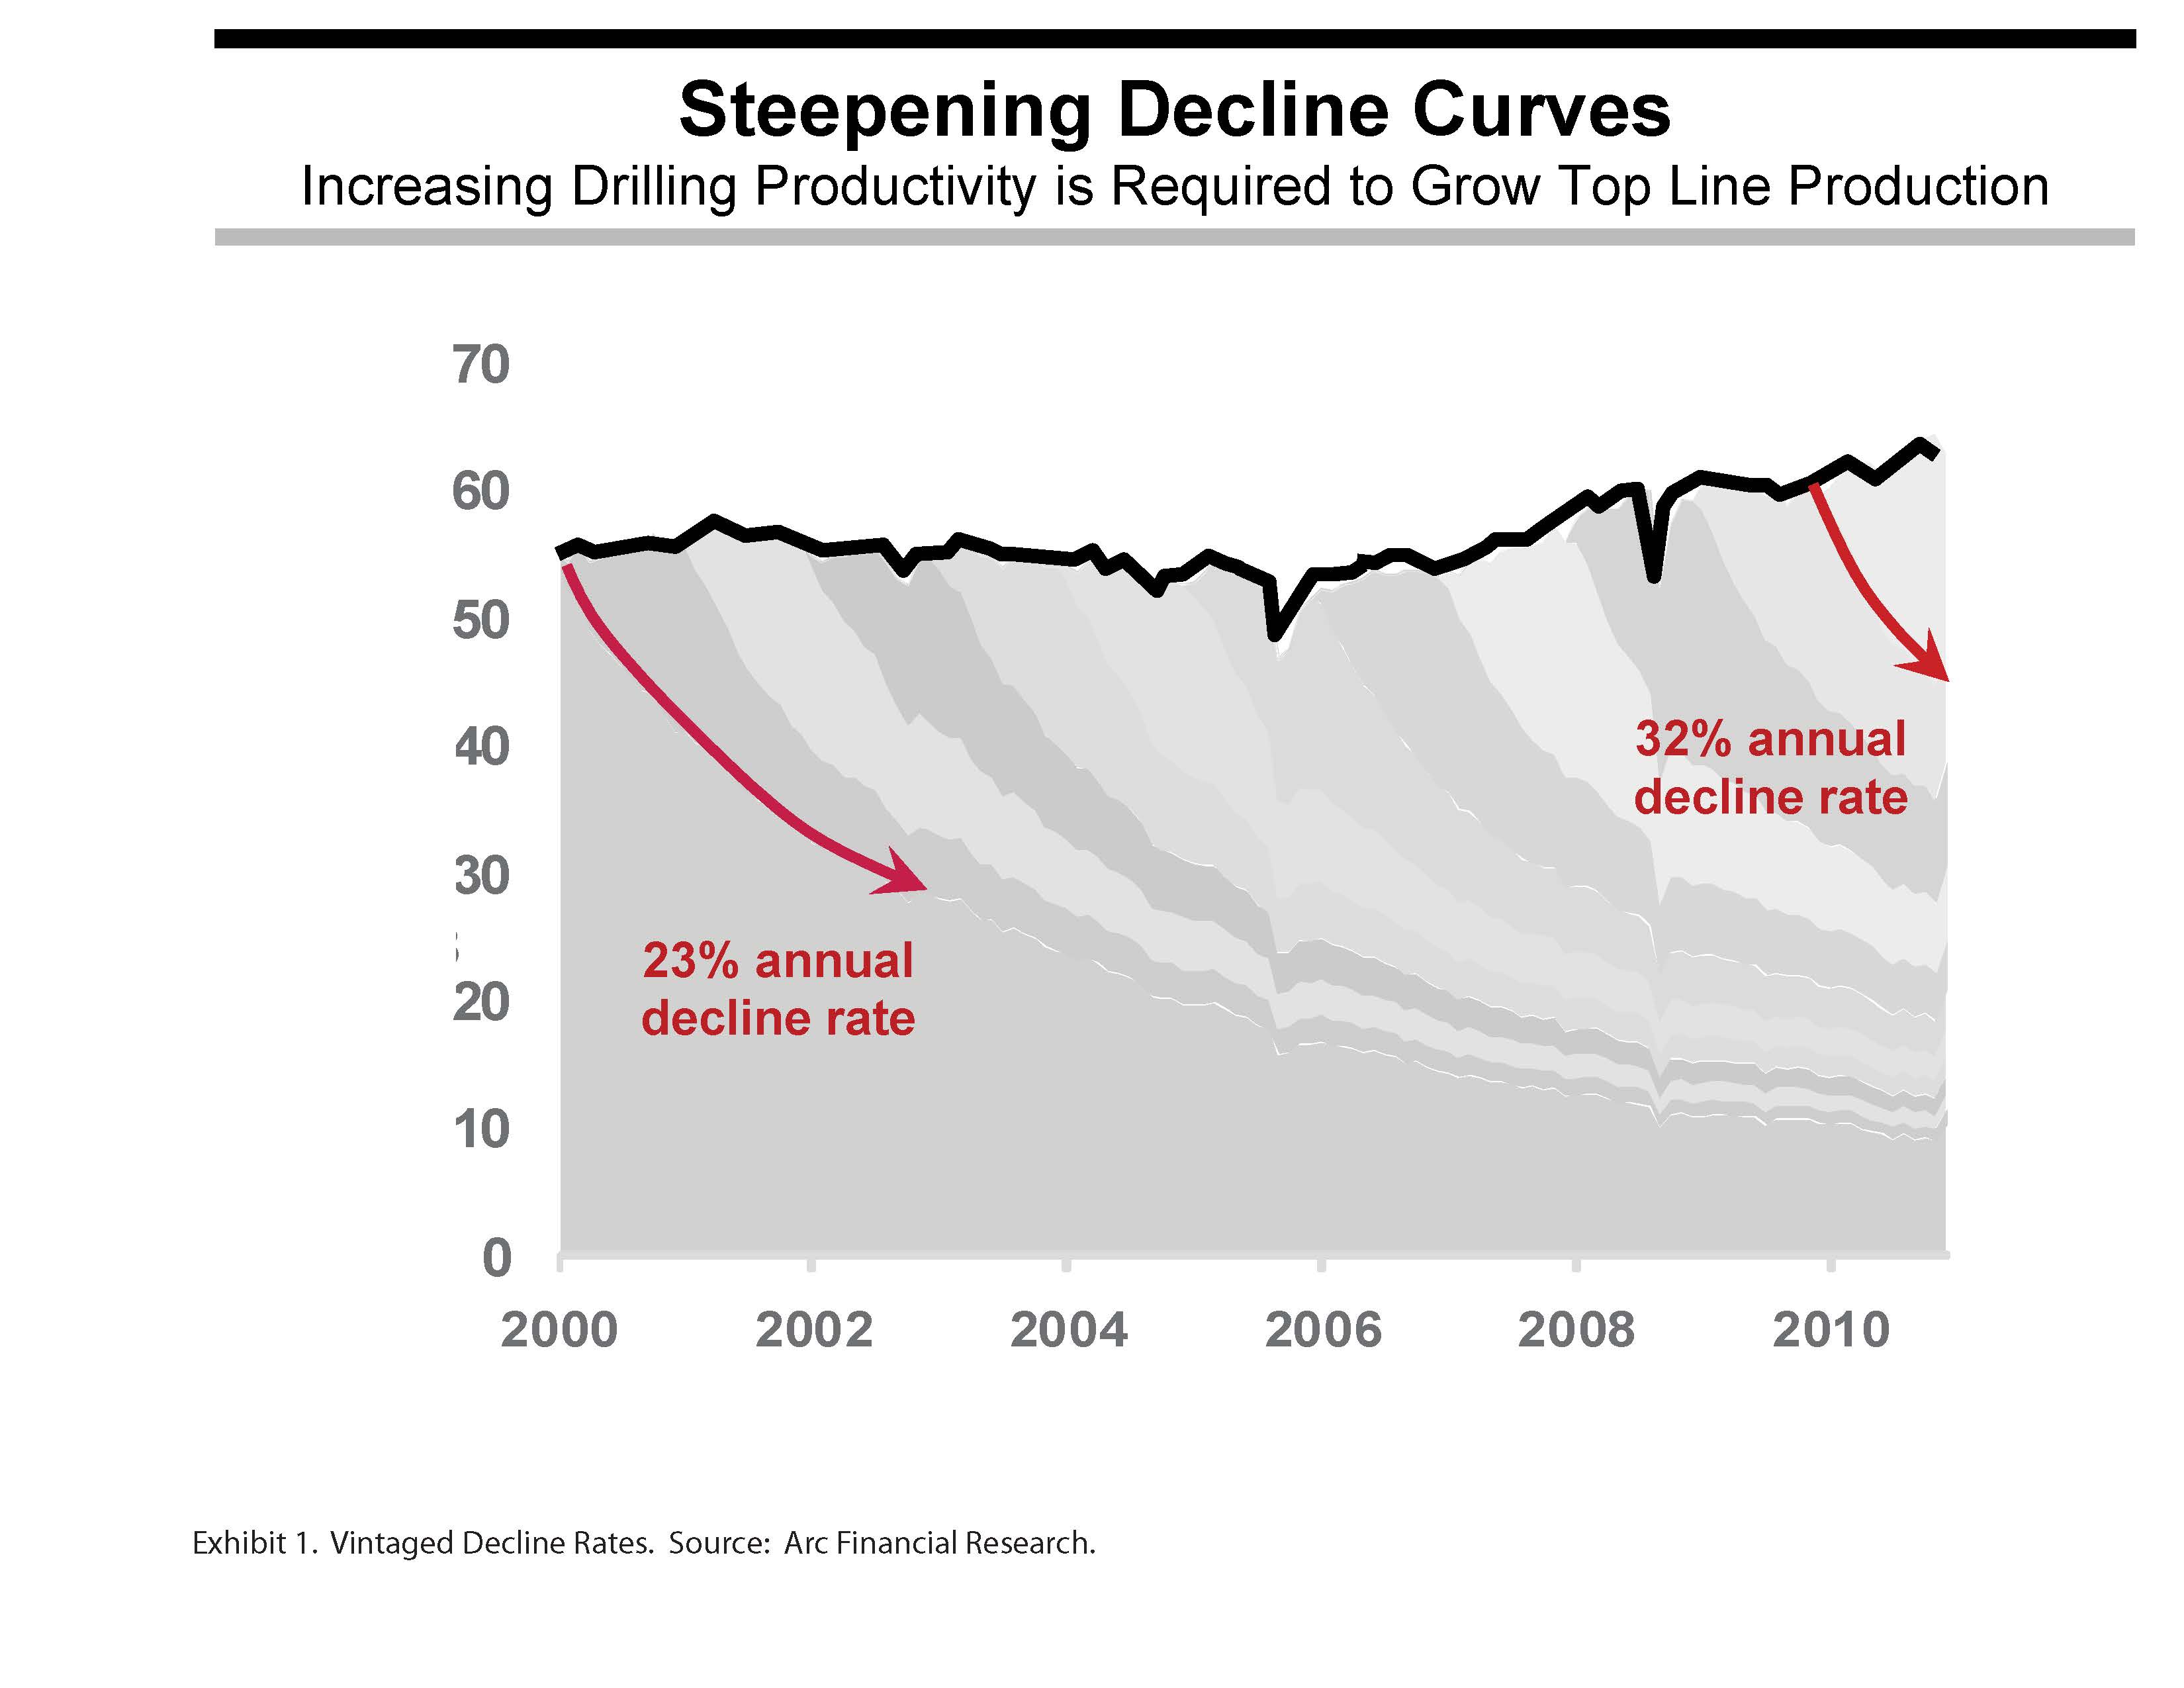
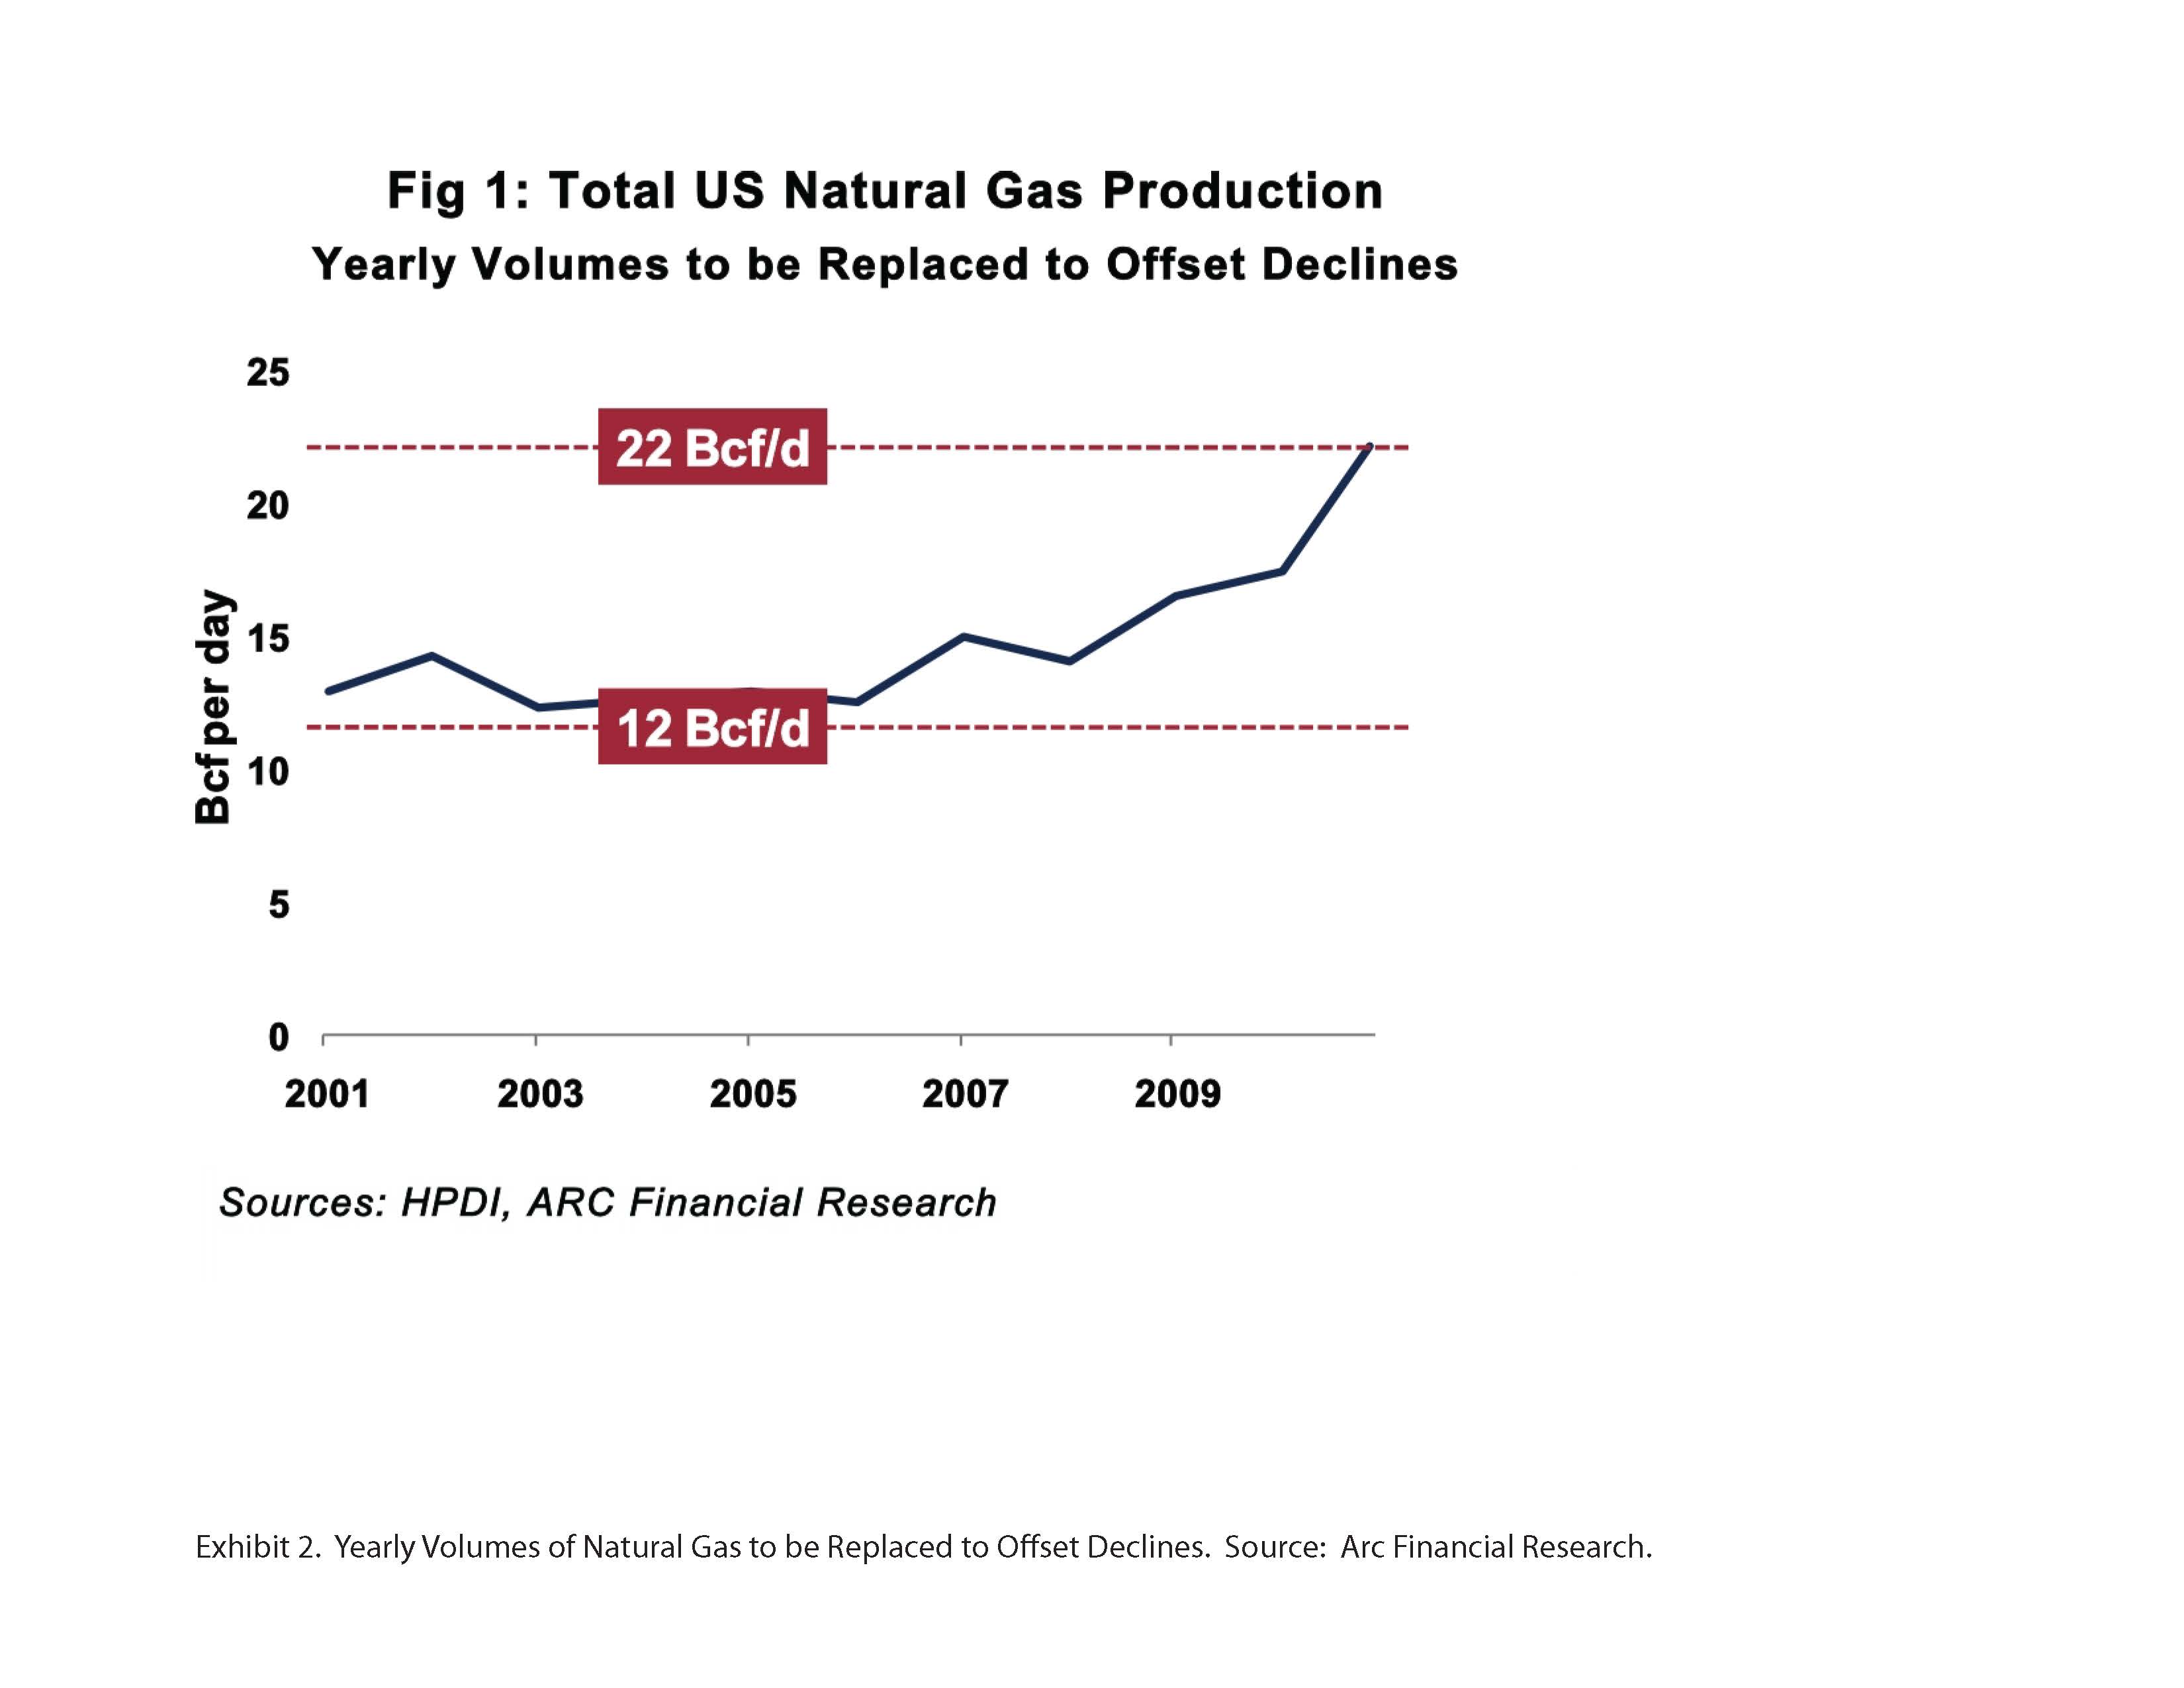
The advent of shale plays provided an important new source of gas. Yet this new supply is characterized by high decline rates which means that wells must be continuously drilled to maintain supply. In 2001, the U.S. natural gas decline rate was about 23% and the annual replacement requirement was 12 Bcf/d when total consumption was 54 Bcf/d. Today, the decline rate is estimated to be 32% and increased consumption of gas means that approximately 22 Bcf/d must be replaced each year (Exhibits 1 and 2).
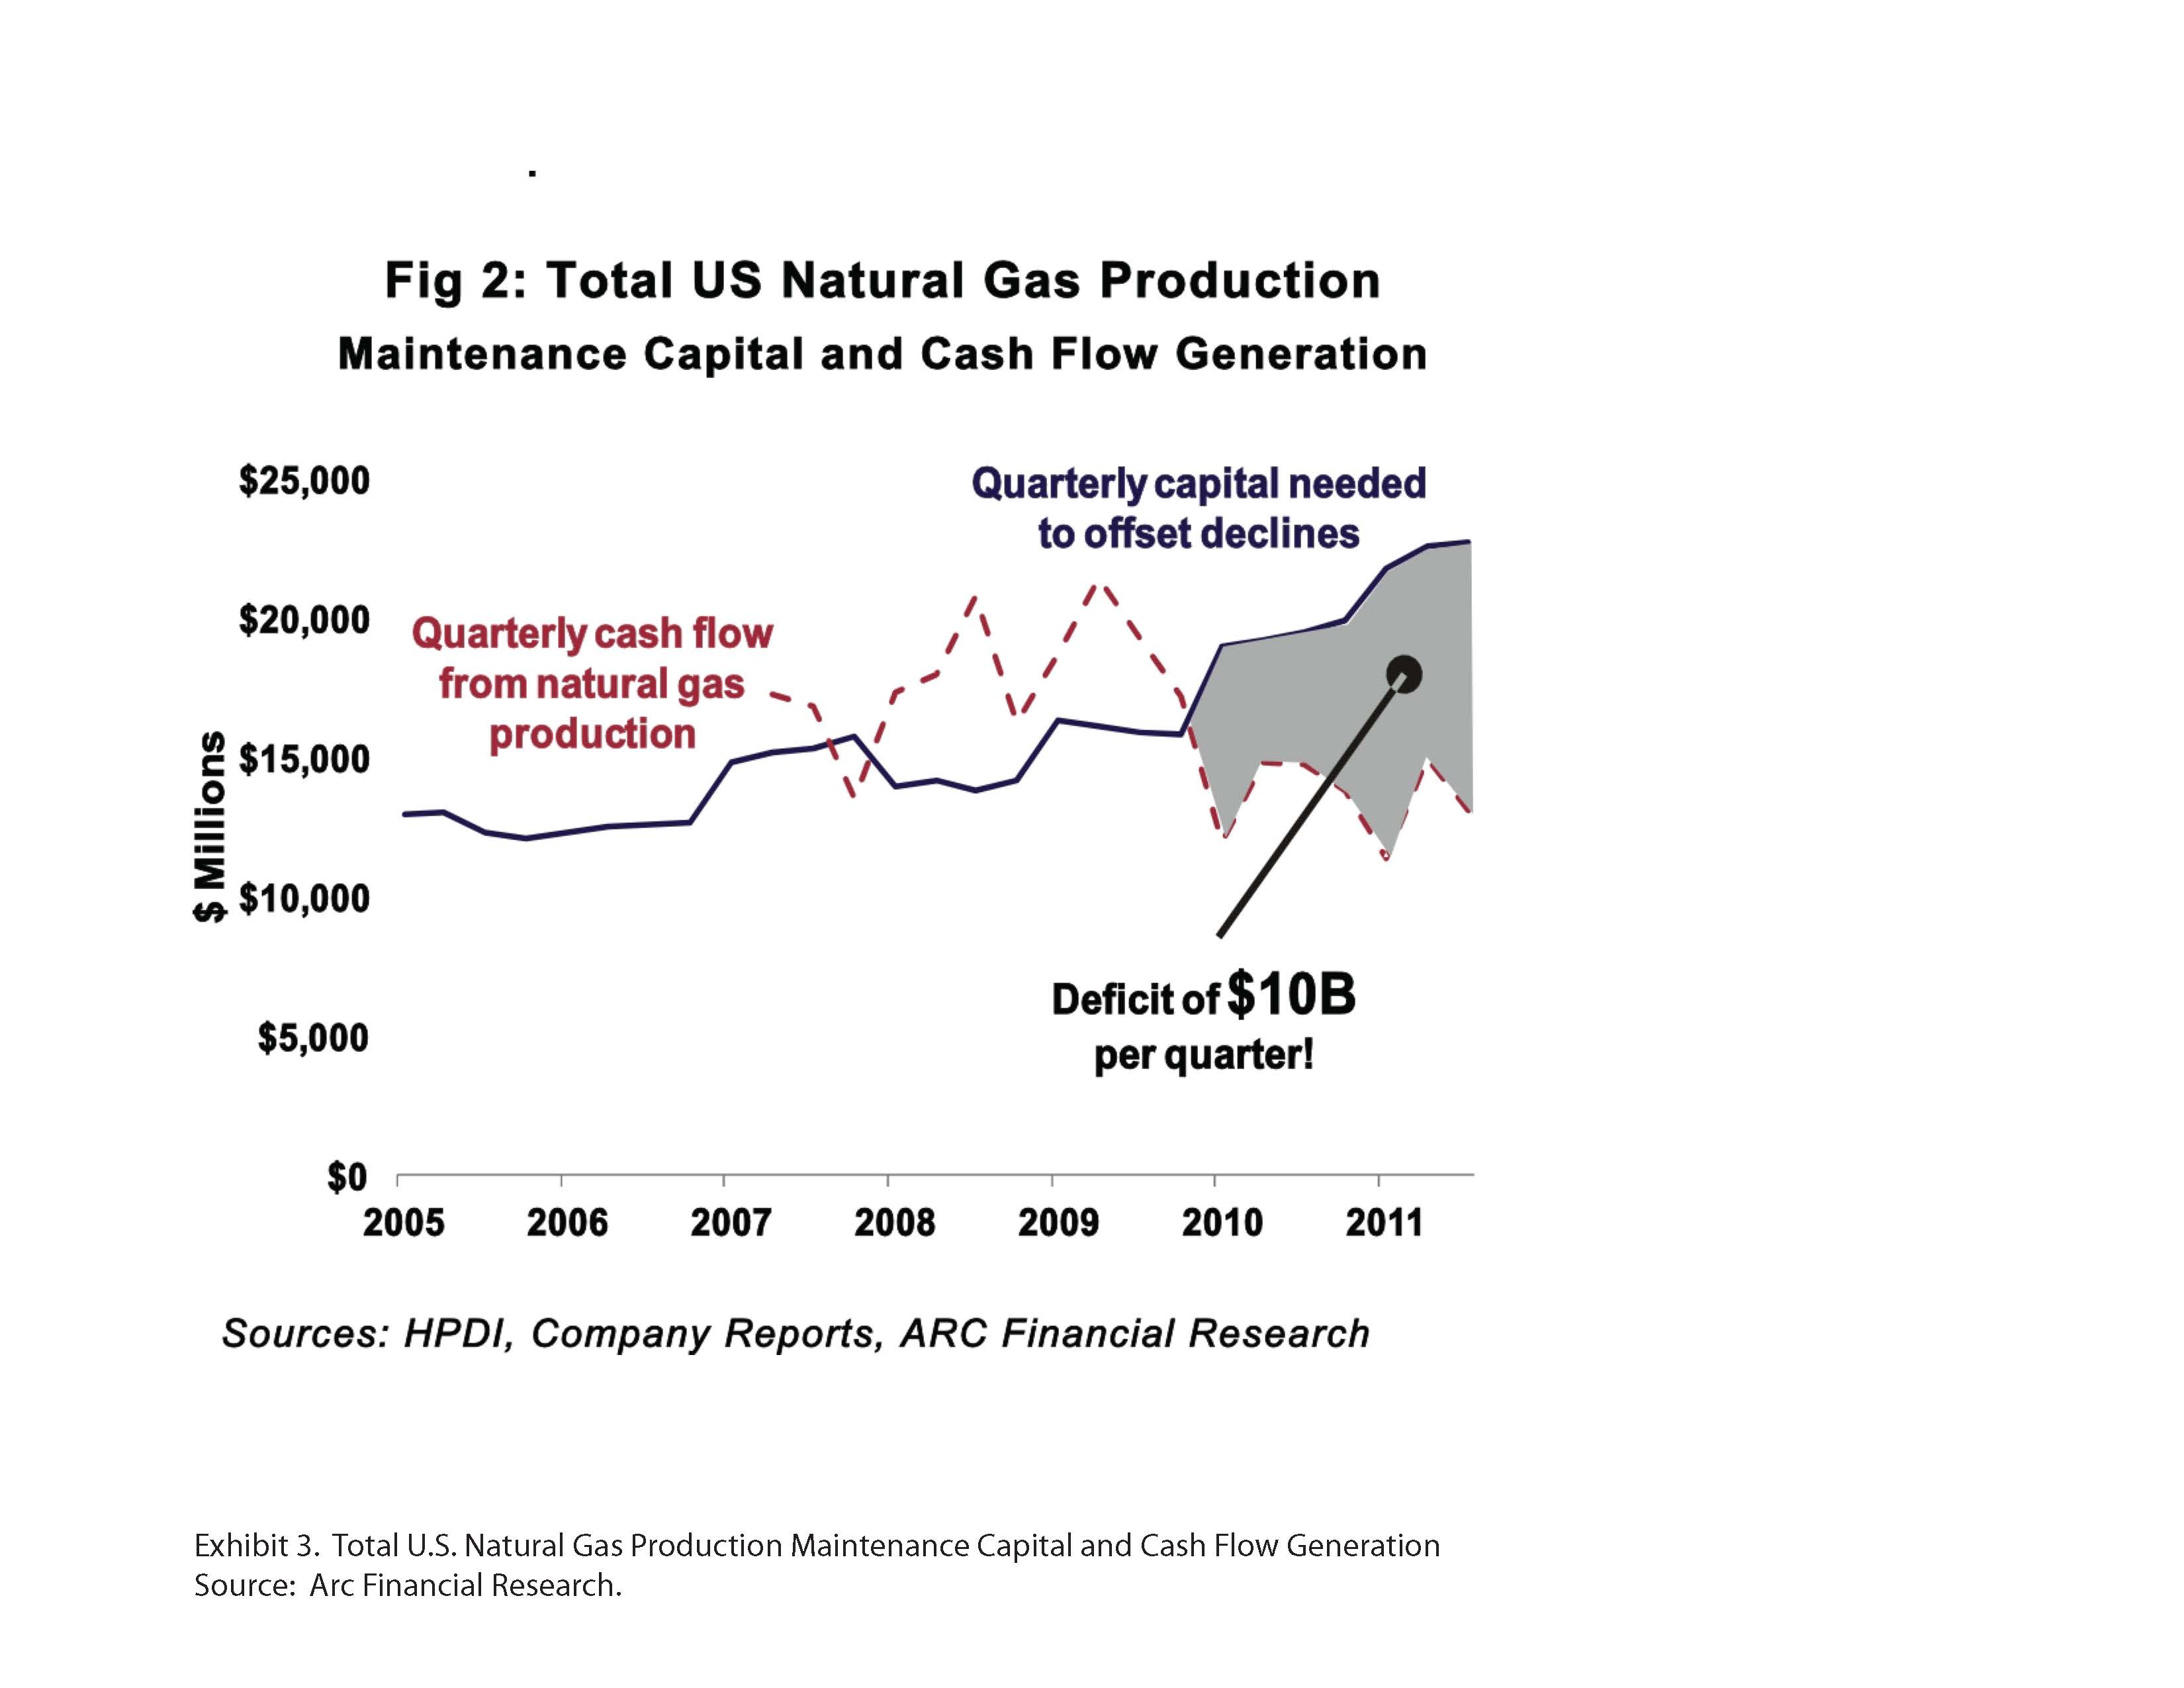
According to ARC Financial Research, $22 billion per quarter is needed to maintain domestic gas supply based on analysis of the 34 top U.S. publicly traded producers. Cash flow for those companies is $12 billion per quarter so there is a $10 billion quarterly cash flow deficit (Exhibit 3). The important factor here is that on a whole there are no retained earnings, and historically growth stems from retained earnings. Without retained earnings, companies must borrow money or sell assets into joint venture agreements to raise cash in order to drill.
While the continued drilling has been funded by debt, share offerings and joint venture agreements thus far, the trend is unsustainable given the steep decline in prices, despite some favorable hedges. Drilling, therefore, must decrease in order to shrink the present over-supply and so that prices can rise.
U.S. shale plays share many characteristics with the gold rushes of the nineteenth and early twentieth centuries. Both phenomena result from extreme promotion. Anyone can join. Every participant believes that they will get rich. Great amounts of capital are destroyed as entrants try to get a position. The bonanza is exhausted sooner than most expected (Andreoli, 2011) and few profit in the end except for the vendors that serve participants.
For several years, we have been asked to believe that less is more, that more oil and gas can be produced from shale than was produced from better reservoirs over the past century. We have been told more recently that the U.S. has enough natural gas to last for 100 years. We have been presented with an improbable business model that has no barriers to entry except access to capital, that provides a source of cheap and abundant gas, and that somehow also allows for great profit. Despite three decades of experience with tight sandstone and coal-bed methane production that yielded low-margin returns and less supply than originally advertised, we are expected to believe that poorer-quality shale reservoirs will somehow provide superior returns and make the U.S. energy independent. Shale gas advocates point to the large volumes of produced gas and the participation of major oil companies in the plays as indications of success. But advocates rarely address details about profitability and they never mention failed wells.
Shale gas plays are an important and permanent part of our energy future. We need the gas because there are fewer remaining plays in the U.S. that have the potential to meet demand. A careful review of the facts, however, casts doubt on the extent to which shale plays can meet supply expectations except at much higher prices.
One Hundred Years of Natural Gas
The U.S. does not have 100 years of natural gas supply. There is a difference between resources and reserves that many outside the energy industry fail to grasp. A resource refers to the gas or oil in-place that can be produced, while a reserve must be commercially producible. The Potential Gas Committee (PGC) is the standard for resource assessments because of the objectivity and credentials of its members, and its long and reliable history. In its biennial report released in April 2011, three categories of technically recoverable resources are identified: probable, possible and speculative.
The President and many others have taken the PGC total of all three categories (2,170 trillion cubic feet (Tcf) of gas) and divided by 2010 annual consumption of 24 Tcf. This results in 90 and not 100 years of gas. Much of this total resource is in accumulations too small to be produced at any price, is inaccessible to drilling, or is too deep to recover economically.
More relevant is the Committee’s probable mean resources value of 550 (Tcf) of gas (Exhibit 4).
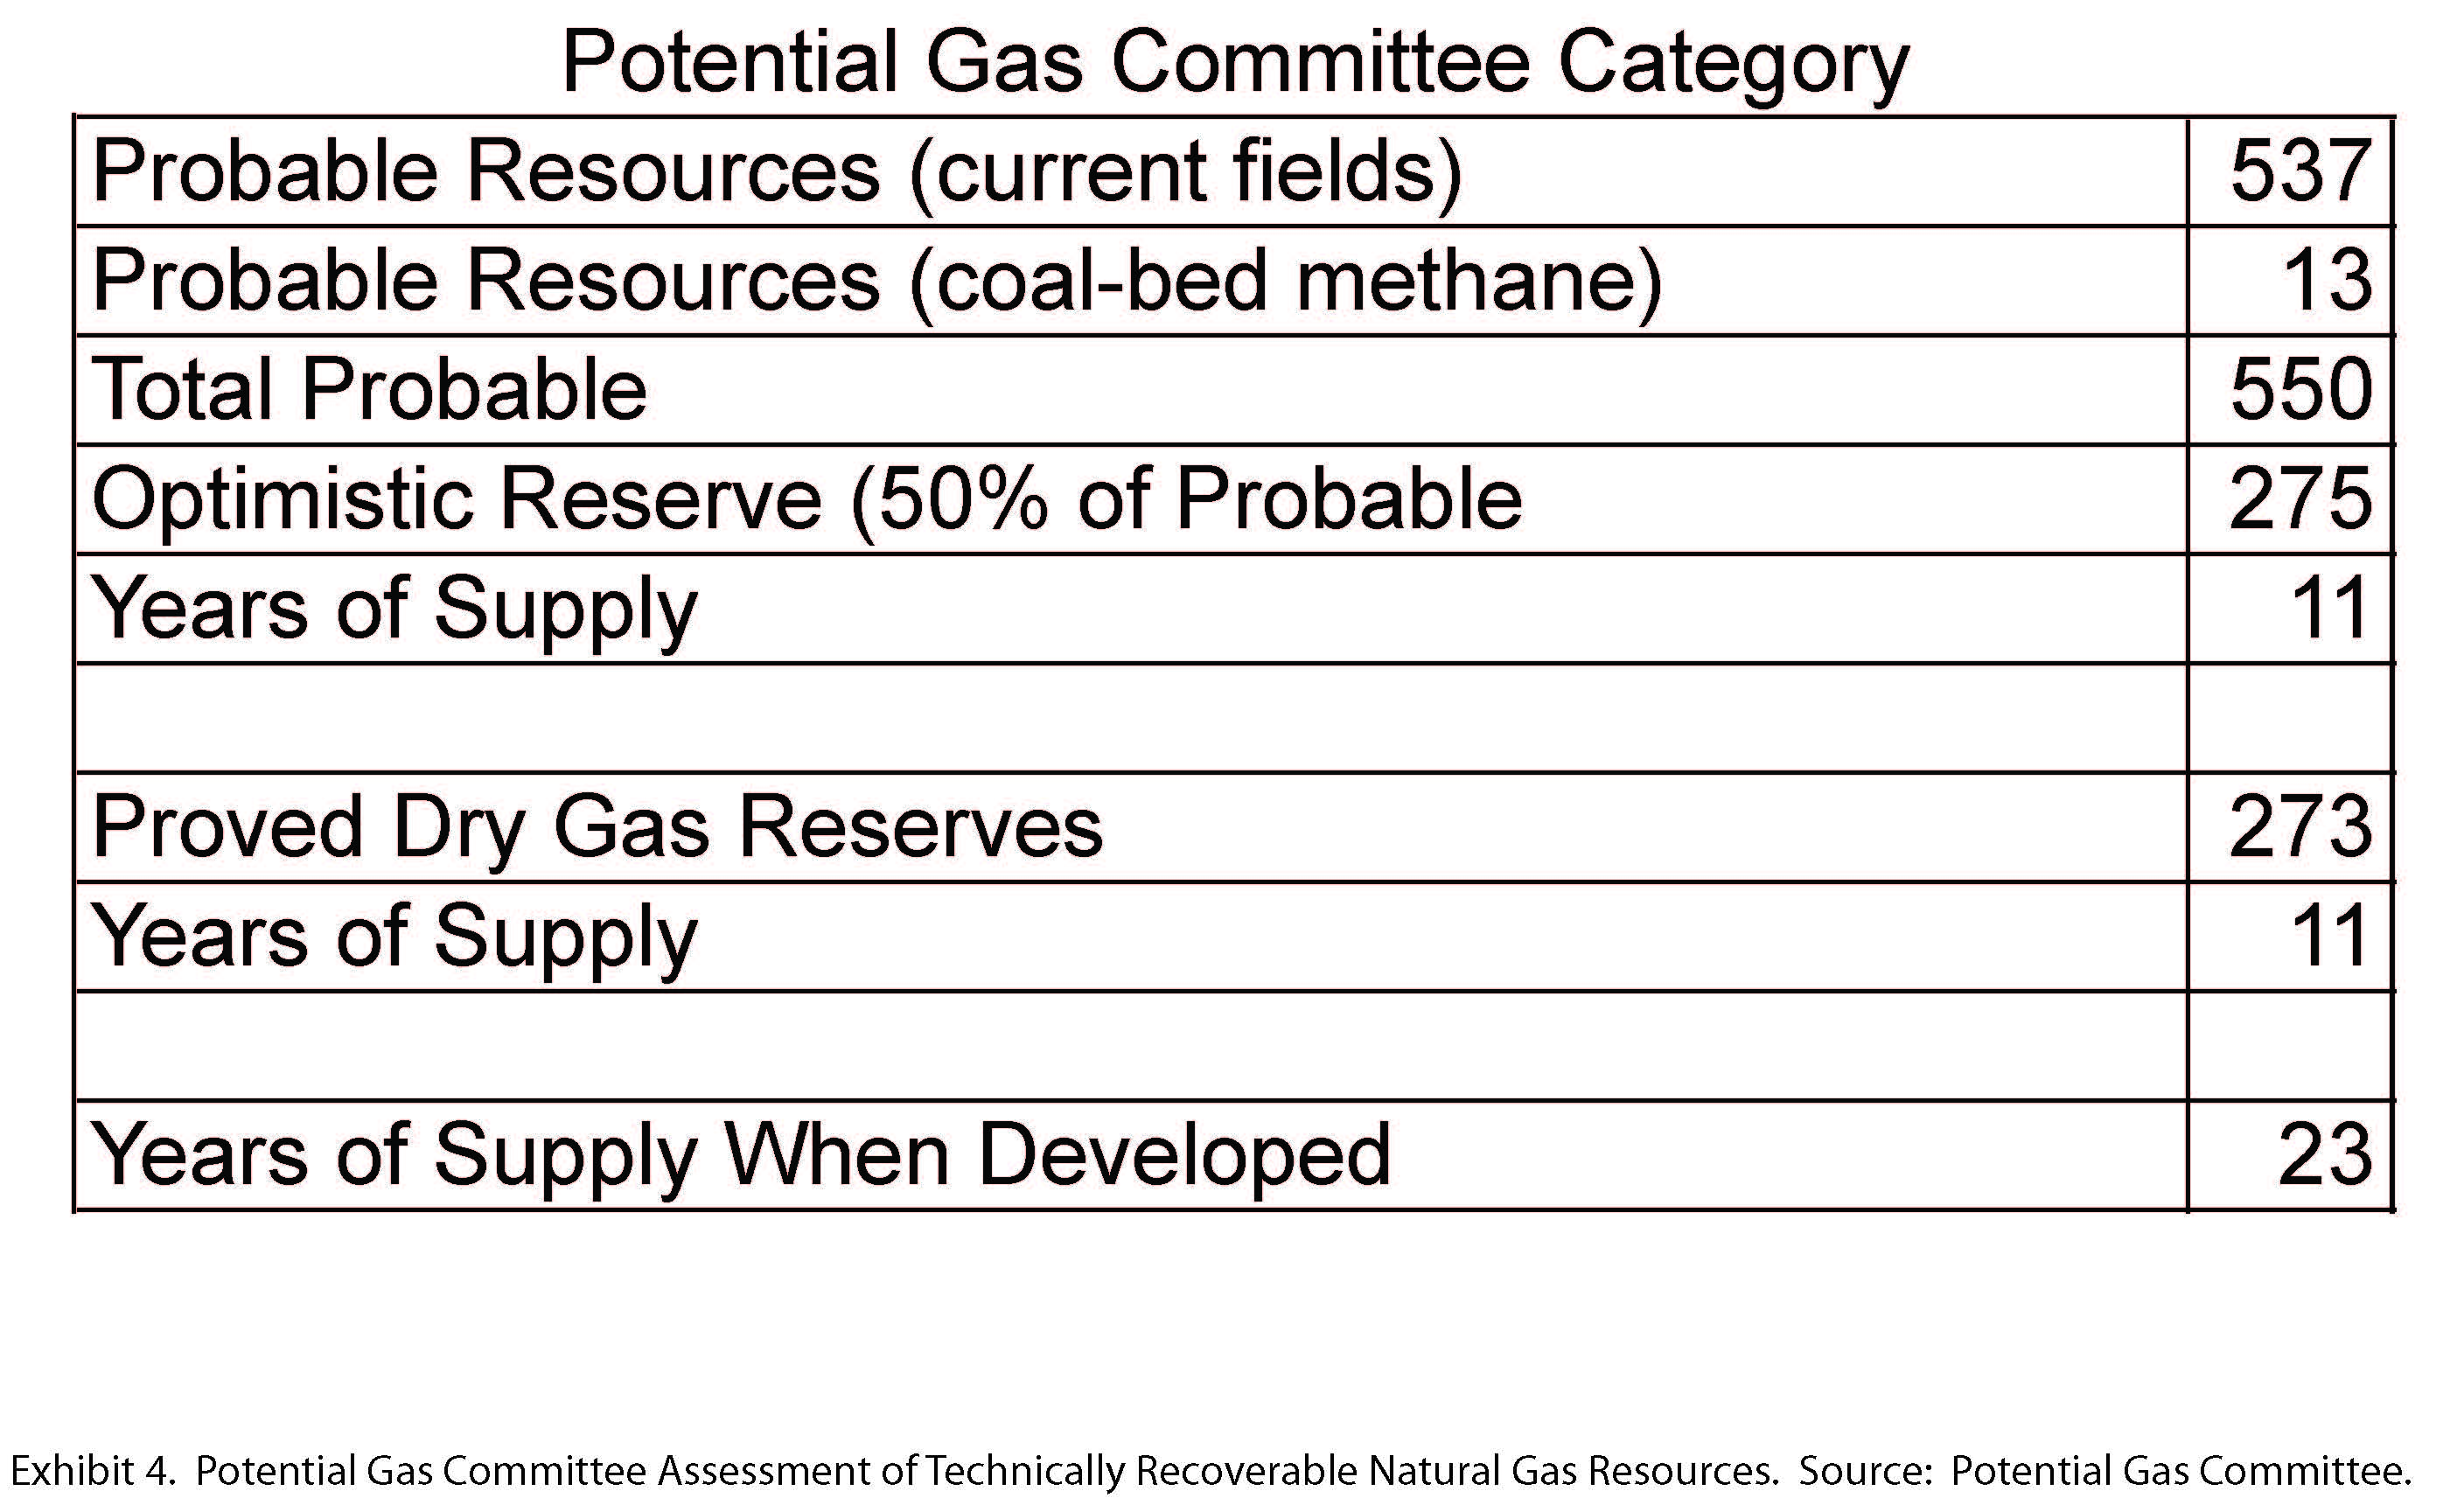
If half of this supply becomes a reserve (225 Tcf), the U.S. has approximately 11.5 years of potential future gas supply at present consumption rates. When proved reserves of 273 Tcf are included, there is an additional 11.5 years of supply for a total of almost 23 years. It is worth noting that proved reserves include proved undeveloped reserves which may or may not be produced depending on economics, so even 23 years of supply is tenuous. If consumption increases, this supply will be exhausted in less than 23 years. Revisions to this estimate will be made and there probably is more than 23 years but based on current information, 100 years of gas is not justified.
Shale Gas Plays May Not Provide Sustainable Supply
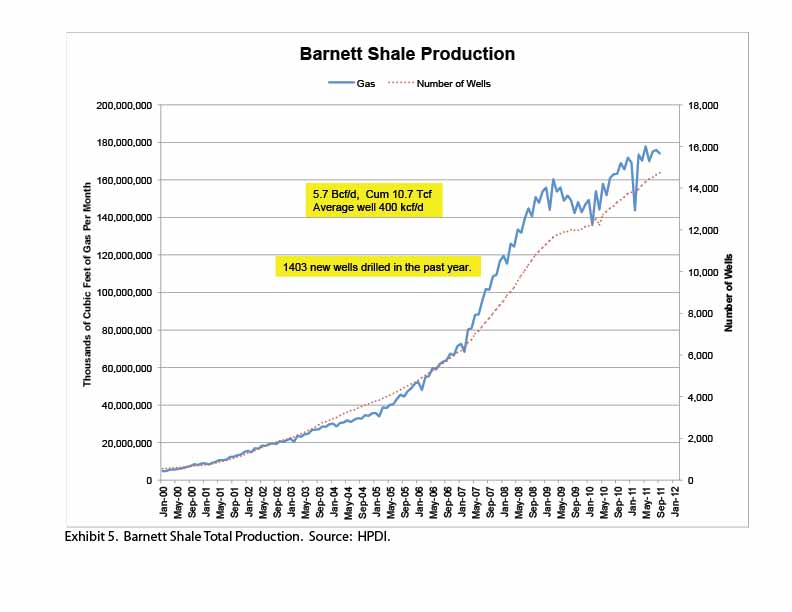
Several of the more mature shale gas plays are either in decline or appear to be approaching peak production. Exhibit 5 shows that total Barnett Shale production is approximately 5.7 Bcf per day (Bcf/d) and cumulative gas production is more than 10 trillion cubic feet (Tcf) of gas. It also shows that production may be approaching a peak at current gas prices despite the constant addition of new wells.
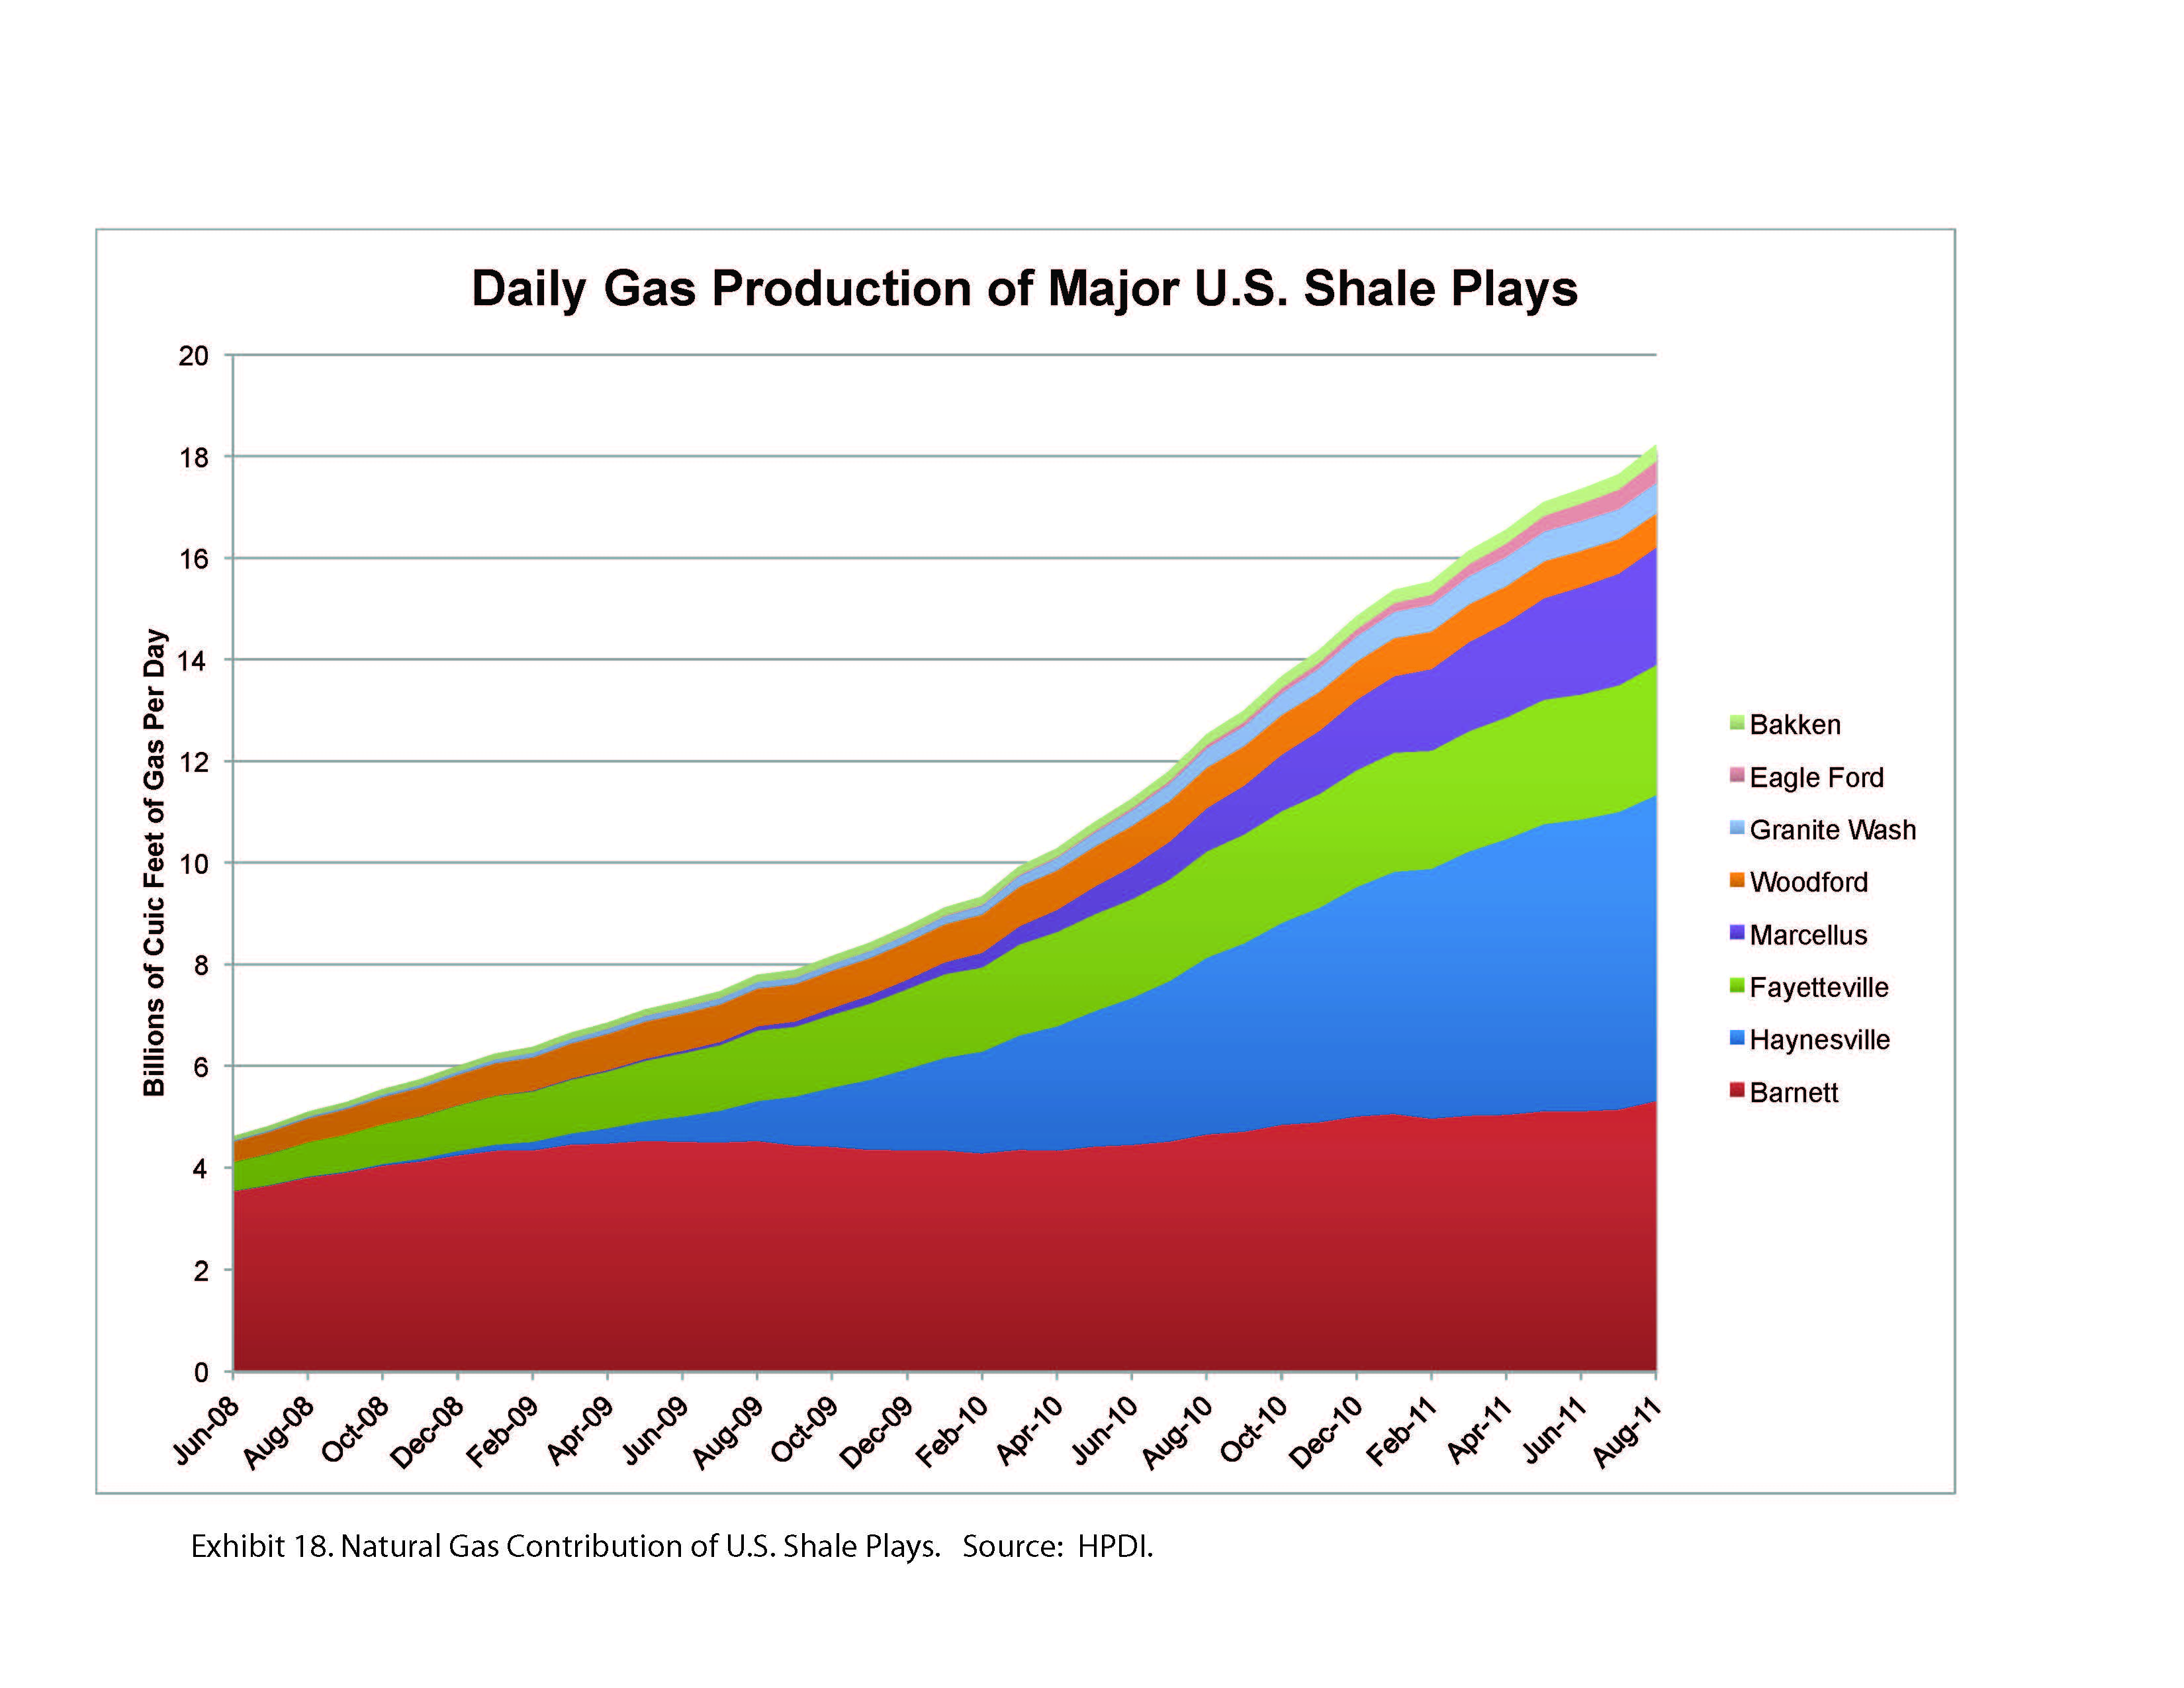
The Haynesville Shale surpassed the Barnett during 2011 as the most productive gas play in North America, with present daily rates of almost 7 Bcf/d and cumulative production of 3.5 Tcf (Exhibit 6).
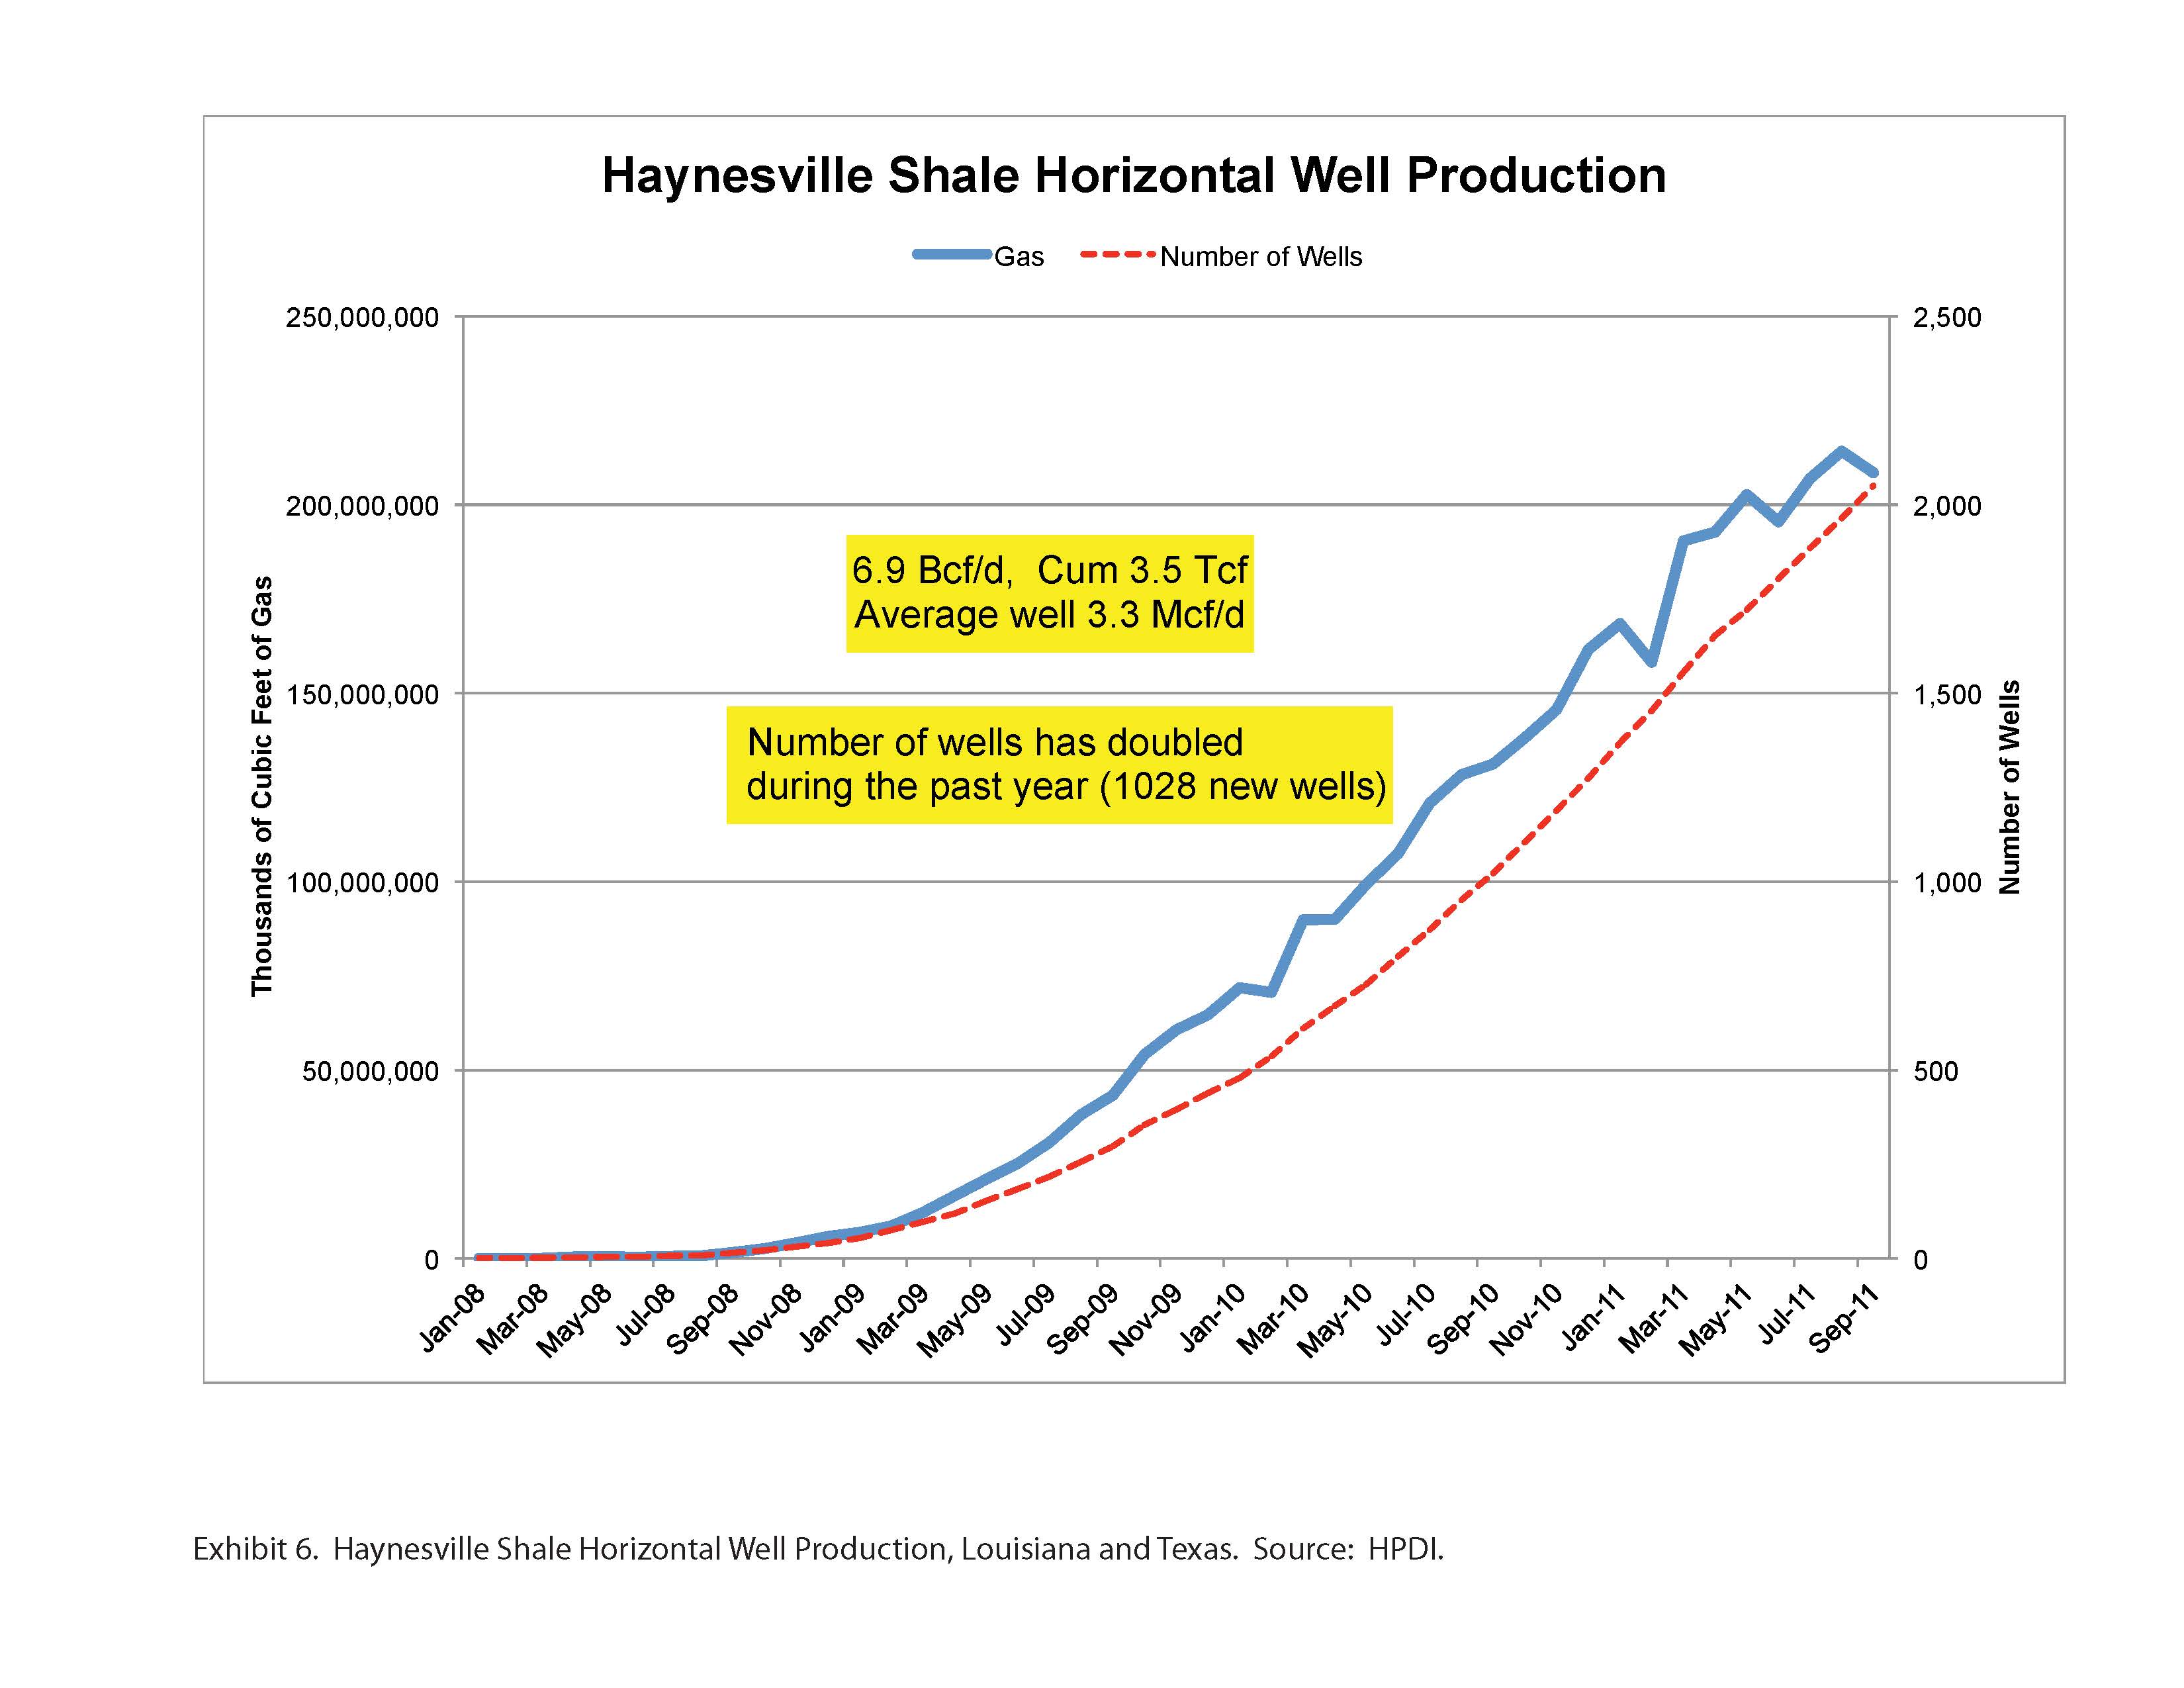
This play is most responsible for the current over-supply of gas with the average well producing 3.3 million cubic feet per day (Mcf/d) compared to only 0.4 Mdf/d in the Barnett. It is too early to say for sure, but the Haynesville Shale may also be approaching peak production.
The Marcellus Shale is presently producing 2.4 Bcf/d and has produced a total of about 0.8 Tcf (Exhibit 7).
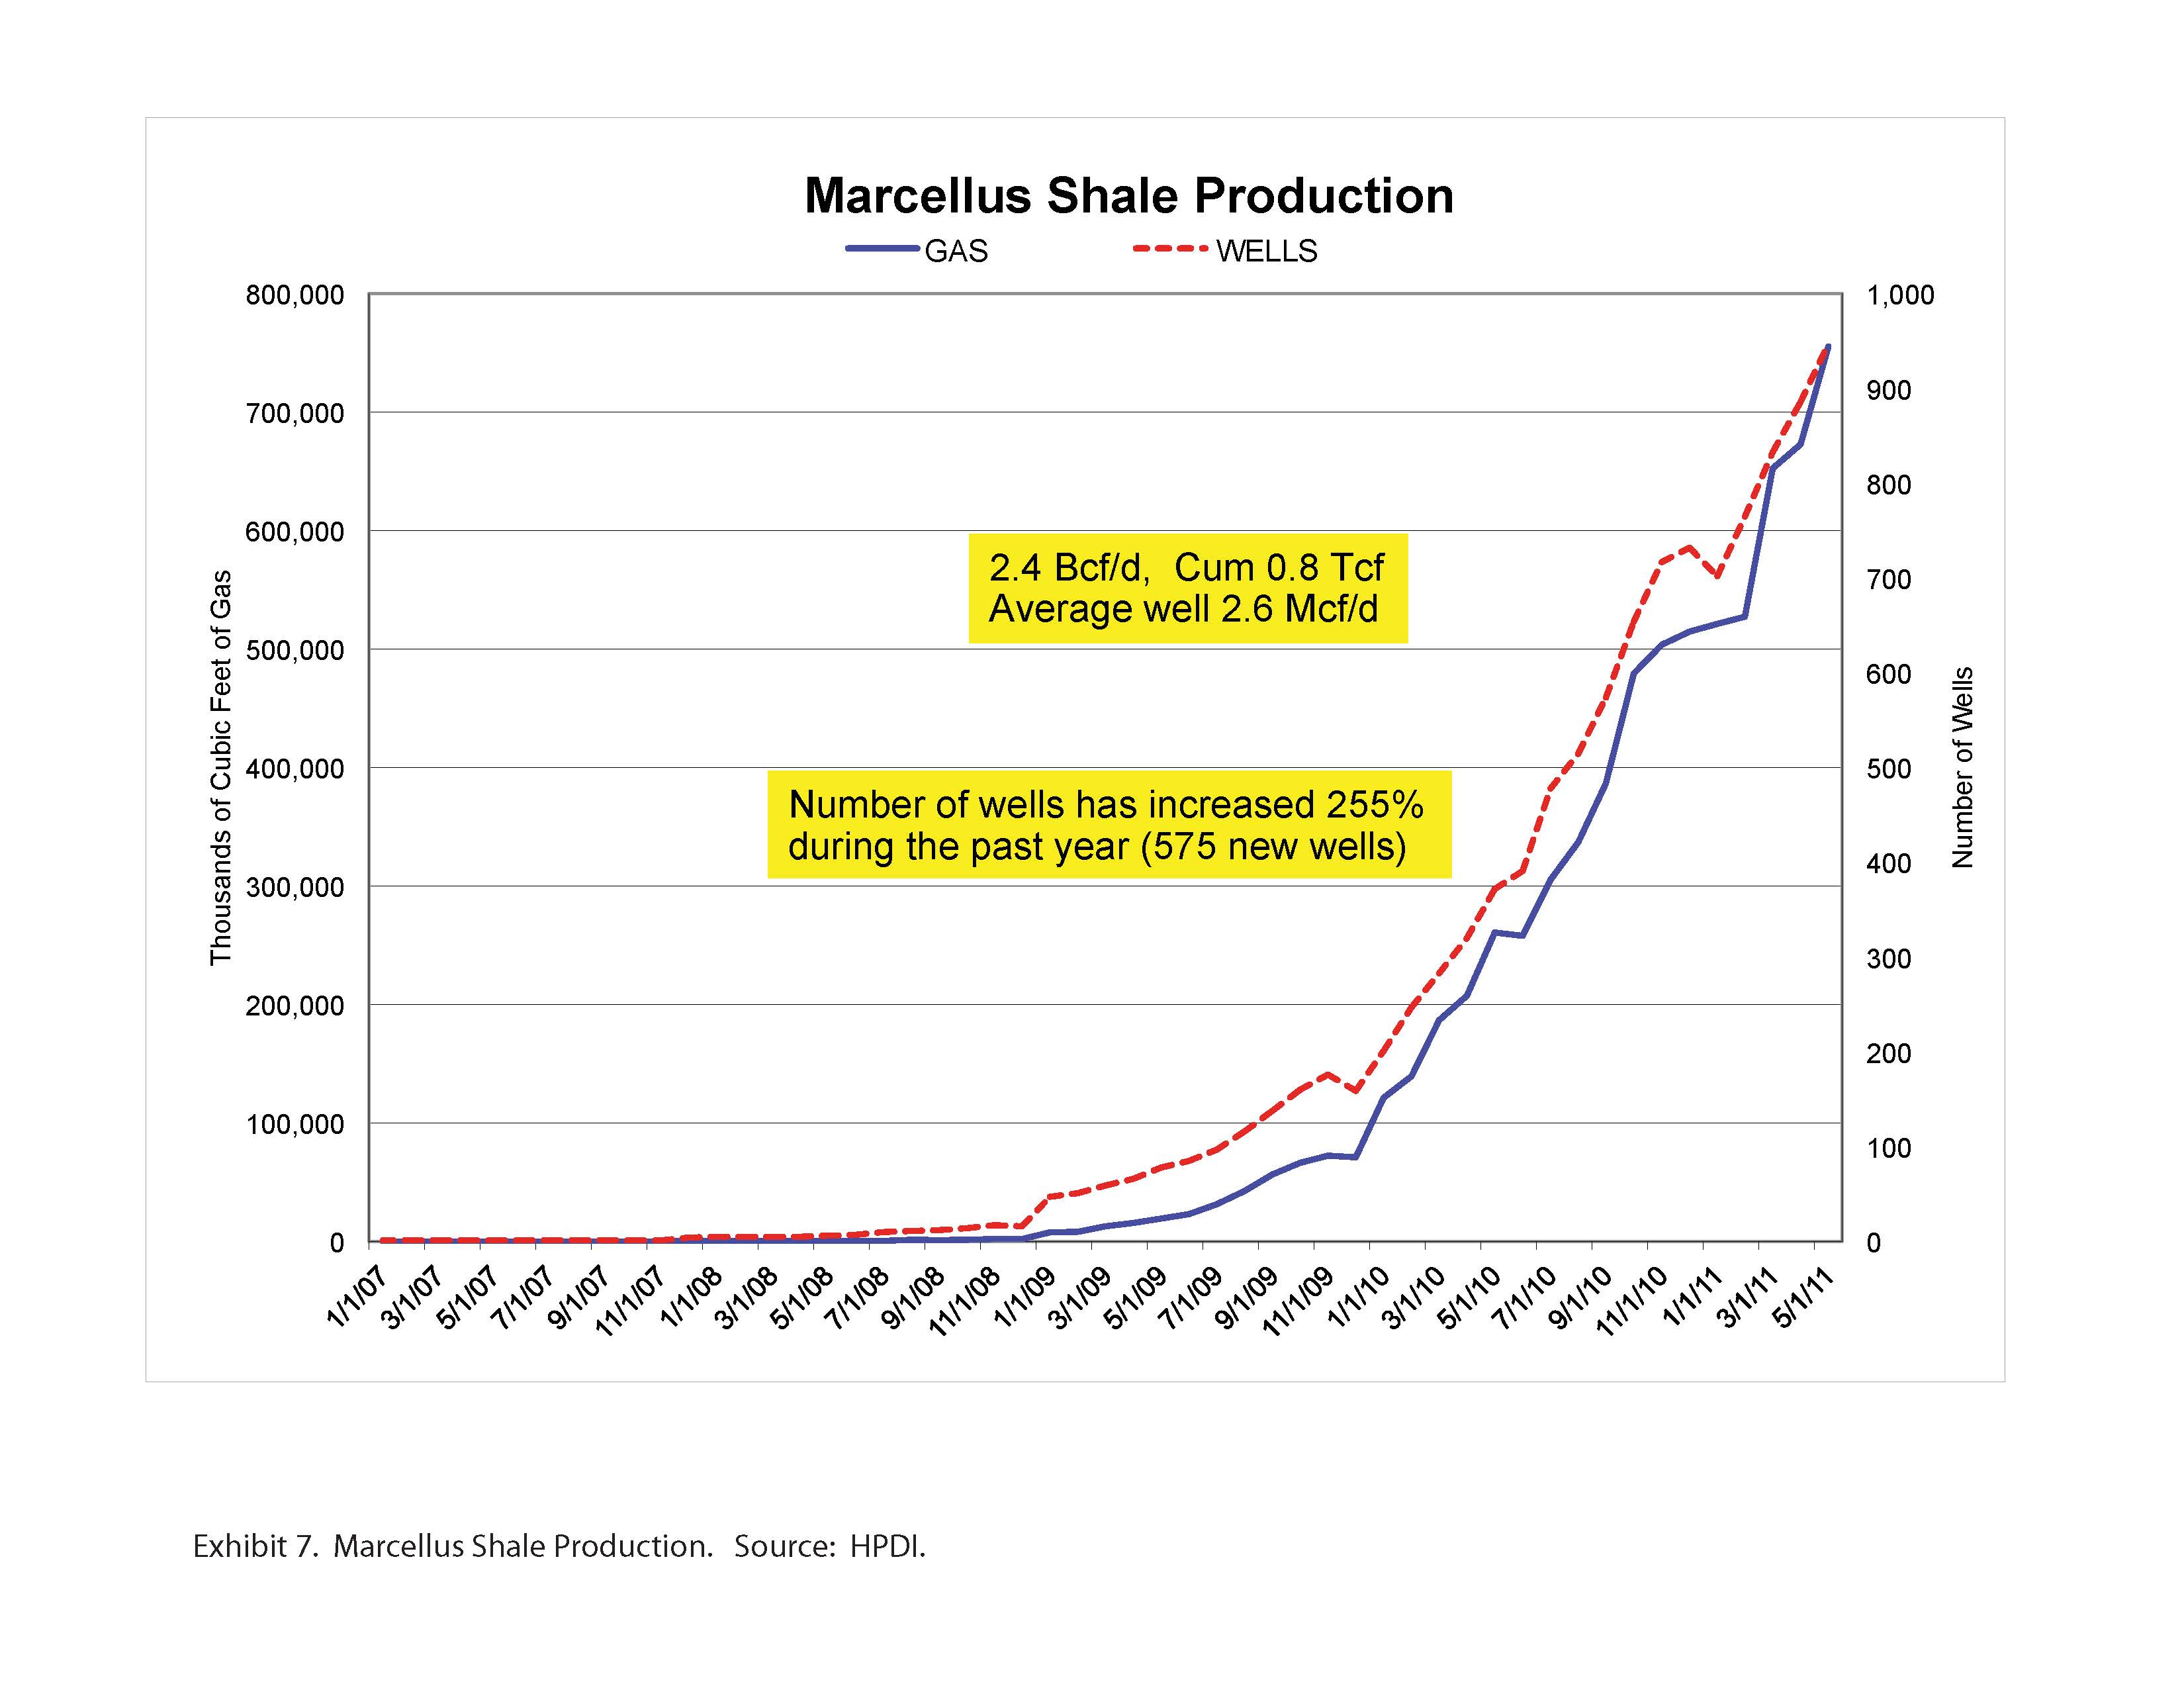
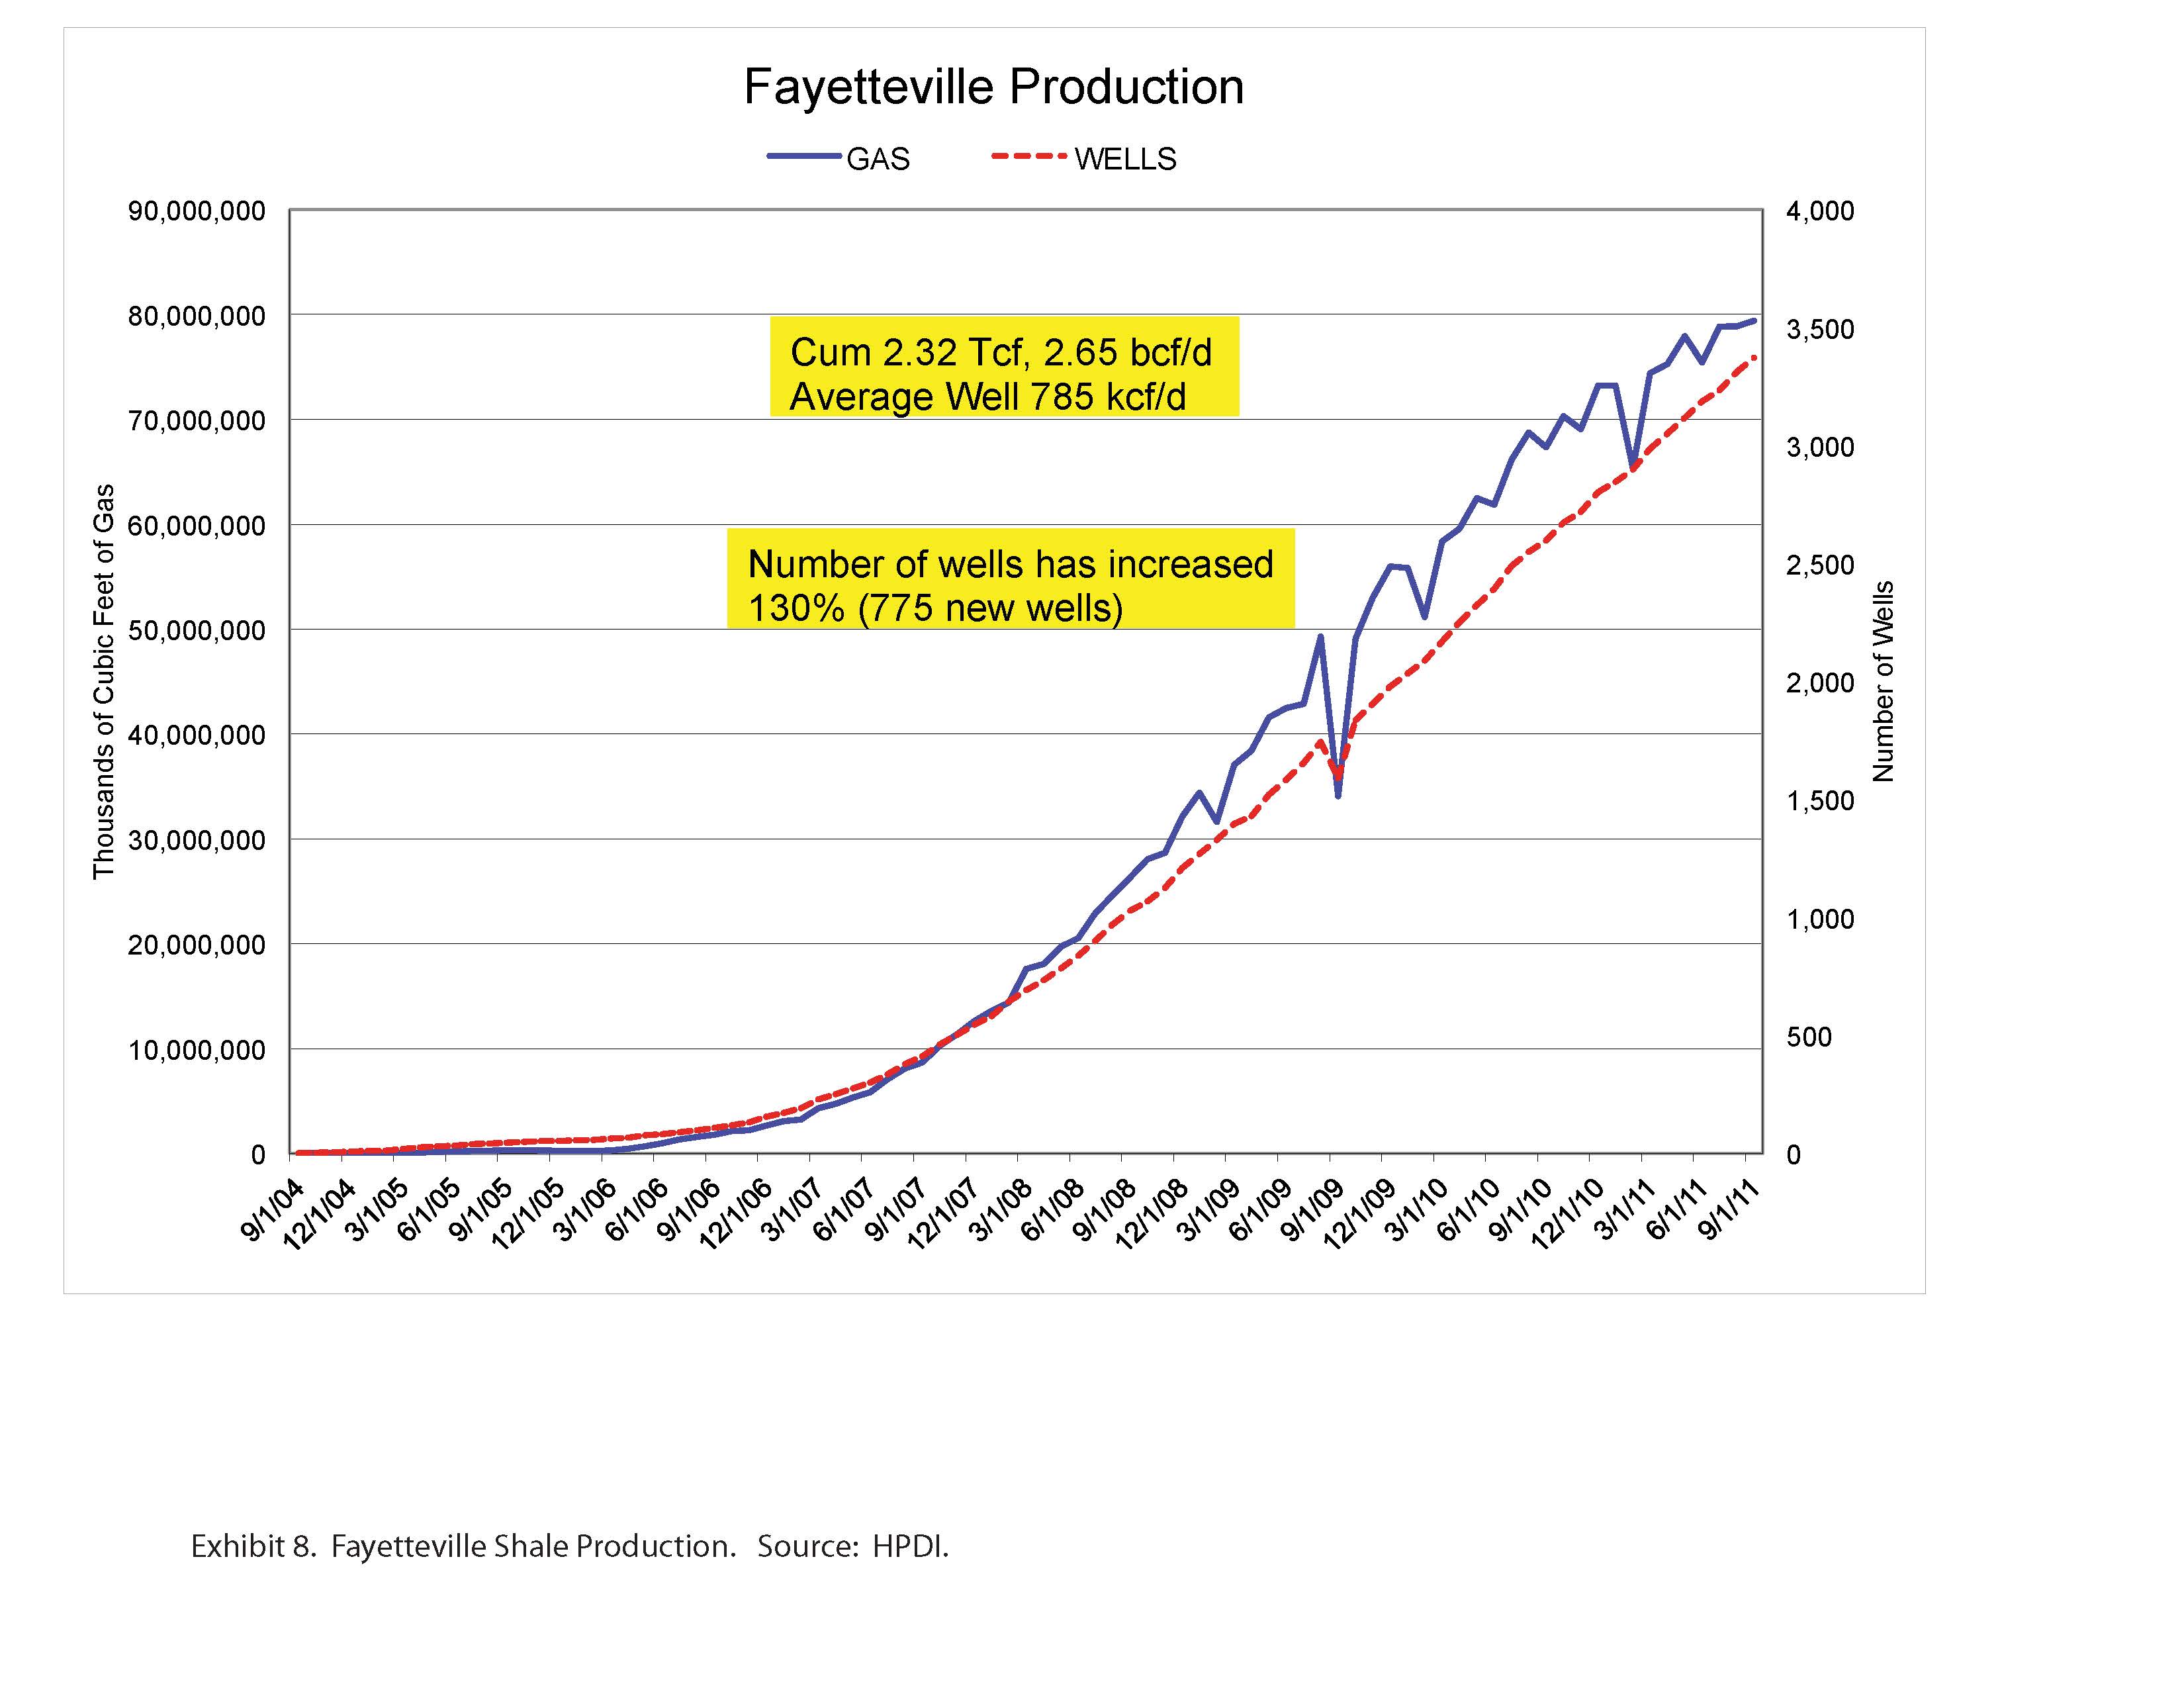
In this play, production shows no sign of leveling off, as it does in the Barnett and Haynesville, and production in the Fayetteville Shale may also be approaching a peak (Exhibit 8).
The Woodford Shale is already in decline (Exhibit 9).
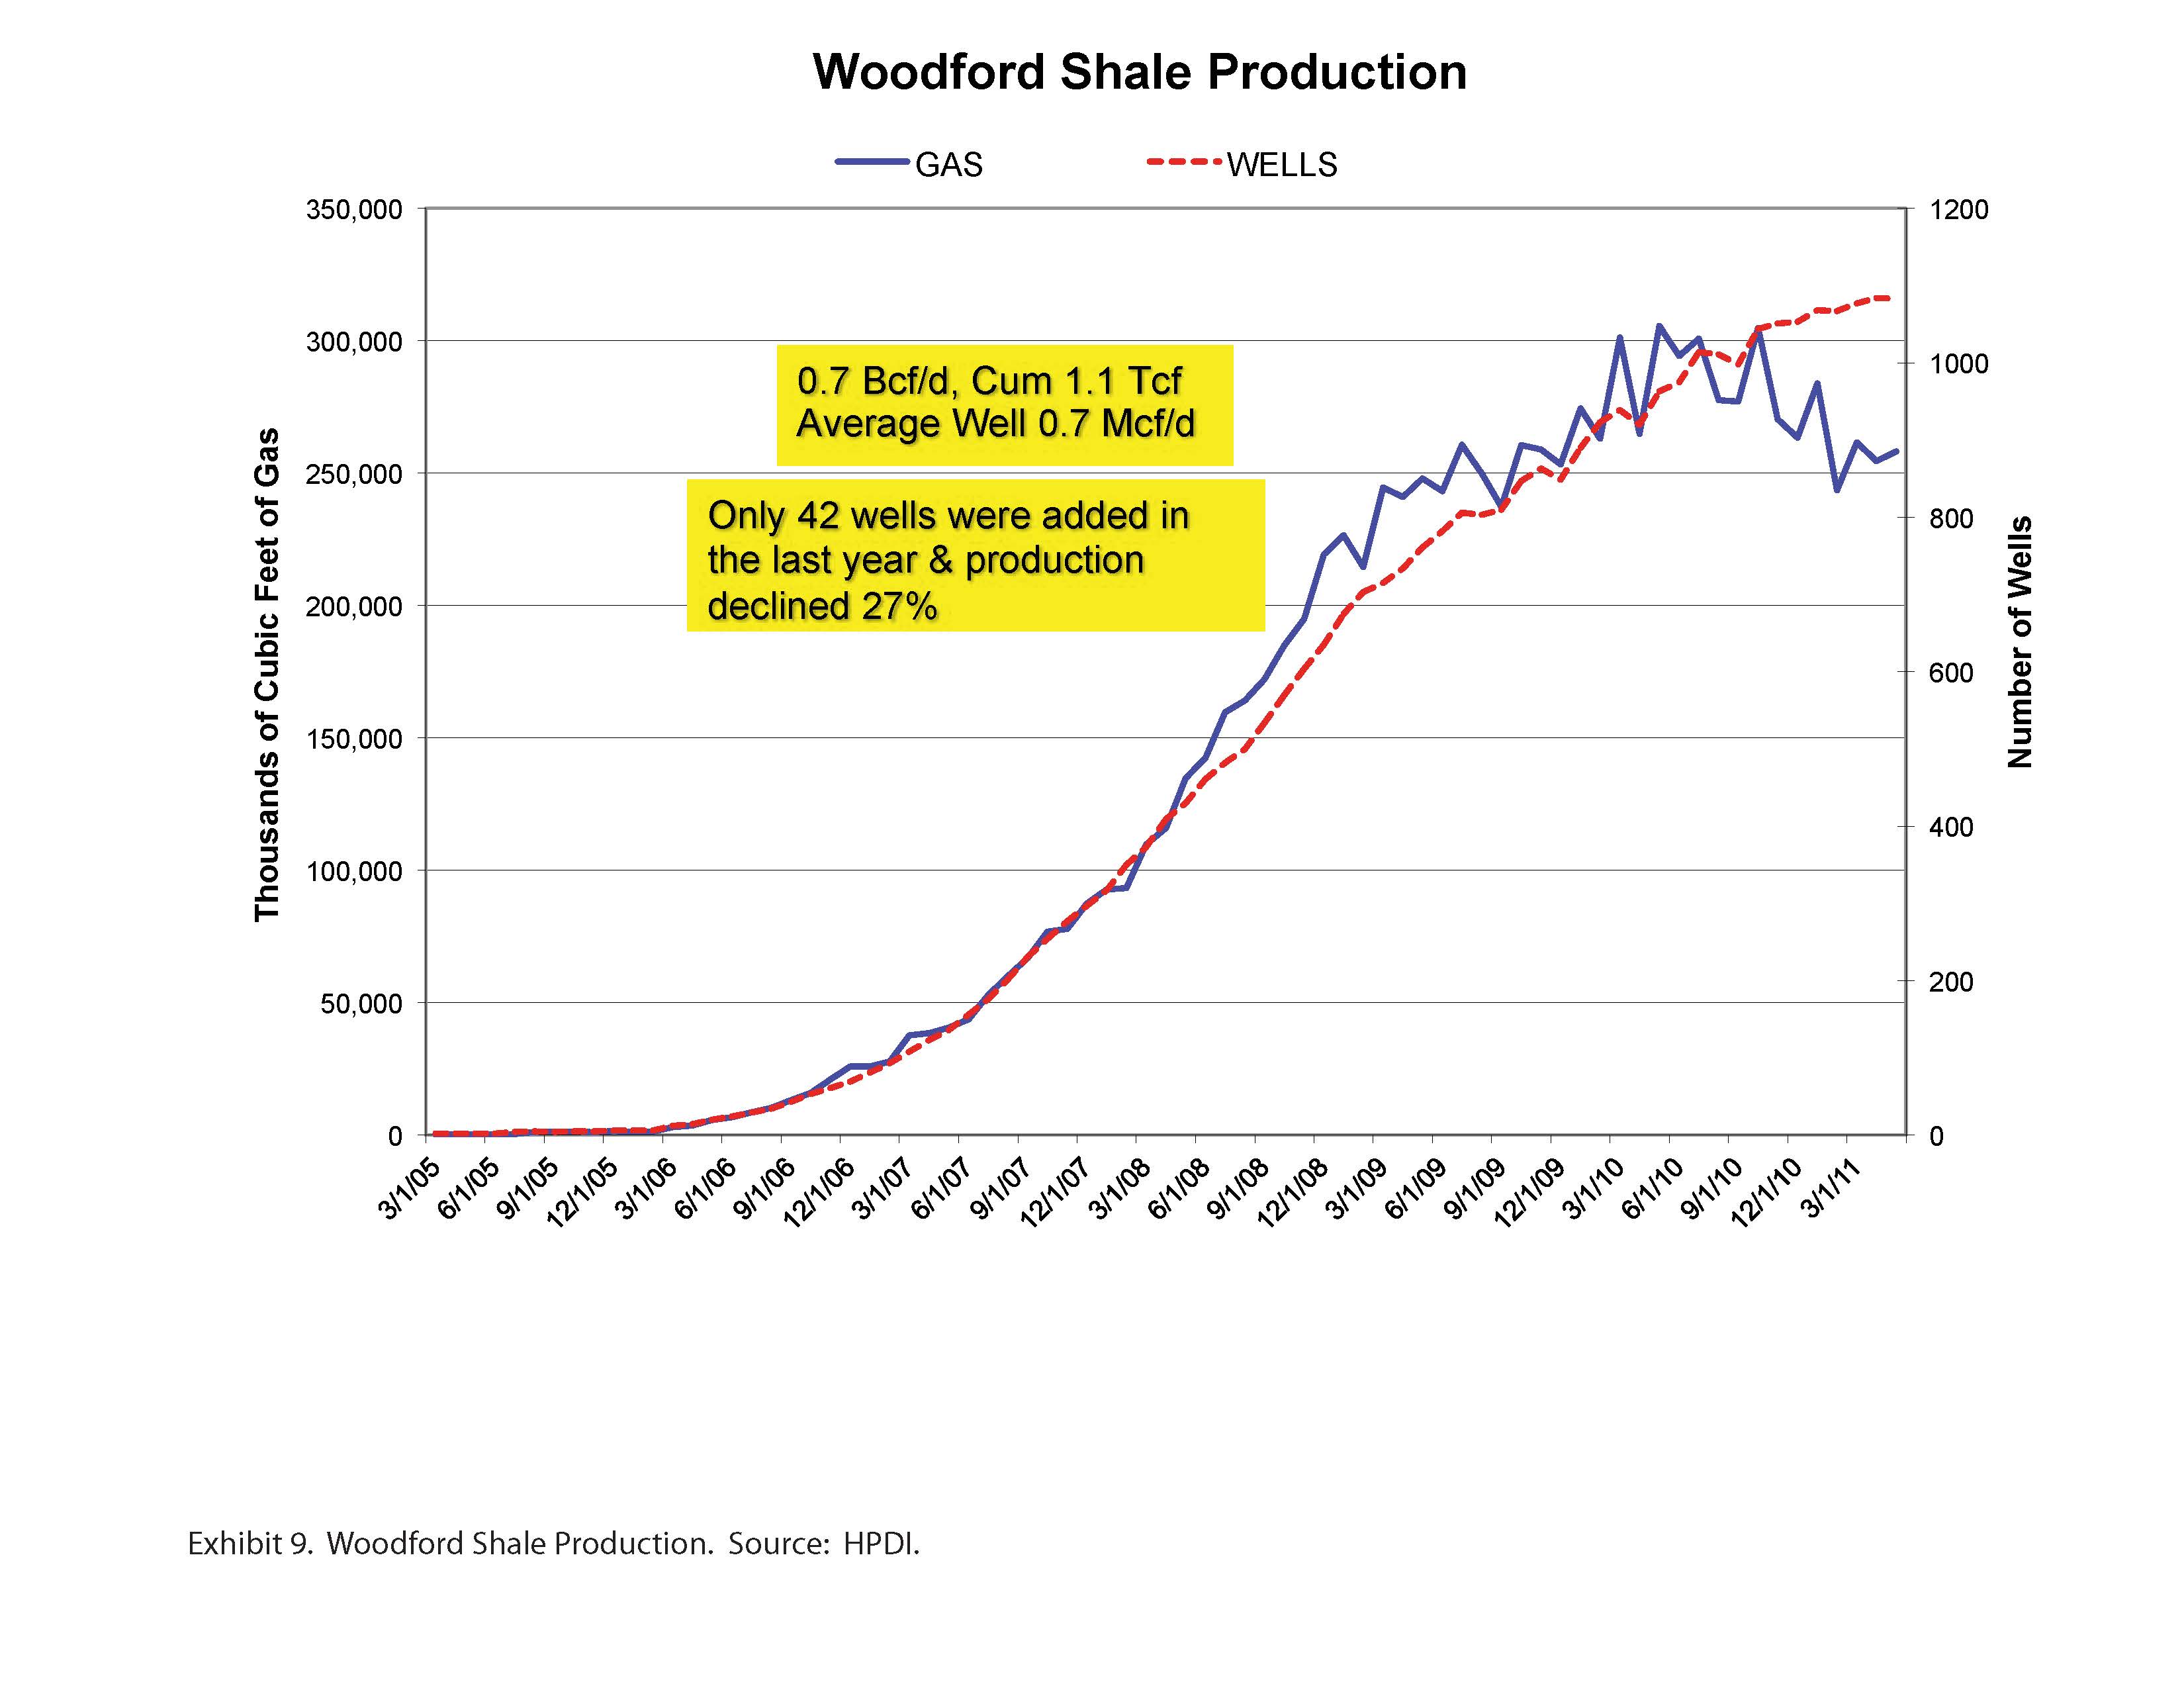
If some existing shale gas plays are approaching peak production after only a few years since the advent of horizontal drilling and multi-stage hydraulic fracturing, what is the basis for long-term projections of abundant gas supply?
What Publicly Available Data Indicates About Supply
Data for this analysis is from publicly available sources provided by government agencies such as the Texas Railroad Commission (TX RRC), the Louisiana Department of Natural Resources (LA DNR), the Oklahoma Corporation Commission, and the Bureau of Ocean Energy Management, Regulation and Enforcement (BOEMRE). This data is available on web sites maintained by these agencies but is also collected and compiled for a fee by service companies, specifically IHS and HPDI (DI Desktop). All of these sources provide access to individual well, field, county, and state production.
The EIA provides valuable data on oil and gas production but not at finer than state level, and state production is only current through 2010. EIA gas production data differs somewhat from state data and from the data collected by service companies, and is generally more optimistic. The EIA uses a model to calculate gas production based on a sample of large gas producers, and then applies a correction to reconcile production with underground storage volumes.
Exhibit 10 shows the discrepancy for Texas gas production between EIA and TX RRC data.
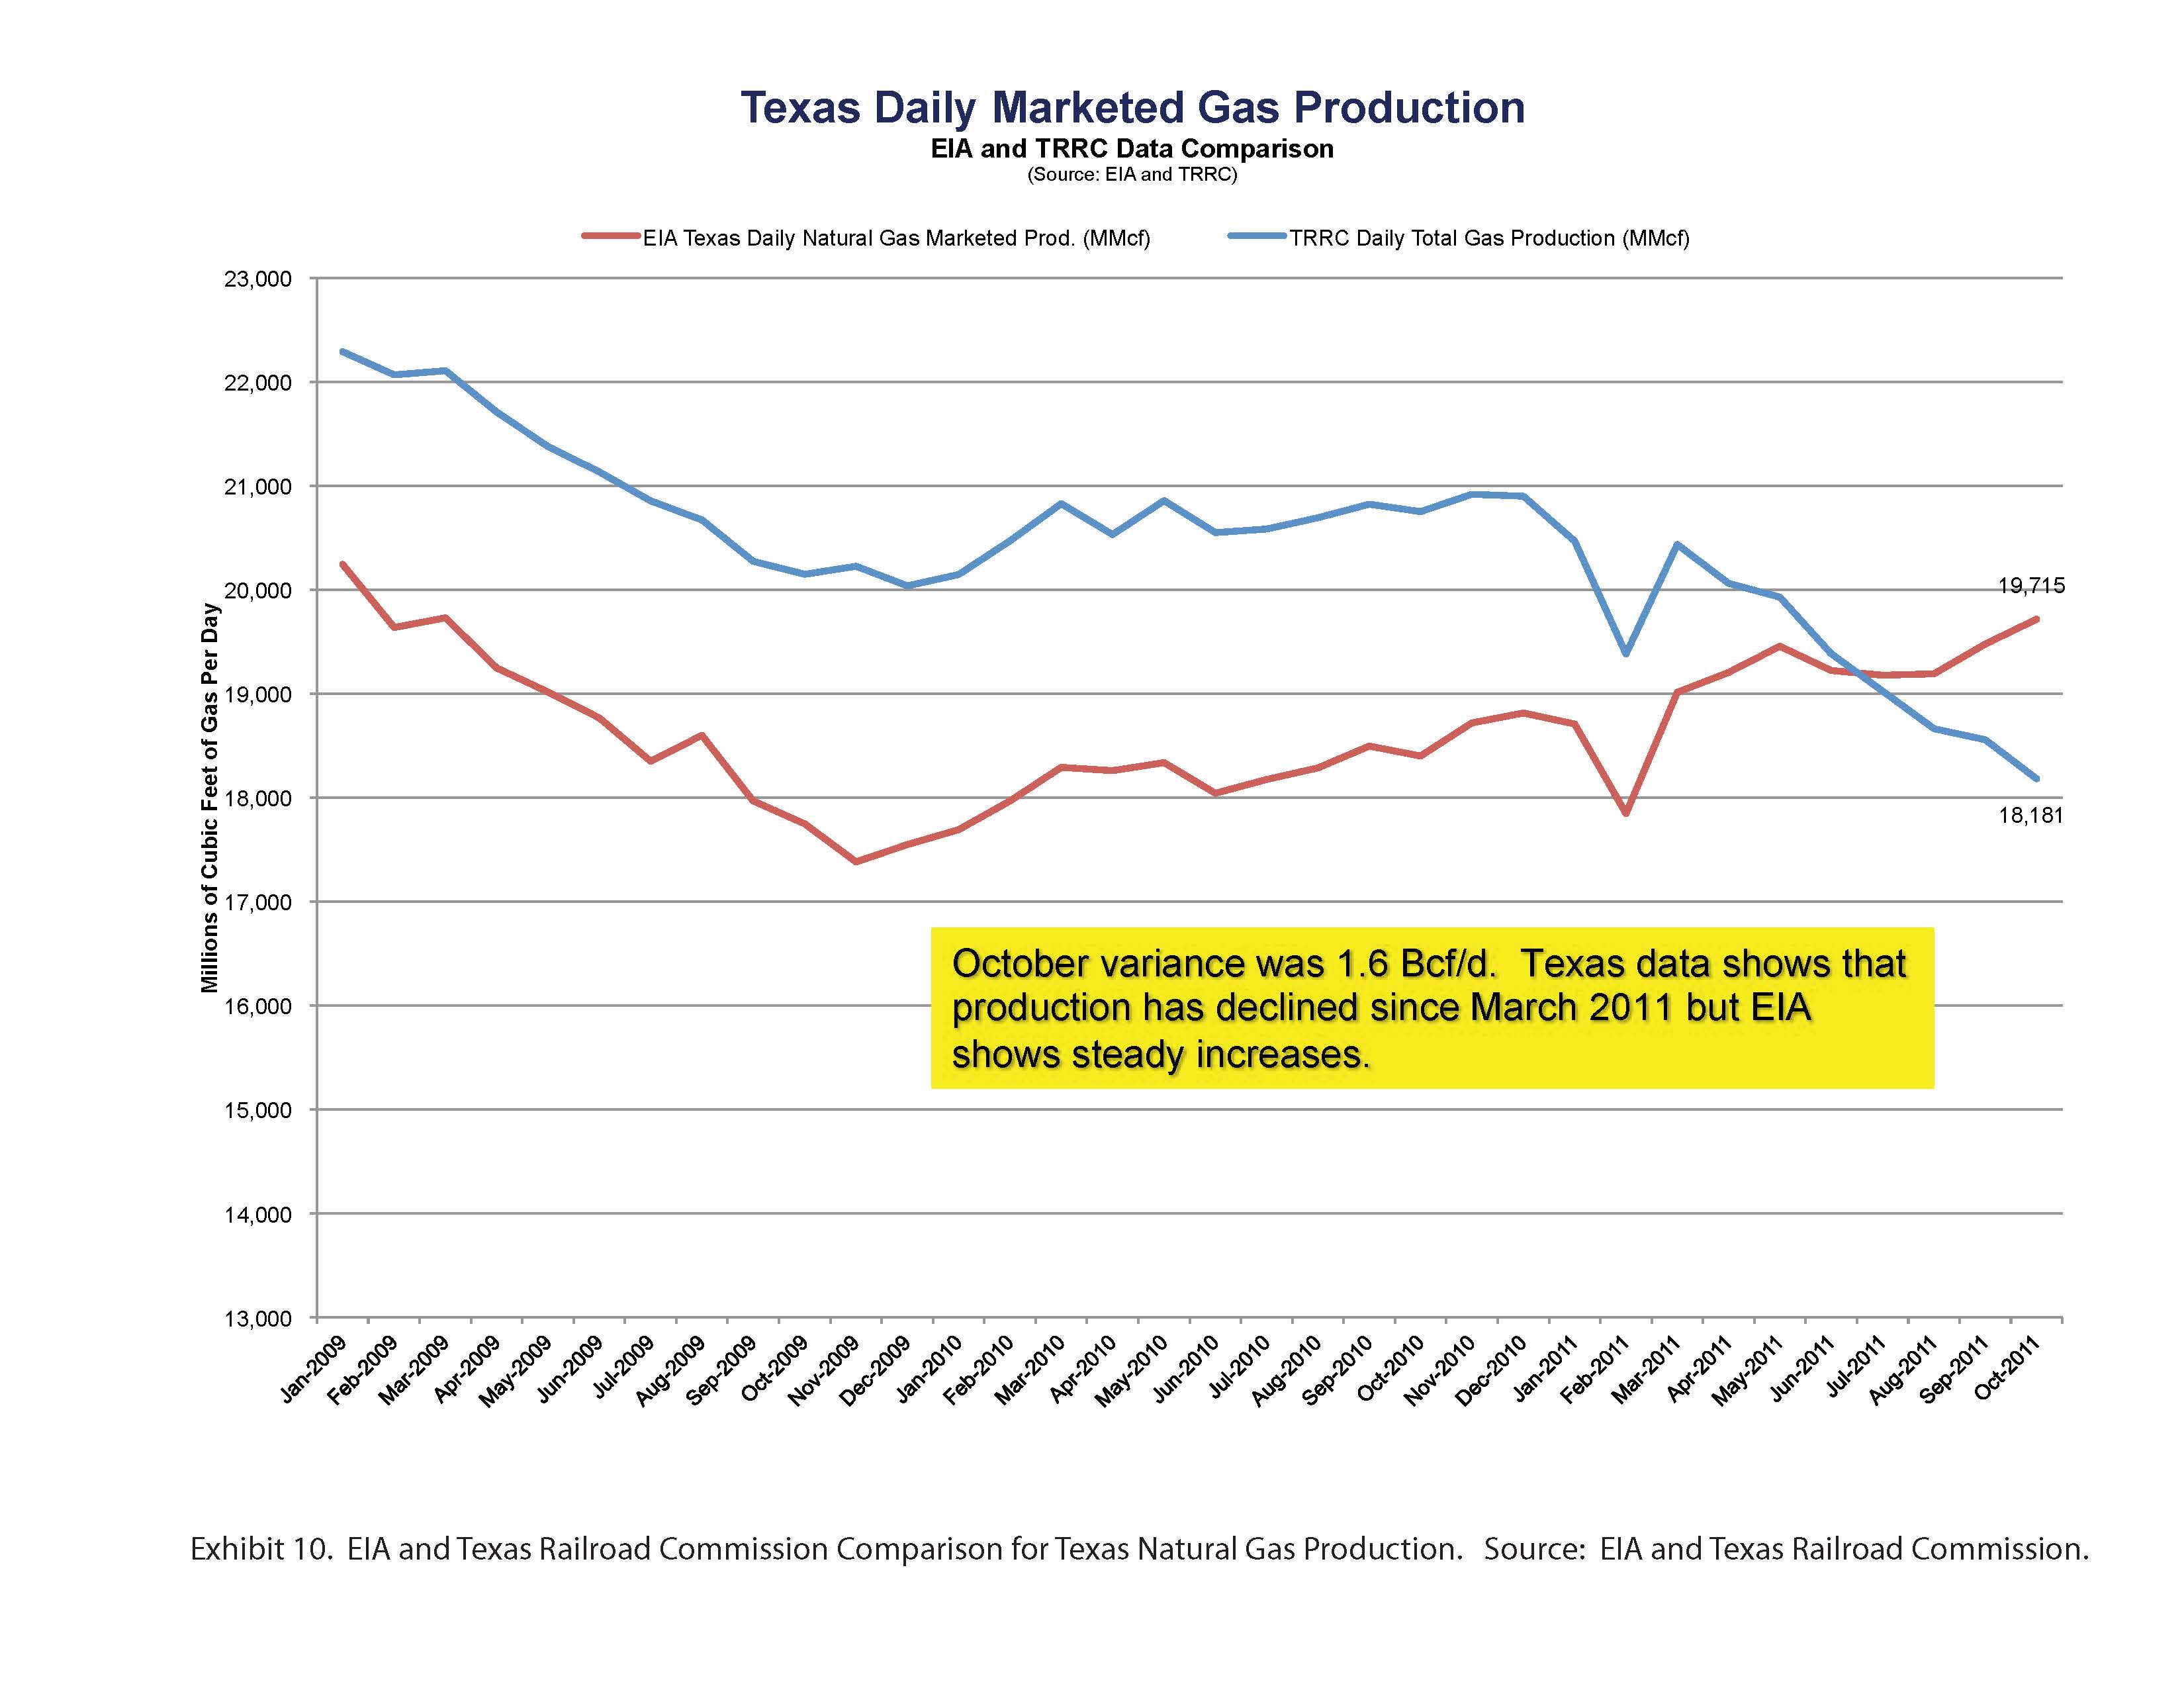
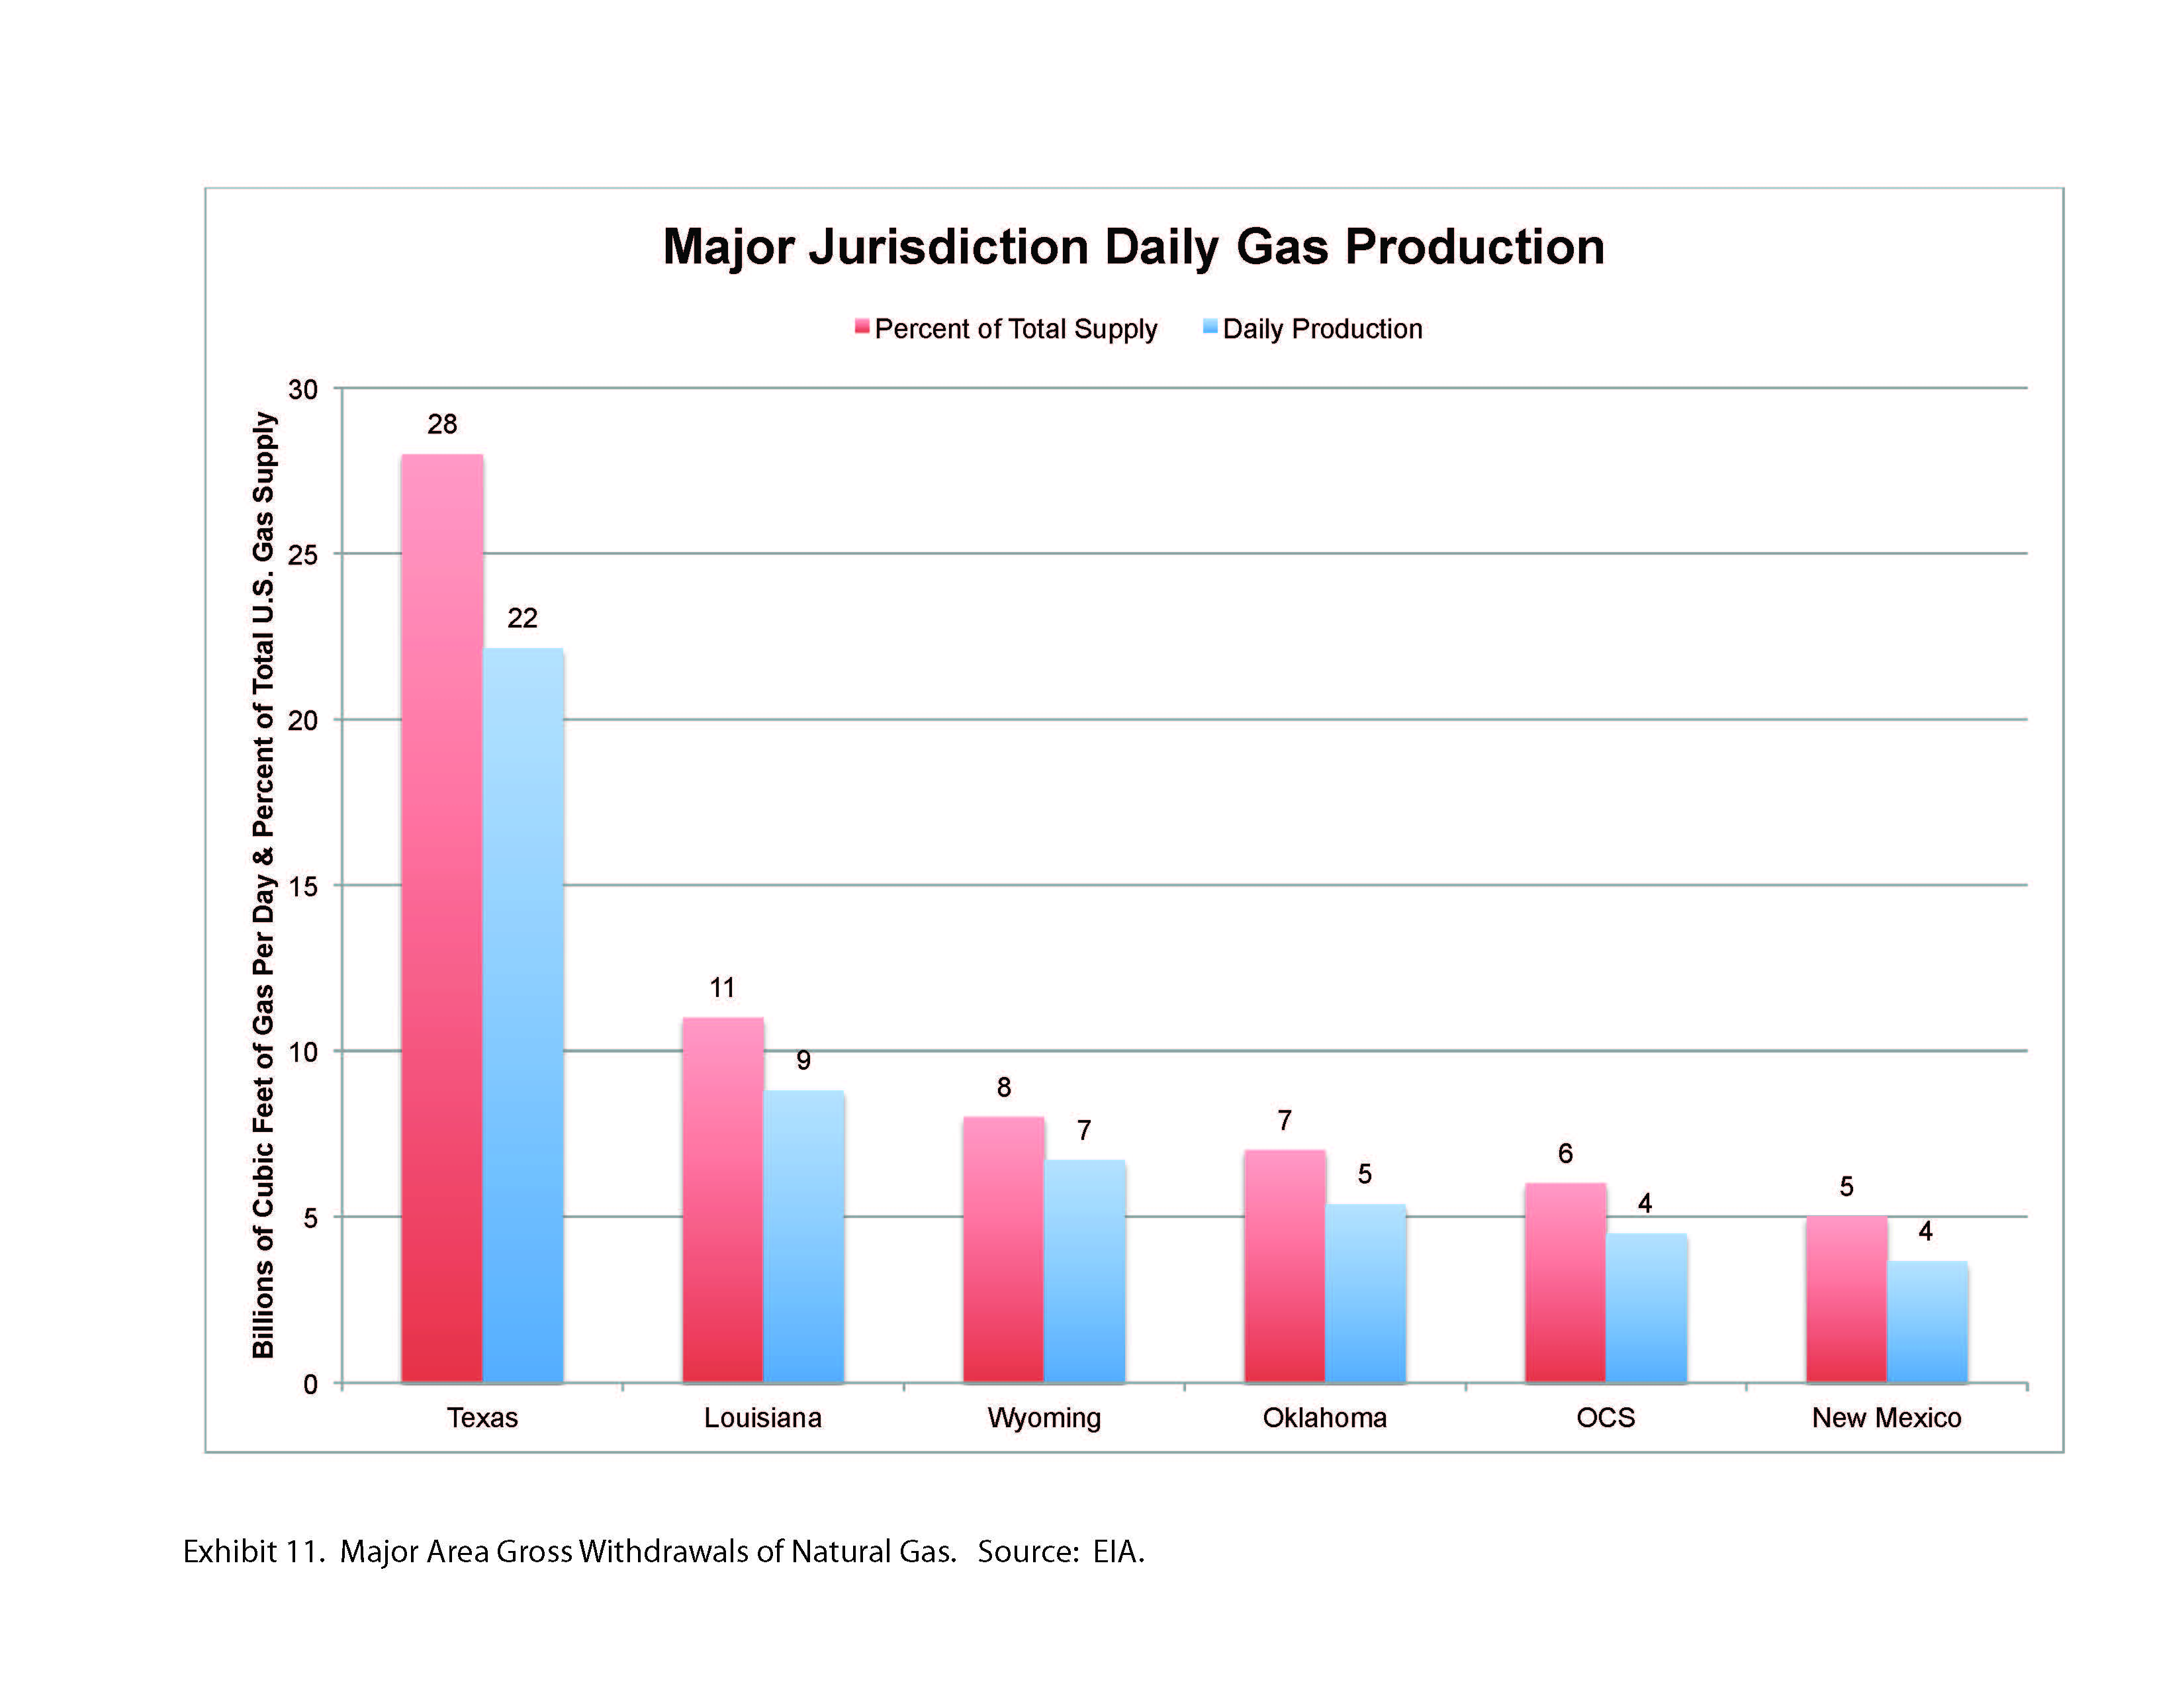
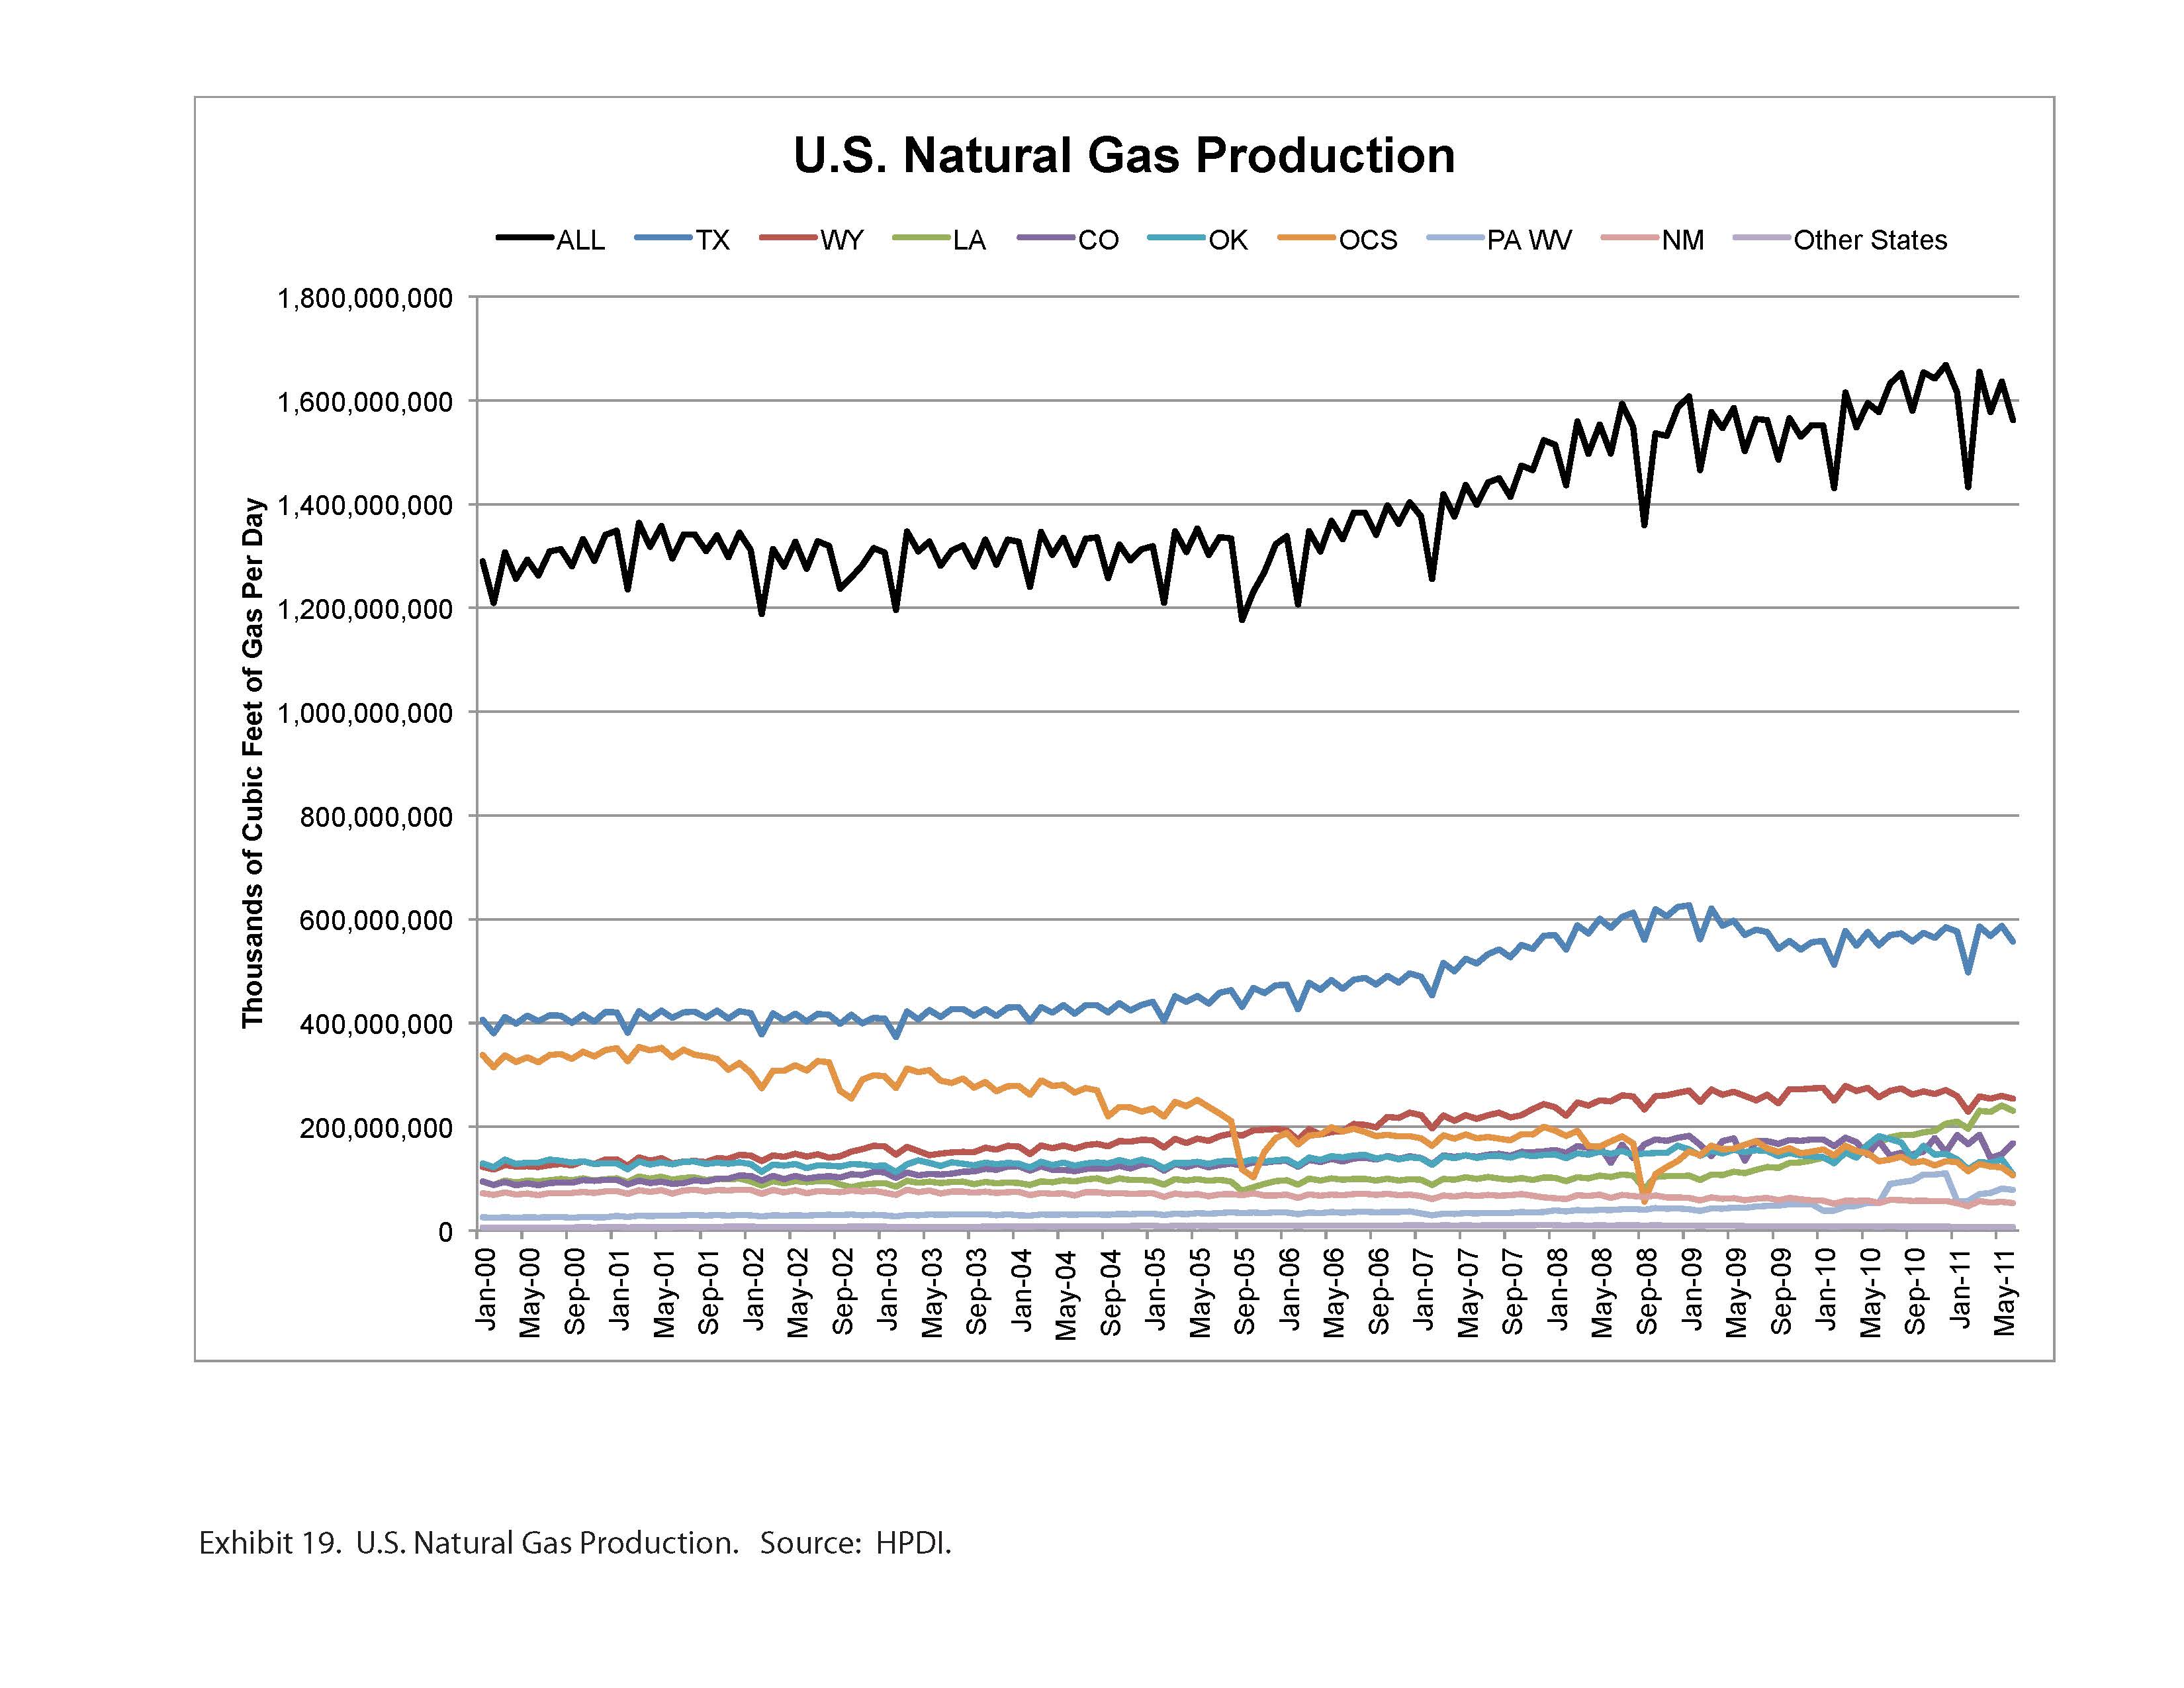
The October 2012 difference was 1.6 Bcf/d. Although TX RRC Data indicates that Texas gas production has declined each month since March 2011, EIA reports show consistent increases. This difference is important because Texas produces 28% of U.S. gas supply (Exhibit 11). Similar differences have been noted for other major gas-producing regions. It should be noted that the EIA data in Exhibit 11 represents marketed production while the TX RRC data shows total gas production.
These accounts should have different values but also should have similar trends. The trends are similar through March 2011 but then diverge producing the present noted variance (The November difference, not shown on the graph, is 2.6 Bcf/d).
We have studied Texas production reporting and find that it is generally reliable and accurate in areas that we follow closely in our oil and gas exploration and production business. Revisions are common for the first and second most recent months of production but are not statistically significant at the state or field level. Data going back three reporting months is reliable. Studies of other major gas-producing states show similar results. Our intent to is to point out the differences between state and EIA data, and to suggest that EIA data is not particularly useful to track individual play or some state production on a current basis.
Texas, Louisiana, Wyoming, Oklahoma, Gulf of Mexico Outer Continental Shelf, and New Mexico account for roughly 75% of U.S. natural gas supply and, therefore, provide a useful proxy for total U.S gas production. Exhibits 12 through 17 show natural gas production for these regions.
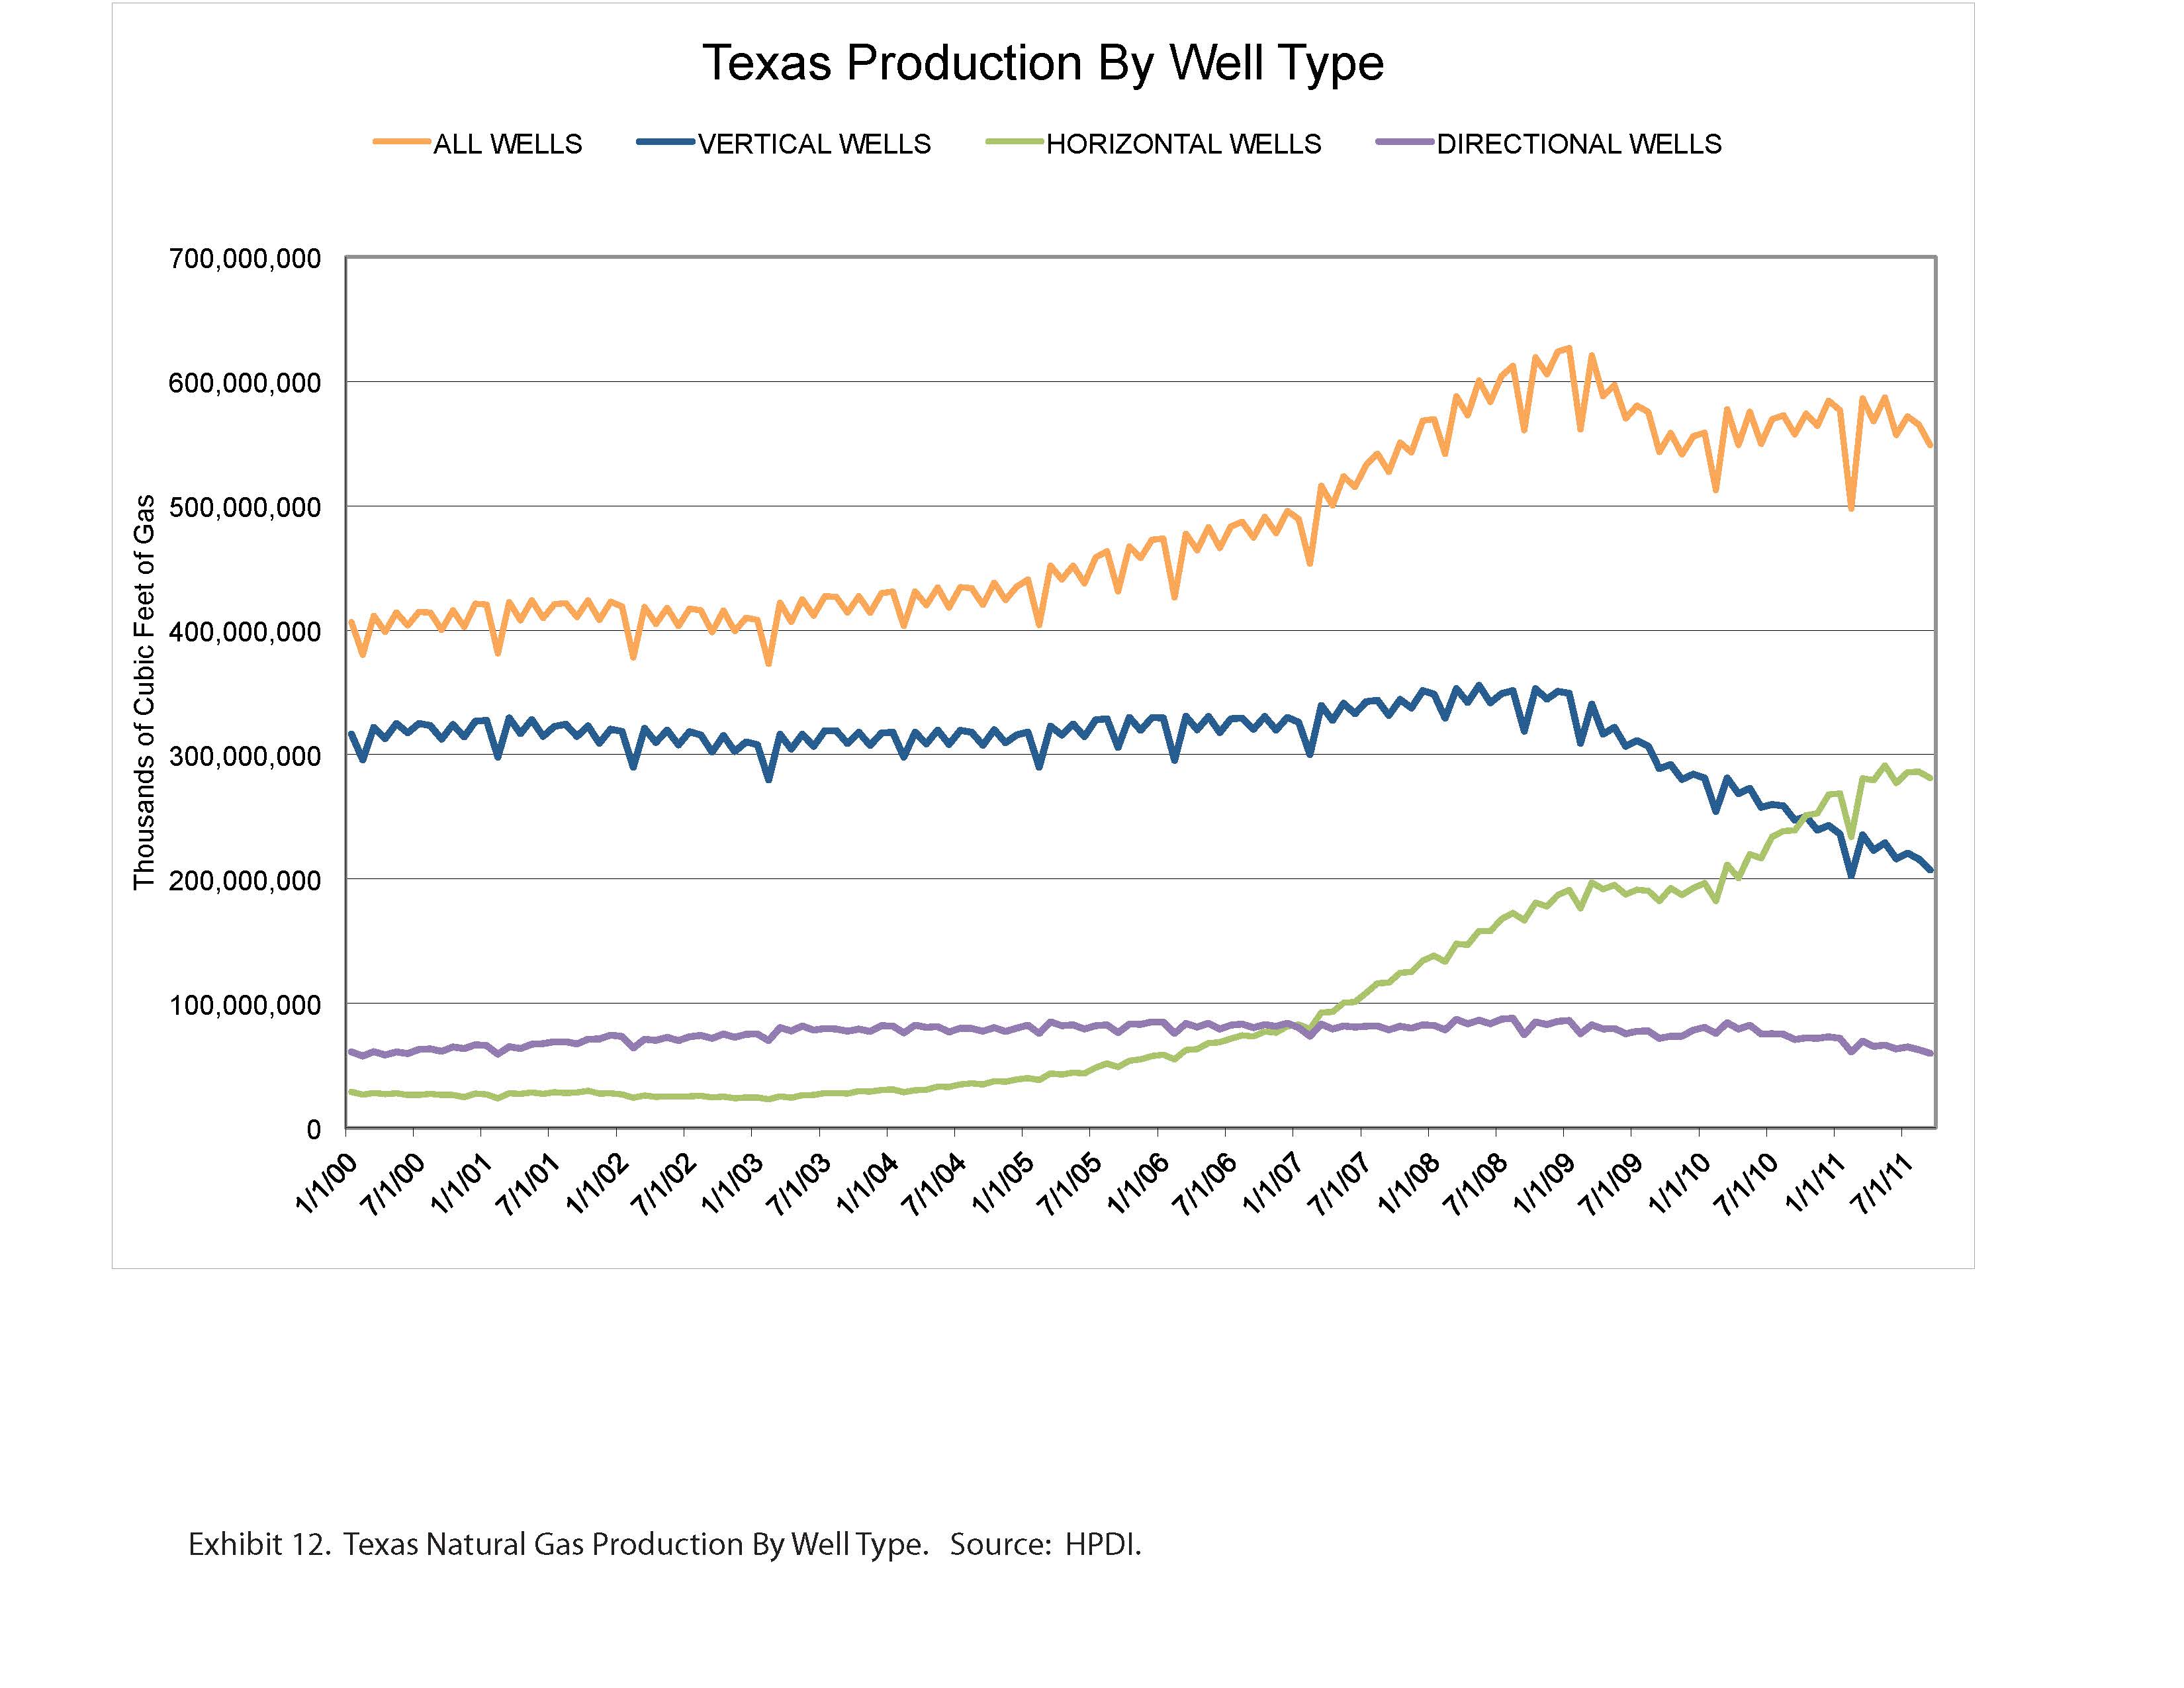
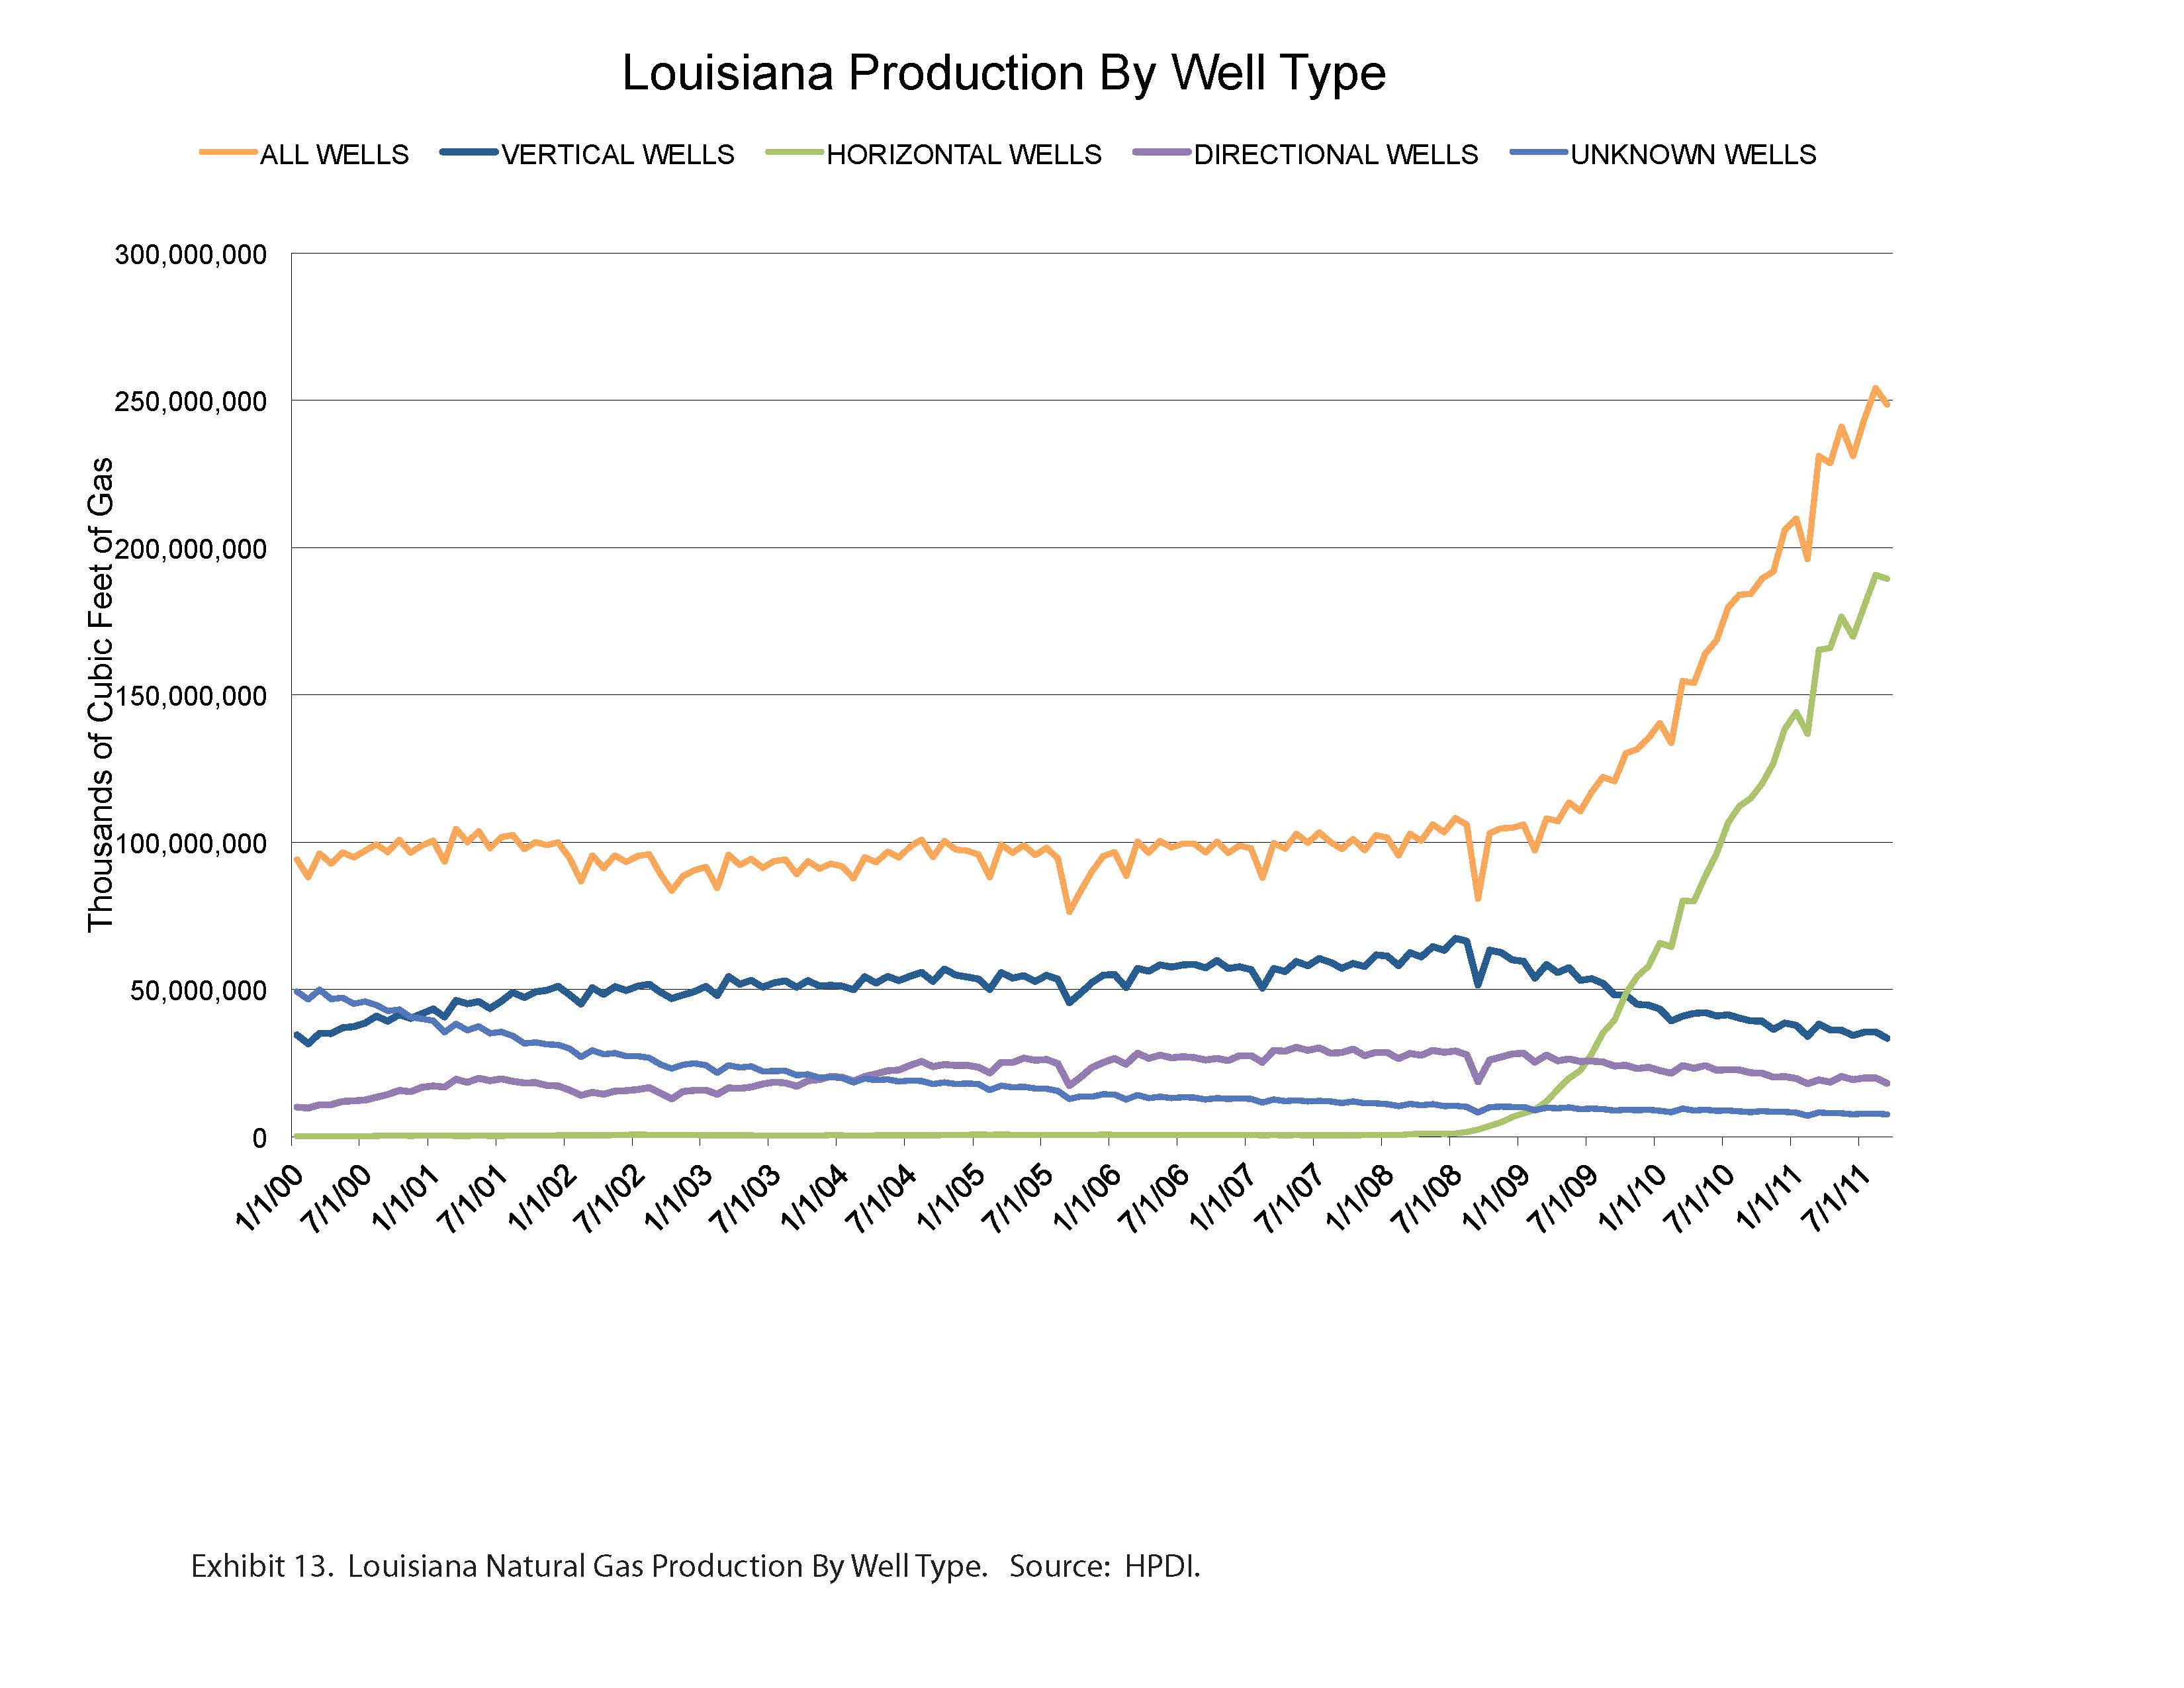
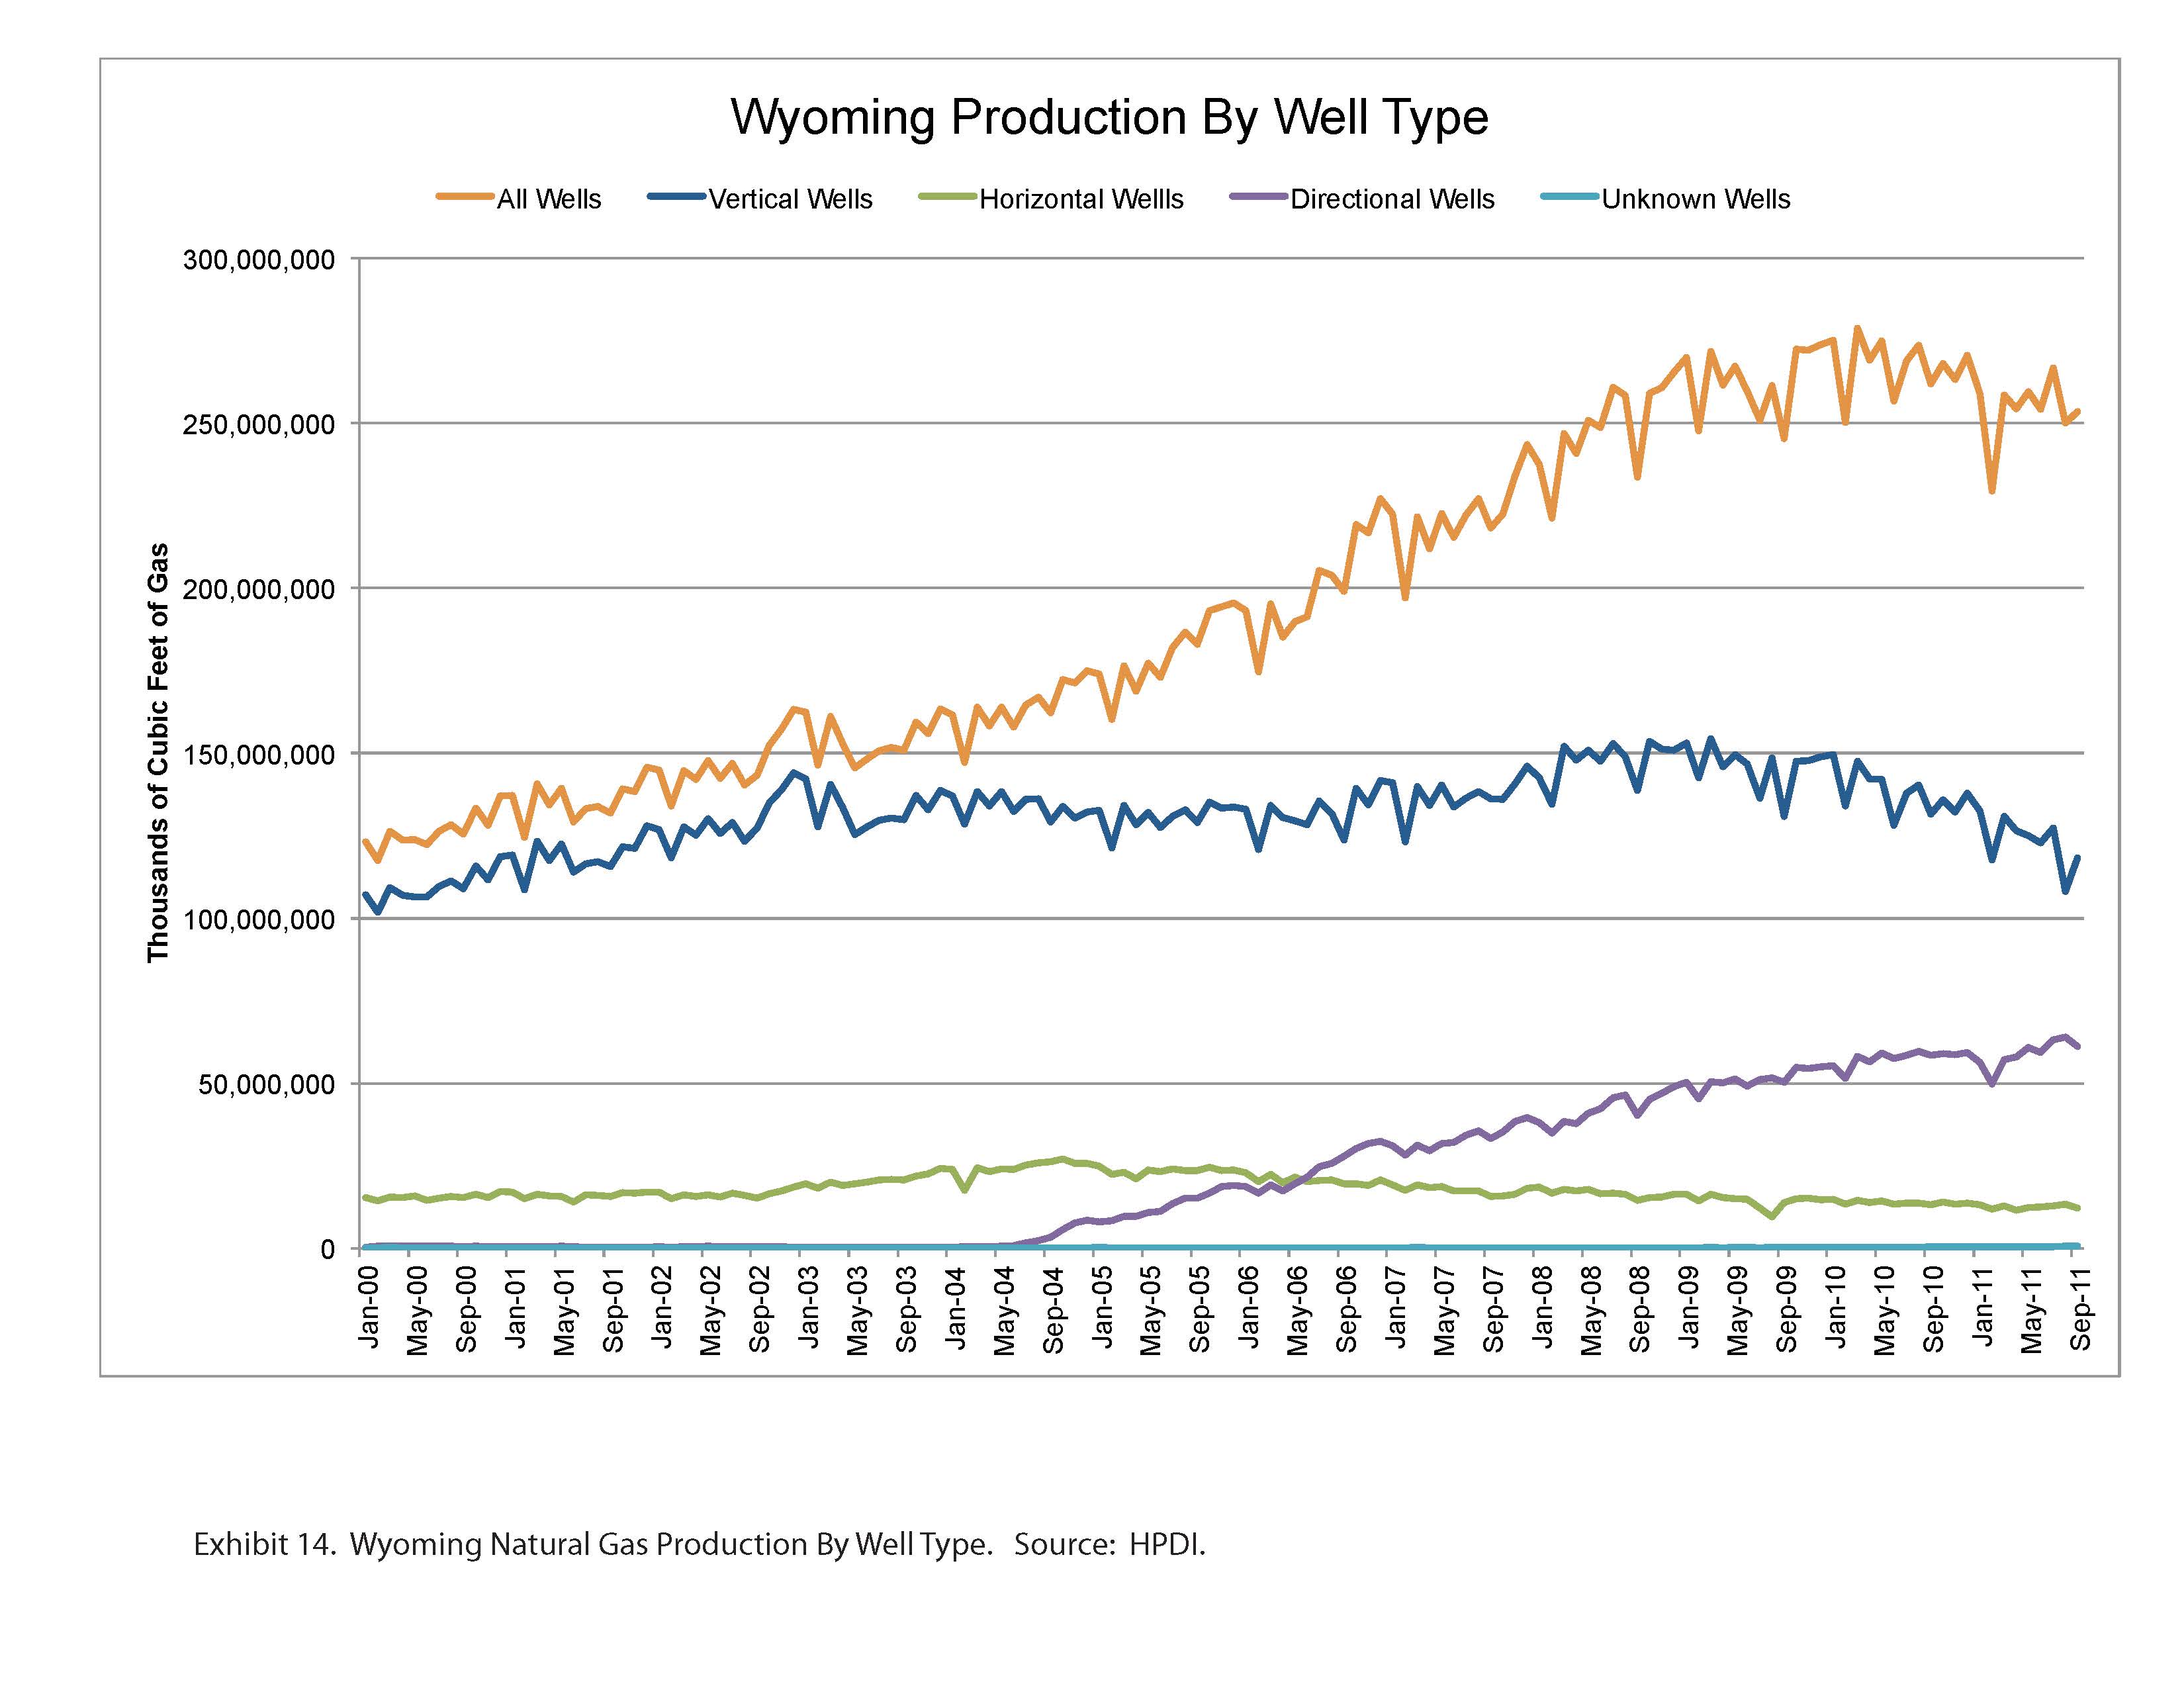
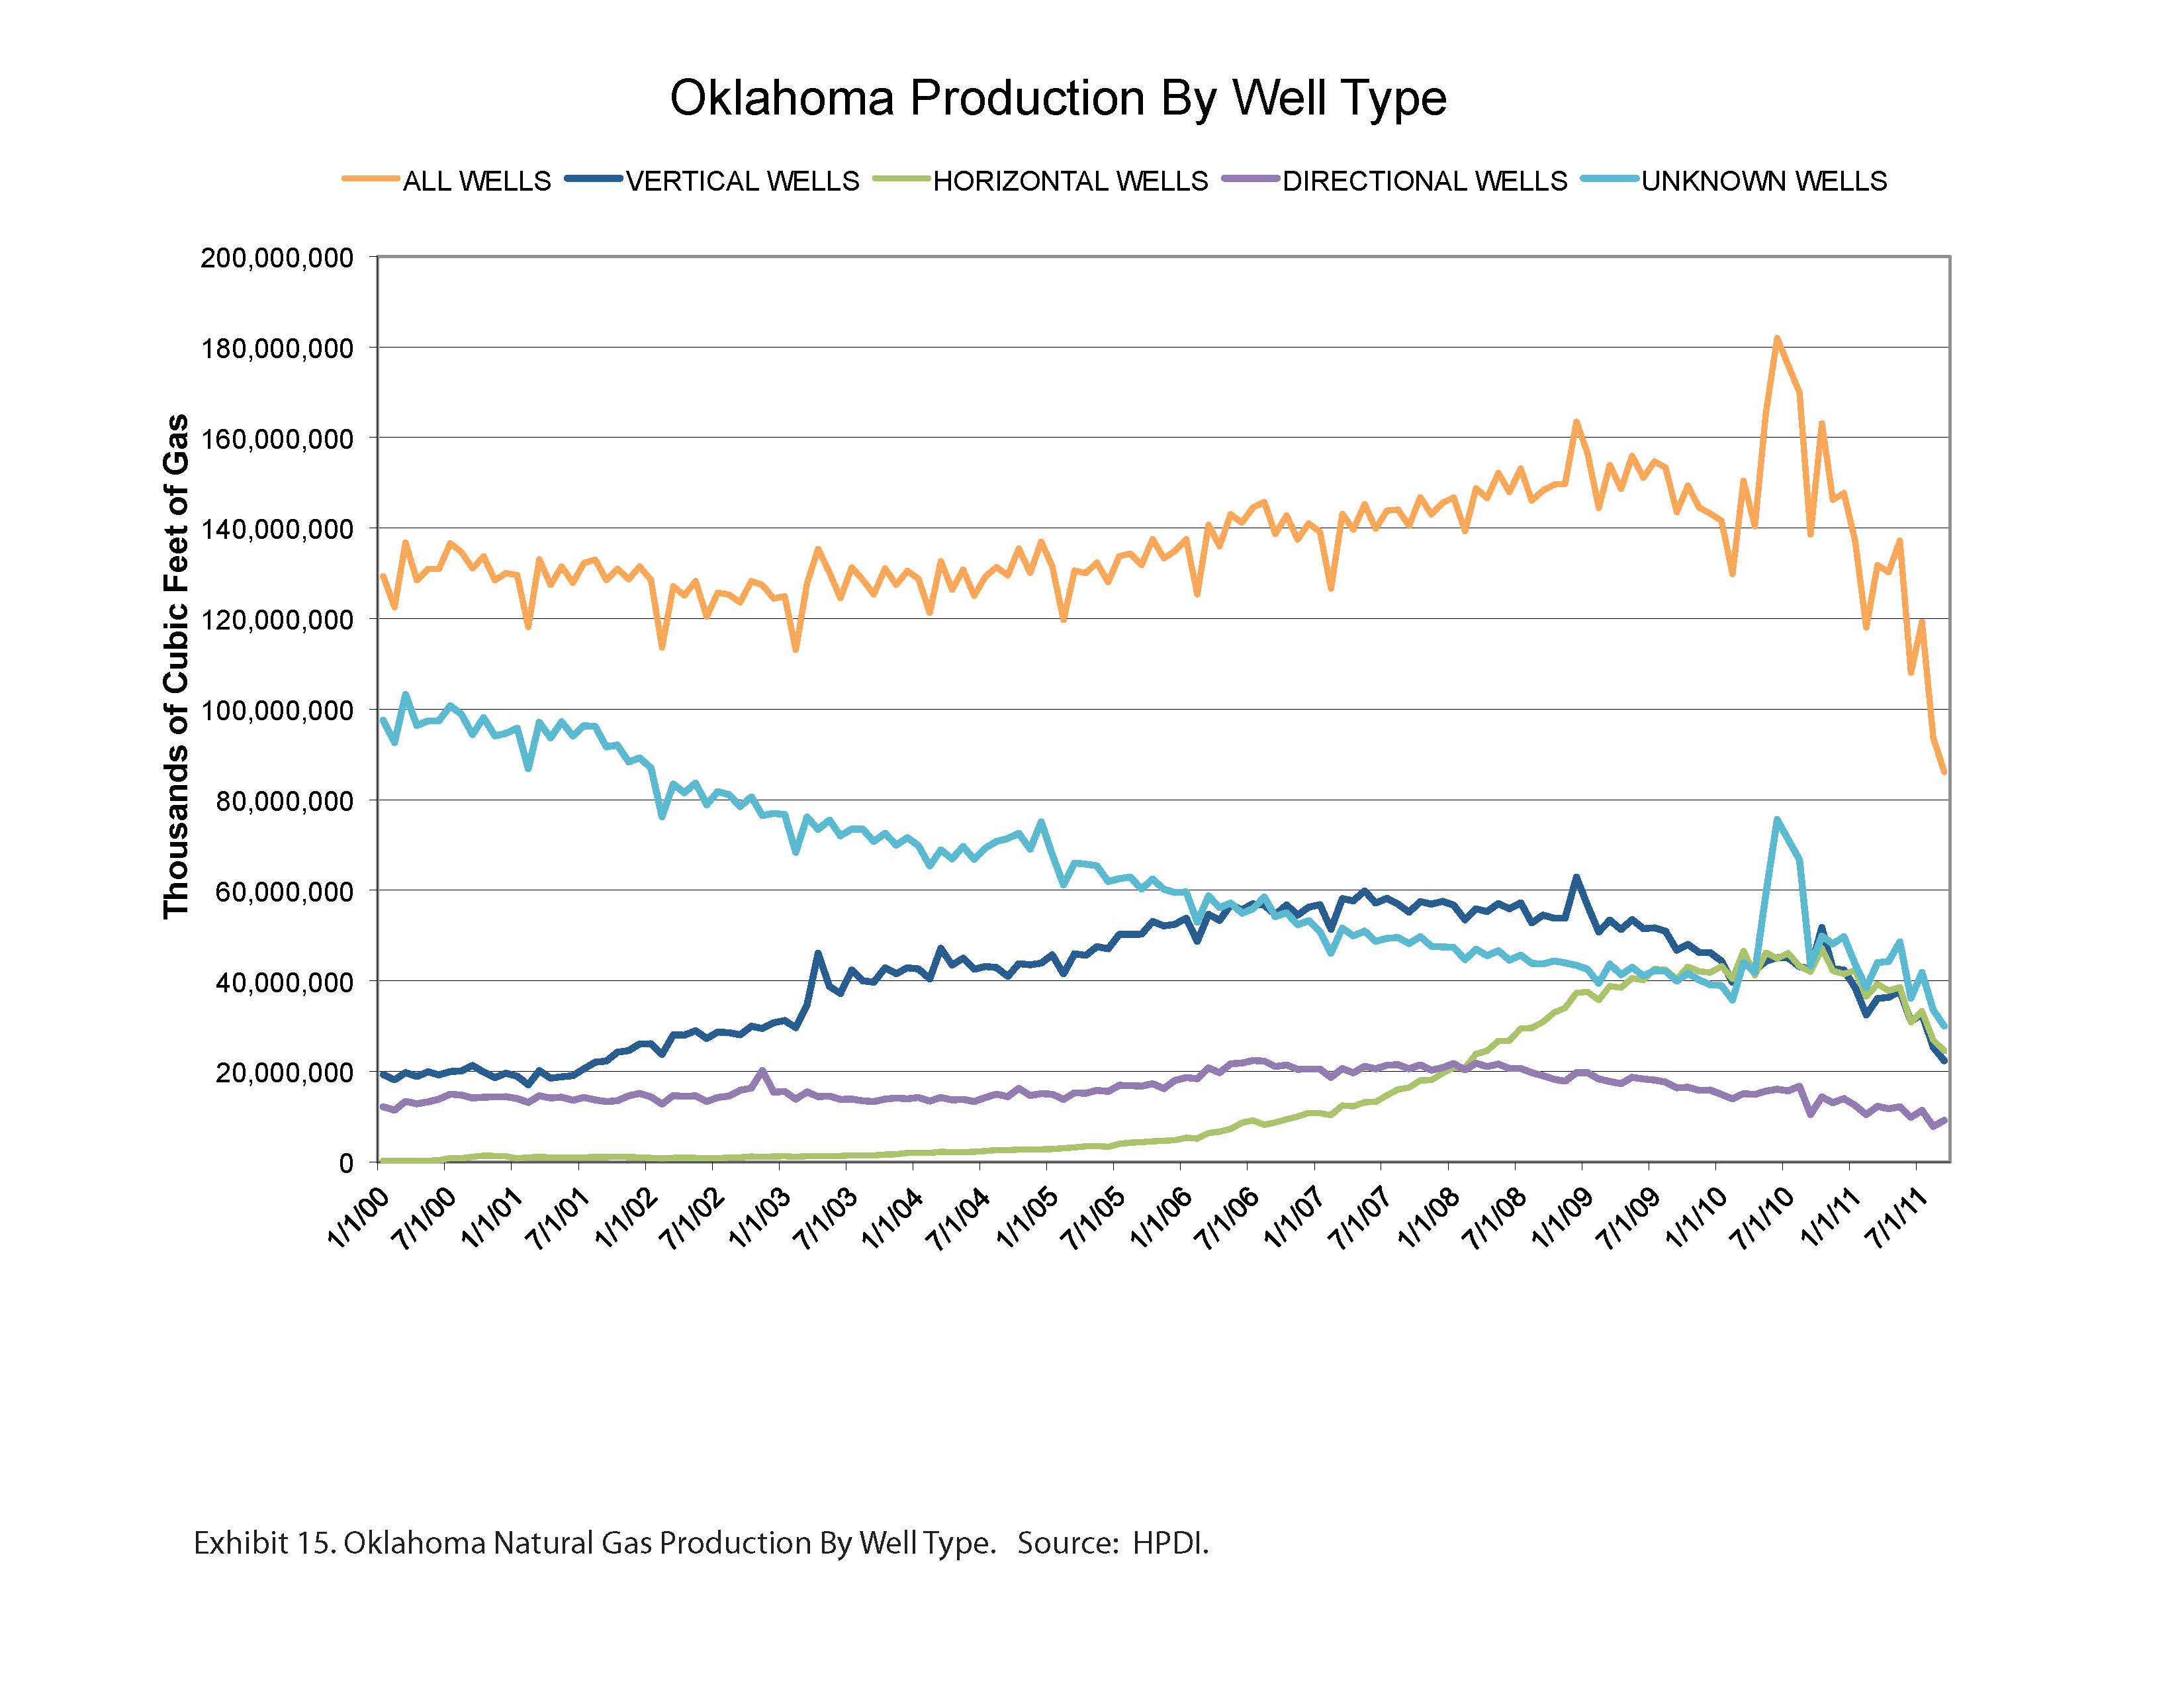
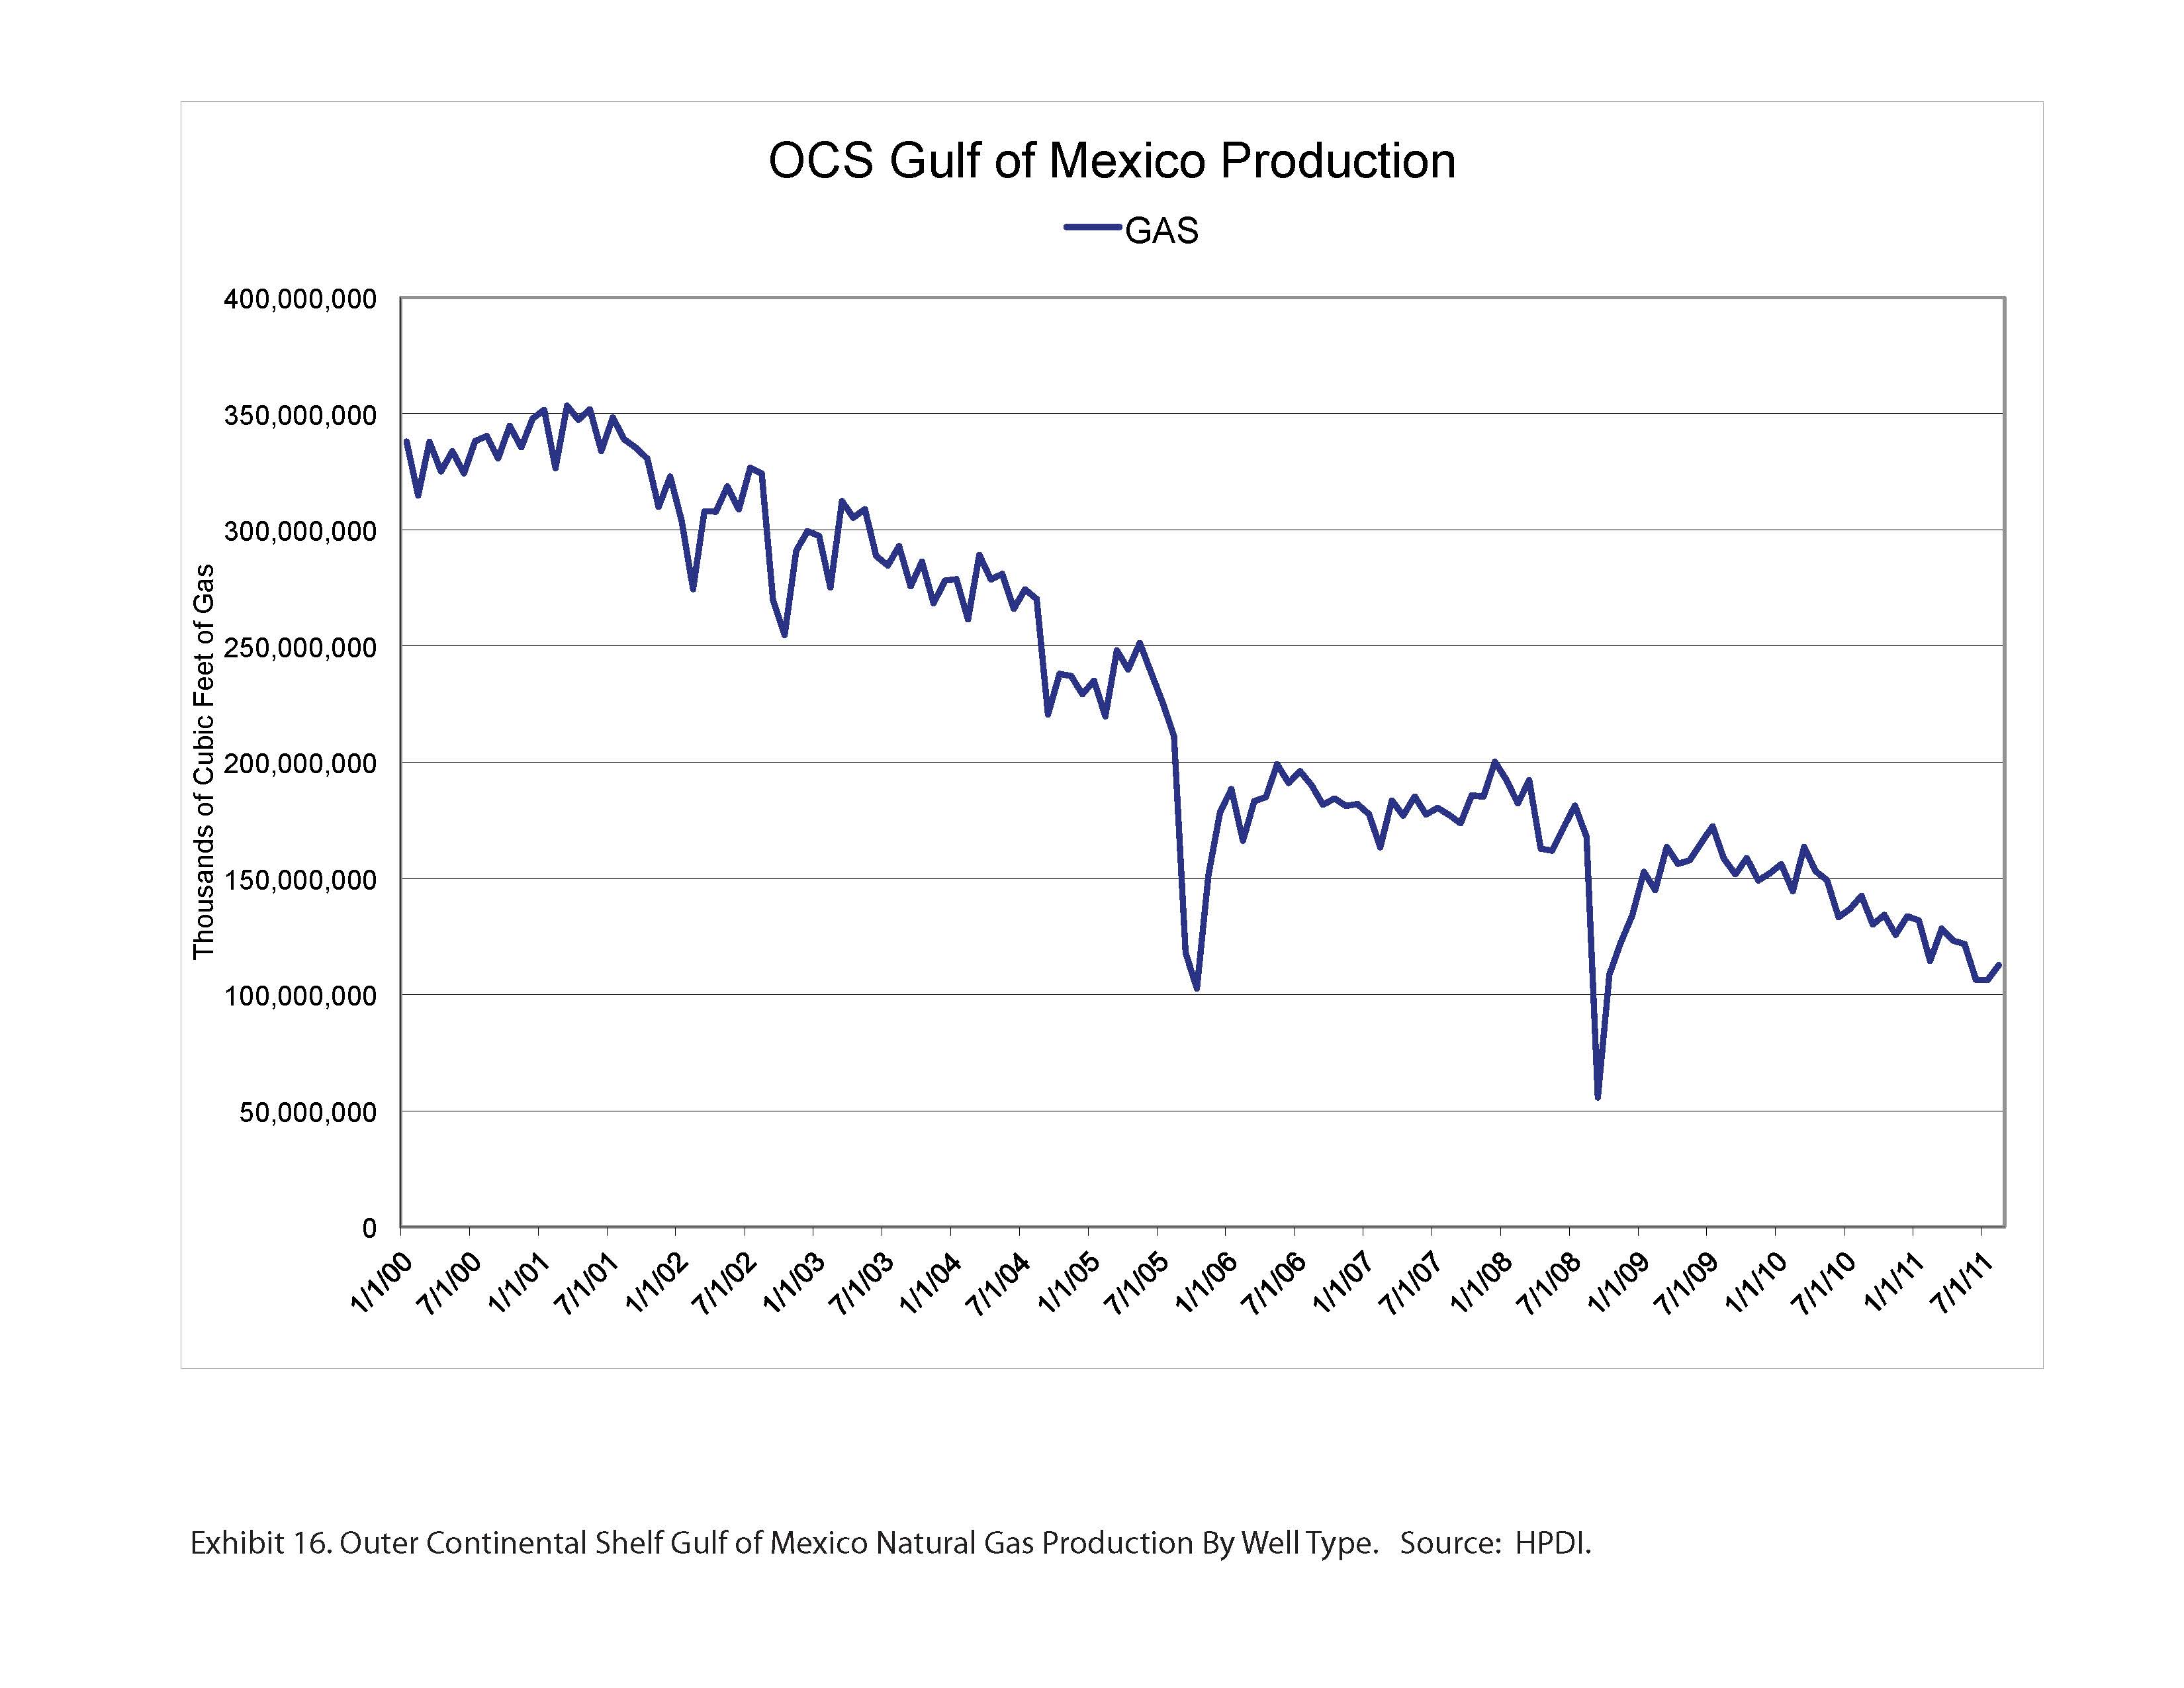
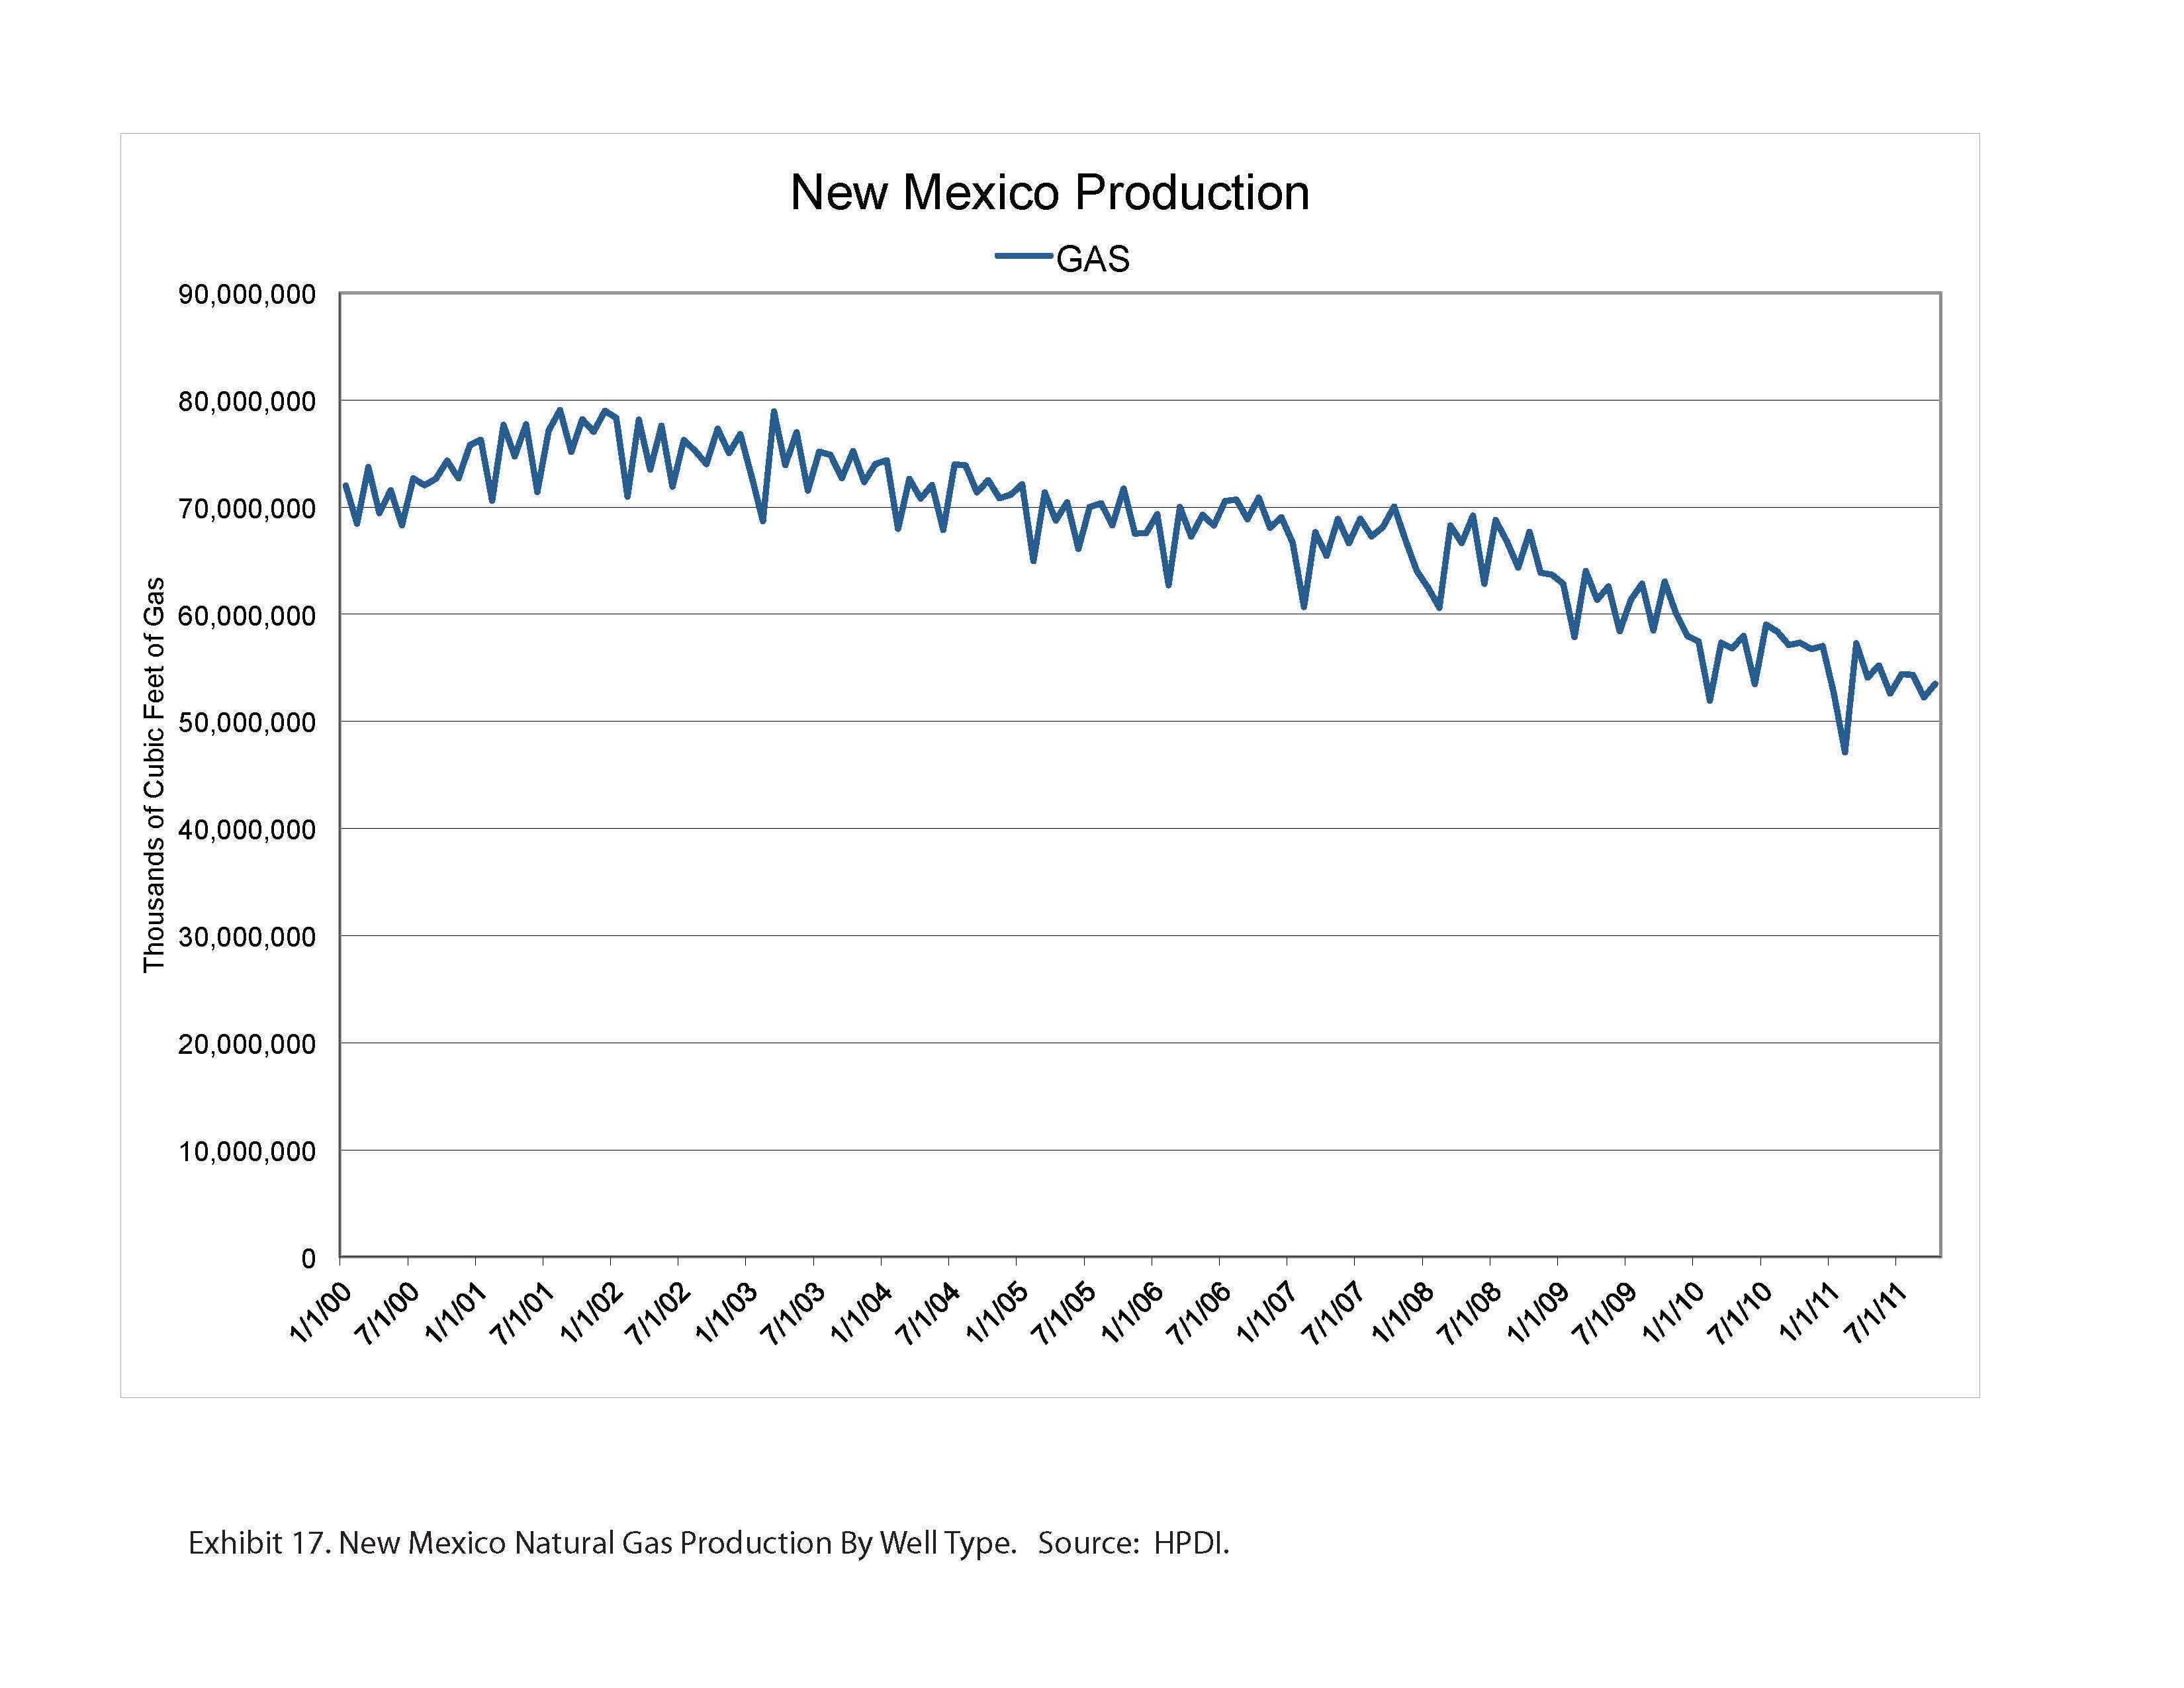
All of these major gas-producing areas except Louisiana are in decline. This is largely because non-shale production is declining rapidly since little new drilling in these reservoirs in recent years has occurred. While shale production volumes and initial rates are impressive (Exhibit 18), much of this new production is merely substituting for depleting conventional gas reserves.
With the shift to more oil-prone or "liquids-rich" shale plays, many observers have suggested that associated gas production from these plays is or will be a major contributor to the present over-supply of gas. Approximately 3% of total U.S. gas supply is from shale associated gas so, while this is a factor, it is not the cause of over-supply. Details of this analysis may be found in an earlier post. Overall, U.S. natural gas production using state-level data appears to have reached an undulating plateau (Exhibit 19).
Conclusions
A secular shift has occurred in the U.S. domestic gas supply by drilling mostly shale formations, formerly considered source rocks too costly to develop. The tremendous number of wells drilled in the last several years has contributed to an over-supply of gas. The shale revolution did not begin because producing oil and gas from shale was a good idea but because more attractive opportunities were largely exhausted. Initial production rates from shale are high but expensive drilling and completion costs make economics challenging. The gold rush mentality taken by companies to enter shale plays has added expensive leases and new pipelines to those costs, further complicating shale gas economics.
In the decades before shale plays, the exploration and production emphasis was on discipline. Science was used to identify the most prospective areas in order to limit the amount of acreage to be acquired and its cost. Shale plays have produced a land grab business model in which hundreds of thousands of acres are acquired by each company. Unprecedented lease costs have become the norm often based on limited information and science.
Operators have indulged in over-drilling these plays for many reasons but adding reserves, holding leases and company growth are among the main factors particularly with the low cost of capital. The inevitable result has been the collapse of prices as supply exceeded demand. Most analysts forecast that the future will be much like the present, and that natural gas will be abundant and cheap for decades to come. There are, however, strong and consistent indicators that natural gas supply may be less certain than most observers believe and require a higher price to be developed economically. Natural gas demand is growing as fuel switching for electric power generation continues, and will be increased by environmental regulation in the coming years. The U.S. will shift more of its future energy needs to natural gas in many sectors of the economy. The best justification, in fact, for the land grab and over-drilling spree is expectation of higher prices. Those companies that grabbed the land and held it by production will profit greatly once the true supply and cost of shale gas is recognized.
The financial survival of all companies in this position is not, however, certain. Price matters, and there is finally some response from shale gas producers with recent announcements to curtail drilling. While price was cited as the main reason for reduced drilling, it is likely that some companies now have financial constraints. The shale gas phenomenon has been funded mostly by debt and equity offerings. At this point, further debt and share dilution are less feasible for many companies. Joint ventures have provided a way for some to prolong spending but that now seems like a less likely source of funding. Capital availability in the near term will likely be tighter than is has until now. Acquisition and consolidation may become more attractive to companies with cash as producers become more extended.
Some of the shale gas plays may be at or near peak production at least at the current price of gas and technology. All major producing areas except Louisiana are in decline. Some doubt the accuracy of public data compared with EIA data, but it seems unlikely that the trends it shows are erroneous. In any case, the data the EIA makes available does not have sufficient resolution to evaluate individual plays or state-level trends.
Intermediate-term shale well performance is poorer than assumed previously . Continuous treadmill drilling masks this issue so play decline rates are not recognized. High decline rates are, however, a salient issue meaning that and most of a shale gas well's reserve is produced in the first few years. Well life appears to be shorter than initial expectations. This means that an increasing number of wells must be drilled in order to maintain supply. Now, it appears that fewer wells may be drilled until price recovers to commercial levels. The argument for improved efficiency that cites increasing production with lower rig count is suspect. It is mostly because of the large backlog of previously drilled wells that are just now being connected to sales. This spare capacity provides a boost to supply during a period of falling gas-directed rig count.
The gold rush is over at least for now for the less commercial shale plays. The money and activity have moved to more oil-prone shale plays such as the Eagle Ford and Bakken or to higher potential gas plays such as the Marcellus. Improbable stories that great profits can be made at increasingly lower prices have intersected with reality. A painful adjustment is underway in the natural gas exploration and production industry. Fewer jobs will be created and projects may develop more slowly. This development may expose the notion of long-term natural gas abundance and cheap gas as an illusion. The good news is that this adjustment will lead to higher gas prices in a future less distant than most believe. Higher prices coupled with greater discipline in drilling will allow operators to earn a suitable return and offer the best opportunity for supply to grow to meet future needs.
References
Andreoli, D., 2011, The Bakken Boom - A Modern-Day Gold Rush. The Oil Drum: http://www.theoildrum.com/node/8697.
Berman, A.E. and L. Pittinger, 2011, U.S. Shale Gas: Less Abundance, Higher Cost. The Oil Drum: http://www.theoildrum.com/node/8212.
EIA Annual Energy Outlook 2011 Early Release Overview.
EIA Annual Energy Outlook 2011 Natural Gas Tables: http://www.eia.gov/oiaf/aeo/tablebrowser/#release=EARLY2012&subject=0-EA....
Gilbert, D. and R. Dezember, Chesapeake Energy Pulls Back Amid Natural-Gas Glut: Wall Street Journal, January 24, 2011: http://online.wsj.com/article/SB1000142405297020380650457717865173251197....
Potential Gas Committee 2010 Report: http://www.potentialgas.org/.
After The Gold Rush: A Perspective on Future U.S. Natural Gas Supply and Price
PDF version
122 comments
After The Gold Rush: A Perspective on Future U.S. Natural Gas Supply and Price
PDF version
122 comments
Contact
- Content: editors at theoildrum dot com
- Tech support: support at theoildrum dot com
License

This work is licensed under a Creative Commons Attribution-Share Alike 3.0 United States License.
This seems like a reasonable estimate to me, and to put 22 BCF/day in perspective, the Texas RRC shows total 2010 annual gas production of about 20 BCF/day in Texas (gas wells + associated gas). So, based on Art's estimate, in round numbers we have to replace the equivalent of all Texas gas production every single year.
Note that there is a critical difference between early Seventies gas wells and current gas wells in Texas. In 1972, the average gas well in Texas produced about 900 MCF/day (M = 1,000). In 2010, the average gas well in Texas produced about 170 MCF/day. Oil production showed the same pattern, with the average oil well in Texas producing 21 bpd in 1972 and 6 bpd in 2010. This sharp decline in average production per well is probably indicative of what we are seeing in most of the Lower 48.
Appreciate a little understanding here.... with 2 largely underused LNG terminals at Cove Point and Everitt, why in the heck is some of the cheap natgas not being exported to Europe? Last piece I saw showed day price in UK 6 times higher than in US- surely all the LNG tankers are not in use( hauling to Japan and or China one presumes)? At what point will we see exports of LNG helping to soak up the current surplus?
snag - Don't know about those specific terminals but about 8 months ago an LNG load was shipped from the Chenier terminal at Sabine Pass, Texas to England. At the time domestic NG was selling around $4.50/mcf. I'm told the cost to compress and ship across the Atlantic was around $3/mcf. I think the load was sold in the UK for around $8.70/mcf. So if those numbers are close about $1/mcf profit was made...or around $1 million per bcf. And I sure what ever profit there might be was locked in before the tanker was loaded. I've assumed this was basicly a test run. I haven't heard of any additional shipments but I'm not really in that loop.
Yesterday the UK spot price hit 84p/therm. Unfortunately I do not know how that translates to $/mcf, but the price has averaged 55p/therm this last year.
Our cold spell will end in a few days, but we are still re-exporting imported LNG to Europe, which is still feeling very cold.
Ralph
10 Therms = 1 million BTU which means our gas peaked at around $13.27 per million BTU and averaged $8.69. If it was re-exported then I guess the Europeans found this cheaper than the eastern supplier.
On 1 Feb Bloomberg reported the Poles paying the reliable russkies $14.16 million BTU's. So I guess at that price re-export is very interesting if it can be landed in the UK at $8-10. It is worth remembering that even at $14.16 it is still "only" $85 per barrel oil equivalent. Room for higher prices yet methinks by the sneaky Russkies.
Funny old world.
What about shipping and compress/decompress costs?
JJ,
That might well be the fly in the ointment- both the Mass terminal and and Cove Point(MD) were designed for import- and I'd guess that perhaps the machinery required to decompress is not the same as compressing it for shipment.--anyone out there know if the machinery is same or unique to import purposes?
Very, very different. Think about it for a minute. LNG is a cryogenic liquid stored at about 25 kPa 93.6 psi) and -162 deg C.
To produce LNG is has to go through a number of step; contaminent removal, compression and then refigeration. It is fairly energy intensive.
At the import terminal the process is much easier. All of the energy removed in the liquefaction step has to be put back in as heat energy. The LNG is gassified with a heater.
So if you have an LNG receiving terminal it is not much use for exports unless you have the liquefaction equipment which sort of negates the purpose. Unless of course you wish to buy and trade LNG.
How did the LNG export to the UK happen. Most likely via swap deal in my opinion. If the LNG receiving terminal had a supply contract they might have had to take product in. If it can receive LNG it can probably export the product as well, with a bit of pipe mods.
"
If you are going to install the necessary iquefaction kit you will want to operate it., acording to the Rockman principles of "We are in it to make money". If it was a one off then my guess this was a bounce deal - in/ out.
Gassification terminals are easily 10x more expensive than regas facilities and also take many more years to build.
NG compression / regassification is a good illustration that in the real world investors care about return on investment, not on energy. A while back I did the numbers and IIRC compressing and chilling NG takes about 6-7% of the embedded energy in the gas and because some of the gas regassifies during transportation (it is a function of ambient temperature and distance shipped). With respect to the energy used to ship the gas, a 500k bbl crude carrier consumes about 2% of the embedded energy of the cargo on a round trip from the KSA to GOM. Then of course you need energy to regas the LNG so the total energy costs could be somewhere in the 10% range, not counting the energy embedded in all the hardware needed to accomplish all this. Yet financially it is profitable.
Rgds
WeekendPeak
The machinery is not the same. You need a liquifaction train which are expensive and time consuming to build. Cheniere is going to build one but it is not ready yet.
Also, I assume that the terminals you referenced are import terminals, designed to convert LNG back to a gas.
In any case, some perspective on US production and consumption. The following chart shows the ratio of annual consumption to production for US oil, natural gas and coal, from 1998 to 2010 (BP). The US, as of 2010, was a net natural gas importer, and note that BP shows that the US was briefly a net coal importer, for one year, around 2003. 1.0 on the chart marks the dividing line between net exporter and net importer status.
Snag,
Rockman has given you a partial answer except that U.S. shale gas supply cost is $6-8/mcf. So, if a buyer can only make a buck without the supply cost, how can the producers make any money? Also Rockman is not including all of the opex for liquefaction and transport.
The big problem for export of LNG to Europe long-term is that our competition (Qatar, Algeria, Norway) have much lower supply cost and transport cost.
It sounds like a great idea to get a higher price over there than over here but it's not that simple.
Do you have reason to believe the supply from those producer countries has either i) suddenly become uncommitted to its current consumers, or ii) production is increasing? Because otherwise they are not a problem for US exports, and US production is clearly increasing.
Art noted the curious disconnect between Texas RRC data and EIA data, which is a pattern we see elsewhere, e.g., EIA oil production data for Saudi Arabia versus BP data for 2010. In any case, RRC data show a decline of about 0.4 TCF in annual Texas gas production from 2009 to 2010, while the EIA showed a very slight decline, basically flat year over year.
Note that the EIA showed US dry natural gas production of 20.6 TCF in 2009 and 21.3 TCF in 2010. If we subtract out 0.4 TCF, it cuts the 2009 to 2010 US rate of increase from 3.3%/year to 1.4%/year. And then the question is, if we have a discrepancy between Texas RRC and EIA data, what about the rest of the country?
They are dredging Coos Bay to prepare for coal and LNG exports as we speak.
http://industrializedcyclistnotes.com/2012/02/06/exporting-coal-from-the...
Edit: Permits have been issued.
I'm reminded of a Saudi oil production chart I saw a while ago. Output volatile but roughly horizontal, overlaid with a rig count chart which was going up exponentially.
In other words the average output per well is going down expontially.
Sooner or later this will approach the minimum cost of said wells.
If the output rates per-well are distributed roughly normally, we can expect a fair chunk of these wells to cross the profitability threshold at roughly the same time.
This is bad, right?
It's certainly not a positive, and in effect it means that the net energy output per well is far lower, with a much higher decline rate, than what we saw in the early Seventies.
"Cash flow for those companies is $12 billion per quarter so there is a $10 billion quarterly cash flow deficit.....Without retained earnings, companies must borrow money or sell assets into joint venture agreements to raise cash in order to drill."
Those stats may confirm some of the rumors heard around Texas lately. Specifically about Chesapeake which may, or may not, stand as a proxy for other SG players. Essentially they have become limited in their borrowing capacity and have resorted to selling SG assets to fund their drilling programs. A recent deal had them selling 25% of the acreage in the Utica play to a Chinese company for a little over $2 billion. That, in itself, isn't a huge red flag: when you hold a position in a hot play lots of folks are willing to pay top $ for a piece. OTOH companies take exploratory risks usually sharing that risk with other companies. But once the value of the asset is identified you slide into a develop phase where you retain as much position as possible as your reserves are now "proven"
Chesapeake has also developed another bit of leverage in the SG plays many aren't aware of: a service provider. CHK has acquired a number of service companies, including drilling rigs. Regardless how one views the profitability, or lack thereof, in the SG plays, the service companies are making huge profits. They are the ones actually doing the drilling and frac'ng. Almost all of that $12 billion/quarter is going to them. When a drilling contractor is paid $2 million for his share of the cost to drill a well it matters not how much hydrocarbon is found or what it sells for....his profit is already fixed and won't change. His cash flow won't change as long as drilling activity doesn't change. By CHK utilizing several of the services companies they are essentially capturing a portion of their capex expenditures...and that of their partners also. In the Utica CHK will pay for 65% of the drilling costs with the Chinese company and another partner paying the balance. But the CHK service companies will be collecting 100% of the costs.
Few operators function this way today. Decades ago it was more common for companies, especially Big Oil, to own some of the subcontractors...but not anymore. An extreme example: Deep Water drilling in the GOM. I've been on drilling rigs where operations cost were running more than $1 million/day. And with dozens of subcontractors and perhaps as many as 150 souls onboard. And not one sub belonged to the operator. And perhaps not one hand is an employee: all subs or consultants. For the most part nearly all drilling, completing and frac'ng efforts are outsourced. IMHO CHK made a very wise strategic move. And ever more valuable as NG prices drop. As long as rig activity stays high CHK will benefit significantly.
CHK may also have found another way to keep their drilling activity up. The news of the sale of the Utica acreage only mentions the cash price. But no mention if there was a "promote" in the trade. I've traded many deals where my partners paid 100% of the drilling costs and received only 75% of the net revenue of a successful well. We call this a "third for a quarter deal". The exact terms are negotiable but most end up around this level. In addition, if my deal is very marketable I'll also be reimbursed for all my expenses such as seismic and lease costs. I've drilled many wells where I had zero exposure to losing money on a well. I don't know it for a fact but given the hype and desires of many late comers that want to buy in, I wouldn't be surprised if CHK (and some other players) haven't cut such deals.
One more point about the current economic value of the SG plays. As most know my company does not drill SG wells. They are not as profitable as our deep conventional NG prospects. The pubcos would be very happy chasing my prospects but there aren't enough of them to satisfy their reserve replacement requirements. But as NG prices have dropped we've cut this year's drilling budget by $40 million. Between ROR and risk they don't make the grade today. So you can draw your own conclusions: if we're cutting drilling due to poor economic value and my wells are truly more profitable than the SG players, why are they still drilling? There is one possible answer: we're privately owned...no stock movements to benefit from. CHK, in theory, could make zero profit from their future SG activity but still be rewarded with higher stock valuation by Wall Street as long as they continue to replace those rapidly declining reserves. A while back one of the big early SG players, Petrohawk, was rewarded with a $12 billion buyout of the company. At that point whether their current or future wells proved to be profitable they had already locked in their profit. And with the decline in NG prices I'm sure they are even more pleased with their sale than ever before. Just a WAG but if they were to sell the company they would get many $billions less. And the buyer? I'm sure they are not seeing the ROR they had used when they struck the purchase price.
I would also think that we are going to see some pretty drastic reserve writedowns, especially in the proven undeveloped category. Think of all these companies that have been showing areas between producing gas wells as proven undeveloped, and converting the gas to BOE on a six to one ratio. On a cash flow basis, the ratio this summer could be over fifty to one (global oil prices to one MMBTU, US natural gas).
Also, as Art has pointed out, a big contributor to excess drilling has been the fact that companies can't afford to get off the shale gas treadmill. Because of the high decline rates, if they slow down or stop drilling, they are looking at massive declines in proven reserves. But many companies will be forced to slow or stop their drilling, which will contribute to the large writedowns in proven reserves.
And they were thinking about moving transportation to this stuff?? They're building ports for exports?? Whose Idea was that? The Chinese?? Wasn't it all a bit irresponsible, greedy and short-sighted?
Ah, well, here comes another price shock and burst bubble. When will we learn??
Finally, how much closer would we be to energy independence if all that 88 billion per year invested were in wind and solar, second gen biofuel, smart grid, and vehicle to grid?
What was it Ruppert said?
"...shale gas scares me to death and suggests a desperation level I wasn't sure we had reached yet." Michael C Ruppert
Bumper sticker in Texas. "Dear Lord, Give Us Just One More Boom, We Promise Not To Screw It Up This Time".
We aren't ever going to learn because boom and bust is part of the business.
And do you really want to use Ruppert quotes to establish credibility on a topic? Any topic?
"While I had serious doubts about America's ability to recover from Katrina, I am certain that - barring divine intervention - the United States is finished; not only as a superpower, but possibly even as a single, unified nation with the arrival of Hurricane Rita."
MCR, September 15, 2005.
Robert,
Just which second generation biofuel were you thinking off. Cellulosic ethanol? Algae? How much has already been blown on this dead end already?
Go back a few posts and pick up on the so-called renewables discussion. It is no better, in fact it is worse. The hype is driving the value of some these companies into the stratosphere and there is nothing, absolutely nothing, to show for it.
Do your homework.
Excellent article, Art. As one with a vested interest in the shale gas industry, I can only hope that over-supply will work off in the next couple of years and prices rise to a reasonable level to see shale drilling occur where the good rock lies. I don't know what it'll take, I suppose something between $4 and $7, but I sure hope it happens sooner than many are saying, I'm not getting any younger!
uhoh - I feel your pain, brother. LOL. Unfortunately I don't see prices rebounding very fast. Not just because of the new SG plays but also US economic activity. If we are slipping back towards another recession it won't bode well for the demand side of the equation. Even worse expectations: a couple of weeks ago Bloomberg projected that if supplies and demand don't change much in the coming months we could see 100% of NG storage full by July. IOW the only NG being sold by late summer will be directly to end users...and they don't burn much during the summer. Thus their prediction: $2/mcf or less by the end of summer. We've already cut our NG sales back but many companies can't take that drop in cash flow. Fortunately we can.
How will new NG electrical generation change things going forward. Old coal plants are being replaced by gas plants which should increase demand, especially during the summer cooling season:
http://www.naturalgas.org/overview/uses_eletrical.asp
Source: EIA Annual Energy Outlook 2010
Looking at the chart, the projected increases for natural gas after 2021 seem overly optimistic, IMO.
Somebody check the math on this for me, please, as I'm a bit hazy at the moment:
1GW/h= ~3,410,000,000btu = ~3,410mcf (1mcf = ~1,000,000btu)
Combined cycle gas plant efficiency= ~50% thus ~6,410mcf of NG is needed per GW/h x ~100GW = ~641,000mcf/h
Figure a capacity factor of 70% for those plants so 16.8 x 641,000mcf/h = 10,768,800mcf x 365 = ~3,930,612,000mcf
Or ~3.9tcf/year in additional demand from natural gas fired power plants. Seems like it's in the ballpark to me. Sorry for the sloppy math. Long day.
Replace oil with NG.... lol. Rough math again but doesn't the household sector use something like 4.7tcf/year? That equates to..... about 2.1mbpd? So if every household stopped using NG entirely we could replace about 22% of our imports.
I have read a few well-regarded gurus stating that they expect a large oil price spike in 2012-2013, to, say, $150-$200 a barrel. Anyone got an opinion... if that were to happen... would you expect nat gas to also rise? Would you expect the rise to last, say, six months or more? Wow, if we could just get a few months of a spike, I'd like to try to sell out in a heartbeat before it drops again! The old bird-in-the-hand scenario. Hate to sell nat gas at these depressed prices. Maybe I can find some Chinaman with lots of money.
There is very little ability to substitute natural gas for oil since there are very few vehicles that can utilize natural gas and for the most part we don't use oil to generate electricity anymore. Therefore, I would not expect an oil spike to have much impact on the price of natural gas. If anything, a spike in oil prices would put us back into a recession thereby further reducing the demand for natural gas. That would cause natural gas prices to drop even further. Well that's my forecast -- just keep in mind that it may only be worth what you are paying for it, namely nothing!
Any oil price shock prior to the US presidential election this year could be mitigated by a release from the Strategic Petroleum Reserve. President Obama showed his willingness to use it last summer.
His use of releasing from SPR didn't work though, right? I don't remember oil prices falling much, at all.
Where might they have been if there was no release? Risen?
NAOM
Per the EIA the total release was 30.591 Million barrels. About 2 days of US demand.
I would suspect it had no impact on import prices as it was less than 12 hours of world demand. The release was in the month of Aug 2011
Crude spot held above $100 from the end of Feb to the middle of May; then started falling and Held in the 80's or higher the rest of the year. Prices were on an up swing by the middle of Aug. The release can likely never be replaced at twice the price.
http://www.eia.gov/dnav/pet/hist/LeafHandler.ashx?n=PET&s=RWTC&f=D
http://www.eia.gov/dnav/pet/hist/LeafHandler.ashx?n=PET&s=WCSSTUS1&f=W
If we assume that the President a) is not an idiot, b) doesn't want to look like one, and c) puts some effort into researching claims for the State of the Union... what should we conclude?
That he's deliberately making misleading claims and expects to be able to deal with the fallout? It worked for WMD.
I'll be more charitable and suggest that he simply believes the problem won't become obvious until after he's left office, so some other guy will look bad.
Makes you wonder what the real energy policy is, doesn't it?
Spraff,
The President is not an idiot but he gets his information from aides who know little about the energy business (he didn't write his speech either). There has been a concerted propaganda campaign by natural gas "outreach" organizations (ANGA, etc.) to promote a positive message that is easy to remember. If "100 years of natural gas" is said enough, people assume it is correct. How often do most people, including White House staff, decide to check the details and do the arithmetic?
Art
I believe that the President is quite aware of at least the issues associated with oil supply. When he was a candidate and was on Meet the Press, the late Tim Russert asked him (crude oil prices were rising) if he were president, would he release crude oil from the strategic petroleum reserve. He replied "no, because what happens when the price of gasoline is 8 dollars a gallon." Tim Russert was clearly confused by his response, but Obama spoke with certainty.
Obama has had EPA put in place new fuel economy standards for both light and heavy duty vehicles which will force the motor vehicle fleet to much lower fuel consumption. The most recent set of proposed standards, when finalized, would apply from 2017 to 2025 - a serious attempt to affect long term consumption. Yes, one reason for doing this is for climate change, but I am pretty sure that crude oil supply is another, and probalby as least as important issue in his mind. Of course, at this point rising crude oil prices may force vehicle fuel economy to increase faster than what the standards would otherwise require, but at least he has had the will to do what other presidents were not willing to do.
I have not heard any statements by him which would reflect any specific knowledge that he may possess on natural gas, but the State of the Union speech cannot be used to understand his positions since State of the Union addresses are mostly made for political purposes.
You don't have to go looking for shadows that aren't there.
Unless someone changes his mind, that is the energy policy.
That's what makes it so sad.
Interesting, did you even consider for one second that Arthur Berman has it all wrong? There are plenty of people that think he is simply wrong on the issue, perhaps the President is listening to his own Geolgoy Experts who state in fact that there is at least a 100 year supply of Natural Gas. Here's just a few examples of literature critical of Mr. Bermans position:
http://info.drillinginfo.com/how-arthur-berman-could-be-very-wrong/
http://junkscience.com/2011/12/31/peak-shale-gas/
http://www.facebook.com/note.php?note_id=10150305143547565
I think that a point that a lot of people are missing is that it is certainly possible, for a while, to show aggregate increasing production, from a group of wells that individually have very high decline rates. A good case history is the DFW Airport Lease, in the Barnett Shale play. The operator drilled about 100 wells. They predicted cumulative production of about 4 BCF per well, with cumulative lease production of one TCF. It looks like the actual cumulative production may be around one BCF per well, with cumulative lease production of about 0.1 TCF. The kicker is that the last data I looked at suggested an accelerating decline rate.
I have noticed, in the panel discussions I've witnessed with Art versus an industry cheerleader, the general tendency is for Art to show his work and the numbers regarding specific case histories, while the industry cheerleaders tend to respond with hand waving and borderline ad hominem attacks.
In any case, I'm reminded of the handful of analysts who warned, prior to 2008, about the financial crunch coming, and they were widely derided too, at least initially, e.g., Meredith Whitney, who received death threats, because of her prescient call regarding Citibank.
Not exactly an unbiased source:
http://en.wikipedia.org/wiki/Junkscience.com
I'm reminded once again of the Upton Sinclair quote: "It is difficult to get a man to understand something when his salary depends on his not understanding it."
Interesting....how the specifics of this quote works is apparently verboten. Or hits too close to home, perhaps?
This is one of the rare instances when you'll find me "attacking the messenger". Two of your links, Drillinginfo and the youtube link are both provided courtesy of the fossil fuel industry; hardly impartial, and as for Junk Science:
http://en.wikipedia.org/wiki/Steven_Milloy
Milloy and his baby "Junk Science" are propaganda arms of the likes of the Koch Brothers and Fox News, nothing more, which begs the question, CornyGuy, what is your connection to these folks? Your sources are increasingly questionable, IMO. Junk Science should be renamed "Junk Info". Their agenda is transparently pro-growth rather than pro-clarity.
Can you say "Market Manipulation"? Betcha can...
Rare or not, attacking the messenger is fallacious and used here apparently to derail a valid question. Are these statements about Berman's Haynesville calls correct or not?
Again from above, showing Haynesville's ~6 BCF/day:
http://www.theoildrum.com/files/After%20The%20Gold%20Rush_Page_18_01.jpg
If your criticism is that I modify my observations when new data comes to light, I will gladly be guilty every time!
Have you read the recent three-part series in Oil and Gas Journal by Wright and Yu (LSU) on the Hayesville Shale? It's the most thorough publicly available document that I've seen and full of tables and graphs. Their conclusion: average well EUR is 3 bcf (same as ours). Only P10 wells in the best of 3 separate probabilistic scenarios (that include prices of $10/mcf) break even. Here is the part that was just published this week, but I think you have to subscribe to get it: http://www.ogj.com/content/ogj/en/articles/print/vol-110/issue-2/explora...
ITG just published a report this week on the Haynesville Shale. They are slightly more optimistic: 4 bcf/well. They say the field decline rate is 53%. This one is subscription also but here is their site: http://energy.itginvestmentresearch.com/main/index.php?q=content/about-itg
Don't be confused by big volumes. That is no indication that anyone is making money.
Rather than judge my observations vs. production volumes or the opinions of those with vested interests, read what real researchers find, i.e. researchers who sell their research or do it for academia and not for a sell-side brokerage.
Art
You might need to clean up 2 things at the bottom of the post. You say that shale gas is only 3% of production, when it seems to be 30%. Then the graph of total US production is labeled "Daily", but the figures (~1500 bcf) look like monthly.
That 3% figure threw me too--I came to think it was referring gas that was produced in association with shale oil fields in the Bakken and such, but I was never sure. It could be a typo for 30% but then the whole statement falls apart as 30% of production certainly could be the cause of over supply.
Approximately 3% of total U.S. gas supply is from shale associated gas so, while this is a factor, it is not the cause of over-supply.
63% of the gas comes from the top six producing state/regions charted (TX, LA, WY, OK, OCS & NM). Shale gas plays must make up the lion's share of the remaining 37%. Art must be referring to something else.
I hope that Art will clear this up, it's important!
Associated gas is gas produced from oil intent wells (shale or otherwise). Different from gas produced from gas intent wells (shale or otherwise).
It isn't fallacious to invalidate a question (assertion, really) supported entirely by highly questionable sources; it's expeditious,, especially in the context of the President's meaningless "100 years of natural gas" statement, which the thread was based on.
Corny,
"Virtually every credible third-party expert" also failed to predict
People come to TOD to hear intelligent voices from outside the herd.
Jon
Corny - let me jump into this cat fight and make some technical clarifications. " It is also ludicrous to allege that shale gas wells are underperforming as we sit awash in natural gas". How much oil/NG a well produces in absolute terms has no bearing on whether the oil patch calls it under or over performing. Same thing with an entire trend. If my well is making 1,000 bopd it is definitely underperforming if I drilled it on the expectation of making 5,000 bopd. And if I'm making 100 bopd from a well I had drilled expecting to make 25 bopd it has greatly out performed. Others may well have a different definition of the term but this is how the oil patch defines it.
"...CHK and other shale gas producers are routinely beating our production forecast...". That's even easier to explain: you are poor when it comes to forecasting. But don't take that as a slam. So have almost everyone I worked with in the oil patch for the last 36 years. Westexas: how many times have you drilled a well that underperformed to some degree? Go ahead...lift your skirt and fess up and I'll do likewise. LOL. Part of the evaluation of every drilling project is forecasting the amount of reserves to be expected as well as the expected flow rate. Rarely do the actual numbers exceed expectations. And the vast majority of the time they fail to meet expectations closely...or at all. A month ago I finished drilling a well which we had forecast would develop about $70 million worth of oil/NG. Our forecast missed a little. It was a dry hole = $0 oil/NG.
Again, read what westexas says about the CHK wells at the Dallas-FW airport. Those wells greatly underperformed CHK's projections. But that's not to say they didn't produce a lot of oil/NG nor that the effort wasn't profitable. But, by CHK's own admission they have greatly underperformed: CHK said they expected X bcf and they will ultimately make a significant amount less than X bcf. That is the definition of an underperforming field. It might not be your definition but it is for the oil patch. You don't have to use our terminology but if you're going to interject your own than you need to share your definition. At the moment it sounds as though you and westexas are mixing apple and oranges. Again, an underperforming well doesn't mean it isn't making a lot of oil/NG or isn't going to be profitable. It just means it isn't performing as anticipated. Additionally, you need to make a distinction between what is underperforming. Is it the volume of oil/NG produced or the economic return? I may project a well to make 10 bcf and it actually produces 12 bcf: it over performed my expectation. But if I had done my economic model based on getting $6.50/mcf and I end up selling the bulk of the NG at $4/mcf then the well has greatly underperformed...on an economic level.
And about that "100 year supply of natural gas". That statement, by itself, is obviously meaningless. What will be the supply requirements in a hundred years? What are going to be the supply requirements during that 100 year run? If in 100 years we only require 30% of the NG the world requires today we may have several hundred years of supply out there waiting for us. Or if oil becomes increasing difficult to acquire and NG demand booms we might have only 30 years of supply. Or if NG consumption soars along with prices we may have 100 years of supply because we can drill many low performing wells since they'll over perform on an economic level. IOW one can argue that "100 year supply of natural gas" is either a valid expectation or ridiculous depending upon the assumptions one makes. And that's why I say it's a meaningless statement without the qualifiers attached.
Rockman, you give me great insight into how things are done in 'the patch' - thank-you. That said, I've given Obama's statement a little thought - and concluded that he could very well be right - that we have 100 years of NG when it's to be all gone - game over. Not a bad estimate, in that regard, don't you think?
The way I look at things in my oil field is where I'm at after I have got back the money I spent doing whatever. This is called "After Payout" APO. eg: frack an old half barrel per day (no typo) well, it comes back at 5 bbl/d, is declining, but I get my money back but in the end APO I'm right back at that 1/2 bbl/d - well SFP. Better - frack same 1/2 bbl/d well, comes back at 3 bbl/d and APO I'm at 2bbl/d -YEAH - beers on me. Simplistic I know but it works for me.
Gig Em
PS - We don't talk much about the ones we frac where we kill all production. It happens
Well, as I have said in this thread, I have a vested interest in shale gas. So, I want to know the truth, my livelihood is at stake. And, while many in the industry were claiming Art Berman is off his rocker, I was looking at, specifically, Haynesville shale production. And guess what! It was just as Art said. Mind you, there are some very fine Haynesville wells. But there are a ton of crappy wells. In fact, my take on it is that a very large percentage of all Haynesville wells drilled thus far will not pay out. The majority of Haynesville wells are NOT in a sweet spot. The sweet spots are, indeed, sweet, but huge areas are not profitable. I hope they can figure out ways to improve production and EUR, and I hope gas prices will get back to, say, $7/mcf in my lifetime! There's some good stuff in those sweet spots but unless they can figure out how to boost EUR in the poorer performing areas, there are going to be a ton of sad mineral owners in the Haynesville play.
As for the naysayers, we have to look at every source and figure out if they have an agenda. What is their angle, why would they want to shoot Art Berman down? I remember reading his reports as he'd publish them and people would be saying he's wrong about this and that and I'm shaking my head, saying, nope, he's dead on, check it yourself! I'd say, "Okay, refute him." And they didn't. He's not perfect, nobody is but I think he's way more right than wrong. He puts on some really good reports.
I think that one of Art's points has been that these shale plays are more analogous to conventional plays than many of the shale promoters would like to admit.
That would depend on how you differentiate between sweet spots (versus non sweet spots) and conventional accumulations. Sweet spots in resource plays are just better than non sweet spots, but non sweet spots aren't necessarily bad, they are just not as productive. So if you define continuous versus conventional accumulations by economics, then sure, you can confuse the two. But a discrete trap, with a water leg and where buoyancy works, versus a blanket accumulation (the only difference being more productive wells versus less productive ones) isn't an economic filter, is a geologic distinction. Dumping economics into the mix just confuses the issue.
Let's apply our critical thinking skills.
It is ... ludicrous to allege
OK, we start off with incredulity, suggesting that the whole thing will be an argument from incredulity - "I can't believe it, therefore it's wrong."
that share gas wells are underperforming
So, mischaracterization of what Art said: creation of a straw man. Wells are doing fine, it's the companies that are in trouble. In their game of musical chairs the music is still playing, but the chairs are being taken away.
CHK and others are beating their production forecasts
Anecdotes about individuals used to try to refute the straw man.
surge ... record highs ... passed Russia
An argument relying on the previous mischaracterization.
illogical [that] ... wells are underperforming, yet ... prices are less than half ...
Ridicule and more straw. But acknowledgement of a key support of Art's argument, that prices are low.
shale gas production represents 25%, if ... underperforming, how come gas prices are so low when ... demand at a record
More straw, appeal to irrelevant facts.
The entire second paragraph is an appeal to authority about an irrelevancy.
So this 'refutation' is an argument from incredulity about a straw man, supported by anecdote and irrelevancy, coupled with a bogus appeal to authority.
To properly refute Art's argument, the writer needs to present shale gas companies' statements of cash flows (sources and application of funds statements) for the last few years, and their forecasts for the next few.
If most companies are financing operations from retained earnings (or could do so, but are generously choosing to share the wealth with Wall Street), Art's argument collapses. Otherwise, not.
So a leftward shift in demand due to contracting real economic activity creates a supply surplus.... and all the sudden shale gas is the bees knees?
This doesn't take a rocket scientist to figure out. All one needs is a little pre-calc, the ability to visualize curves, and a few "parameters" for the function:
1. the low hanging fruit is produced first (think discreet fields: the largest/best fields are produced first)
2. decline rates are very high (~50%/anum). Presumably higher hanging fruit will have higher decline rates
3. production is dependent on drill rate and the quality of the resource drilled.
Now, play with the drill rate. If you hold your drill rate constant and you produce lower quality fields as time goes on your production will fall. If you increase your drill rate at the right rate than your production will remain flat (note: drill rate will be exponential). If you drill enough (we're talking a lot) you can raise production.
spraff - "he simply believes the problem won't become obvious until after he's left office". And hasn't that been the problem with US energy policy for decades? And I'm not just laying on our self-serving politicians. The oil patch has been just as guilty focusing on short term goals. And so has the public for that matter. Consider how every politican fears raising motor fuel taxes. Folks joke about Social Security being the 3rd rail of politics: touch it and die. But the same could be said about hydrocarbon consumption taxes.
Basicly we are exactly where we should be given the choices made by the oil patch, the govt and the general public. As been often said: be careful for what you wish for...you might get it.
Could one basis for longer term optimism about Shale Gas be the huge geographical areas contained within the various regions? If the shale formations are mostly continuous in regions like the Marcellus/Utica, then it seems that the potential must be massive (given high enough prices). And with just the right dose of news, price levels can reverse course overnight in the oil and gas market.
josser - Exactly. That's what has drawn the pubcos in. We call such trends "cookie cutters" because you can keep knocking out new drill sites just like cutting out cookies from a big sheet of dough. But that isn't to say each well will perform the same. Every trend has sweet spots with better than average wells and hell holes where you can't make a $1 profit no matter how hard you try.
And that brings up a point I think many folks don't appreciate about conventional vs. unconventional plays like these shale reservoirs. I can drill a 15,000' well for $6 million targeting a conventional reservoir. I get the well down and log it: run electronic tools down the hole to tell me what's there. If I have commercial pay I'll spend another $3 million to complete it and put it on line. But in most unconventional plays like the Eagle Ford or Marcellus you can 't tell how good a well will do after you drill it. I can spend the same $6 million drilling an EF well but I have to spend that next $3 million (or a lot more) to complete and frac it before I know how good it will be. You can get some subtle hints as to productivity but rarely enough to be certain. So I spend a total of $9 million (or a lot more) on my EF well before know how much it will produce. It might make me 5 times what I spent to get it get it on line. Or maybe only produce half of what it cost me. In essence almost no one drills a dry hole in any SG play: almost every well is completed. Whether every well makes a profit or not is another matter.
Back to your point: as long as the economics are adequate and there are undrilled locations the SG boom will continue. Until there are no more locations to drill, of course. Folks who think the SG plays will supply with all our NG needs for the next XXX years need to look at some maps and how many wells are being drilled every year. Many years ago one of the hottest plays in the country was the Austin Chalk...kinda like a shale gas play except the rock was made of limestone mud and not clay mineral mud. But the reservoir dynamics were exactly the same: you lived and died by fracture production. Horizontal wells also became the primary tool in developin5g the Austin Chalk. If you look at the trend you'll see thousands of hz wells typically drilled NW-SE. But today you'll will find very few wells drilling in the AC compared to the boom: all the locations most folks thought were viable have been drilled. Eventually (and I haven't tried to make an estimate) all the locations in the Eagle Ford, Marcellus, etc will be drilled up. Maybe 20 years...maybe 100 years. I won't even toss out a WAG. But there is one inescapable fact: all oil/NG producing trends have a finite number of potential wells to drill in it. And when most of those locations have been drilled you need to find another trend.
And if it hasn't become clear: that's exactly why the SG and other unconventional trends are the focus of so many companies today: there are very few wells left to be drilled in the conventional trends in the US. Certainly not enough to support all the companies in the oil patch today IMHO. Just as sometime in the future there will be an insufficient number of unconventional wells left to drill.
U.S. gaining energy independence
The United States is the closest it has been in almost 20 years to achieving energy self-sufficiency, a goal the nation has been pursuing since the 1973 Arab oil embargo triggered a recession and led to lines at gasoline stations.
http://seattletimes.nwsource.com/html/nationworld/2017449438_energyindep...
Haven't heard that 81 percent number before, presumably that is all energy sources. After 30 or so paragraphs of gee-whiz cheerleading and extreme optimism we get this bit at the very end:
Oops! Perhaps the headline should have read "Gas Glut Sends False Price Signal, Destroys Energy Diversity"
Cheers,
Jerry
According to this article the figure in 2009 was around 74% domestic vs. 26% imports:
No mention of how much was embodied in imported goods as we've offshored more of our industrial production/manufacturing. Reduced consumption due to the poor economy is also a big chunk.
And Energy Independence only occurs when one is no longer dependent on energy--Dead.
From the article:
???
EIA crude production data is on a 4-5 month lag.
http://www.eia.gov/dnav/pet/hist/LeafHandler.ashx?n=pet&s=mcrfpnd2&f=m
There is also natural gas production available through November, 2011 for the major gas drilling states, and for the remainder in total. For example, this is for Texas.
http://www.eia.gov/dnav/ng/ng_prod_sum_dcu_stx_m.htm
Use the menu at the top to select other states.
Good article Art
The discrepency between EIA marketed Texas production and the RRC's production numbers are interesting. Texas had a long hot summer going into fall...maybe some storage gas in the state got burned/marketed...a quick glance at the EIA weekly gas storage curve looks like it lagged beginning of this period (at the intercept of the curves,your chart) but its hard to see with my old eyes. EIA's Model of using just 12 gas producers seems to me a bit broken. I was looking at Texas RRC gas data a few years ago and noted that RRC figures always were revised up over the prior few months, probably due to late reports filed by the little guys. Anyway. Good job.
POd,
Good and interesting observation about Texas production vs EIA and a hot summer. Still, it's a problem that EIA won't even acknowledge.
Thanks,
Art
It seems to me that there is a good chance that quite at least part of the problem is low RRC data on recent months. I notice that the Texas data from HPDI in Exhibit 12 does not suddenly trend downward at the end either.
Exhibit 12 shows that vertical wells are being discontinued and horizontal wells added. I wonder if there is some delay in getting the new data in.
XOM isn't trimming production, it appears they are trying to force others into bankruptcy. Looks like we have enough companies trimming production to get prices back up, though. I don't see this bust cycle lasting very long unless the wheels come off the economy.
Progress Energy to shut in natural gas production
One reads so much about markets being driven by public perception (by the speculators), it makes me wonder... what if the majority of oil/gas companies announced that they are shutting in x-percent of gas wells and curtailing x-percent of gas drilling... it would seem that price should go up... on nothing more than their perception of what is going to happen. Haha, I guess I wish it were that easy.
I have been following the NG industry with great fascination. In my view, the industry is in a similar situation as the dot.com industry around 2000. Everyone was losing money, but they realized that the last man standing would reap a huge reward. Amazon.com comes to mind -- lost big money for a long time, now they hold an unassailable position.
I think the NG drillers are hoping for something similar -- stay alive during the inevitable shake out and whoever is left will ride a wave of increasing NG prices. That's what they HOPE for, in my opinion, but it's entirely possible that prices will be suppressed long enough to severely injure all of them.
If we see $2 NG this summer, blood will run in the streets.
I would not be surprised to see NG rig count drop to 600 or less over the next six months. I don't see how that few rigs could come anywhere near replacing 22bcfd depletion on a sustained basis. As late of Feb 2011, there were 916 rigs committed to NG drilling. Rockman, do you have any take on that?
Let me piggy-back your question to Rockman with one of mine:
Do SG wells have a shelf-life? If you temporarily shut down production, will you lose any of the remaining gas for future production?
joel/Hank - It takes a while for a drilling slow up to materialize. Often rigs are contracted forward for a number of wells so a company typically can't stop drilling in just a week or two. How that drilling pull back will effect replacement volumes is difficult to quantify given the time lags. And folks need to remember that even though the wells have high decline rates they do settle down somewhat at those low volumes...and there are many thousands of them. So they do establish something of a slightly steady base. But operators do have the option to take some drastic (and expensive) steps to stop the bleeding. When I was on contract with Devon back in the '08 shale gas bust they had 18 rigs drilling in the Haynesville in E Texas. When NG prices collapsed they cancelled the contracts for 14 of those drill rigs. And paid a $40 million penalty to the drilling companies. Yep...paid $40 million to NOT drill. This happened at a time when NG was selling for twice what it is today. What does that infer about current SG economics?
NG wells, especially in the pressure depletion drive shale reservoirs, typically wouldn't be hurt by cutting back or completely shutting in. But most leases require some production otherwise the lease expires and the operator losses the well. But often an operator can produce a well just 1 day a month and retain their HBP status (Held By Production). We're in the process of cutting back rates on some of our conventional NG wells. We don't need the operating cash flow to carry on. Especially since we just cut $40 million from this year's budget for our conventional NG drilling program. But many companies can't take the reduced income. Though it might look good on paper to preserve your reserves until prices rebound, many in the oil patch can't cut production and keep the lights on. In fact, often a company will try to squeeze a little more out faster to offset the loss of income from lower prices.
And the pubcos have their own problem. They have to keep drilling to keep replacing reserves to keep their stock price up. But many are very dependent on operational cash flow to pay for the new wells. In an earlier post I mentioned how Chesapeake has been selling assets in the SG plays. I suspect a major factor in that decision was the need to generate more capex for additional drilling. A rather nasty path: sell assets to pay for wells that won't generate sufficient income to drill more wells. There's obviously some limit to how long you can play that accounting game. No idea when that will happen but I suspect it's not too far away. Especially if NG drops below $2/mcf by late summer as some are now predicting.
Rock: So you expect prices will get better? In a bust or glut of natural gas demand slowly increases as people expect low prices forever and once plant and equipment is built from LNG terminals to gas fired power stations it sets a relatively higher floor on total demand and many of these projects will pay even 3* more than the current prices willingly because it is still better than shutting down?
S - You want me to predict NG prices??? My momma didn't raise no fools. Well, actually she did but I'll leave my siblings out of this.
IMHO prices will get better...they always do. But when? I think it will take a year or more before we see any upward trend that will look like it's going to last. I'm thinking more along the lines of how much worse it will get...like $2/mcf by this August. Historically oil/NG prices spike and drop. But it typically takes years for the cycles to manifest. You always have a certain number of hands in the oil patch saying: "Just wait...a few more months and it will turn around". And nothing ever changes in just a few months in the oilbiz with the exception of people's expectations of situations changing IMHO.
That attempt at analogy is the better analogy to what's going on here.
There were indeed many no-plan dot com startups that simply burned through investment money and folded without making a dime. But many firms, probably most, including dot com majors - like Amazon, Google, eBay - were already making a lot of money in 2000. They were all overvalued in the market place, but they were not loosing money.
The dot com history is perhaps relevant to the gas boom in another way. One does not need to know the history of the dot com era to roughly judge over all profitability, but can simply look at this vast machine called the 'internet', the entire world of commerce that now flows over it, and then know better than to say "Everyone" lost money on its creation. So too the current flood of shale gas. Post acquisitions Exxon Mobile is the largest gas player. Does anyone really think Exxon is simply dumb and losing money?
This is a way for Exxon to book reserves, and keep stock prices up.
There are not many ways of acquiring reserves these days, if you have noticed.
The play is less important than it appears.
It possible that XOM bet that ng prices would be much higher than they are -- "everybody" thought that a couple of years ago. With energy prices being volatile and supply/demand picture of oil uncertain, no company can make intelligent decisions. By the end of 2012, there is going to be a graveyard of shippers who expanded capacity during the 2007-2008 boom. Then there is going to be a graveyard of ship builders. Companies don't have a crystal ball that works any better than mine and probably have much more optimistic outlooks which could be completely wrong.
Please resize the images in the main article or create hyperlinked thumbnail images. You have direct linked to many images that are above 12 million pixels. This page has my memory cache overloaded between 800 MB and 900 MB while my RAM is a mere 512 MB. Consequently, this page is incredibly slow to navigate.
I see that the American Public Power Association (APPA) included a link to this post in their client workroom e-mail today. It's for APPA members only but it's a national mailing list. I think that's a big deal. Congrats, Mr. Berman.
Art,
I have been avidly following your posts for some time. I am in agreement with your premises and conclusions...
Exhibit 5 does not make any sense to me.... how does this convey that the number of wells have increased by 100% over the past year? I also cannot reconcile any of the numbers in the text with those on the graph (e.g. cululmative production)
Is it possible that the graph is not for the Barnett??
Thx....
how does this convey that the number of wells have increased by 100% over the past year?
could you pull that piece of text and paste it in a comment down here? My old eyes can't find it skimming back through the article?
yours is the first comment on the accuracy of the graphs so I'd like to follow it.
Thx...
Its embedded in the yellow box in the figure...
And for the record, I am not implying Art is being disingenuous... but I cannot make heads or tails out the numbers for the Barnett....
Thx
I had only looked at the telltale lines and not any of the yellow boxes, they were hidden in plain sight to me.
flak - I'm going to make a guess: the 110% is a typo. The chart seems to be showing an increase in well count of around 1,400 which would be more like 10%. Even at 10% I'm impressed. I don't follow the Barnett so I would have guessed fewer wells. One reason for it hanging in there is the expansive NG gathering system that has developed in the trend over there years. More than once I've not drilled a well because the added cost to run a long pipeline killed the economics.
But as you offer it may not be the Barnett.
I also cannot reconcile other numbers having to do with production rates...
Nonetheless, 10% or 100%, it does give lie to the "Drill Baby Drill" argument...
looks like production per month on the left axis cause 5.7 * 31 is about 180.
Flak,
Yeah, it's an error. I'll fix the text. Not sure what happened there. Sorry.
Art
Thanks! keep up with the great work!
According to Wikipedia, the USGS (US Geological Survey?) considers the energy in a barrel of crude oil to be equal to that in about 6,000 cu. ft. of natural gas. Is it possible, therefore, that natural gas at $2.50 per thousand cubic feet is priced at the equivalent of a barrel of crude oil at $15?
This seems very low.
Red - That 6:1 ratio is as good as any IMHO. The BTU of NG and oil varies a good bit with the exact composition. For instance one NG might have a BTU 30% higher than another.
This is the complaint some folks have when someone does a "boe" (bbl of oil equivalent) calculation. First, one can have a reserve that's predominantly NG (both volumetric and monetary) and make it look like oil reserves. For example a 100 bcf NG field with no oil in it could be referred to as 16.6 million boe field. The 100 bcf field would be worth about $280 million gross in my market but 16.6 million bo is worth about $1.8 billion. So if you wanted to equate NG to oil on a monetary level the ratio in my market it would be $108/$2.80 or 38:1.
Amazingly low, and has been trending that way for about 2 years now. GTL starting to look awful good.
Yes... but a 500,000 bpd facility would roughly consume 5% of current production (assuming I haven't screwed my math up) and what do you think would happen to the price of a mCF of NG then???
Dollars to doughnuts,the BTU arbitrage would vanish...
It requires 10 mcf to make 1 barrel of syncrude. So you use up $30 in feedstock to create $100 in product. Sounds like a possible money maker to me, to heck with how ridiculously energy wasteful it is. Works even better if it is stranded natural gas and has next to no value anyway.
The economics of it are far better than you think. It only requires about 1.5 mcf of natural gas to extract 1 barrel of bitumen and upgrade it to syncrude (including generating electricity for the plant), and the cost of NG is currently only about $2/mcf in Northern Alberta, so it actually only costs about $3 in NG to produce $100 worth of syncrude.
Under normal circumstances, if NG was priced the same as oil on an energy-equivalent basis, it would take $25 worth of NG to produce $100 worth of oil, but at this point in time the economics of producing oil sands are much better than normal because of the low price of NG and the high price of oil.
Rocky,
I think you're answering the wrong question - the question above was about a straight gas-to-liquids synfuels process, if I'm reading it right.
A couple of points. Syncrude is not GTL. It is the conversion of bitumen innto a synthetic crude oil that can be procsesed ina conventional refinery. Rockman, as usual is spot on. The heating value of NG can vary according to other compoents which can be CO2, nitrogen, and others. CO2 is normally removed. However the generally accepted view is that 1 boe = 6000 cu ft. A list of conversion factors is available in the BP statistical review for those interested.
I looked up the Shell MDS Process in Myers Handbook of Petroleum Processing 3rd Edition, to make sure my comments are correct.
Essentially the process consists of thermal catalystic reforming of NG to produce syngas to which further hydrogen is added from a NG hydrogen manufacturing unit. THe syngas is then converted in heavy paraffin synthesis step (HPS) to distillate range products Myers quote the thermal efficiency of this process as 78% theoretical and an actual of 63%. i.e 37% of the NG is consummed, and carbon efficincy is 78-82% (retained carbon). Actually it is quite a bit more complicated than that but this is the nuts and bolts.
Personally I do not see a mad rush to build these plants as the capital cost is of the order of 4X to cost of a conventional refinery. The product quality is excellent in the middle distillate range but the gasoline range products have low octane numbers ( around 80 RON)and would require further processing.
Look at the facts to date. Low cost NG producers have so far preferred to build ammonia , methanol and LNG as opposed to GTL. The largest GTL plants are all in Qatar and the largest, Shell Pearl, has a capacity of 154 kbd liquid products and cost over $20 billion to build. I will concede that it also included a NGL unit but this is one hell of a cost. Moreover the rumour is that Shell got the gas free for 10 years to cover the costs. It is also worth noting that Exxon abandoned their proposed GTL facility in Qatar, for reasons not entirely clear. It would seem that Americans are not alone in dishing out pork.
carnor - Over 35 years ago Mobil Oil built a GTL plant in New Zealand. If my fading memory isn't failing me they were actually converting to gasoline (diesel?). They had recently developed a catalist that greatly aided the process. OTOH I think they got the NG nearly free from the govt since it was a pilot project. NZ had a lot of NG compared to consumption and a big liquid fuel import bill so it apparently made sense to try this angle. But even with free NG it apparently didn't succeed financially.
As others have pointed out more clearly, one can make gasoline out of any hydrocarbon source. You just have to be willing to spend what it costs to do so.
Rockman
You are correct with Mobil. They did a lot of research with SAPO catalyst and GTL. One route was to go via methanol. Use the syn-gas to make methanol and then decompose the methanol over a catalyst to form fuel products. The snag with this proces is that 56% of the methanol is water. I think it was zeolite type catalysts that prtoduced the best quality gasoline but at a yield penalty. The zeolite promoted the formation of naphthenes and aromatic species that boosted the octane number.
Funny enough last year in Dubai I listened to a well known Dutchman espouse the benefits of shale gas and methanol. He was going to nearly double the global methanol output and to dispose of the methanol it was going to be converted to gasoline. It raised more than a few eyebrows. Time will tell. Frankly I thoughht he was bonkers, but he has pulled off some miracles before. Maybe he will be there again next week and I can get an update.
A similar process can be used to make olfines. MTO and MTP processes. The Chinese are building a number of these plants based on coal to methanol. Once again the main product is water and the overall yield of olefines is pretty low.
With the Shell MDS process this is optimised at middle distillate production(Shell middle distillate process). The hydrocarbons are very linear and all paraffinic. This makes for good jet and diesel blending components (jet has to be blended with aromatic kerosine to avoid seal problems). The paraffinic gasoline is not so good. It is like straight run naphtha or isomerate depending on the branching and has a low octane number requiring it to be blended with high octane components, usually reformate, MTBE, or alkylate (if available) It can be used as reformer feed but would have a far better value in solvent applications. This is what Shell tends to do. The SMDS can also produce paraffin waxes, the sort of waxes that might be used in food packaging.
My humble opinion is as before. It takes a lot of work to synthesise liquid hydrocarbons form NG. GTL can be done but I do not see it really making much sense for transport fuels. Producing kerosine from GTL is reckoned to increase overall CO2 emissions by about 15% over kerosine from crude oil. Not exactly an easy sell to the environmentalists.
As ever, there is a lot we can do with chemistry. Not all of it makes sense.
Well, there IS one new GTL plant that is going to be built in the US , starting next year;
Methanex Planning to Relocate a Methanol Plant [from Chile] to the US Gulf Coast
I wouldn't be at all surprised to see a few more methanol plants spring up, and they are *far* simpler than F-T plants.
In addition to all the chemical uses for methanol, it is also allowed to be blended into gasoline at up to 3%. With the current price of methanol at $1.34/gal, it won;t take too much of a gasoline price rise to make the spread really attractive. And, comparing to ethanol, at $2.20/gal, methanol is already cheaper on an energy equivalent basis ($2.20 would be $ 1.62 for methanol).
Paul,
Methanol is not normally seen as GTL process. GTL is commonly seen as FT or a variant of to produce liquid hydrocarbons. Methanol is an alcohol and its use in gasoline is limited mainly due to its solubility. In the present of other alchols and ethers, co-solvent, a little more can be added. It has all of the corrosion and separation problems that ethanol and more has and an even lower calorific value as 57% of the molecule is water, which you point out.
As your comment say, Methanol is far simpler than FT. That is if anythting an understatement. Building a methanol plant is cheap and there are many of them, but I do not see them as a drop in fuel replacement for transport fuels.
Yes, cars can be run on methanol but the fuel consumption will double (volumetrically) and cold starting might be a problem.
Mucho thanks carnot. Always a great aspect of TOD: our wide knowledge base.
Carnot,
Thanks for your input concerning GTL. So far the industry has gone large scale in GTL,eg the Pearl plant in Qatar, but there has been a bit of work on down scaling the process into modular units to make use of stranded gas. Petrobras has been looking to put these modular plants on their FPSO's and an unnamed company is looking at them for shale gas in the US.
So time will tell on whether GTL works out successful for these smaller units in the stranded gas environment.
http://www.velocys.com/financial/fa/ocgfa20110614.php
http://compactgtl.com/worlds-first-modular-small-scale-gtl-facility/
Toolpush
I have heard of this but in my opinion the cost will kill it. Far simpler would be to put in methanol plant. One easy product to ship out and a much smaller footprint; this is now very scalable. Put GTL in a cold place and you will have some fun with the products as they will wax up like hell. You will also have several products to handle. Not good on a small scale. Remember - Keep it simple (and cheap).
Any thoughts on dimethyl ether (DME)? Easy to make from methanol, pretty easy to make from natural gas. Makes a potentially clean diesel replacement fuel if compatible injection systems are installed. Has a scale-up problem, but looks like a lot of upside if there was a commitment by vehicle engine makers.
Robert Rapier had a couple of blog articles on this. If I recall correctly, the capital expenditure is pretty awe-inspiring, and, the financials work out much better if you use gas-to-liquids to make very pure specialized application liquids, which the gas-to-liquids process allows you to make.
The price is elastic, that's for sure. The demand must be less than the supply.
Supply and Demand always rules.
I've been looking[*] for the steepening decline curve graph above for years. Thank you! Goes to my collection.
*As in passively waiting for it to knock on my front door - looking.
Thanks for another great article.
This link gave me a permission denied? Is the link correct, or content permissions set incorrectly?
Thanks.
Great article Art!
The only thing I would like flushed out a little better is the concept of price elasticity for natural gas. I've seen some people talking about it for oil, hopefully some economist-minded folks (or good googlers) can weigh in. It's the only point in my mind where the argument on either side is shaky:
"With the shift to more oil-prone or "liquids-rich" shale plays, many observers have suggested that associated gas production from these plays is or will be a major contributor to the present over-supply of gas. Approximately 3% of total U.S. gas supply is from shale associated gas so, while this is a factor, it is not the cause of over-supply."
So, since we're talking economics today, and profitability, and wether & to what extent crashing gas prices are due to shale gas in general, free gas from liquids plays, and share-price & reserve replacement loss-leading factors driving "oversupply", we'd really like to know what a bump of (i.e.) +/-3% in supply is going to do to prices in today's market, wouldn't we? I intend to do some research on my own, but perhaps some here are already familiar with the numbers? If the oil-rich plays went away and we lost 3%, would prices quickly hit $7 again?
I guess you want some sense of demand elasticity as well, so we can make arguments regarding the effects of (i.e.) weather and gas-peaking plant buildout on price, since the current big news item is low prices. I think once you add this in, one can really start to get a better feel for where things might be heading in the near/medium term. Nasty feedback loops in all this, but the naysayers seem to think the economics make it all work out. I think the elasticities make those arguments alot sharper on either side they are applied effectively on.
Not that with the decline rates we're seeing, TSHTF isn't inevitable, but for the moment, economic religion still allows for people heating the air in the room up alot...
Desert
Desert & Art
That quote out of the article seems pretty confusing to me.
According to my math shale wells are producing about 22% of the gas in the US and gas production has peaked in conventional wells (I'm including tite sand and coal bed methane gas production in conventional wells for simplicity). I guess Art means the shift to liquids-rich shale plays like the EagleFraud (oops I meant Eagleford)could result in an additional 3% increase in production? Doubt it. These Eagleford wells decline FAST. Hint: the Eagleford shale (contains lots of thin limestone interbedded with shale beds)and lies stratigraphically below the base of the AUSTIN CHALK. Its all about the oil. I don't think the Eagleford operators care if natural gas was $1/mcf. If they are close to a pipeline, they'll hook it in. If not, they just flare it. I hear some mineral owners are pretty mad about the waste of natural gas occuring in certain areas(Eagleford boom fixing to be good for the O&G legal profession too). The Texas RRC just accepts the well potential tests as to the Gas/Oil ratios as submitted by the operators. Even if test reports are all legit and a certain Eagleford well potentials as an oil well with 100,000 cu ft Gas/ BBl Oil. Say it produces 500 BOPD plus (100 mcf/bbl x 500bbl)=50,000 mcfg:
thats $125 K up in smoke every day at $2.50/mcf. IMO this IS a SHOCKING WASTE.
Sorry about the rant
Art...I think the x axis on exhibit 12 is labeled wrong.
Sorry Art
I meant Exhibit 19, x axis is really mcf/month?
Why are people pumping gas now with this contango?
It is obvious as night follows day that pumping a year from now is much more profitable. Why aren't people just plugging up the hole and selling ahead and waiting it out?
How can anybody not see that pumping natural gas at these prices is flushing money down the toilet.
What am I missing here?
dnpvd
Prior to the shale gas boom, a significant % of Texas gas was/is produced by small independents.Their conventional gas production is in decline but operating/service costs have gone sky high (blame the Shale Drillers). Even tho, I suspect, small operators of gas fields are doing better than breaking even every month,they don't shut in. YET. Sometimes Shut in wells cost ALOT to bring back on. Swabbing comes to mind and besides, compressor rentals, gauger & operator overhead are paid monthly. If gas gets to a really really low price...you will see some shut in....but not for long or the operator will lose the lease or have to pay the royalty owners a Shut in fee under the terms of the lease.
Insofar as selling ahead (hedging)... gas futures tanked below 4$ starting in Oct 2011. It will be interesting to see the Big Shale Drillers that hedged their gas...pony up and DELIVER it when the time comes. If the shale wells decline fast (they do) and they reduce drilling now (they are)....maybe the small mom & pop operators will sell them some. HAHA, the worm will turn.
March 2012 Nat Gas is under $2.50
Jan 2013 is $3.66 LAST
How can any of the costs you mention be more than that contango?
Buying now and selling January and holding it in storage should be a winner. How much can it possibly cost to store Nat Gas? ANd what better way to store it than in the ground?
In fact with this contango how does it make financial sense to deliver even if hedged? It would be better to monetize the hedge.
dn - Others having offered more technical answers. I'll offer a very simple one. Why not stop paying your mortgage and put the money into savings? Then when the house appreciates enough you can sell and make a bigger profit. Except, of course, you won' have a house to sell after it's repo'd. Few companies can afford to reduce their revenue today. In fact, there will be a number of companies (names you've never heard) who will shut down ops even if they sell every mcf they have. I know two persoanlly that have fired most of the staff and shut down most ops. The oil patch is typically highly leveraged with debt. Without the cash flow many can't survive. Actually at times like this more operators will do what the can to squeeze out a ittle more production that will reduce their sales volume. Since the NG price skide began in '08 many of the big shale gas players (Chessapeake, Devon) have not only kept their production rates up but have liquidated ten's of $billions of assets (such as prized DW oil in the GOM and Brazil) just to generate enough cash flow to keep drilling.
Fortunately we don't need the cash flow...my owner loans money to God. LOL. But we're still cutting production back. Our plan is to flip the company in a few years. No point is depleting it too fast at a low price.
Why is Exxon making deliveries of Natural gas? They are making $2.50 on gas on which they can make $3.66 next january.
This is not making any sense to me.
And how much does it cost to store Natural gas?
dn - Stock evaluation is out of my area but: XOM is a blue chip stock so folks buy it (and value it) based on dividend returns. Thus it needs cash flow. But I think they are sitting on a lot of cash reserve they could use to make those payments. So why not? Maybe due to tax considerations. Again, not my area.
Two problems with storage. First, it's has a finite capacity and it's near full. Second it costs to store. It varies a good bit between facilities. I'm not sure what a good general number would be today. But something like $0.10 mcf/month might be close. Might. And it costs you money to get the NG to storage...pipelines charge for moving NG from A to B. And that leads to another potential problem: sometimes you can't get your NG from A to B because there is no p/l connect. I also suspect that with storage near capacity those folks owning that storage are going to increase their storage fees. Remember the NG is stored under pressure. Cost a lot more to increase that pressure for the last NG in then the first. Just a WAG but NG stored this month might cost you #1.20 (or more) to store till next January. So $2.50 + $1.20 = $3.70/mcf. And then they still have to pay p/l transport fees to get that NG to the end users. And who knows what you'll sell that NG. $3.66? Nobody I know got that price last month. And the future price for Jan 2013 has no bearing on what you'll sell your NG for. NG futures for Jan 2012 were sold at a higher price that what NG was sold for last month. Someone lost hundreds of $millions (if not $billions) last month.
Again, I’m just making some guesses. But the folks that produce, store and sell NG know exactly what the numbers are and exactly what’s the best route for their operations. So what they are doing is what they have no choice. I’ve yet dealt with any company that intentionally didn’t try to optimize their efforts. Might not make sense to me or you but tha's probably because we don't know the details. Believe or not there are a lot more matters Rockman doesn't fully understand than he does. LOL
ROCK
Would companies like XOM have shipping contracts with the pipeline owners that required them to move a certain volume of gas in set amount of time or pay large penalties? Just wondering if things like that play into the produce or not produce decision. I know under certain conditions in other businesses sometimes bigger outfits with cash sell product at low prices so they can acquire competitors holdings on the cheap or just force them out of business and gain larger market share--don't know if that sort of behavior is something you would find in an industry as dynamic as natural gas production. Like I said earlier all my guesses are made far away from the extreme outside edge of the money patch.
For me, the link to 3% associated gas is not working. It is intended to direct to node 8874. Art, would you please correct or provide me a different link. I would love to read further as I think this is important. Thanks!