Tech Talk - An Introduction to China
Posted by Heading Out on August 8, 2012 - 4:21pm
When I first began this review of future production from the different oil producing countries about fifteen months ago, I produced this list of the relative performance of the top 30 producers.
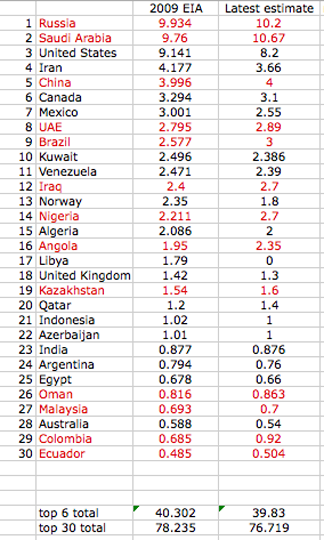
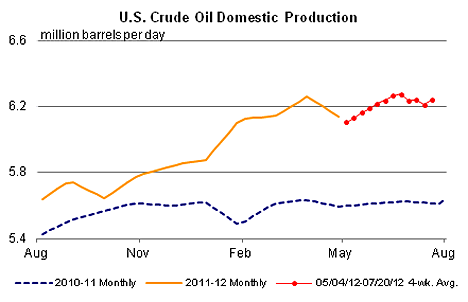
So, after covering the top three, the question becomes which country should be covered next, given the changing ranking? The United States is now producing some 6.36 mbd of crude oil, and after a steady rise in production, seems to have (transiently perhaps) reached a plateau. The number given in the table above includes ethanol and refinery gains, among others, and OPEC considers that the total average production this year will be 9.8 mbd. (MOMR)
OPEC considers that Russia will average 10.34 mbd this year, and is running just under that number this month, and Saudi Arabia is running at between 9.89 and 10.1 mbd at present. As one moves beyond this top three, China has now moved into fourth place with a reported production of 4.22 mbd. (OPEC MOMR)
China’s supply is expected to average 4.22 mb/d in 2012, an increase of 80 tb/d over 2011 and steady from the previous month. China’s output in May averaged 4.19 mb/d, also steady from the previous month and the same month last year. However, cumulative production till May 2012 indicates a decline from the figure for the same period in 2011. This has been mainly due to the shutdown of the Penglai field, while healthy production from the Changqing field, which reached a record level in May after 40 years of operation, has partly offset the decline.
As the initial table above shows, China has been lagging Iran in production, but even as China has grown production, production in Iran has slipped. OPEC reports that - again, depending on who one believes - Iran is producing between 2.96 and 3.76 mbd. (The latter is the Iranian number). Iraq is still running either slightly ahead or behind at 2.98 mbd. Iran may therefore be moving from 4th to 6th in production rank.
Even as China’s production has crept up, and against an EIA estimate of 20 billion barrels of reserves, these numbers are being dwarfed by the rate at which demand is rising.
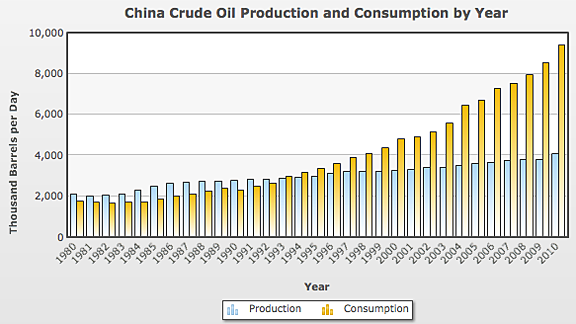
The EIA notes that this ranks the country as second (to the USA) both in terms of overall consumption, and also of imports (running at around 5.5 mbd).
As the demand for fuel for China has increased over the past decade, the country has been assiduous in seeking resources abroad which can provide future supplies. Although some of these resources are selling to other markets at present, their products can be “swapped” from other sources that can be diverted to China. (Nexen, which CNOOC has just moved to acquire, produces 213 kbd.) It is worth noting the comment that:
the acquisitions will help China "lower the risks when energy shortages become an urgent problem in the global market."
Also, this week Sinopec bought into 8% of the production from the United Kingdom (1.8 boepd) as it purchased 49% of Talisman.
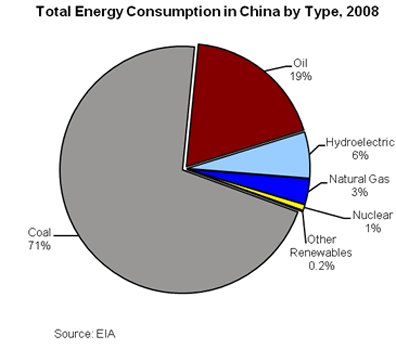
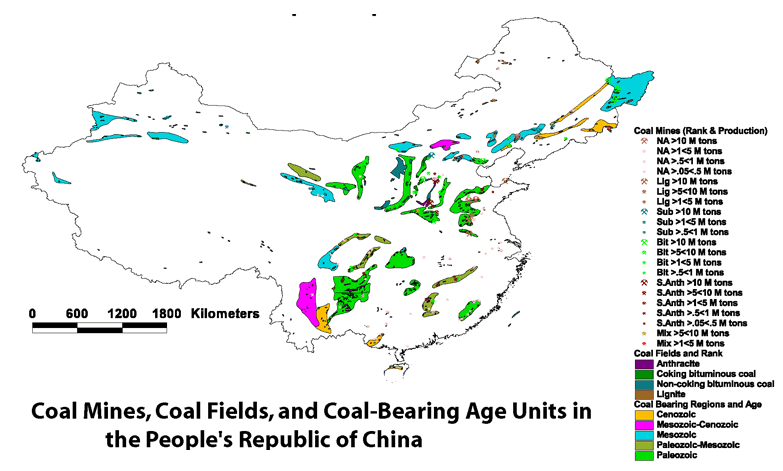
China still gets most of its energy from coal - 71% in 2008, according to the EIA review.
At a time when India has just emerged from two days of blackout, vulnerabilities outside of the availability of the fuel itself are ubiquitous and will equally hold true in China, where both domestic and imported fuel must make its way through a crowded infrastructure to the point of use.
Oil and natural gas are more easily transported in pipelines, though the large distances and the mountainous terrain in regions of the country does not make that construction easy. However, China has been willing to invest in such pipelines to gain access to, for example, natural gas supplies from Turkmenistan. Until the advent of the pipeline in 2009, the Turkmen were stuck with having to sell their natural gas through Russian pipelines into Europe, and had to take the price that they were allocated. With the opening of a second market, this was foreseen as a considerable boost to both countries. However, there have since been further negotiation of price, as the global market has changed. Those negotiations are now complete and flows will increase to some 65 billion cubic meters/year (bcm/yr). It is anticipated that this will cut the need for China to import additional volumes of natural gas from Russia. To date, some 20 bcm have been shipped from Turkmenistan through the 1,830 mile pipeline since it opened in 2009, and field development in Turkmenistan is proceeding to provide the volumes required by the new agreement.
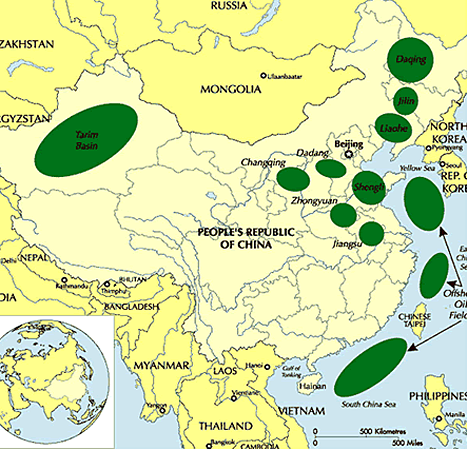
In terms of their own resources, China has a number of large oil fields, ownership of some (the offshore ones) is not always completely agreed.
The development of natural gas resources from shale has yet to begin in China, but as the Polish experience has shown, it is too early yet to predict that this might achieve success in the United States.
As with oil, China has significant quantities of coal, but still imports large quantities from abroad to meet the distributed demand across the country. It is not used purely for electric power generation; in the far West houses are transforming from mud brick to baked brick, with all the local brick works fired by coal in a region which otherwise gets its power from hydro-electric plants.
There is, in short, a fair amount of complexity to the Chinese energy story, which will form the focus of the next few posts.
Contact
- Content: editors at theoildrum dot com
- Tech support: support at theoildrum dot com
License

This work is licensed under a Creative Commons Attribution-Share Alike 3.0 United States License.
China is one place where the EIA and JODI agree. An overlay of JODI and EIA production looks almost exactly alike. I have produced the JODI graph here because they have production through May while the EIA only has 2012 production through April.
China Crude + Condensate production in kb/d through May 2012.

Technically their 2012 production is ahead of both 2010 and 2011 level. But their 12 month moving average actually peaked in June and July 2011 as shown on the graph. Their peak month was November 2010 at 4,275 kb/d. Their production in May 2012 was 4,116 kb/d.
It looks like China has peaked, or at least plateaued. Megaprojects shows Jidong Nanpu coming on line this year with an expected peak of 200 kb/d then nothing after that.
Ron P.
Is the Megaprojects wiki being updated in any meaningful fashion? Last time I looked at it there were only a handful of additions, including 1.8 mb/d from Rumalia for 2010 or 2011; not exactly long on detail, in other words. Hunting down what every oil co in the world is doing amounts to a lot of work. I have an idea about how to systematically go about collecting the data, but don't plan to monkey with wiki, until they implement a simpler interface. Also their editors or whatever you call them are a bit heavy handed, from what I hear.
Chinese production data, har har har. This is the country that kept its proven reserves at 24 bbo from 1989 to 2002. That's 24.000 bbo according to the EIA, too. ;) They didn't even nudge the decimal place around a bit like KSA. This hardly makes them unique, either; but they do get the gold medal for longest bout of blatant indifference to the concept.
Megaprojects was last modified on 28 May 2012, or so it says at the bottom of the page. Of course the data published there is only as good as their sources.
The production numbers reported by the EIA and JODI may be off but I would bet they are pretty close. The fact that their reserve numbers stayed unmoved for years may just have been due to the fact during that time the government did not want anyone to know what they were and did not change anything when queried on the subject. Then in 2003 perhaps they decided to open up.
Anyway the production numbers are all we have. If they were lying I don't think they would show China peaking as the numbers clearly indicate.
Ron P.
If you are calculating the rolling average by averaging the production from the previous 12 months of data, then it shifts the rolling average curve forward in time by 6 months. The rolling average should be calculated using data symmetrically around the point to eliminate this artifact.
True but the EIA, and everyone else, gives the previous years average at the end of the year. So my average shows exactly the same thing as theirs. That is the average always shows the average for the previous 12 months. And anyone looking at the chart should be smart enough to realize that.
Ron P.
This has been discussed several times here. What you say is true, and I agree. Having trailing moving averages are stoopid and should not be done. But so is counting volume of oil in barrels instead of cubic meters. But this is the standard in the oil industry. I wish but don't hope it will go away.
As they said in the Nurnberg trials: everyone else was doing it.
Nonsense. If a person cannot figure out that the moving average represents the previous 12 months then he/she is the one who is stoopid.
Really now? How is that "stoopid"? What difference does it make? If you wish your oil data to be in cubic meters then just divide the number of barrels by 6.28981077. Either that or multiply by 0.15898729493. Stoopid problem solved.
But barrels is better because it is easier to convert to gallons. Just multiply by 42. Of course all that is U.S. gallons and barrels. Sorry about that. Cubic Meters To Barrels [Fluid] Conversion
I understand that English is not your first language but for future reference, wishing for something and hoping for something is the same thing. What you apparently meant was "I wish but have little hope it will go away."
Now you are way over the top with your drama.
Ron P.
It is not about "beeing able". It is about "having to". Trailing averages are the not intuitive one. Show a graph to a 5 year old and the non-trailing one needs no explanation.
To examplify: Print the graph x=y. Then print the 12 month trailing average, and you now have an identical line, 12 months behind. And this is good because?
This may be a matter of taste and personal preferences, but I fail to see one single benefit with the trailing average. It adds one layer of calculation the user have to made in his head, but brings no added value to compensate for it.
And yes, I like drama.
Okay, if a lot of 5 year old kids start reading and posting here I will simply move my 12 month trailing averages back 6 months. Otherwise I will just assume the readers here are a bit more advanced than a 5 year old.
Ron P.
I have to admit I'm with JW on this one. When I look at well logs and smooth out the noise on some of those curves I like to see the peaks and troughs still reflecting the appropriate depth! Intuitively (in my mind) the same applies to a quick glance at a graph versus time. No need to make it more difficult for us geologists than it needs to be!
A big problem with a not using a trailing moving average is that it is difficult to predict the future.
Really? If I moved the trailing average back six months then you would be able to predict the future? It would look exactly the same, just centered six months earlier. Then you could predict the future? I don't really see how that would help.
Ron P.
I was agreeing with you.
Thanks. I guess you were being sarcastic and I missed it. Obviously one cannot predict the future from a chart but trends do continue more often than they don't.
Ron P.
As China has peaked, so has the Asia Pacific region
From:
17/5/2011
Incremental crude oil production update Jan 2012
http://crudeoilpeak.info/incremental-crude-oil-production-update-january...
No word about Asia depending on oil imports from the Middle East
Here is Asia and Oceania according to the EIA.
Asia and Oceania in kb/d and the 12 month average for the previous 12 months.
The last data point is April 2012.
Of course this is not all Asia but these countries: China, India, East Timor, Thailand, Australia, Indonesia, Malaysia, Vietnam, Other Asia, the same countries plotted by Matt above.
Ron P.
May be thats why CHINA went for take over of nexen.
Ron,
Any idea why production growth accelerated in 2010, dropped sharply in the 2nd half of 2011, and appears to be recovering in 2012?
The production behavior in the last 3 years looks very odd.
I have no idea but they don't appear to me to be recovering in 2012. The next year will likely tell the story. They don't have anything new coming down the pike so I expect their production to continue to decline.
Ron P.
The line in 2012 doesn't look much like a symmetric Hubbert curve. It's going up pretty sharply...
They don't have anything new coming down the pike
How do we know?
HO – “...are selling to other markets their products can be “swopped” for that from other sources which can be diverted to China.” I glad you brought this up. We touch on it now and again but there are still comments about China’s Canadian oil being trapped. Swaps have been common for decades in the oil patch. Maybe so with other commodities for all I know. Swaps have even been used to skirt federal law: it is illegal to export oil produced from federal leases. But years ago oil from govt Alaskan fields was shipped to Japan by using swaps: Japan bought oil from exporters that shipped to the US. Then Japan swapped those contracts for the Alaskan crude. The motivation on both sides of the swap was to save transportation costs.
But there can be other motivations and leverages. So China makes an offer to Gulf Coast refiners (after the new pipelines from Canada to the GC have expanded): Chinese Canadian oil is swapped for oil those refiners had been buying from other exporters: the US gets the Canadian oil and China gets the other exporters oil. Besides saving transport costs it opens up more opportunities for access. China can force a swap arrangement by offering a premium for oil currently being exported to the US. Not much of a stretch given China’s acquisition of global oil rights over the last 15 years. The more control China has (by both physical ownership and political arrangements) over exports the more leverage they have over GC refiners: trade equitably with China for their Canadian crude or be slowly pushed out from other export markets.
Swaps aren’t even necessary right now. China can continue to sell their Canadian crude to US refiners, take that revenue and buy crude from other exporters. It’s when we travel further down the PO path that this dynamic will evolve. I’m not sure what the details will be but I’m fairly sure the Golden Rule will persist. Thus a building block of the MADOR concept (Mutually Assured Distribution Of Resources). As China exerts more control over exports they corner more of the market the US depends upon. OTOH as long as the US economy remains stronger than many others we’ll be able to outbid many global consumers. Thus the “Mutual” part of MADOR: thru different control methods the US and China may be able to monopolize the oil markets to the detriment of all other economies including our historic “allies”. IMHO whether a pipeline is ever built to Canada’s west coast the ever increasing Chinese ownership of tar sand oil will have an impact on the US dependence on imports. There are still a lot of Americans who think the US gets most of its oil from the Middle East and not our largest imported crude source...Canada. And step by step the Chinese are gaining more control of this oil. But at the same time China is heavily dependent upon a healthy US economy for their exports. And perhaps increasingly more so if the European decline worsens. And they obviously would like to see those fat interest payments checks to keep rolling in from the US.
The line between competitor and partner seems to be getting fuzzy IMHO.
Rockman:
Thanks for this, there are the obvious movements of oil, and then there is the underlying pre-positioning for the future, and as Westexas has noted in the past the volumes that are going to be available are reducing, and the amount that China is gaining control over will, I suspect, be of concern before too much longer.
An observation and a question.
Observation: The decline in the GNE/CNI ratio is very similar to the decline in the IUKE + VAM countries' ECI ratio, and we know what the post-1995 decline in the combined IUKE + VAM CNE looked like (shown below).
Question: given the similarity of the GNE/CNI decline to the ECI decline, isn't in reasonable to expect to see a similar decline in the total post-2005 supply of Global Net Exports that are available to importers other than China & India?
Incidentally, the only estimated values on the following two graphs are on the post-2005 Available CNE curve.
IUKE + VAM
The following graph shows the ECI (ratio of total petroleum liquids production to liquids consumption, generally BP data) for the IUKE + VAM countries (Indonesia, UK, Egypt, Vietnam, Argentina, Malaysia). Also shown are the remaining post-1995 CNE (Cumulative Net Exports) by year. The six countries' combined production virtually stopped growing in 1995, with production ranging between 6.9 and 7.0 mbpd for 1995 to 1999 inclusive (BP, total petroleum liquids). Note that production was 6.9 mbpd in 1995 and 7.0 mbpd in 1999, but by the end of 1999, 54% of post-1995 CNE had already been shipped. Note that the decline in the ECI ratio gave some indication of problems ahead. When the ECI ratio hits 1.0, a country is no longer a net oil exporter.
Incidentally, an extrapolation of the six year 1995 to 2001 decline in the ECI ratio suggested post-1995 CNE of about 9.2 Gb. Actual post-1995 CNE were 7.3 Gb, so an extrapolation of the initial six year rate of decline in the ECI ratio produced a more optimistic estimate than what the actual data subsequently showed.
Available Net Exports (GNE/CNI ratio)
The following graph shows the GNE/CNI ratio (ratio of Global Net Exports* to Chindia's Net Imports**) versus Estimated post-2005 Available CNE*** (Cumulative Net Exports). The GNE/CNI ratio is very much analogous to the ECI ratio.
An extrapolation of the six year 2005 to 2011 decline in the GNE/CNI ratio suggests post-2005 Available CNE of about 168 Gb. Note that the extrapolation of the initial six year rate of decline in the ECI ratio for the IUKE + VAM countries produced a more optimistic estimate than what the actual data subsequently showed.
There are about 157 net oil importing countries in the world. An extrapolation of the 2005 to 2011 data suggests that the total post-2005 supply of Cumulative Net Exports that will be available to importers other than China & India is about 49% depleted as of the end of 2011.
*GNE = Net exports from top 33 net exporters in 2005, total petroleum liquids production less liquids consumption, BP + Minor EIA data
**Chindia's Net Imports = Total petroleum liquids production less liquids consumption, BP
***I projected the 2005 to 2011 rate of decline in the GNE/CNI ratio to estimate when the GNE/CNI ratio would theoretically equal 1.0, and I then estimated the area under the triangle, to get estimated post-2005 Available CNE of about 168 Gb.
China is gaining control
Doesn't China have to pay market prices for all of this production?
In that case, how are is what they're doing harmful to anyone else's interests?
If China obtains many foreign oil fields then much of what they pay for oil, they will be paying to themselves. Also if things gets really bad in the future then China will likely claim most of that oil from their foreign fields as theirs.
Ron P.
much of what they pay for oil, they will be paying to themselves
That would might hurt the balance of trade a bit. Of course, some of that revenue will pay employees, royalties and taxes. And, as we've seen in Venezuela and Russia, those royalties and taxes can go up to claim all of the profit, and more.
if things gets really bad in the future then China will likely claim most of that oil from their foreign fields as theirs.
As we've seen in Iraq, that's very, very counterproductive. In the case of China vs the Americas, it's highly unrealistic.
----------------------------------------------------------------------
I'd say the bottom line is that China is trying to ensure access to the marketplace, not shut anyone else out.
That's not a threat to the US, OECD or other developing countries.
Odd business, that ban; NYT in 1981 said "Exports of Alaskan oil to Japan currently are banned under the Export Administration Act of 1979." Just to Japan? Just from Alaska? Another NYT piece from the 90s mentions a ban from 1973. If you look at EIA numbers crude oil exports peaked in 1980, at 287 kb/d, tailing off sharply. They stayed pretty flat through the 90s, when that unholy stink was made about AK oil headed to Japan; there's even a page from Snopes debunking the notion that all of AK heads that way, it seemed to plant itself firmly in the public's mind.
Crude+products exports pretty much stayed flat through the century, until the big rampup began ca. 2005 - which I happened to notice as it took off. I never gave it a second thought; refining's a pretty tough game to play, US demand began to falter; so they looked for markets elsewhere. Not that mystifying; but it warranted nary a headline, unlike the 90s non-event.
KLR – I’m going to guess part of the confusion is due to not distinguishing whether the oil in question is from federal leases or private leases. AFAIK it’s still illegal to sell oil from fed leases to foreign buyers and ship the oil to them. I don’t think there has ever been a restriction to selling oil produced from private lands in the US to foreign buyers. Obviously that goes for refined products.
Tricky wording: a US company can’t sell oil produced from fed leases to a foreign country. But the law doesn’t prohibit shipping it to a foreign country as long as it’s done as a swap. But I still think the swap requires fed approval. I suspect as we stumble down the PO path the rules will become more convoluted. A number of foreign companies own oil produced from fed leases in the GOM. They can’t export that production home but they can swap a contract for the GOM oil for a contract for oil produced in Country A that was purchased by a Gulf Coast refiner. As long as one owns a volume of oil anywhere in the world it can be traded just like currency. The folks who will be at the greatest disadvantage in the future on the ones that either own the oil or have a call (right of first refusal).
Long ago I heard a rumor that a part of the loan that China gave Brazil to develop their DW oil reserves included a ROFR on a certain volume of future Bz production . So even if a US refiner can match the market price Bz is legally obligated to sell to China if they match the price. Calls and ROFR are usually kept confidential so it’s difficult to guess the future effects.
Rockman, I think lost in the debate over US crude oil exports is that the vast majority of them go to Canada, and most of them are from the Midwest. Basically, the fact is that it is more convenient for some oil producers in the Northern US to ship to a Canadian refinery than a US one. The amounts are not large and the refined products are probably re-exported back to the US in any case. Also a lot of condensate from gas wells and pentanes plus from refineries in the US is being shipped to Canada for use as diluent for heavy oil going back to the US. Obviously the condensate and C5+ end up back in the US, too.
Canada is probably exempt from oil export restrictions under the North American Free Trade Agreement (NAFTA). I don't know that for certain, but for the US to impose export restriction on US oil would open the door for the Canadian government to impose export restrictions on Canadian oil, and Canada exports more oil to the US than it consumes itself these days. For the US to impose export restrictions would be one of those "cutting off your nose to spite your face" moves.
And, yes, I think China does have ROFR's on a lot of the oil projects it is funding worldwide. As you say, they are confidential so I think they have escaped the notice of US politicians. In fact, a lot of things in the Chinese trade picture have escaped the notice of US politicians in recent years.
If China has to pay market prices for all of this production, how are is what they're doing harmful to anyone else's interests?
Yes, I asked Rockman and HO the same question - it seems important.
If China has to pay market prices for all of this production, how is what they're doing harmful to anyone else's interests?
Rockman is speculating along sound lines. While I don't know about other commodities, swaps are integral to the market in alumina. Companies in the aluminium industry are often vertically integrated, with ownership or part ownership of bauxite mines, alumina refineries and aluminium smelters in various places around the world. They then do swaps with each other to mimimise shipping costs, buying and selling bauxite and/or alumina at the gate of alumina refineries, for example. It makes sense. Why would you have two massive bulk cargo ships sailing past each other, carrying the same cargo, as one heads from Australia to Europe and the second heads from Europe to Australia?
Abs - Thanks for that confirmation. Besides saving on future shipping costs I imagine just the ownership of rights to various commodities will bring in a lot of leverage plays. Even with water today if the rumors I hear are correct: companies are paying higher than normal leases bonuses in the Eagle Ford trend for mineral owners who can include water rights with the lease. IOW operators will drill wells where they have those water rights before wells that don't. That's a huge leverage for those land owners given the apparent slowing of drilling in the trend.
Update on EIA/RRC gap for Texas crude oil production
For 2011 annual crude:
As of June, the (EIA/RRC) gap was 340,000 bpd (1.47 & 1.13 mbpd respectively)
As of July, the gap was 330,000 bpd (1.47 & 1.14)
As of August, the gap was 310,000 bpd (1.47 & 1.16)
For January, 2012 crude:
As of June, the gap was 500,000 bpd (1.71 & 1.21)
As of July, the gap was 480,000 bpd (1.71 & 1.23)
As of August, the gap was 450,000 bpd (1.71 & 1.26)
Some interesting numbers follow. The initial annual crude production numbers at Link #1 are apparently not updated. The monthly and annual production numbers at Data Link #2 are updated. So, I thought I would compare the updated values at Link #2 to the initial values at Link #1.
RRC Data Link #1:
http://www.rrc.state.tx.us/data/production/oilwellcounts.php
RRC Data Link #2:
http://www.rrc.state.tx.us/data/production/ogismcon.pdf
Year: Initial Annual Crude (mbpd), Revised (as of late July, 2012) and percentage change
2006: 0.93, 0.95, +2.2%
2007: 0.92, 0.94, +2.2%
2008: 0.95, 0.97, +2.1%
2009: 0.94, 0.96, +2.1%
2010: 0.98, 1.01, +3.1%
2011: 1.08, 1.16, +7.4%
I assume that the bulk of the corrections come from the latter months of the year, and as production started increasing to one mbpd in 2010 and over, in 2011, it would make sense that the correction factor would increase, since the latter months of the year have higher production than the earlier months. In any case, the correction factor averaged 2.3% for 2006 to 2010 inclusive, but has been 7.4% for 2011.
Given the historical record, I would be surprised if the 2011 annual EIA/RRC gap falls much below 300,000 bpd (currently 310,000 bpd), and I would be surprised if the January, 2012 gap falls much below 400,000 bpd (currently 450,000 bpd).
When examining China's energy needs, it's important to examine the change over time as seen in Figure 3.
Here are two more plots that give a little detail on coal, the main Chinese energy source. First, an "All Fuels" plot showing the huge increase in overall energy consumption starting in 2003:
Second, the import/export plot for Chinese coal which, according to the BP Statistical Review, still has China as a coal net-exporter.
The EIA page on China, which only has data through 2009, also has them as a coal net-exporter up through 2008:
China a coal exporter?!! Yes, to it's coal hungry neighbors: Japan, S Korea, (N Korea?), Taiwan and others.
Most of the English language articles one reads make it seem like China is a bottomless pit for coal imports but that has only been true in the very recent past. As the 800 lb gorilla of coal use, any change in the production/consumption ratio in China will be felt in world coal producing and consuming regions. English language media are surely biased toward the perspective of coal exporters like Australia, South Africa and the US. It takes a Japanese perspective to get a sense of the importance Chinese coal exports. The following article published by the Institute for Energy Economics, Japan makes for some interesting reading:
The Trend of Coal Exports and Imports by China and Its Influence on Asian Coal Markets
The Chinese coal story is a very interesting one as China is largely self-sufficient in coal. This is in stark contrast to the other advanced Asian. Japan, South Korea and Taiwan are entirely dependent on imported coal. A minor shift in the Chinese economy and their production/consumption balance could have a major impact on global coal markets. I covered this topic in detail in a 2010 ASPO presentation:
Global Coal -- The importance of China
The take home message slide from that talk had this:
The Future is Uncertain -- Three Scenarios:
Chinese production meets Chinese demand (with help from Mongolia?) Australia and Indonesia meet other Asian demand.
China's coalfired economic growth continues. Chinese demand outpaces Chinese production and they compete for imports.
China's economy stumbles, reducing demand. China exports coal to keep people employed.
It all depends on China.
Here we are, two years later and things are evolving more slowly than I would have imagined. I would give the same assessment today that I gave then.
Jon
Good comment.
The Chinese have talked about capping their production to reach a plateau around 2015 and make up for the rest of their energy use by wind, solar and a massive buildout of nuclear power(especially Thorium).
My guess is that exports from China will slowly but surely decline and reach a plateau as well. Coal exporters like Australia, U.S. et al would be able to shift more to those Asian nations for exporting their coal.
I think in terms of energy use, the Chinese are well aware that they need to downshift their coal use and they are well under way.
I still believe that what would get them in the end isn't peak coal exports but peak oil imports. As I wrote furhter down below, if Chinese oil imports continued on it's path as it did last year, their imports would go from 5.5 mb/d to 13 mb/d in just 8 years to 2020.
This will slow their economy considerably and create a glut in coal production.
Electricity generation is already flatlining in China and stories abound at how these large coal piles are growing by the day in their ports and transportation hubs as the industry just does not have the apetite for the previous growth.
Chinese PMI numbers have been negative for 7 straight months according to the independent HSBC estimates as opposed to the official state propaganda numbers.
This current crisis isn't only about oil, their housing bubble was twice the twice as a % of GDP than America's. They also have a very bubble-prone economic model which requires massive state investment to growth, which has spawned these 'ghost towns' everyone has seen pictures of.
People forget that Japan had only 30 % debt to GDP, it had large foreign reserves for it's time during the early 90s. But the underlying weakness of the economy didn't show in those numbers. We'll see if the same holds true for China.
And that's even discounting the impossible energy situation, and their demographic winter on top of it all(birthrate around 1.5 to 1.6 per woman).
By 2020 world total net oil exports will be down by another 5 million barrels per day. So counting that extra 7.5 mb/d going to China, exports to the rest of the world will be down by at least another 12.5 mb/d by 2020. 13 mb/d to China and 20 to 25 mb/d for the rest of the world. China will be getting 35 to 40 percent of all world oil exports.
I don't know what will happen in the next 8 years but I would bet my last dollar that is one thing that just ain't gonna happen.
Ron P.
Here is a "What If" scenario, which assumes that we come off the production plateau that the (2005) top 33 net exporters have shown and top 33 production falls at 1%/year from 2010 to 2020. The other key 2005 to 2010 rates of change stay the same. Available Net Exports (Global Net Exports less Chindia's Net Imports) would fall from 40 mbpd in 2005 to about 15 mbpd in 2020.
Geoffrey, I am largely persuaded by your ELM analysis, with the usual caution around any extrapolation model. The above 2010-2020 projection is useful as we are now fully a quarter of a way into it. So how is it holding up?
Have the top 33 producers declined 1% pa? etc? Has OCED demand decline possibly lengthened the time we may all have to muddle through on the 'bumpy plateau'? How would a [not unlikely] decline in Chindian consumption growth rate also alter the timing?
I have a 'whimper not a bang' hunch about the decline of BAU; ie Between scrabbling around for every last scrap of the black stuff and slowly and under duress learning to live with less we may have longer on the tail than the doomer school assumes.
Thanks in advance.
We only have one year of additional annual data (through 2011). The chart shows data through 2010. The top 33 net exporters have (so far) been on a production plateau since 2005. With some data revisions, their consumption increased at 2.7%/year from 2005 to 2011, and top 33 net exports (GNE) fell at 0.7%/year from 2005 to 2011. ANE fell at 2.2%/year from 2005 to 2011.
But I think that the best predictive tool, at least in some cases, is the ECI (Export Capacity Index), and the ratio of GNE to Chindia's Net Imports (CNI) is analogous to the ECI ratio:
http://www.theoildrum.com/node/9382#comment-909733
Incidentally, here is an alternative scenario, basically a continuation of the 2005 to 2010 production plateau, and extrapolating the other rates of change. Under this scenario, ANE would fall from 40 mbpd in 2005 to about 21 mpbd in 2020.
Thanks.
But then add a slower or stalled rate of demand growth in Chindia and whatawegot? Muddling through; a declining West like an old dowager sitting down on a mushy chaise lounge in slo-mo.... never to get up again.
And a fried atmosphere.
And I thought the American century was bad enough... this current one is getting mighty interesting too....
By the way my vote is for 'Co-petition' between the US and China for all the declining resources: Realpolitik will even win out over the cowboy myth [American Exceptionalism]. These two countries are the very definition of 'Too Big to Fail' and will recognise mutual risk if not always mutual benefit. One on the way up, the other down; likely to get stuck around halfway in a loveless clinch.
Join you on that one.
I have a growing list of things that just aren't going to happen, no matter. Would value your short list.
phil
Phil, predicting what isn't going to happen is a little like figuring out what "just ain't so", it is really easy.
What ain't gonna happen:
The population of the earth will never reach 9 billion people. I have my doubts that it will ever reach 8 billion.
OPEC will never produce more oil than non-OPEC and OPEC will never produce more than 33 mb/d Crude Only according to the OPEC OMR.
Non-OPEC will never produce more than 44 mb/d C+C.
Business as usual will not continue past 2020.
There are several others but that is as far as I can go right now.
Ron P.
“It ain't what you don't know that gets you into trouble. It's what you know for sure that just ain't so.” Mark Twain
Thanks Ron.
I'm not betting on a manned flight to Mars or the 3rd Olympics from now. Call it a hunch. Doubt I will be in a position to care or even wonder personally whether I am right or not after that. Some things are dead certain!
Phil
Minor quibble. Changes in OPEC's membership/structure could cause 'non-OPEC' production to increase dramatically, if by a trivial method.
I wouldn't bet much against 9B...
I'm not sure of your exact definition of BAU, but I'd take the opposite side of that one (2020) for most definitions. 8 years isn't that long (although Dubya seemed like eternal torment) and there's a lot of inertia in the system. I will specify that Chinese electrical generation isn't going to grow at 12% p.a. over that period (as it did over the past decade until they generated more electricity than the U.S. in 2011), and that their coal consumption will peak in that period. I would bet China will be using more oil than now, and the developed world less (but that most Americans will still have cars).
If we take the most optimistic scenario, borderline cornucopian, and assume that oil production will actually grow 5 mb/d or so up to 2020, if current trends stay the same then net exports to the rest of the world would still be more than 10 mb/d lower than it is in 2010.
And note that I am discounting India here.
To put it shortly: this can never happen.
America can probably cut quite a bit of oil use. And it's own rising domestic production will shield it only by a small extent.
But what can't and won't shield America, however, is the world economy.
The world economy is exceptionally interconnected in ways that it has never been before. Brazil, Australia, Chile, Argentina and many other nations are very dependent on China. And China's biggest exportmarket is Europe. The United States takes in about 2.5 trillion dollars in taxes and fees. 20 % of that federal income is the entire trade worth with China alone. It's self-evident that this equation cannot hold.
On another note: do you think Europe has a lot of fat left to cut? The declining net exports to Europe will create conditions that are close to the Great Depression. We're getting there already. And those conditions are ripe for the extremists on both sides of the political spectrum.
And, people have to understand that although Europe doesn't make much noise it's still the single biggest economy in the world(counting all 50 or so nations, not just the eurozone). And if Europe goes down, the rest of the world goes down with it.
This is why I think there won't be a 'crash'. We're looking at a long, slow grind for a slowdown. You're right that there is a lot of inertia. People will throw everything they've got on the problem and that will slow things down. Chinese oil imports are going to slow from here, giving breathing room for importers.
So the decline will be softened - but it will not be stopped.
After all, sub-6 % growth in China is deemed catastrophic. The authorties are freaking out even now, with (official) sub-8 % growth, although it's likely lower than that already.
India is in the same boat. Both nations have an entire political ecosystem wired for double digit growth. Both subsidize their fuel bills by between 60-80 % for their populations.
What can't go on, won't go on.
No, it would make no difference whatsoever. That has happened before. When Indonesia left OPEC all their historical production was posted with non-OPEC just as if they had always been there and their historical production was removed from OPEC.
Of course that would shift all non-OPEC production up slightly and all historic OPEC production down slightly but there would be no bump up or down for either.
Anyway I expect OPEC to break up soon then everything will be non-OPEC.
By BAU I mean exactly what you seem to think is going to happen. You seem to think that nothing much is going to change. I don't believe that for a minute. I think that when actual crude oil production drops off this plateau and turns down, things will start to happen.
Economies that are now at the brink of collapse will go over the cliff. This will cause chaos in Europe that will spread to the US. Some exporting countries will cut back on exports saving more for their own future consumption. This will cause an even greater downturn in world oil production and greatly exacerbate the problem.
That's what I mean by BAU not continuing.
Ron P.
What if Russia joins OPEC tomorrow?
I think you are overlooking the potential of CTL. As the price of oil rises or, pure and simply, becomes unavailable, coal can become the feed stock for diesel and gasoline
No way that 2003 trend break is natural. Did they launch a new 5 year plan in that vicinity?
according to these datas, the world will be a different thing in 5-6 years maximum..as correctly said by Nicole Foss at the latest Italian ASPO conference in Florence, in october 2011.
Here in Italy everything goes worst day after day..also if people's continuing life with a soft touch of business as usual..
Stefano C.
Euan Mearns did a good post on their coal situation a year back or so.
They technically have the reserves to go up until 2027 after which they would peak, but the quality of the coal is deterioating(as always the low-hanging fruit is picked first).
There's plenty of infrastructure bottlenecks to deal with which will take time as it's not just roads but you sometimes need to build an entire complex, and often an entire set of complexes. This takes time, effort and sometimes the cost isn't worth the return.
Aside from the coal situation, which seems more gloomy but still okayish, the oil situation is just out of control.
If Chinese imports would continue as they have in 2011 then they would import 13 mb/d assuming stagnant oil production(and it will likely be declining by then).
That's a good ~7.5 mb/d of new oil imports just over the next 8 years.
And I'm not even counting India or the increasing share that the Saudis take for themselves.
Euan's 2010 article is here http://europe.theoildrum.com/node/7123
Euan quotes Dave Rutledge
EDIT Interesting to note from Jon's excellent charts above (mazamscience.com databowser) that a good deal of that cumulative production has been since 2003.
Plus some mining intensive area are slowly sinking into ground, with building cracked by land sink and no longer useable. rehabitate all those people is expensive.