| Tech Talk - Tensions Over Oil in the South China Sea | The Oil Drum | Tech Talk - Considerations of Chinese Demand Growth |
Comments on BP Statistical Review 2012
Posted by Luis de Sousa on August 13, 2012 - 6:48pm
This is a guest post by Jean Laherrère a long time contributor to TheOilDrum.
Digest
- The BP Statistical Review has the merit to release every year free and convenient updated historical data on energy.
- This data is recopied from what is reported by national agencies, avoiding diplomatic conflicts.
- Despite the heterogeneity of the data, the report displays a ridiculously high number of digits, in contradiction with the real accuracy of the sources.
- The report wrongly adds unconventional to conventional reserves.
- BP ignores backdating, using obsolete reporting rules that lead to artificial reserve growth.
- Most economists believe this reserve growth to be the real, when in fact known Oil and Gas reserves peaked in 1980.
1. Oil
1.1. Reserves
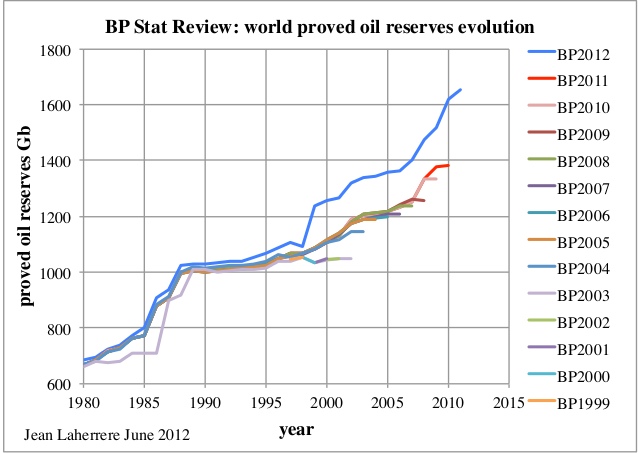
The new 2012 BP report (BP2012 for short) shows a drastic change in the world proved reserves, increasing to 1653 Gb at the end of 2011 from 1383 Gb at end the 2010 in the 2011 report (for a quick overview of the oil reserves nomenclature please visit the Wikipaedia).
BP is wrong by:
- adding proven reserves, when an arithmetic aggregation is wrong (it is only correct for mean 2P);
- adding conventional and non conventional reserves (where the size of the tap matters more than the size of the tank). These should be reported separately, as it is done in Canada and as it was in BP's 2011 report and before;
- using different definitions for oil supply and oil consumption;
- using a different definition for oil reserves by including oilsands in the “total world” item, when it was not in previous years editions.
The evolution of BP reserves estimates from 1999 to 2012 editions is shown below.
| Figure 1: World proved oil reserves from BP 1999 to BP 2012 |
|
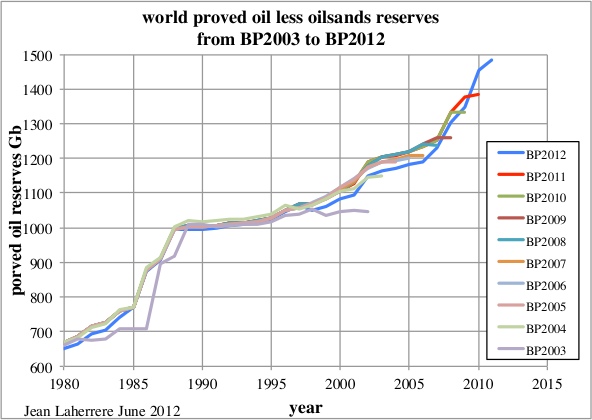
The new BP 2012 edition corrects the previous 2011 estimates drastically since 1999. It is not due to a new estimate of reserves but only a new presentation and a new definition. This drastic change is due to the addition to the “world total” item of the Canadian oilsands reserves from 1999, and since 2006 the extra-heavy oil from the Orinoco belt. Before oilsands where presented outside the world total, as “proved reserves and oilsands”, but Orinoco was included in the “world total”. In fact by removing oil sands, the total reported by BP at the end of 2009 shows a decrease to 1348 Gb in the 2012 report from the 1376 Gb reported in 2011. There is negative reserves growth!
| Figure 2: World proved oil less oilsands reserves from BP 1999 to BP 2012 |
|
BP in 2012 now considers Canadian oilsands like Venezuela's Orinoco - in fact they are both extra-heavy, but with a completely different viscosity because of the sharp difference in temperature in the reservoirs (55°C in Orinoco, where the fuel is fluid, compared to 5°C in Athabasca, the fuel being bitumen). They are both continuous-type accumulations and they should be treated separately!
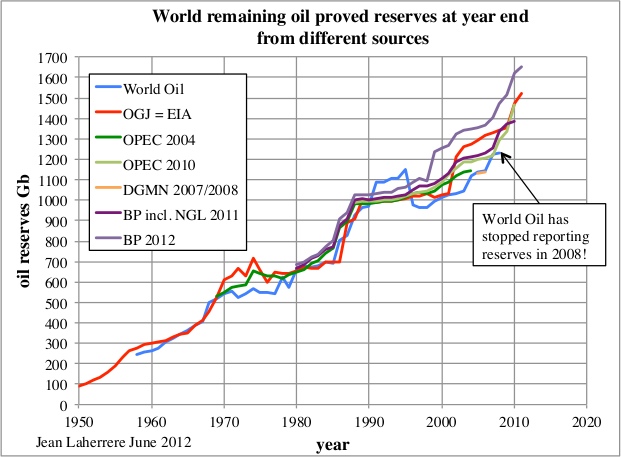
Comparing BP's world “total oil reserves” with other sources shows that the “new” (different) BP 2012 is ahead of the crowd.
| Figure 3: World proved oil reserves from different sources. |
|
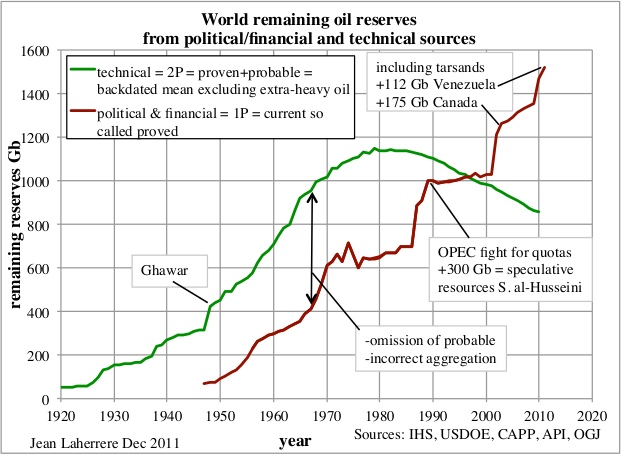
The comparison of the current proved reserves (EIA) with the remaining backdated 2P technical data is drastic. Current proved reserves follows the financial SEC rules for audited data or the political non-audited OPEC sources. Arithmetic aggregation of proved data is incorrect, leading to an underestimate of the reserves and to future reserve growth. Backdating is also a very important factor (see Laherrère J.H. 2011 “Backdating is the key” ASPO 9 Brussels 27 April)
| Figure 4: World remaining oil reserves from political/financial and technical sources |
|
Let’s look in the detail at BP2012.
In the proved oil reserves file at end 2011, the values are given in Gb and in Gt with many ridiculous decimals for several countries (14 for Azerbaijan in Gt, meaning down to 10 grammes!) and none for few (Azerbaijan in Gb). Some countries report reserves in weight others in volume and the average density is often badly known, in the end being simply guessed. A round value in barrels is converted in weight with many useless decimals: it is wrong not to restrict the amount of decimals to the accuracy of the measure (which is in fact an estimate and not a real measure).
| country | Gb | Gt | b/t |
|---|---|---|---|
| US | 30.8719987869262 | 3.72332507371902 | 8.29 |
| Azerbaijan | 7 | 0.95890408754349 | 7.30 |
| Iraq | 143.100006103515 | 19.3117408752441 | 7.41 |
| Kuwait | 101.5 | 13.980716705322 | 7.26 |
| Total World | 1652.61132445929 | 234.25108317424 | 7.05 |
A ridiculous number of decimals down to the hundredth of a barrel, when country estimates are usually given in thousands barrels at the most, shows that BP does not know the accuracy of its data, being badly checked and managed!
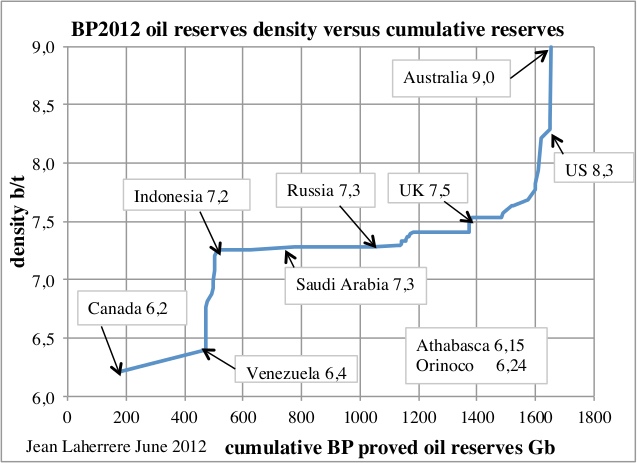
Besides this, the b/t density values reported by BP vary from 6.2 b/t (Canada) to 9.0 b/t (Australia).
| Figure 5: BP2012 oil reserves density (barrel per tonne) by country versus cumulative reserves. |
|
1.2. Canada
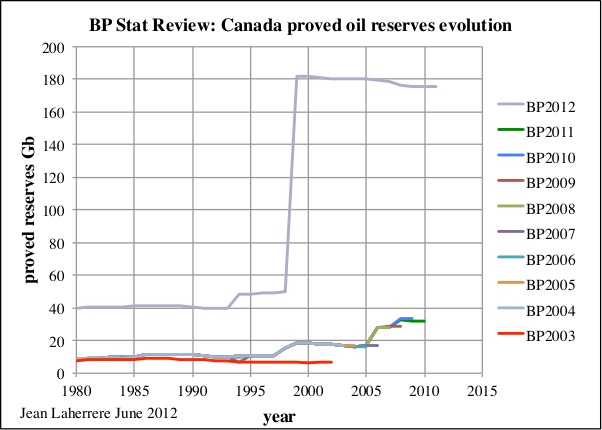
Canadian oilsands production started in 1967 but it was only in 1996 that BP reported large reserves from oilsands. The Canadian Association of Petroleum Producers (CAPP) only did so in 2010.
| Figure 6: Canada proved oil reserves from BP 2003 to BP 2012 |
|
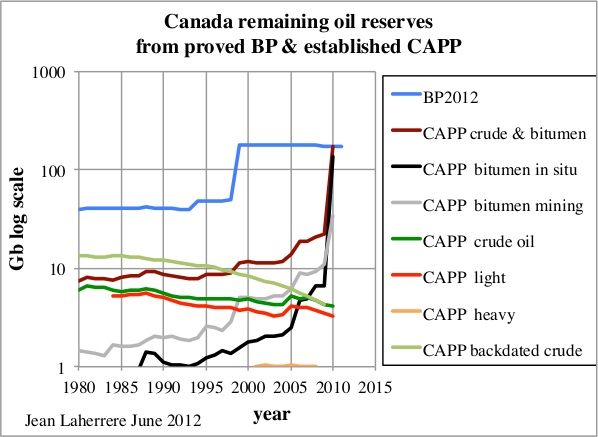
The CAPP reports established reserves, which represents proved plus half probable reserves (less than 2P). This association reports separately crude oil (broken down into light and heavy), bitumen mining and bitumen in situ, plus the backdated crude oil reserves. Unfortunately, bitumen backdated estimates are not reported and they stopped reporting backdated crude oil in 2009.
| Figure 7: Canada remaining oil reserves from proved BP and established CAPP in log scale |
|
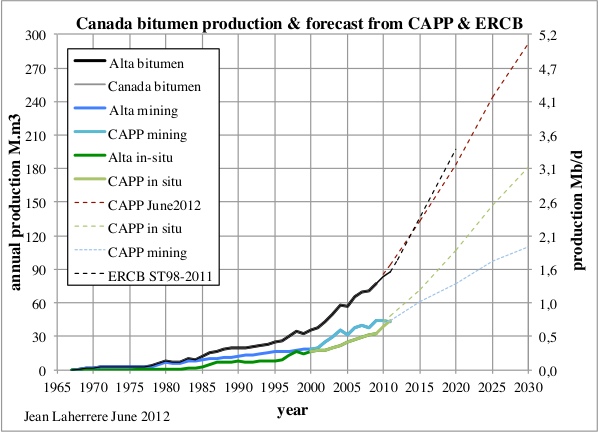
Bitumen production occurs in Alberta and the provincial organism Energy Resources Conservation Board (ERCB) provides data on production, reserves and forecast on its website up to 2020. CAPP has published in June 2012 its crude oil forecast, markets & pipelines.
| Figure 8: Canada bitumen production & forecast from CAPP & ERCB |
|
These institutions forecast bitumen production at about 5 Mb/d in 2030 and 3.2 Mb/d in 2020. Mining, which was higher than in-situ before 2010, will definitely lose in 2030, because mining reserves in 2010 were 34 Gb, whereas in situ were 135 Gb.
1.3. Venezuela
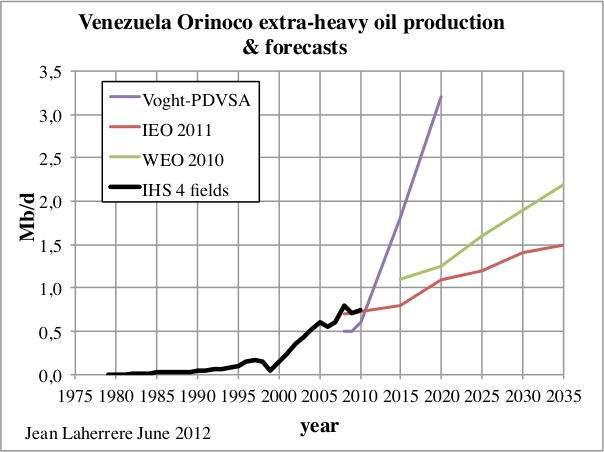
Another big increase is the extra-heavy oil from Venezuela, with BP adding about 200 Gb from 2006 to 2011. This Orinoco oil has been produced since 1979 and had a sharp increase since 1999 with production in 4 fields from international companies associated with PDVSA in the areas called Hamaca, Zuata , Cerro Negro and Machete. Hugo Chávez nationalized these operations in 2005, with these same areas getting the names Ayacucho, Junin, Carabobo and Boyaca. Production data are now unreliable, presently reporting around 0.7 Mb/d in 2010. Forecasts vary from PDVSA around 3 Mb/d in 2020 (David Voght “Venezuela, the Faja and Elections” IPD Latin America Institute of the Americas XXI Annual La Jolla Energy Conference May 21-23, 2012 - La Jolla, California), but the IEA forecasts only 2.2 Mb in 2035 (WEO 2011) and 1.5 Mb/d for IEO 2011.
| Figure 9: Venezuela Orinoco extra-heavy oil production & forecasts from EIA, IEA & PDVSA |
|
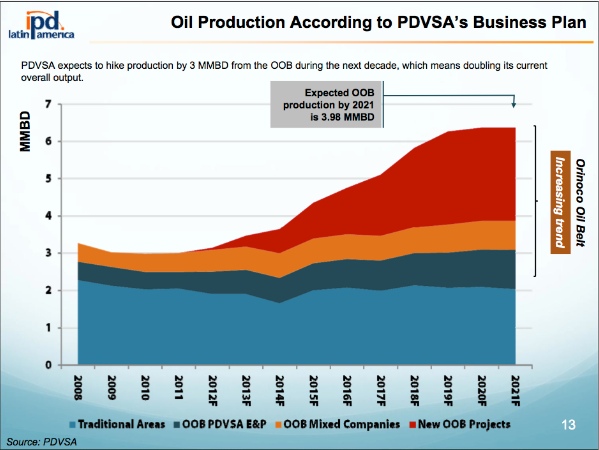
| Figure 10: Venezuela Orinoco extra-heavy oil production & forecasts from PDVSA: D.Voght |
|
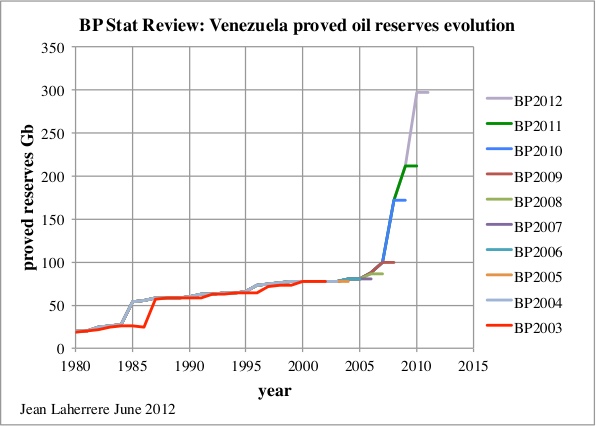
BP reports Venezuela oil reserves by recopying OPEC values, but being always one year late!
| Figure 11: Venezuela proved reserves evolution from BP 2003 to BP2012 |
|
1.4. Iran
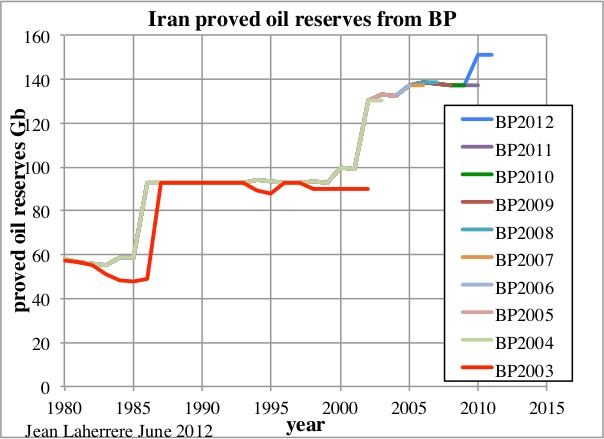
BP follows Iran's own reserves estimates, which are mainly political in their fight with Iraq!
| Figure 12: Iran proved reserves evolution from BP 2003 to BP2012 |
|
The remaining reserves from backdated 2P data are quite different from the 1P estimates reported by OPEC/BP, OGJ/EIA and WO.
| Figure 13: Iran proved reserves evolution from different sources: OPEC, OGJ & WO |

|
It is interesting to compare the evolution of official oil reserves in Iran and Iraq, and with the reserves from technical sources. Iran was below Iraq when Saddam Hussein was in power! In October 2010 Iraq increased their reserves to be a little over Iran; a few days later Iran did increase its reserves too, to be back on top. Both proved reserves are quite higher than the technical 2P.
| Figure 14: Iran & Iraq remaining oil reserves from OPEC and from technical sources |

|
1.5. OPEC and Canada
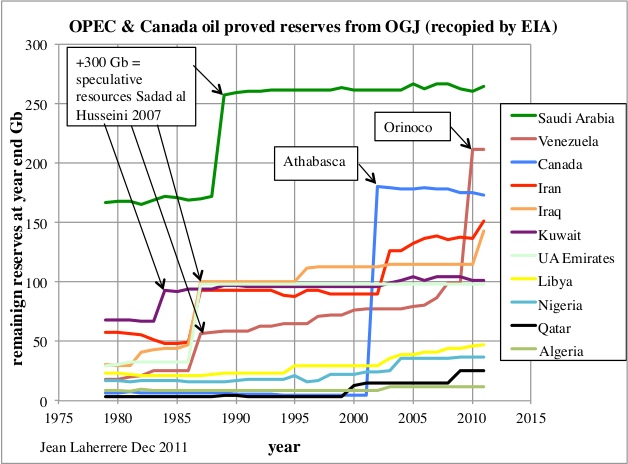
The OPEC and Canada proved oil reserves from OGJ (recopied by EIA) displays marked steps of political origin, and long periods without changes, when in reality, remaining reserves are constantly varying.
| Figure 15: OPEC and Canada oil proved reserves from OGJ |
|
1.6. Australia
BP proved oil reserves for Australia have changed significantly with time from 2003 to 2012 for the period 1980-2000
| Figure 16: Australia proved oil reserves from BP 2003 to BP 2012 |

|
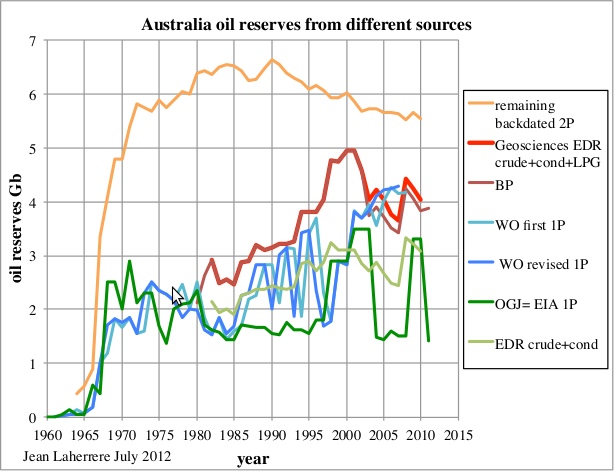
Australia oil reserves plotted from different sources show drastic differences. In 2012, BP states to report crude oil plus condensate and NGL proved reserves.
| Figure 17: Australia proved oil reserves from different sources |
|
The figures presented in 2012 BP report agree exactly with the Geosciences Economical Demonstrated Resources (EDR) for crude oil plus condensate plus LPG from 1982 to 2002; but EDR figures are 2P, not 1P. From 2003 onwards the BP reserves values are higher than EDR by about 0.3 Gb, meaning that some other liquids are reported, but it is difficult to find what it is. BP should report the LNG separately like the EIA does.
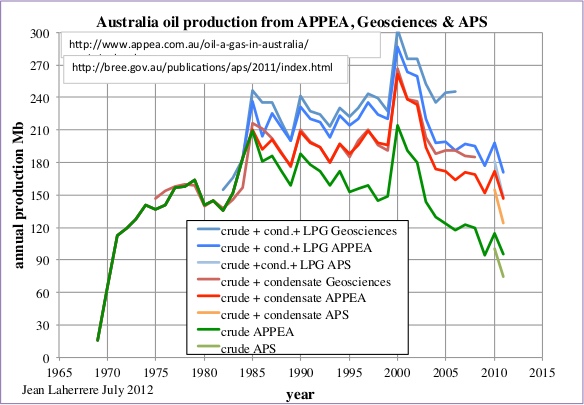
Australia reports oil production data through several organizations like Geosciences Australia, now taken over by Australian Petroleum Statistics and the Australian Petroleum Production & Exploration Association. One of the problems of Australia is that the fiscal year covers two years in the Gregorian calendar. Geosciences production data differs in last years and APPEA data should be preferred. However the new APS production data (starting in 2010) is lower than the APPEA data, also disagreeing with EIA figures.
| Figure 18: Australia oil production from APPEA, Geosciences & APS |
|
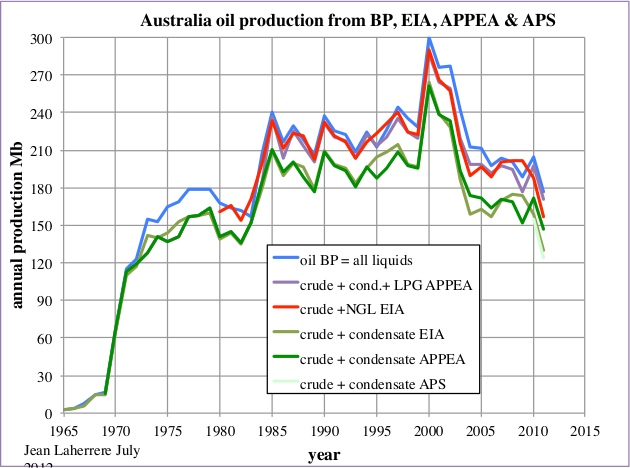
The BP oil production values (in blue) are higher than crude oil + condensate + LPG from the APPEA (in purple) and crude + LNG from the EIA (in red). Either BP is adding to oil production data (like in oil reserves data) something else than crude oil and NGL, or it just represents the inaccuracy of the data, despite that Australian data is in volume and not in weight! The difference peaked in 1975 at 28 Mb and again in 2003 at 23 Mb.
| Figure 19: Australia oil production from BP, EIA, APPEA & APS |
|
1.7. Russia
It is hard to find data for Russia from the start, because up to 1996 most data covers the Former Soviet Union, and during the cold war, oil data was a State secret. This State secret was abolished at the break up of the USSR but the Duma reintroduced it and publishing oil reserves can be punished with 7 years of jail (but not for gas!).
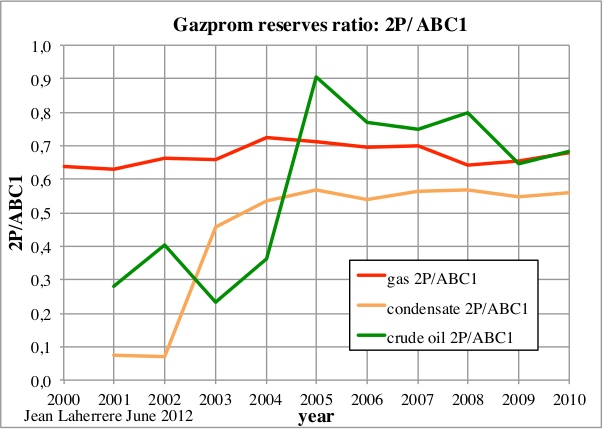
The other problem is that FSU reserves estimates are Russian estimates called ABC1, following a classification presented by Khalimov at WPC 1997 (Khalimov E.M., M.V.Feign 1979 "The principles of classification and oil resources estimation" WPC Bucharest, Heyden London 1980 p263-268). The same Khalimov stated in 1993 these ABC1 estimates as “grossly exaggerated” (Khalimov E.M., 1993, "Classification of oil reserves and resources in the Former Soviet Union" AAPG 77/9 Sept, p.1636) It is necessary to correct ABC1 oil data to 2P (mean values) estimates and for a long time I had used a 30% reduction, based on the ultimate estimated from the oil decline in mean giants fields (Romashkino, Samotlor, Urengoy). Fortunately, Gazprom's annual reports since 2000 provides reserves estimates using ABC1 and 2P. The ratio 2P/ABC1 from Gazprom is for oil between 0.9 and 0.7 during the last few years.
| Figure 20: Gazprom reserves ratio 2P/ABC1 |
|
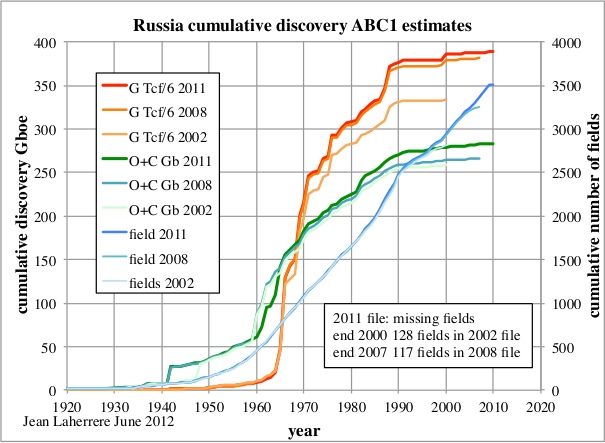
The evolution of ABC1 estimates has increased with time but it is due mainly to the fact that the data was incomplete. At end of 2007 the 2008 file is short of 117 fields, comparing to the 2011 file, meaning that the cumulative discovery at this date was small.
| Figure 21: Russian cumulative oil & gas discovery from 2002 to 2011 |
|
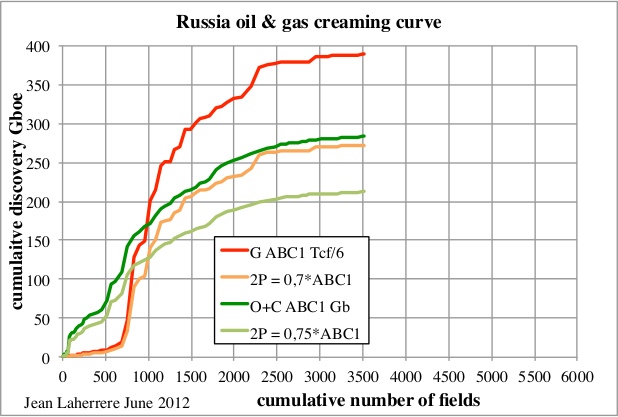
The creaming curve for ABC1 oil (2011 file) trends towards 300 Gb and for 2P with a ratio of 0.75 towards 220 Gb.
| Figure 22: Russian oil & gas creaming curve |
|
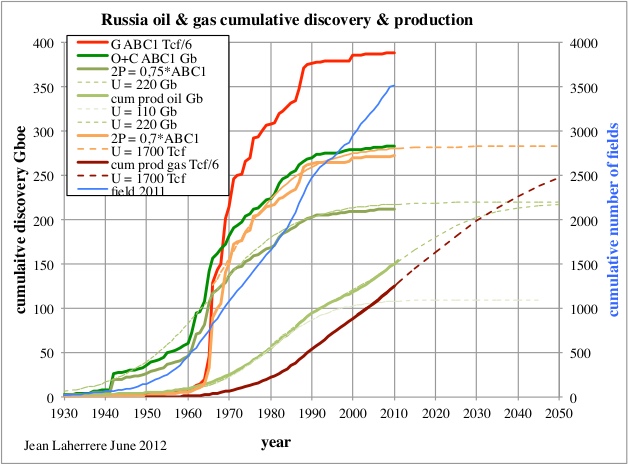
In time, the cumulative 2P discovery can be modeled with an S curve with an ultimate of 220 Gb for oil and 283 Gboe (1700 Tcf) for natural gas. The cumulative production is modeled with two cycles (one with FSU and one after the break up).
| Figure 23: Russian oil & gas cumulative oil & gas discovery & production |
|
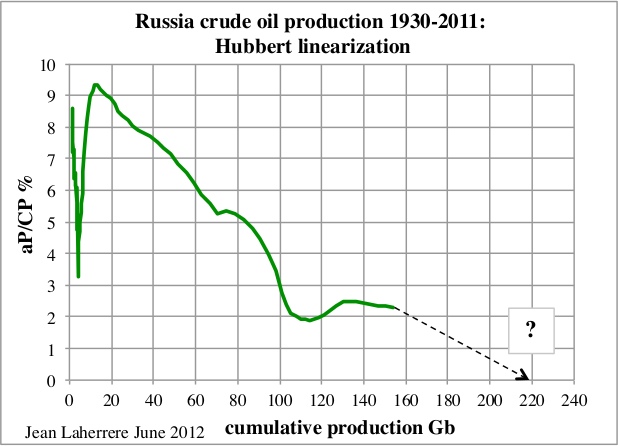
In studies where only production data is available, an extrapolation of ultimate reserves can be made using the method called Hubbert linearization, but when the trend is not linear, any estimate is unreliable. For Russian oil, the extrapolation with the Hubbert linearization is poor and the ultimate of 220 Gb from the creaming curve is not obvious.
| Figure 24: Russian crude oil production : Hubbert linearization |
|
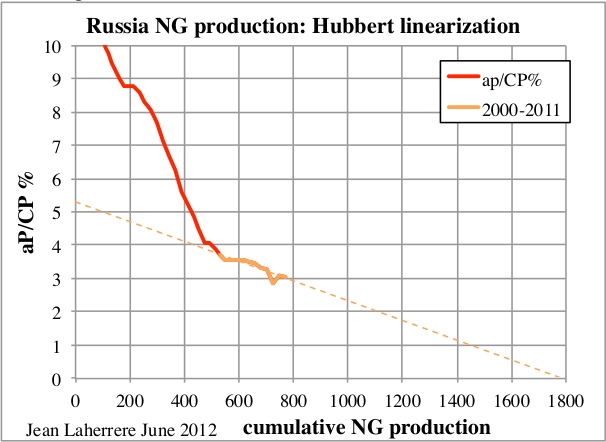
For NG, the extrapolation of the last period 2000-2011 trends towards 1800 Tcf, in line with the questionable ultimate of 1700 Tcf from the creaming curve.
| Figure 25: Russian NG production: Hubbert linearization |
|
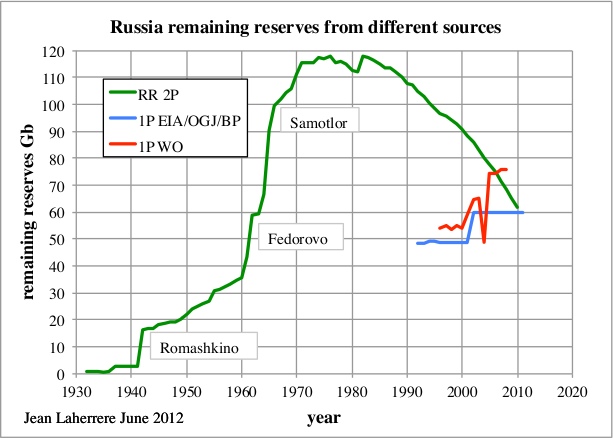
The remaining 2P oil reserves have peaked during the 1970s and are sharply in decline since 1983, whereas the published proved reserves from OGJ/EIA/BP are still rising. The 2011 estimate is a flat 60 Gb since 2001, which is obviously impossible, Russia is not finding exactly what it produces! World Oil magazine is showing erratic values and, because of that, they stopped reporting world reserves since 2009.
| Figure 26: Russian remaining reserves from different sources |
|
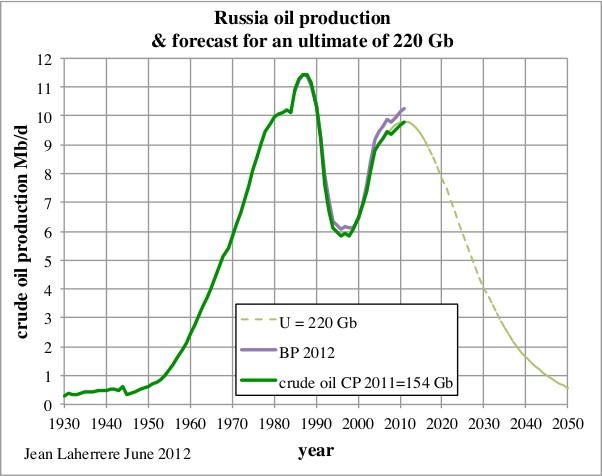
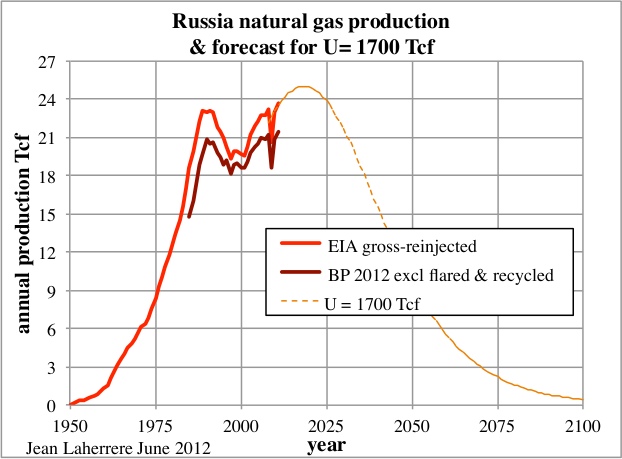
In the past my Russia oil ultimate was a round figure of 200 Gb; now with better data (but still questionable) I assume an ultimate about 220 Gb and that the annual oil production will decline from a second peak in 2011. The Russian energy minister has stated in the 20th of June that oil production will decline from 500 Mt to 370 Mt in 10-20 years (about 7 Mb/d in 2025), which is in line with my forecast.
| Figure 27: Russian crude oil production & forecast for an ultimate of 220 Gb |
|
BP reports natural gas production excluding flared and recycled gas. But what is flared is lost and should be removed from reserves. The gross less re-injected is about 2 Tcf higher than BP, because of the flaring. My model for the future with an ultimate of 1700 Tcf is a simple one, assuming only geological constraints (below ground), while above ground constraints exist in Russia. Uncertainties remains in particular around the investment on the giants fields in the Yamal Peninsula (Bovanenko) and in the Arctic (Shtokman) but also regarding environmental problems. Bovanenko (discovered in 1971) is just developing and the development of Shtokman (discovered in 1988) is yet to be decided. The model with an ultimate of 1700 Tcf displays a second peak around 2020 at 25 Tcf/a.
| Figure 28: Russian NG production & forecast for an ultimate of 1700 Tcf |
|
It is likely that the gas peak around 2020 will be more complex, depending the development of giant fields like Shtokman.
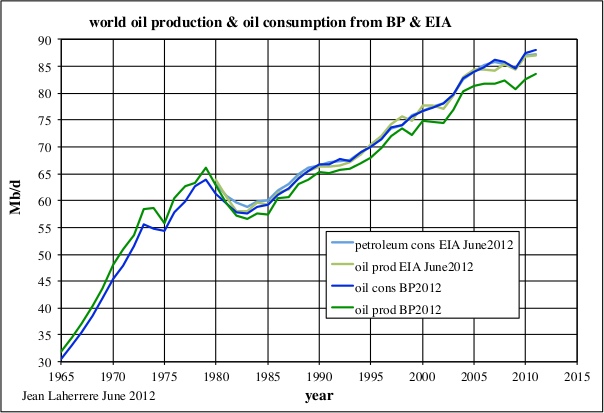
1.8. World oil production & oil consumption
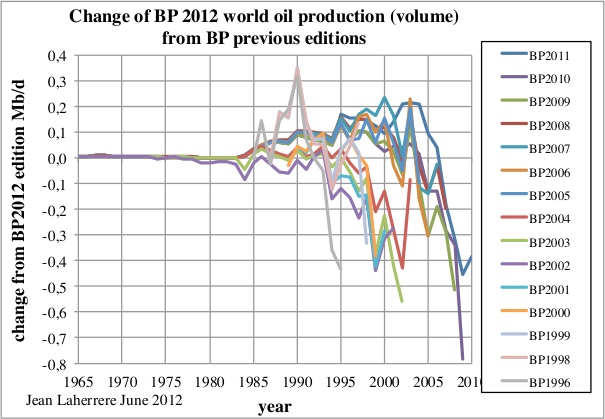
BP uses different definitions for oil production and for consumption, biomass, as coal derivatives are also excluded in oil production, but not in oil consumption. Oil production “includes crude oil, shale oil, oil sands and NGLs (the liquid content of natural gas where this is recovered separately)”. Oil consumption is “inland demand plus international aviation and marine bunkers and refinery fuel and loss”. Consumption of fuel ethanol and biodiesel is also included.
The change between previous editions and BP 2012 for world oil production in volume shows a range of about 1 Mb/d (from - 0.8 to 0.2 Mb/d).
| Figure 29: change of BP 2012 world oil production (volume) from previous BP editions |
|
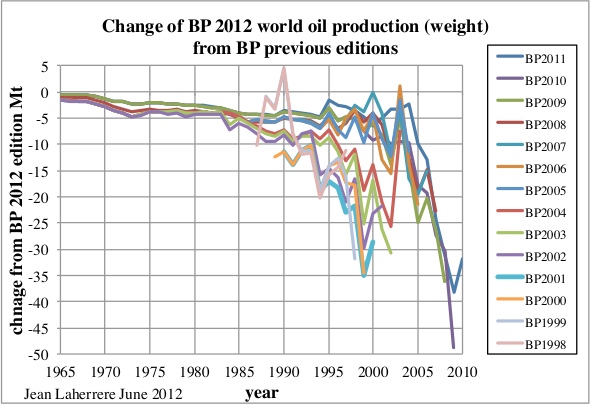
The same plot for the world oil production in weight shows a different trend, meaning that the average density of oil is varying.
| Figure 30: change of BP 2012 world oil production (weight) from previous BP editions |
|
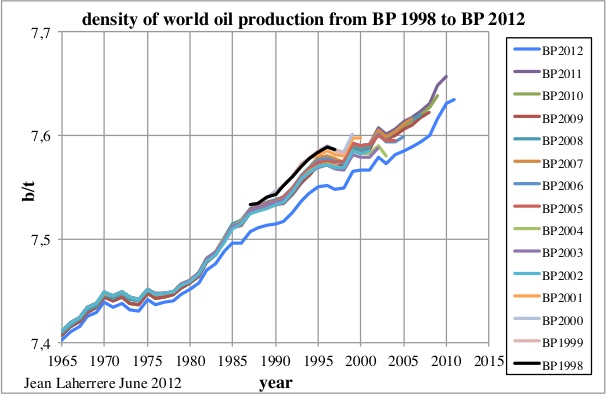
The plot of the density (in barrel per tonne) of world oil production from BP 1998 to BP 2012 shows that oil is getting lighter from 7.4 to 7.65 b/t, but BP is continuously correcting this trend, meaning that they do not have the right data. These are mainly guesses and guesses change with authors!
| Figure 31: density of world oil production from BP 1998 to BP 2012 |
|
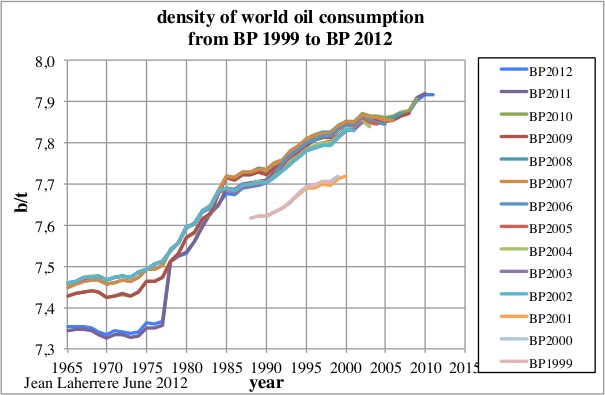
The plot of the density of world oil consumption from BP 1998 to BP 2012 shows a different behavior (because of the different definition that includes biofuels), but BP corrected in recent years by diminishing the density for the data from 1965 to 1977. The plots from editions before 2010 look more harmonious!
| Figure 32: density of world oil consumption from BP 1998 to BP 2012 |
|
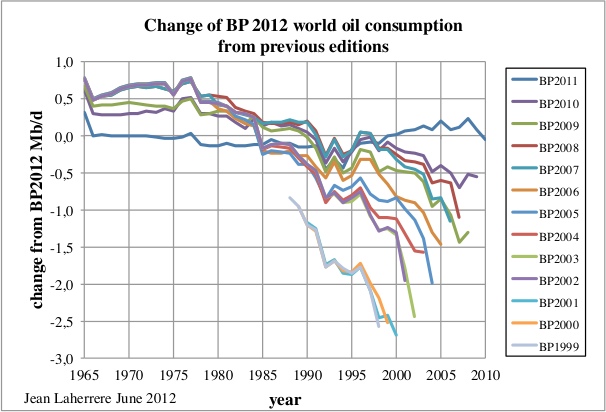
The world oil consumption change from previous BP editions shows erratic behavior, meaning that the data is not reliable! It will certainly change next year again.
| Figure 33: change of BP 2012 world oil consumption from previous editions |
|
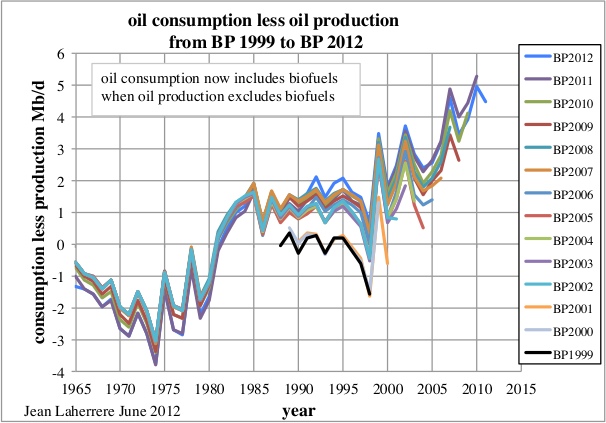
The difference between oil consumption and oil production (mainly due to biofuels and refinery gain) shows an increase from 1974 but with a range of uncertainty of about 2 Mb/d.
| Figure 34: world oil consumption less oil production from BP 1999 to BP 2012 |
|
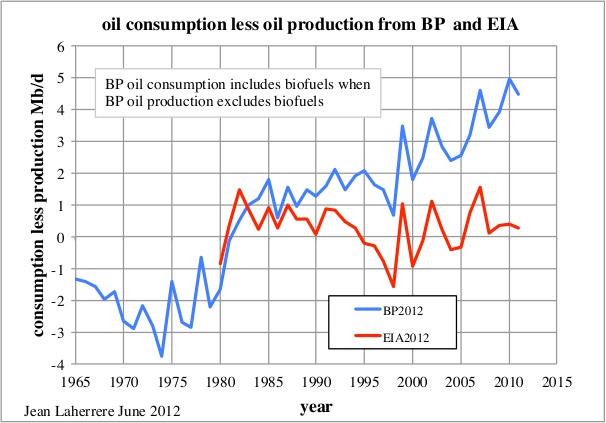
EIA reports oil production & consumption since 1980 and the world difference varies around zero (depending on stocks). The plot of EIA 2012 is close to the plot of BP 1999.
| Figure 35: world oil consumption less oil production from BP and EIA |
|
The difference is mainly due to the biofuels. Oil consumption data is about the same for BP and EIA, while oil production data are different because of biofuels and refinery gains!
| Figure 36: world oil consumption and production from BP and EIA |
|
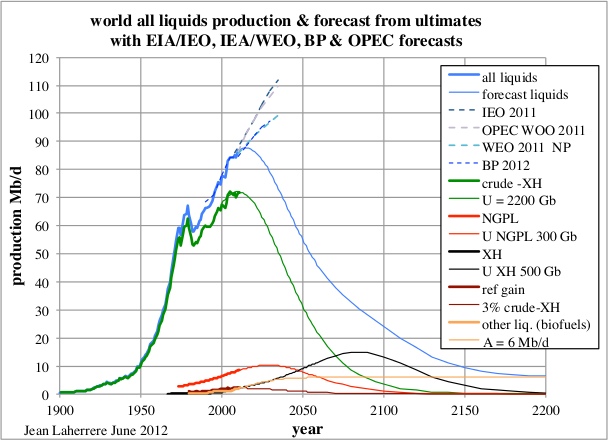
1.9. Oil production forecast
The forecast presented in BP 2012 are similar to those found in the IEA/WEO 2011 NP, but are lower than USDOE/EIA/IEO2011 (which is similar to OPEC/WOO2011). BP recopies other sources, but prefers IEA to USDOE/EIA! Its main merit is to provide historical series in spreadsheets. But BP does not like to report the discrepancy with others sources, or the discrepancy with its previous editions. The comparison of official oil production forecasts with the forecast using the technical data shows an obvious difference, like in Figure 4 on remaining reserves. The breakdown of the all liquids production is modeled with ultimates estimated from creaming curves: 2200 Gb for crude oil less extra-heavy (XH), 500 Gb for extra-heavy, 300 Gb for NGL, with refinery gains being 3% of the crude less extra-heavy, and other liquids (renewable biofuels) trending towards an asymptote of 6 Mb/d.
| Figure 37: world all liquids production & forecast |
|
Official forecasts are simply “no worry”: business as usual will prevail, peak oil is a myth, while technical data shows the contrary!
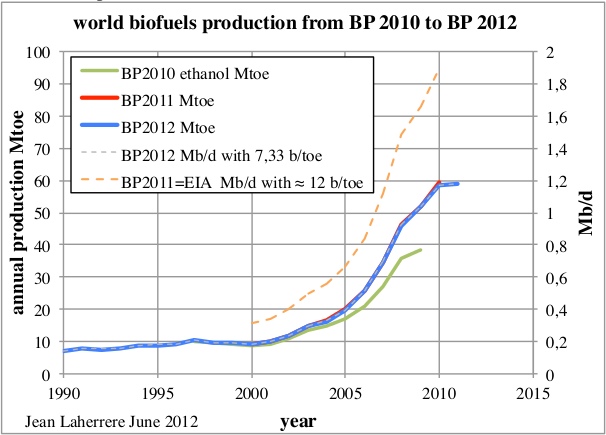
2. Biofuels
BP reports biofuels since 2010 in ktoe and kb/d, but the conversion between barrel and toe looks queer!
| Figure 38: world biofuels production from BP 2010 to BP 2012 |
|
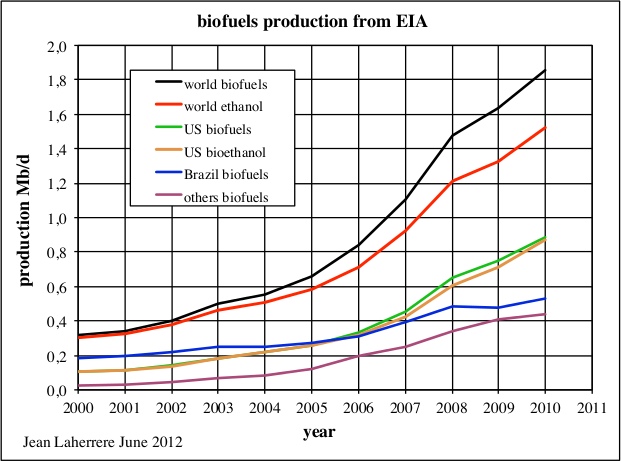
The data in b/d is computed for BP 2012 with a constant density of 7.33 b/t (toe) with constant 365 days per year and for BP 2011 with the real biofuel density varying from 12.6 to 11.6 b/t. EIA reports world biofuels only in Mb/d from 2000 to 2010 and the data is the same as BP 2011, which is over 1.8 Mb/d for 2010, against less than 1.2 Mb/d reported in BP 2012.
| Figure 39: world biofuels production from EIA |
|
BP should report biofuels data in volume in real barrels and not in barrels of oil equivalent to be in line with what is made by the EIA; it is only for data in toe that the density correction is done. The BP outlook to 2030 forecasts biofuels by simply copying what's published by the IEA in WEO 2011 New Policies.
| Figure 40: world biofuels production |

|
3. Natural gas
3.1. Reserves
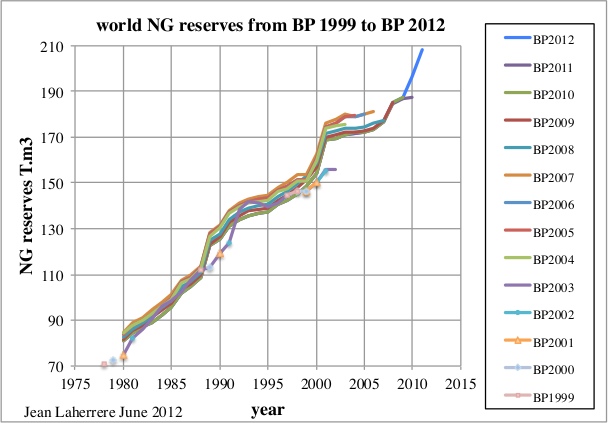
The Natural Gas (NG) proven reserves reported by BP have changed significantly with time, not always on the increase, for 2005 BP2007 was higher than BP2012.
| Figure 41: world NG reserves from BP1999 to BP2012 |
|
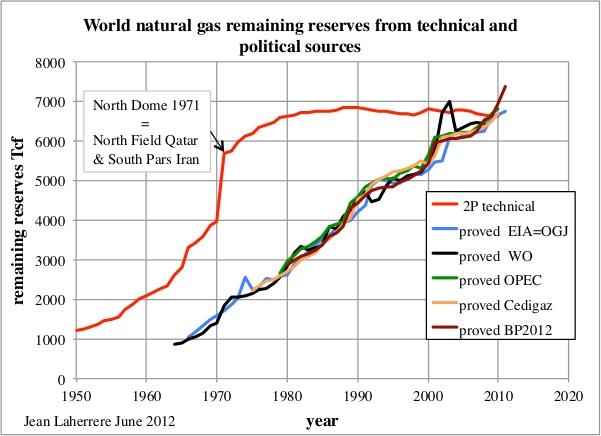
The comparison of remaining reserves between current 1P (political/financial) and backdated technical 2P is as striking as it is for oil. The 2P technical data has flattened since 1980 when the current 1P is on then increase since 1965!
| Figure 42: world NG remaining reserves from technical and political/financial sources |
|
3.2. Production
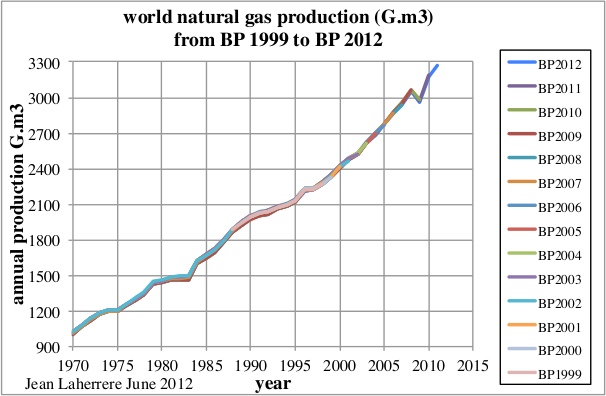
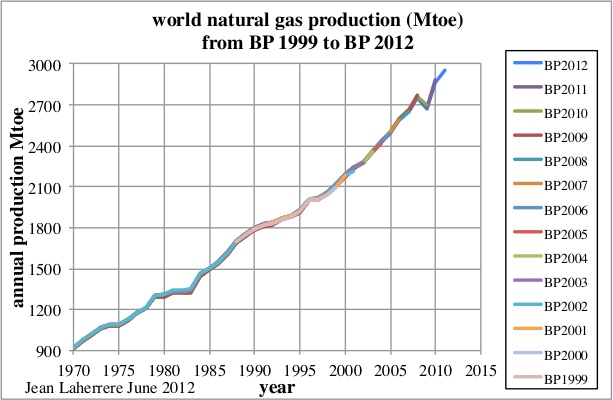
BP presently reports NG production since 1970 in cubic meters, cubic feet per day and toe. The change of NG production from BP 1999 to BP 2012 are small when compared to the changes for oil. Practically there is no change in production for the period 1970-2011 for the data in volume (Gm3) or in energy (Mtoe).
| Figure 43: world NG production (Gm3) from BP 1999 to BP 2012 |
|
| Figure 44: world NG production (Mtoe) from BP 1999 to BP 2012 |
|
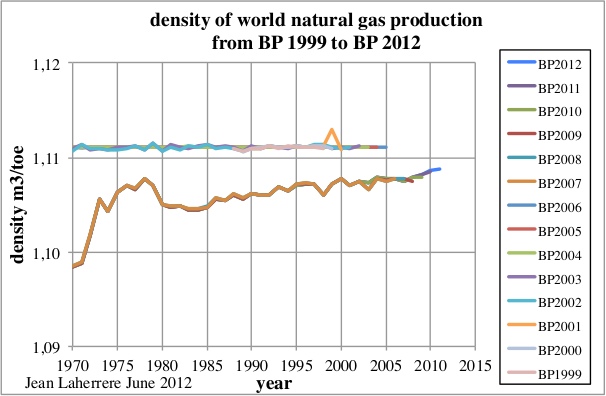
For the report in Gcf/d it seems that BP converted wrongly the data for the editions 2000, 2002 and 2003. The conversion ratio from cubic meters to toe was almost constant (poor practice?) from 1999 to 2006 at 1.111 m3/toe, but increasing from 1.099 to 1.109 m3/toe from 2007 to 2012.
| Figure 45: density (m3/toe) of world NG production from BP 1999 to BP 2012 |
|
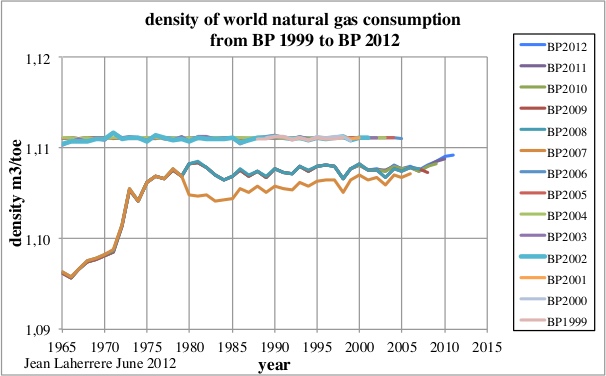
The same plot for NG consumption density, which starts at 1965, is slightly different for the editions since 2007, meaning that BP does not use the same conversion ratio since for production and for consumption as it was different gas!
| Figure 46: density of world NG consumption from BP 1999 to BP 2012 |
|
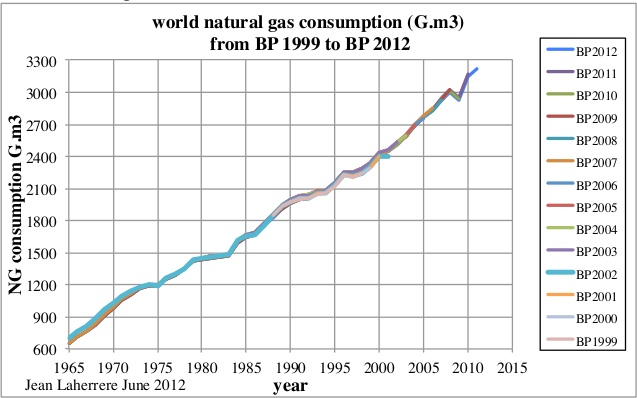
The plot of the world NG consumption shows roughly not much change, but being slightly different from NG production.
| Figure 47: world NG consumption (G.m3) from BP 1999 to BP 2012 |
|
4. Primary energy
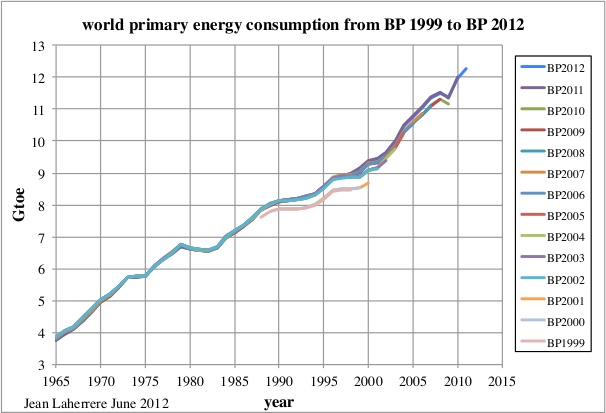
BP primary energy data varies little with time, showing a break in 1979 with the oil shock and an increase since 2002.
| Figure 48: world primary energy consumption from BP 1999 to BP 2012 |
|
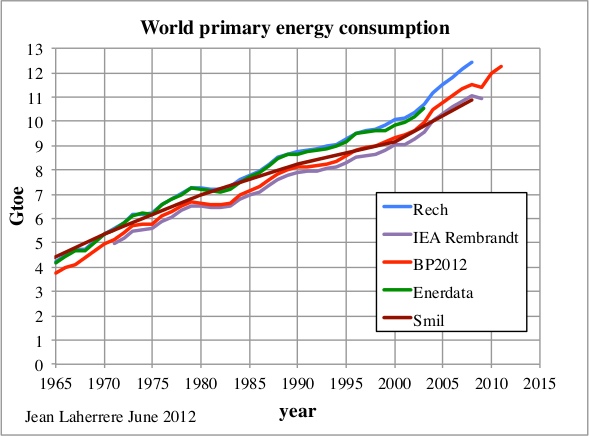
The same plot from different sources displays some uncertainty because of different conversion factors and definitions. The main problem is the biomass.
| Figure 49: world primary energy consumption from BP 1999 to BP 2012 |
|
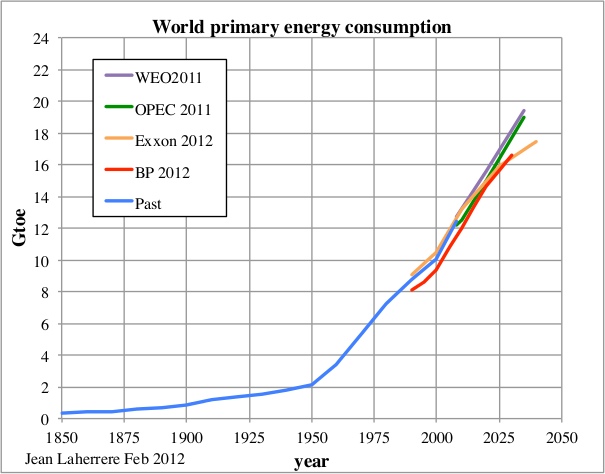
The forecasts vary, BP 2012 is in line with Exxon 2012, and lower than WEO2011 and OPEC 2011.
| Figure 50: world primary energy consumption and forecasts |
|
5. Conclusions
The BP Statistical Review has the merit to release every year free and convenient updated historical spreadsheets of energy data. But BP recopies what is officially reported by national agencies, avoiding diplomatic conflicts. Once in the '80s, in the annual statistical review. BP changed the official UEA reserves estimates by their own data (being the operator of almost every fields), but the next day they were obliged to destroy all their reports and to replace their values with the official data. Since then, BP avoids repeating this mistake! It is the same problem with most official agencies, so official data from other nations is difficult to deny. But BP reports heterogeneous and wrong data, displaying ridiculous numerous digits in contradiction with real accuracy. BP wrongly adds unconventional reserves to conventional reserves, despite these sources having completely different flows; they should be kept apart. BP, like many official agencies, ignores backdating, when the use of current reserves with obsolete (SEC) rules leads to artificial reserve growth. The problem is that most economists believe this wrong data, in particular the remaining reserves, which are reported on the increase, when in reality oil and gas conventional reserves peaked in 1980.
Contact
- Content: editors at theoildrum dot com
- Tech support: support at theoildrum dot com
License

This work is licensed under a Creative Commons Attribution-Share Alike 3.0 United States License.
This is a very good post so I'll just add one thing.
The BP reports have consistently underestimated Chinese oil reserves, which were fiddled with since the early 1990s(I think 1992) and have been very low, so it goes both ways.
However, the notion that these estimates are heavily political should surprise nobody. That is the common pattern. That's why we have sites like the Oil Drum.
To know what is going to happen to “proved” recoverable reserves you only have to look at British and German coal reserve numbers. They stay the same or rise slightly over decades, only to be cut by over 95% when it becomes obvious that not much more is going to be produced.
Could the reason for the reduction of proven recoverable reserves be that German black coal was produced underground and that the shut-down of the mines (flooding of the mining tunnels) led from a practicle POV indeed to a loss of recoverable resources?
The main reason was that the British and German coal reserves became uneconomic to produce after cheap oil from the Middle East became available and the North Sea oil fields were discovered. British and German coal could not compete with oil.
Most people don't realize that in order to be considered "reserves", resources must be profitable to produce at current prices using current technology. If a competing energy source becomes available at lower cost, a "reserve" may cease to be a reserve.
My house in the Canadian Rocky Mountains is sitting on the largest deposit of high-quality anthracite coal west of Pennsylvania. The footings of my basement are sitting on a coal seam. I could go out in my back yard with a pick and shovel and have an operating coal mine in less than a week.
However, there's already an abandoned coal mine behind the house. Few people know it's there - in fact property developers built a street on top of it and didn't realize it until the mine shaft caved in, leaving a big hole in the ground. They had to abandon the street - just covered it with topsoil, declared bankruptcy, and walked away.
That high quality anthracite is uneconomic to produce at current prices so the coal is not counted as "reserves". We have large amounts of oil and natural gas here, and they are far cheaper to produce than underground coal so the coal resources are not coal reserves.
That's the Peak Oil problem -- as the easy reserves get creamed out we are left with the expensive and difficult ones. And slow. At some point a maximum extraction rate is hit which corresponds with the greater economy's maximum ability to tolerate high energy prices without killing demand.
Not exactly.
Coal will be left in the ground because alternatives are cheaper.
The same is happening with oil - over about $80/bbbl EVs are cheaper.
That's correct. This coal is not very difficult or expensive to mine. I could do it myself if for some reason I wanted to burn anthracite in my fireplace (both my grandfathers had their own personal coal mines).
The problem is that the markets for the coal disappeared after big oil and gas discoveries were made in Alberta. The main markets for the coal were steam locomotives and home heating. How many steam locomotives do you see these days? How many people do you know who heat their houses with anthracite coal? Oil and gas are simply more convenient, and cheaper once operating costs are included.
British and German coal resources were much more expensive to mine than these ones here. They had in fact mined out all the cheap coal. It would be very difficult to justify reopening their mines even if markets still existed.
In Germany, a high percentage of electricity is still produced by coal power plants and will very likely be produced in the next two decades, for steel production coal is also needed. The final stroke for German coal was the lower price of the Australian coal, which can be produced in surface mines and transported round the world for 50% of the German local underground production, the last mines will be shut down in 2018, this will lead to the destruction of a qualified workforce and R/D facilities.
Excellent posting, Luis,
perhaps much of the "explosive" reserve growth is due to the new SEC Oil Accounting Rules, which were announced a few years ago
( http://www.theoildrum.com/node/4914 ,
http://www.sec.gov/rules/proposed/2008/34-58047fr.pdf ,
http://petrochemical.ihs.com/news-05Q1/cera-us-oil-gas-reporting-standar... ).
These should change the definition of "reserves" in order to suit it better to the increasing use of unconventional stuff like oil sands.
So the new definition allos previously excluded resources, such as oil sands, to be classified as oil and gas reserves. And as far as I remember they expand the definition of reserves from proven to probable reserves.
I think that this extension makes sense for tar sands, because as far as I understand the amount of oil (or bitumen) that is physically proven by having drilled it is tiny compared to the amount you can prove by drilling into a sweet spot of an oil field.
But of course as soon as you apply the new "reserve" definition to conventional fields their size will seem to explode - which might be interpreted as an enormous "reserve growth" by naive economists, politicians etc.
In fact I feared that this would happen as soon as the SEC rules are introduced, so maybe this is happening right now.
Bottom line: Changing the SEC rules may be useful for unconventional oil but are now misleading for conventional oil. The only way out of this mess is to introduce two types of reserves: rC (conventional reserve) and rU (unconventional reserve).
Otherwise all sorts reserve statements will become even more questionable than they already are.
Another explanation of the tar sands jumping out of and again into the world reserves during the last few years might be simply explained by their economy: Their production became too expensive when the oil price slumped in 2009 but are becoming economical again with the current oil price rise. This is a normal phenomenon valid for all sorts of fossil reserves - although most people don't seem to be aware of it.
In fact I think that for forecasting the future price and supply of oil there is a much larger insecurity at foreseeing the future development of the world economy (on which future oil consumption depends) than at assessing the geological size of reserves and resources.
Thanks! Plenty of graphs for more detailed study
Independently from Jean I did this analysis:
12/8/2012
BP Statistical Review 2012 (part 3): the incredible growth of oil(y) resources
http://crudeoilpeak.info/bp-statistical-review-2012-the-incredible-growt...
In March 2008, Gail did an article "The disconnect between oil reserves and production"
http://www.theoildrum.com/node/3664/
which used one of my graphs.
This is my update, from the above post
It is also important to understand that 41% of declining global oil production come from just 184 Gb
From the first issue of L. F. Ivanhoe's Hubbert Center Newsletter 1996
"For example, the much-quoted
annual ‘BP Statistical Review of World Energy’s’ tables and graphs on ‘Distribution of oil reserves in 1994’ contains a
fine-print footnote:
“...(reserve) estimates contained in this table are those published by the Oil and Gas Journal
(O&GJ) in its issue of 26 Dec. 1994"..."
"One must go back to the O&GJ annual year-end reports to check each of the oil producing nation’s oil and gas
reserves / production. On close examination, one soon runs into problems with the O&GJ numbers. The O&GJ merely
compiles the RESERVE information provided annually by each country’s government source. There is no way for the
O&GJ to check on the accuracy of foreign reports. To many foreign ministries, the O&GJ requests for reserve data was
either a sensitive state secret or a nuisance chore that no one was critically concerned about. Due to lack of guidance or
ignorance, a common answer was apparently “same as last year”. (52% of the 67 nations listed in O&GJ’s 25/12/95
report gave the identical oil reserve numbers as on 26/12/94; many for several years.)
Some nations’ numbers are obviously gross approximations. IRAQ doubled its reported reserves from 47 Bbo to
100 Bbo (Billion barrels of oil) in 1987, the number that IRAQ still lists for its reserves. Who could prove IRAQ wrong?
And what difference did it make to IRAQ if the world’s economists and planners were misled? By 1989 all of the OPEC
nations had raised their reported reserves to maintain everybody in line for their “oil quotas”. All of this increase was
creative bookkeeping “political reserves” rather than new oil discovered. These are the figures that bolster the apparent
change as reported by The Economist, that the world potential of reserves / production (R/P) increased from 35 years in
the 1970’s to 43 years in 1995."
"... If the USA / UN will not trust
IRAQ’s Saddam Hussein to correctly report details of his military might - how can they trust his report on IRAQ’s OIL
RESERVES?..."
To me, this seem like the tapping of trapped submariners. Somewhere in the bowels of BP, some unfortunate analysts were directly ordered to publish some very bad statistics. The extra sigfigs are their way of sending up a signal to the knowledgeable reader. We'll never get help to them time before the horse exhaust rises above the breathing ports, those poor suffering bastards.
Actually, there is a far more mundane explanation: simple rounding error.
Almost all the proved reserves numbers that appear with many significant figures (usually 15) have a run of a few zeroes or nines near the middle xx.yyyy001zzz... or xx.yyyy998zzzz for example. This is classic symptom of numbers being stored in a low-precision binary floating point format.
Taking one of the quoted numbers as an example - Iraq has "143.100006103515" thousand million barrels - and writing a tiny progam to store 143.1 as a "float" (a floating point number in 32 binary bits, in the IEEE 754 standard) and print it to 15 significant figures, I get a practically identical result: 143.100006103516.
No one at BP decided to deliberately quote the proved reserves of Iraq or any other country to a ridiculous precision. Someone entered "143.1" at some point, which is a nice round number in base 10 but not base 2; somewhere between the initial data entry and the final version presented in the spread sheet that value was stored as an IEEE-754 single precision floating point number.
This is not to deny other limitations of the BP Statistical Review, just to show the "ridiculous" precision numbers have a very simple common explanation.
retro - I do appreciate your detailed explanation. Such numbers are machine generated. But a machine didn’t generate the report…it was generated by a number of human beings. Another group of human beings proofed the report. Those human beings made a conscious choice to present the number of significant places. They were under no obligation to present X significant digits. Unless they were required to by their superiors. There was nothing automatic or required about that choice. I won’t try to ascribe a reason for that choice. But it was made by human beings for some specific reason. Even if the reason was to present the actual machine computation that was a decision made by someone who made that choice instead of simply rounding the numbers off in the final presentation IMHO.
Alternatively, it was never really proofed but rubber stamped. Just like the walruses.
NAOM
If I type "=5/9" into Excel, I get 0.555555556
Why would you expect Me to round it off for you rather than just pasting the result.
Excel has by default already rounded it once back from 15 decimal places. If I round it again, then I have to make a tough decision, how much is acceptable.
It's knowing the proper use of "significant figures". You don't specify the height of a person to 0.001" when you used a ruler with 1" graduations to measure their height. You only know their height to plus/minus 1/2 inch so it's useless (ignorant?) to fake it to 0.001 inches. Many (most?) people today have no understanding of the meaning of significant figures. Just because your calculator (or Excel Spreadsheet) shows you so many digits, does not mean they have any meaning.
Back in university, our physics professors used to deduct marks if we reported the results of our calculations to too many significant figures. Our experiments had a known accuracy, and reporting them with too many implied decimal places was telling an untruth about the data. We were supposed to know what the accuracy was and report our numbers to that accuracy.
I think the main problem with the BP numbers is that we don't really know how many significant digits they have. BP's authors are just printing them out to as many digits as their spreadsheets show, which disguises the underlying issue that the numbers are inaccurate and biased. We don't know how inaccurate and biased they are because we don't have the underlying data or know how all the calculations were done.
BP also doesn't know because it's not BP's data to begin with. Unfortunately people assume that BP has some kind of magic oil company crystal ball it is seeing them through, and in fact BP just gets them out of the oil industry journals like everybody else. There's no secret BP data in the reports because BP is not going to give away its trade secrets for free.
Augie – I guess I was too subtle in teasing about significant places. As Rocky explains below: given how much of the BP data base is not audited/confirmed, as far as this geologist goes a BP number of 500 billion bbls is no different than 600 billion bbls. Given the potential for erroneous/fraudulent reports to BP I don’t consider their numbers to have any significant digits. Well…maybe just one: my middle finger. LOL. Seriously I’ve been able to push optimistic reserve numbers past the likes of first class independent auditors like Ryder-Scott and the SEC. Imagine what the human mind can “calculate” when there’s no one looking over your shoulder.
My professors called it an order-of-magnitude estimate. We always had to do order-of-magnitude estimates to ensure our numbers were in the right ballpark. If we found ourselves playing in the wrong ballpark, we knew we had done something wrong and had to repeat the experiment.
One final exam question was, "Calculate the total volume of shoes in this exam room." The profs didn't care what the number was, they just wanted to see a convincing explanation of how we arrived at it. So, we looked around, counted the number of rows of desks, counted the number of desks per row, looked down at our feet, imagined our shoes as rectangular boxes, calculated the volume of the box, made a deduction for the number of women with smaller feet, multiplied it out, multiplied by two, subtracted one for the one-legged guy in the corner, and had our answer. We lost marks if we showed more than one or two significant figures.
In calculating the total volume of oil in the world, the process is somewhat similar, except you don't know how many exam rooms there are in other countries, how big each is, what percentage of the students have no shoes or are wearing knee-high boots, and in many cases whether the students will be allowed to write the exam at all.
So, you make wild guesses - optimistic or pessimistic - multiply it all out, and then if you're BP or the USGS you show the answer to six decimal places to make people think your numbers are accurate.
When I see such figures to six digits, I know that they are not accurate.
But more importantly, it also tells Me that They know their figures are not accurate.
Well, no, it tells you that they were calculated by clerks who didn't really know the meaning of the figures they were compiling.
Were those clerks also in charge of the final report? Who's responsible for the content of the report? Certainly management doesn't let the un-knowledgeable clerk put the report together unchecked?
Do you remember the walrus in the GOM.
You're right, I forgot about that. My bad...
You'd be surprised by what gets past top management!
I've observed a lot of top management, and they're not nearly as in charge and omniscient as we might hope or think.
That's why I'm quite confident that most conspiracy theories aren't realistic: they require far, far too much competence at planning, execution, secrecy and damage control.
All of this appears to be a smoke screen. BP will release this report to mollify the peak oil crowd and the folks whose living depends on not understanding the implications of energy decline. Frankly, it doesn't even do that well.
The problem we're facing, however, isn't peak oil, per se. It's the "energy return threshold;" how low can the energy return on hydrocarbon mining go and still sustain both the process of mining hydrocarbons AND running a civilization at a price we can afford? 10:1? 5:1? 1.1:1? The truth is that nobody knows. Energy return on West Texas crude was estimated at 100:1 in the 1960s. These days, 10:1 is seen as a good return. That's a 10-fold decrease in 50 years.
This is the real problem. We're mining energy, not hydrocarbons. It sounds nutty and counter-intuitive, but you could actually find more oil, but lower the world's aggregate energy return by trying to exploit it if it's energy return was too low (e.g. Canadian Tar Sands). Lower energy return eventually ends up as higher prices, since it takes more energy and money to extract the same amount of energy we're used to in order to keep things running at the same pace (about 160 exajoules per year). In some cases, you'd be better off not drilling a field if your goal is to keep prices low.
There's trillions and trillions of barrels of fossil fuels underground but EROEI prevents most of that from being usable. Just like there's an ocean of water out there but you can't drink a drop of it until you invest the external energy to desalinate it.
Interestingly, if you go to the natural gas website,
http://www.naturalgas.org/overview/resources.asp
you see near the bottom references to EIA showing that North America has about 320 trillion proved cubic feet of natural gas reserves. At 5800 cubic feet natural gas per barrel of oil, this equals 55 billion barrels of oil equivalent. Since the energy used to process oil sands comes primarily from natural gas, and if you assume the oil sands have an average EROEI of 5:1 (probably an overestimate if you consider the EROEI of every last barrel to be ultimately extracted), and that the oil sands have about 200 billion barrels of recoverable bitumen, the math shows that it would require 4/5th, or 80%, of all of North America's proved natural gas reserves simply to process the whole recoverable oil sands deposit.
And our leaders Christy Clark and Stephen Harper are bent on exporting our "huge" supplies of natural gas to Asia ASAP with lots of new LNG plants being built on BC's coast. But it seems that the low natural gas prices have more to do with futures manipulation, according to a recent article on The Automatic Earth. I also talked with a natural gas guy from northern Alberta the other weekend and he says that the only reason the gas companies can stay in business is because of the valuable NG liquids that come out with the gas. A dry methane well is not profitable at these prices.
55 billion barrels equivalent. Interesting. If it was oil, it would only be 6 years supply for the USA.
I get about 10 years; however, since the conversion efficiency of gas-to-liquids processes is 60% then this would bring it right back down to your 6 years, which you may have been accounted for as well.
Oops. Quite right. Shouldn't post when I'm tired.
There is more than enough shale gas and Arctic gas in Northern Canada to fuel the production of 200 billion barrels of oil sands. There's probably more gas up there than there is in the whole United States. Most of it is not booked as proven reserves yet because it has no access to markets and hasn't begun commercial development. This is what Clark and Harper are excited about. They'd like to sell it to Asia for more money than in North America.
At this point in time most of the big oil sands operators have their own natural gas operations, and one of the things they are doing is putting it into their own oil sands operations as fuel. It doesn't matter to them if they don't make any money on the gas because they are making enough on the oil to make drilling for gas worthwhile.
The Alberta government is now curtailing removals of natural gas from the province and is diverting it to the oil sands, which it has the legal right to do. In the future most of Alberta's gas production will go to the oil sands. Like BC, Alberta is known to have shale gas, but the resources have never even been estimated, never mind drilled. At some point they will be.
Here's the Alberta government's assessment of its reserves and markets -
ST98-2012 Alberta's Energy Reserves 2011 and Supply/Demand Outlook 2012–2021. Warning: 290 page PDF.
As for the future, bitumen gasification is an option if gas prices go too high or shortages develop. Companies prefer not to do it because they would like to sell the bitumen as oil rather than use it for fuel, but if they have to they will. It consumes about 1/6 of the bitumen production.
OK let's be generous and say that North America has 4 quadrillion cubic feet of natural gas left. North America consumes 31 trillion a year currently so that's 130 years of supply. But add 350 trillion to process the remaining oil sands and then we're down to 117 years. But the kicker is when US oil runs out. Since the US imports half its oil then when the financial system collapses and the US dollar is no longer the world's reserve currency and it can't import oil then presumably the US will be using its gas to make synthetic oil (or maybe invade Canada to take control of the oil sands). The US consumes 19 million barrels a day of oil so let's say they will want to provide half of that with gas-to-liquids, or 10 million barrels equivalent a day, or 3.6 billion barrels a year. This equals 22 trillion cubic feet of gas a year, factored up by 60% for the conversion efficiency to 37 trillion so now our consumption will be up to 68 trillion a year which is 53 years of supply. But I haven't included other demand increases for natural gas from population increase, as our leaders seem to love economic growth as a solution to our economic problems (I thought economic growth WAS the problem?!?) Realistically, now net it down to about 40 years of supply, assuming a generous 4 quadrillion cubic feet of North American reserves. Oh right, I forgot, Harper and Clark want to export most of our gas, so now let's bring it down to 20 years.
Well, Null, there are a lot of assumptions there.
I left a lot out of my post because there are other energy sources that could be used to produce oil sands, such as the vast coal fields that underlie about half of Alberta, or the vast uranium deposits in Saskatchewan, the biggest in the world. These will probably never be used to fuel oil sands because they will never be needed (at least by the oil sands).
Instead look at the fundamental assumption that the US really needs to use 19 million barrels of oil a day. Why? European countries use half that rate per capita. I think the US could get by on half that as well. Americans can argue that they will never accept less, but if they want to see where that leads they only need to watch Slumdog Millionaire. or go to Nigeria. The Swiss or Swedish economic systems are much better.
I like to point out to people that Canadian oil consumption is the same as it was in 1980, despite the fact its oil production has doubled. That's why it is able to export so much oil to the US. Canada doesn't need that much oil.
If you reduce North American (US + Canadian) consumption down to 10 million bpd, boost Canadian production to 5 million bpd (an easily achievable goal), hold US production at 5 million bpd (by for instance developing its much vaunted Green River oil shales), you can probably spin the gas and oil reserves out for 100 plus years. After that you might have to rely on cold fusion or something. My bet would be on the "or something" option 100 years from now.
I thought oil shale isn't even technically recoverable.
http://www.centerwest.org/publications/oilshale/4getitright/1leases.php
If massive profits can be made from Alberta oil sands with an EROEI of 5:1 and cheap natural gas as inputs, but at the same time no one can make any profit at all in the oil shale with access to equally cheap natural gas as inputs, this suggests that the EROEI of oil shale is extremely low, probably less than 2:1, maybe closer to 1:1? At this scale, we're talking about an energy "resource" that might as well be on Mars, that cannot produce enough surplus energy to run the rest of an industrial society which has a minimum required EROEI to function. But, I guess they'll keep plodding away at it... maybe some magical new technology will emerge that violates the 2nd law of thermodynamics and opens up 1.8 trillion barrels of oil shale. What's the point though? Just mine and liquify coal instead, way easier.
I don't know how the US is going to hold 5 million barrels per day oil production for decades forward when right now they're struggling to hold 8 million. Possibly opening up ANWR might help for a short while. I guess they should thank the Greenies who preserved it, otherwise that oil would have been long gone by now.
So realistically, over the next few decades Americans are going to have to get by on probably something like 2 million barrels oil per day, or 10 times less than what they currently use, and divided up amongst a larger population probably too. Unless, of course, they convert their vast coal and natural gas reserves to liquids.
According to the Alberta Energy Resources Conservation Board report you reference, Alberta has 620 Gt of ultimately recoverable coal. This is admittedly a very high number, so large that if true, North America won't have to worry about energy for a very long time if it can accept the environmental impacts of living off coal. In fact it's more than half of what the World Coal Association says is left in the whole world as "coal reserves"
http://www.worldcoal.org/resources/coal-statistics/
I am wondering about the origin of this discrepancy. Is it from the difference between defining "resources" and "reserves"? Is this another of those cases of past coal producing regions fantastically inflating reserve estimates, only to see the ultimate recoverable dwindle to a fraction of what was once hoped? The ARCB seems like a reputable organization; I'm curious how there could be such a huge discrepancy.
Regarding nuclear, are there any nuclear reactors that are now profitably being built on their own merits? What is the EROEI or even just plain old ROI of nuclear now?
I thought oil shale isn't even technically recoverable.
Actually, the technology to produce oil from shale goes back centuries. The British granted a patent in 1694 for "a way to extract and make great quantities of pitch, tarr, and oyle out of a sort of stone." See History of the oil shale industry
"Technically recoverable" and "economically recoverable" are two different things. The British only had to produce shale oil cheaper than whale oil. At this time the US shale oil deposits are completely uneconomic to develop and the EROEI of the processes is about 1:1. However, 50 or 100 years from now it could be quite different. Breakthroughs happen.
I don't know how the US is going to hold 5 million barrels per day oil production for decades forward when right now they're struggling to hold 8 million.
I realize the source of your concern - nobody knows if the US can hold its act together for much longer. I'm sure Americans are going to have to go through some tough times adjusting to future oil production realities. I used to be involved in oil sands research and took a hard look at the Canadian resources some years ago. I think Canada can get its oil production rate up to 5 million bpd and hold it there for a century or more. That's far more than Canada needs, but there's no guarantee that the surplus will go to the US - the Chinese own a lot of it now. If the US can't hold it's production at 5 million bpd, and Canada doesn't ship most of its oil to the US, well, I guess the US has a problem. I hope they think of a solution not involving some kind of invasion. See The War of 1812
According to the Alberta Energy Resources Conservation Board report you reference, Alberta has 620 Gt of ultimately recoverable coal.
That's probably true. When we drilled oil and gas wells in Alberta we would hit coal seam after coal seam on the way to target depth, and the Alberta government has all the drilling cores from all the wells in its vast core lab. About half of Alberta is underlain by coal deposits.
I am wondering about the origin of this discrepancy. Is it from the difference between defining "resources" and "reserves"?
That's the key to it. "Resources" are "reserves" only if they are producible at current prices using current technology. In Alberta, underground mining is unprofitable, so nothing deeper than a few hundred feet is counted as a "reserve" and they're only willing to strip a few dozen feet of overburden to reach it. If it was Germany, it would be different, because they are willing to strip off thousands of feet of soil and rock to reach a coal seam and go a mile or more deep to produce the coal in underground mines. Our economics are different - our oil and gas reserves are much cheaper to produce than deep coal, and we don't have a big steel industry to support. It's uneconomic to ship coal from Alberta to the big industrial centers of Eastern Canada, so that market doesn't exist for us, either. We have lots of coal but not many coal "reserves" in Canada.
Regarding nuclear, are there any nuclear reactors that are now profitably being built on their own merits? What is the EROEI or even just plain old ROI of nuclear now?
The EROEI of nuclear is extremely positive, but it's mostly the Chinese building reactors now. They are building dozens of them, though. "Profitable" is something of a different concept for them. They are looking into the medium future and seeing the global oil, gas, and coal reserves running short of their needs. Other countries should be so farsighted.
"At this time the US shale oil deposits are completely uneconomic to develop and the EROEI of the processes is about 1:1. However, 50 or 100 years from now it could be quite different. Breakthroughs happen."
RMG, I will be the first to admit that you provide a useful dose of critical reality to temper the doomer tendencies of some posters on this site (myself included, admittedly), but if you're trying to argue that US oil shale will someday provide a significant source of energy then I think you may be crossing into ideology. This is the same line of reasoning that is destroying the US, how the political opportunists parade out the "trillions of barrels of US oil shale" as evidence that the US has tons of oil left, how it's just a matter of getting those restrictive environmental regulations relaxed to open it up, and therefore the US does not need to embark on a major crash course to get off petroleum for energy. It provides the political justification for inaction.
But this is the same line of reasoning that says that the world doesn't have a water shortage because 2/3 of it is covered with water! Of course the minor complication is that it takes energy to turn sea water into something useful for people and agriculture...
I take back my previous statement that oil shale is probably between 2:1 and 1:1 EROEI. I think it's clear that it's less than 1:1 because if the input energy they are using is cheap natural gas and electricity which is priced at a dramatic discount to oil on a BTU basis, and they can't turn a profit by turning this into expensive oil, even with government research subsidies, then clearly there is something very wrong with the process on a fundamental level. Instead, one could almost turn a profit by turning that cheap natural gas into oil directly, and that has an EROEI of 0.5 to 1.
You are an engineer and you know just as well as anyone else here that when we've gone from 100:1 squirty oil wells a few decades ago to now trying to figure out how to wring energy out of something that's probably an EROEI of less than 0.5 to 1, we've got a problem. Sure, advancements will be made that maybe bring it up from 0.5 to 1 to 1.5 to 1, but so what? Basic thermodynamics stipulates that there's a minimum amount of energy required to extract kerogen from rock and turn it into oil and if you're arguing that some new invention will manage to violate the laws of thermodynamics and suddenly bring it up to an EROEI of 10:1 and enable a continuation of our oil addiction for a few more decades, then why don't you just admit right out that you believe in perpetual motion machines. Just like alchemists have always tried and failed to turn lead into gold, inventors have always tried to invent perpetual motion machines and they ALWAYS fail. That oil shale is neither technically nor economically recoverable on any scale that would alleviate oil decline and you know it.
Now as to the extent of coal reserves, it seems likely that the world may have significantly more than many would like to admit; it's just difficult to access. It still has significantly positive EROEI (I believe it's around 50:1 right now, someone correct me if I'm wrong) but this will of course drop over time as we cream out the nicest deposits under your house first. When we finally do run out of high EROEI coal will we then latch on to fantasies of trillions of tons of "shale coal" with an EROEI of 0.5 to 1?
The question remains: if humanity is granted an additional say 50 years of fossil fuels because of coal, which will not be an easy existence like our previous dependence on oil was since it will have to be converted into oil which is slow and expensive, then how will we respond to this one final opportunity that's presented to us? Will we take it as an excuse to continue BAU of fossil fuel addiction because "technology always manages to solve the problem", and further grow our economies to ever greater unsustainable heights, and increase our dependence on burning dead things from the current 95% of our energy requirements right now to 97%, thereby making the inevitable crunch even worse than it would be right now? Or will we take it as our one last opportunity to build out a renewable energy infrastructure?
I remain more skeptical about the world's supposedly massive gas reserves since even CAPP admits that “The easier-to-produce sources of natural gas are in decline, so our industry is turning to sources that are more difficult and expensive to develop." (they aren't saying this about coal, likely because they know your house sits on a nice deposit). This is referring to the whole continent of North America, so if we've already creamed out a whole continent I fail to see how some additional difficult reserves in the Arctic are going to change this situation for any appreciable length of time. As I pointed out, even several quadrillion cubic feet won't last long once we enter oil decline and once Harper and Clark export as much of it as they can to China ASAP so their cronies can get rich.
"The EROEI of nuclear is extremely positive"
Do you have evidence to support that? I was under the impression that it's below 10:1.
Interesting post and interesting discussion...straight to the 'heart' of TOD.
I suppose it would be possible to attempt to project the maximum possible feasible extraction of all FF resources (lots of stuff embedded in the words 'possible and 'feasible' and 'resources') from here to the 'end' of FF.
Several projection 'curves' could be made, depending on the assumptions made for each:
For example, how much of each resource (NG, coal, oil) will be burned in heat engines, and how much will be converted to a different chemical state (i.e. CTL, GTL)...how much coal will be burned to create electricity to power EVs and electrified rail transport? How much FFs will be used to construct solar, wind, and nuclear energy generation? What will the population projection and energy use per capita look like? How much FFs will be converted to 'biofuels'?
Other assumptions: URRs for oil sand, shale oil (not oil shale), and Vz 'extra heavy oil' and coal and NG.
Should we go for the harder stuff (arctic NG, Alaskan and Albertan coal, etc) first, then deplete the lower-48 remaining resources towards the end, or can we do it the 'natural' way, ...will we have the ability to extract the easier stuff first, then go for the harder stuff towards the end?
Of course, I recognize for the purposes of this musing I am ignoring the AGW and other pollution effects to simplify the discussion.
Kind of like an energy/population=specific LTG analysis.
quick note: the link to "Wikipaedia" for oil reserves nomenclature ends up going to
http://www.theoildrum.com/node/estimates
since it was just href="estimates"
which gives a "not found" error,
and is not the wikipedia.
maybe something like?
http://en.wikipedia.org/wiki/Oil_reserves#Classifications
Can someone explain where / how new oil (and coal and natural gas for that matter) discovery rates are determined / tabulated? I have seen numbers indicating that we consume 5 times more FF's than we discover but it would be nice to see this in real numbers like the BPSR.
Null – To understand the answer we need to split the question up.
US discovery volumes/rates: SEC regs require independent third party analysis of newly discovered reserve volumes. Companies naturally push for the max number but there is a limit to how optimistic the auditors will go. But no one audits the rate increase attributed to new discoveries. There’s also the time lag factor. A company may make a 300 million bbl discovery in the GOM DW but it could be 5+ years before it star producing. And then another 5+ years to learn the field recover significantly less than 300 million bbls…and rarely more.
US private companies: during 37 years working for private companies I’ve not once seen any release of data regarding their discovery volumes. This includes my current company which drilled almost $300 million in wells its first 3 years of existence. And for the same simple reason virtually no private company does: it ain’t anybody’s dang business. LOL.
The rest of the world is essentially split 3 ways: pubcos, privcos and NOC’s (national old companies). The very short answer: there’s no way to verify their numbers with any degree of certainty. You either accept them on face value or not.
This is a very good assessment of the problems with the BP Statistical Review. As it shows, the problems are many and varied. The Review is free, and you get what you pay for. The problem for most readers is that it is commonly used by observers and many people in the media just because it is free. Nobody except a giant oil company can afford to pay what it takes to collect the data. The trouble with a giant oil company is that it doesn't do anything for free, so BP will put a political spin on the data.
The assessment of the Canadian and Venezuelan oil sands reserves is getting to be a serious problem with the BP Review. These non-conventional oil reserves are - in reality - each about the same size as the world's reserves of conventional oil, which is going to make it a big, BIG problem for the BP Review as the conventional oil reserves run out. BP has never really known what to do with these reserves since they don't fit into any conventional oil cubbyhole. It used to just ignore the Canadian oil sands reserves, but that became untenable as Canadian production and exports to the US increased because it appeared that a lot of Canadian oil production and US imports were coming out of nowhere, rather than from an established oil reservoir.
Now they have decided to book oil sands as conventional oil reserves and add them to the world oil total, which is equally misleading. They should do what the Canadian authorities do, which is segregate them into a separate category - Canada calls it "Bitumen", Venezuela "Extra-Heavy Oil". (In making this distinction, the Venezuelan government is trying to conceal the fact their extra-heavy deposits are quite similar to Canadian bitumen deposits, i.e. much tougher, slower, and more expensive to develop than conventional ones.)
Since the economics of oil sands are vastly different than conventional oil, production problems vastly more difficult, and the timelines greatly longer it is important to make a distinction between non-conventional oil (oil sands) and conventional oil. Just adding oil sands to the conventional oil total makes it appear that the future of world oil production is going to be a lot simpler, quicker, and easier to deal with than it really will be.
"Russian Energy Minister, Alexander Novak, stated that over the coming 10-20 years, the country's oil output could decline to 370 million tons, from 500 million tons, reported Xinhua News.
Novak added that the drop could happen if the country doesn't attract enough investments in the industry, particularly, in the new off-shore and tight oil fields."
That's not a forecast of a decline, that's a standard industry warning that there is a risk of decline, if they don't get needed investment.
IOW, "give us more money, or production could decline".
That's not at all consistent with the production decline shown in Chart 27. Heck, even the -26% by 2027 midpoint of the warning is well to the right of the forecasted production curve.