| ASPO-USA Conference, November 30-December 1, Still Time to Register | The Oil Drum | Russian Oil Production to 2020 |
Oil Watch - OPEC Crude Oil Production (IEA)
Posted by Euan Mearns on November 28, 2012 - 3:45pm
Executive summary
OPEC is currently pumping at close to near term and historic highs of 31.2 mmbpd of crude oil. Outside of Saudi Arabia, the majority of spare capacity is deemed to lie in Iran and Nigeria. Iran could certainly pump more if permitted to do so by the international community. It is doubtful that Nigeria could. The UAE Kuwait, Qatar, Libya, Algeria and Venezuela are all pumping at close to capacity levels. Saudi Arabia alone has meaningful spare capacity of 2.1 mmbpd.
Embedded in the production stack (Figure 1) is an intriguing tale of general strike, international conflict, civil war and sanctions combined with masterly control of oil supply that has kept global markets in balance.
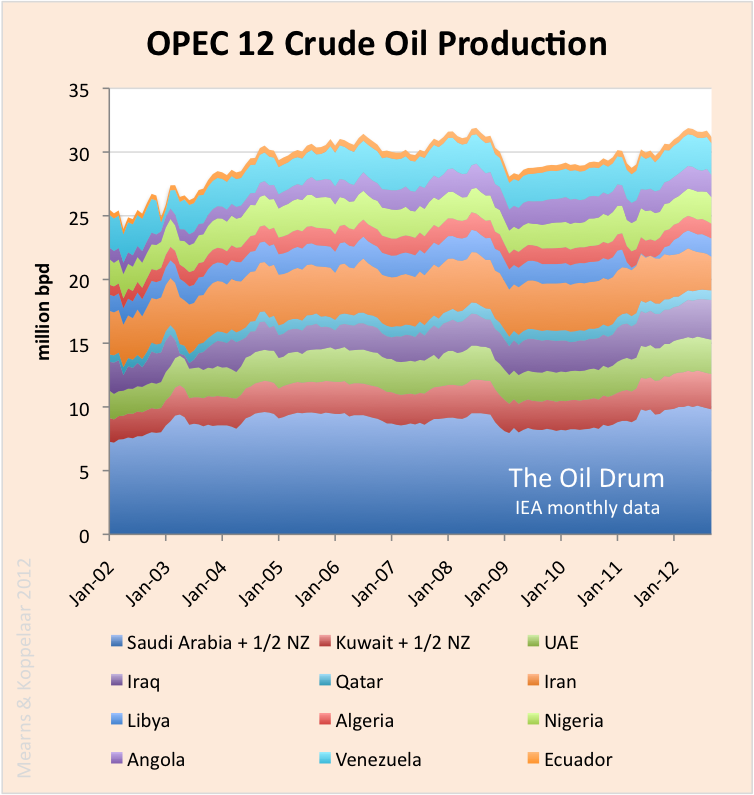
Figure 1 Monthly crude oil production for 12 OPEC countries. All data published in this interim report are taken from the monthly IEA Oil Market Reports.
From May 2007 to August 2010, Rembrandt Koppelaar published an e-report called Oil Watch Monthly that summarised global and national oil production and consumption data from the International Energy Agency (IEA) of the OECD and Energy Information Agency (EIA) of the USA. This is the second in a series of new Oil Watch reports, co-authored with Rembrandt and details crude oil production data for 12 OPEC countries (includes Angola and Ecuador, excludes Indonesia) as reported by the International Energy Agency. Earlier editions:
Spare Capacity
The existence and size of OPEC spare capacity is the subject of some controversy and debate. The spare capacity data reported by the IEA are shown in Figure 2, exceeding 7 mmbpd in 2002 and reaching a low point of 1.2 mmbpd in September / October 2004 that coincided with the onset of rapidly rising oil prices. One thing is clear - at times of over-supply OPEC withholds production to support price illustrated by the >>5 mmbpd rise in production between January 2002 and October 2004 (Figure 1) with the corresponding decline in spare capacity (Figure 2). And again in 2008, following the financial crash, production was reined in by Saudi Arabia, the UAE, Kuwait, Qatar, Iran, Libya and Algeria to compensate for declining demand for oil (see following sections).
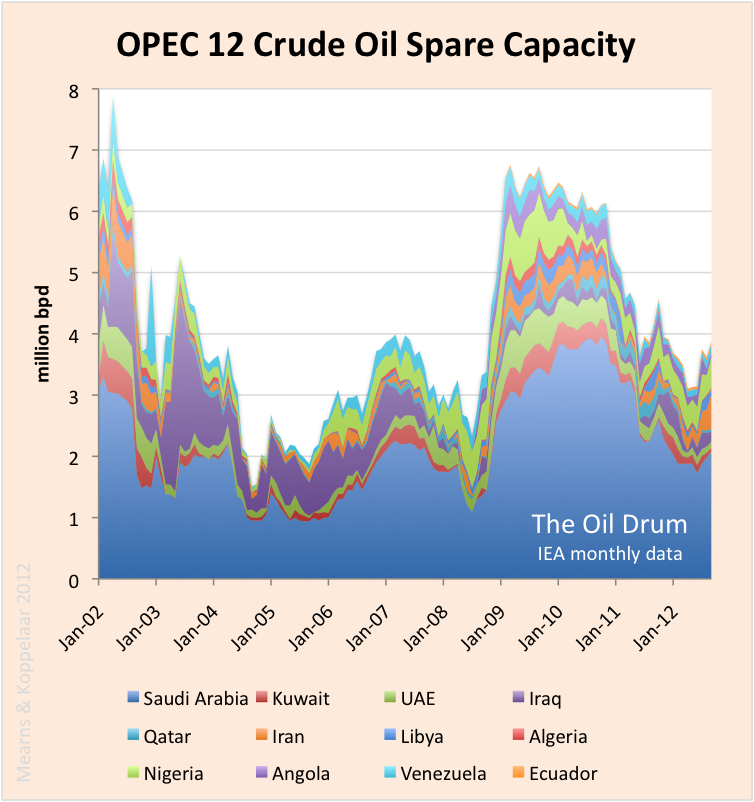
Figure 2 Spare crude oil production capacity for 12 OPEC countries.
Adding spare capacity to the production stack shows how spare capacity compensates for the ups and downs of OPEC production that aims to keep global oil markets in balance (Figure 3). Total capacity rose from 31.8 mmbpd in January 2002 to a plateau level of 35 mmbpd in June 2009.
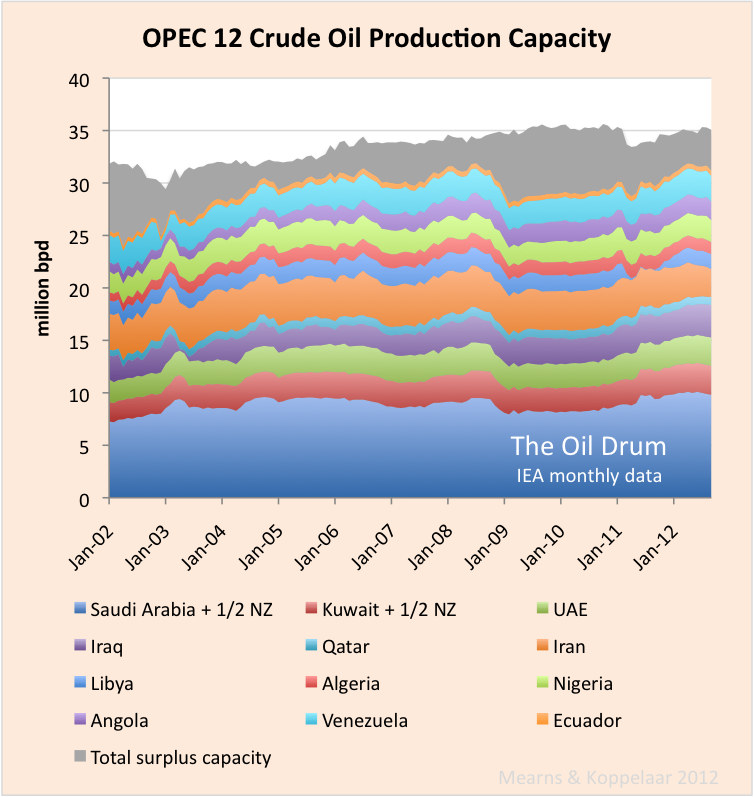
Figure 3 Total crude oil production capacity for 12 OPEC countries obtained by superimposing the spare capacity plotted in Figure 2 upon the production stack shown in Figure 1.
Figure 3 shows how spare capacity is pinched out over the production highs and the question remains as to whether OPEC actually has real spare capacity at those times. Outside of Saudi Arabia the majority of spare capacity currently resides in Iran and Nigeria. The former is subject to sanctions and the latter to ongoing civil / tribal unrest and it does not seem likely that either country could or would be allowed to boost production to meet ongoing strong demand.
The total capacity chart (Figure 3) shows a remarkably smooth development considering the turmoil in many OPEC countries. The small dip in 2002 shows the impact of a national strike in Venezuela and the small dip in 2011 reflects the civil war in Libya. Loss of Iraqi production during the 2003 war was largely compensated by a rise in Saudi, UAE and Kuwaiti production.
Saudi Arabia
Saudi production data includes 50% of the Neutral Zone between Saudi Arabia and Kuwait which currently produces 600,000 bpd of mainly heavy oil. Total Saudi capacity remained remarkably constant from 2002 to 2008 at around 10.5 mmbpd. In 2009 / 10 capacity rose to a peak of 12.3 mmbpd in August 2010 as a result of new fields being developed and has since been in slow decline. Most recent announcements by Saudi Arabia on future developments is to maintain capacity at 12 mmbpd where new developments will simply compensate for declines in aging supergiants.
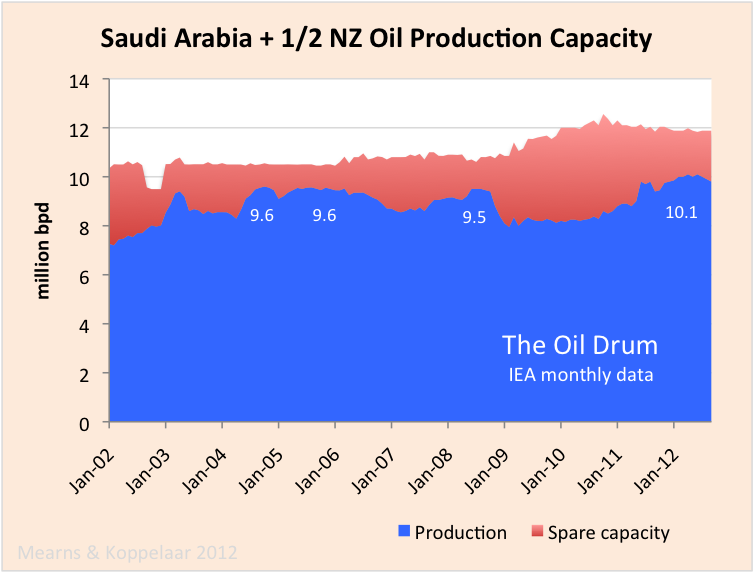
Figure 4 Crude oil production data and spare capacity for Saudi Arabia. The reason for the dip in spare capacity shown in 2002 is unknown. The production peaks are annotated, the recent broad peak of 10.1 mmbpd comfortably beating the previous records.
UAE, Kuwait and Qatar
The United Arab Emirates, Kuwait and Qatar all show a similar development in crude oil production and spare capacity since January 2002. Each country has shown only small growth in total capacity over the period. From 2002 to 2005 production grew in each country at the expense of spare capacity and from 2005 to 2008 spare capacity was small and likely non-existent. Each country reduced production following the 2008 financial crash but since then production has once again grown and spare capacity has been squeezed. Since 2008, Qatar is somewhat different since production has declined and the IEA now interpret Qatari spare capacity to be close to zero. This will be something to watch in the coming months and years.
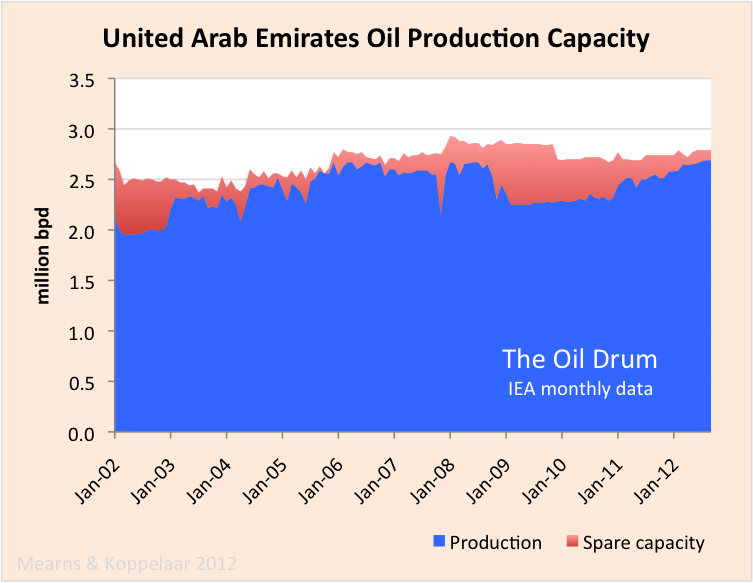
Figure 5 Crude oil production data and spare capacity for the UAE.

Figure 6 Crude oil production data and spare capacity for Kuwait including 50% of the neutral zone production.
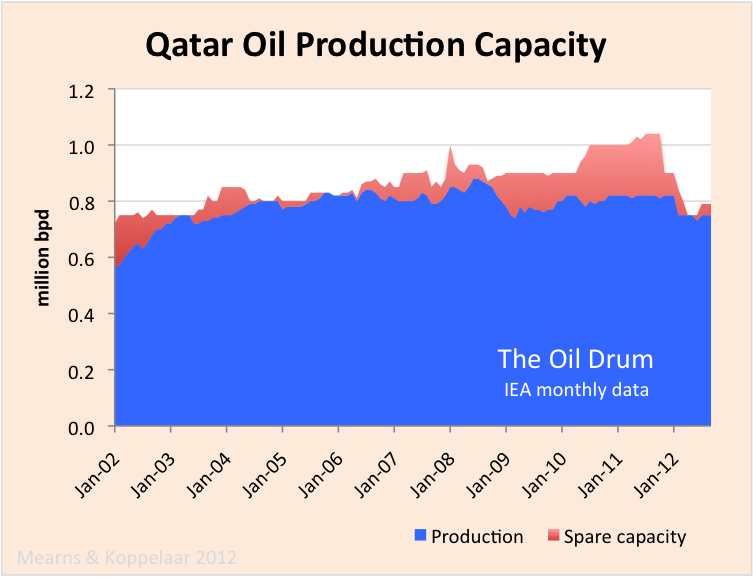
Figure 7 Crude oil production data and spare capacity for Qatar.
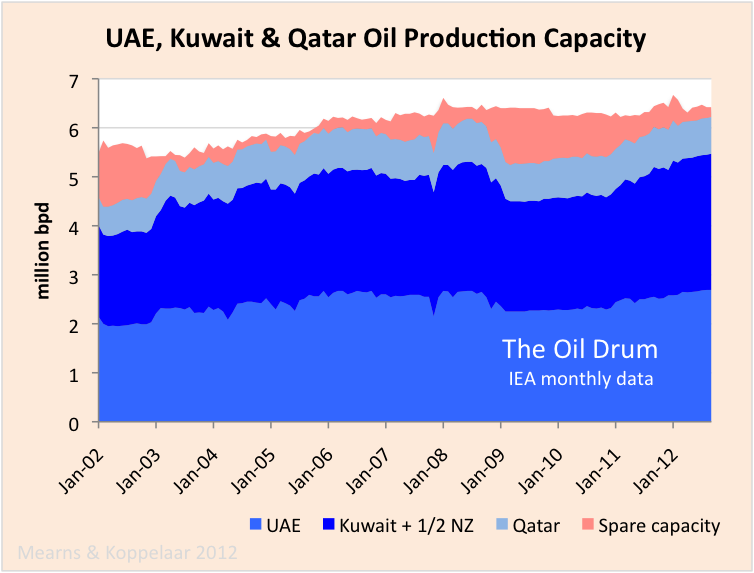
Figure 8 Crude production and spare capacity for the UAE, Kuwait and Qatar.
Iraq
According to BP, the historic high for Iraqi C+C+NGL production was 3.49 mmbpd in 1979 prior to the Iran-Iraq war. Pre-2003 war and invasion Iraqi total capacity was interpreted to have dropped to 2.8 mmbpd and during the subsequent years of occupation capacity settled on a lower figure of 2.5 mbpd. Decades of conflict have scarred the Iraqi oil industry.
A post war oil production low of 1.5 mmbpd was recorded in January 2006 but since then production has grown steadily to a recent high of 3.12 mmbpd recorded in September 2012. This growth at first came from reinstating production from spare capacity but since January 2008 it has come from building new capacity. It is difficult to predict where Iraqi oil production is headed but the IEA forecast 6.1 mmbpd by 2020.

Figure 9 Crude production and spare capacity for Iraq. The sharp decline in production during 2003 was caused by the 2003 war and invasion. The loss of 2 mmbpd from Iraq was compensated by a rise in production in Saudi Arabia, the UAE and Kuwait.
Iran

Figure 10 Crude oil production and spare capacity for Iran.
Iranian crude oil production capacity remained constant at around 4 mmbpd from January 2002 to around September 2010, producing close to capacity for much of this period. Since September 2010 the impact of sanctions have begun to bite and as of September 2012 production stood at 3.2 mmbpd and falling fast. It is worth noting that declining Iranian production is matched by rising Iraqi production. Should Iranian production continue to fall and Iraqi production continue to rise, at some point the global oil supply system should be able to absorb the loss of Iranian production all together.
Libya
From January 2002 to 2008 Libyan oil production was rising owing to the participation of OECD companies in that country. Production was cut following the financial crash of 2008 but then in March 2011 Libya went off line during the civil war with over 1.5 mmbpd lost. Libya was offline for about 11 months and production has not yet recovered to pre-conflict levels. It seems possible that without the participation of foreign companies and capital that Libyan production may enter a prolonged period of decline.

Figure 11 Crude oil production and spare capacity for Libya.
Algeria
Algeria has also permitted the participation of foreign companies in exploration and field developments and it has an overall production history similar to its N African near neighbor Libya, apart from the absence of a civil war. Algerian production rose at the beginning of the period, produced at capacity from 2005 to 2008, cut production following the financial crash but has not managed to regain the pre-crash highs. Production took a 150,000 bpd step down in early 2012 and spare capacity is currently deemed to be close to zero. It seems that Algeria may be struggling to maintain the pre-2008 production levels.

Figure 12 Crude oil production and spare capacity for Algeria.
Nigeria
The Nigerian oil industry is to large extent operated by the International Oil Companies within a framework prescribed by the Nigerian government, OPEC and tribal anarchy. Production has been largely flat over the decade, either side of 2 mmbpd. In September 2012 spare capacity was logged at 510,000 bpd and it seems unlikely that Nigeria could call on that capacity at short notice.
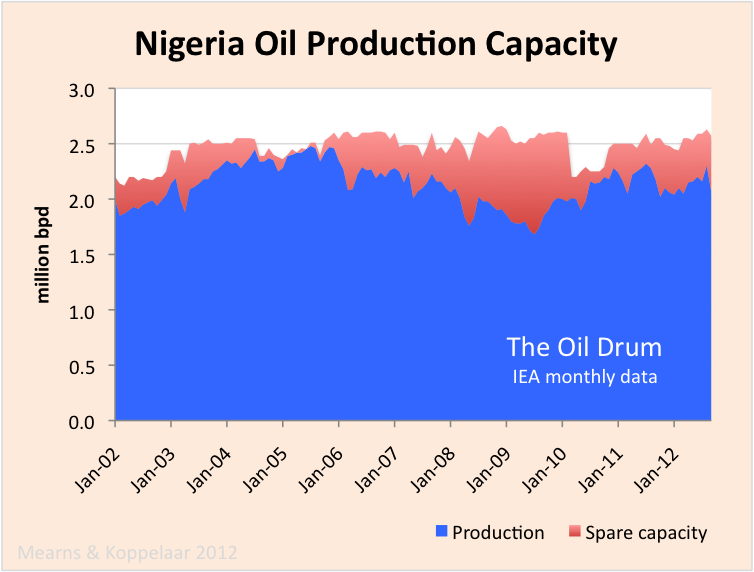
Figure 13 Crude oil production and spare capacity for Nigeria.
Angola
Angola joined OPEC in 2007. Most of Angola's oil production is off shore and is operated by the International Oil Companies. As new offshore fields came on stream, Angola's production rose from 920.000 bpd in January 2002 to 1.9 mmbpd in July 2008. Since then, production has fluctuated moving sideways and down. The IEA has progressively cut their view of spare capacity and it seems doubtful that Angola actually has withheld production at the present time.

Figure 14 Crude oil production and spare capacity for Angola.
Venezuela
OPEC stalwart and heavy weight Venezuela has had flat production over the decade of between 2 and 2.5 mmbpd. The impact of the 2002/ 03 general strike upon production is clear to see. Production has been hitting near term highs over 2.5 mmbpd and spare capacity is essentially zero.
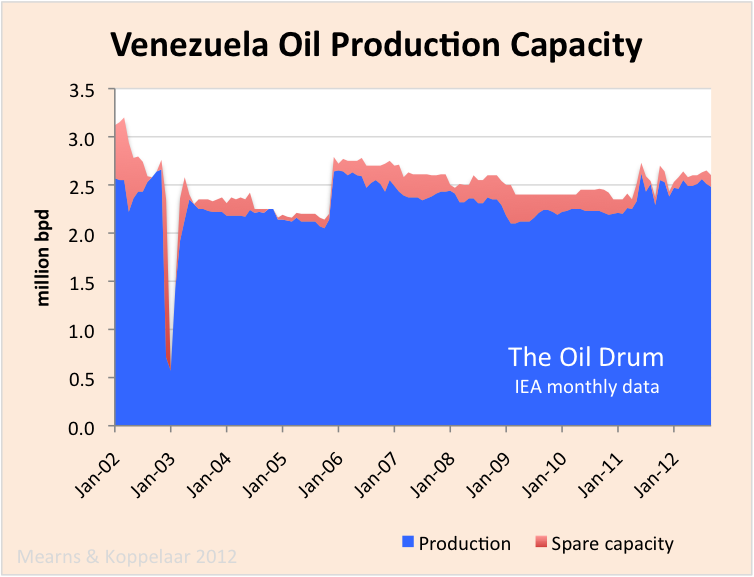
Figure 15 Crude oil production and spare capacity for Venezuela.
Ecuador
Ecuador rejoined OPEC in 2007 and with production of only 500,000 bpd is the baby of the bunch. Production appears to be on plateau / slow decline.
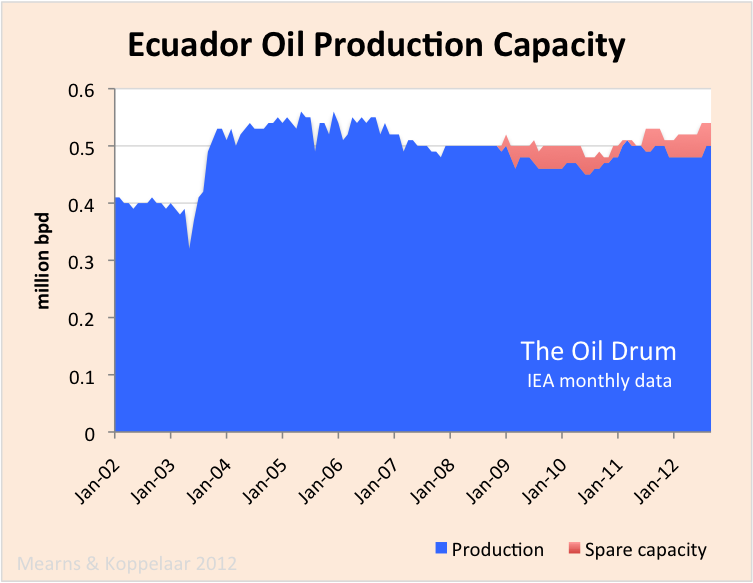
Figure 16 Crude oil production and spare capacity for Ecuador.
Natural Gas Liquids
Finally, to complete the OPEC picture, we need to look at natural gas liquids (NGL). The IEA report country specific crude oil data for OPEC members but only aggregate NGL data for the OPEC group. I am unsure whether OPEC condensate is monitored by the IEA.
OPEC NGL production has grown from 3.0 mmbpd in February 2002 to 6.3 mmbpd in September 2012. A significant component of that growth likely comes from North Field gas production in Qatar.
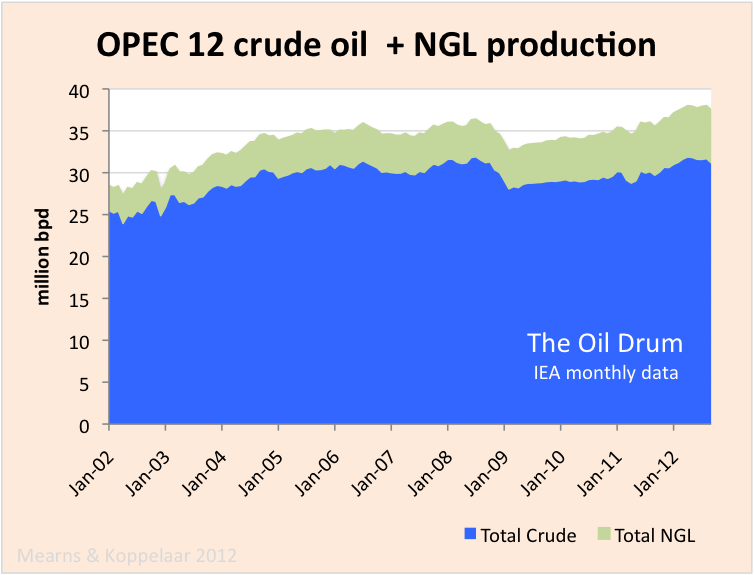
Figure 17 OPEC12 crude oil and NGL production.
Contact
- Content: editors at theoildrum dot com
- Tech support: support at theoildrum dot com
License

This work is licensed under a Creative Commons Attribution-Share Alike 3.0 United States License.
Indonesia
Of course, Indonesia, a founding member of OPEC, is now a member of AFPEC, Association of Former Petroleum Exporting Countries. It would appear that their final production peak was in 1991, at 1.70 mbpd (BP, total petroleum liquids). Six years later, in 1997, they had shown a modest production decline, down to 1.56 mbpd, but their consumption had increased from 0.69 mbpd in 1991 to 1.03 mbpd in 1997. As a result, their net exports fell from 0.98 mbpd in 1991 to 0.53 mbpd in 1997.
What I have labeled as the Export Capacity Index (ECI, or ratio of total petroleum liquids production to liquids consumption) fell from 2.41 in 1991 to 1.52 in 1997. If we extrapolate this six year rate of decline in their ECI ratio, they would approach zero net oil exports around 2003, which in fact is what happened. Extrapolating the six year rate of decline suggests that Indonesia's post-1991 CNE (Cumulative Net Exports) would be about 1.8 Gb. The actual number was 2.1 Gb.
Note that in 1997, after showing an 8% decline in production, an annual decline rate of 1.4%/year, they had already shipped 75% of post-1991 CNE. The post-1991 CNE depletion rate in the six year period from 1991 to 1997 was 23%/year, even as production declined at only 1.4%/year.
Saudi Net Oil Exports
The following graph shows the ECI ratio (ratio of domestic total petroleum liquids production to liquids consumption, BP) for Saudi Arabia, from 2002 to 2011:
The observed 2005 to 2008 net export decline rate was 2.7%/year, as Saudi net exports fell from 9.1 mbpd in 2005 to 8.4 mbpd in 2008.
The 2005 to 2008 rate of decline in the ECI ratio (6.5%/year), suggested that Saudi Arabia would approach zero net oil exports around 2032, with estimated post-2005 CNE (Cumulative Net Exports) of about 41 Gb. I estimate that the 2005 to 2008 post-2005 Saudi CNE depletion rate was about 8.3%/year.
The observed 2005 to 2011 net export decline rate slowed to 1.5%/year, as Saudi net exports fell from 9.1 mbpd in 2005 to 8.3 mbpd in 2011 (with lower values in intervening years).
The extrapolation on the preceding Saudi graph is based on extrapolating the 2005 to 2011 decline in the Saudi ECI ratio. The 2005 to 2011 rate of decline in the ECI ratio (6.0%/year), suggested that Saudi Arabia would approach zero net oil exports around 2034, with estimated post-2005 CNE (Cumulative Net Exports) of about 45 Gb. I estimate that the 2005 to 2011 post-2005 Saudi CNE depletion rate was about 8.0%/year, with estimated remaining post-2005 CNE of about 28 Gb.
The $64 Trillion Question
The above Saudi estimate, based the six year decline in their ECI ratio, seems to be impossibly pessimistic, but then one has to ask the following question: Why would the Saudi net export profile be materially different from what other prior case histories, with similar ECI declines, have shown? (Note that there are certainly case histories of temporary ECI declines, e.g., the Saudis themselves in the early Eighties, in response to falling oil prices, but the 2005 to 2011 decline in their ECI ratio corresponded to a doubling in annual Brent prices.)
When you add everything up - production numbers, production/exports (ECI or other used term), low quality reserves coming online and high quality reserves coming offline (EROEI), you come to the simple conclusion:
Net energy available to non-exporting countries is in terminal decline and that will last for about the next 150 years.
The only real question is, who is going fight the hardest for, and win the biggest slices of, the ever decreasing resource pie?
To answer your 64 trillion dollar question, things are different in OPEC than the rest of the world:
In the rest of the world after you pump out a huge amount of oil, reserves go down (with a few exceptions of huge new discoveries).
In OPEC, no matter how much you pump out reserves go up (even when announcements of new discoveries are few and far between)!!! It's a miracle!!!
So ever OPEC nation is producing flat out except Saudi Arabia?
I was just wondering who calculated this number of 2.1 million barrels per day and how confident are you that it is correct.
Saudi crude only oil production in kb/d. The last data point is October 2012. The data was collected from OPEC's Monthly Oil Market Report.
From January 2009 until November of 2010 Saudi Arabia had about 1.5 million barrels per day of spare capacity. Now, according to Sadad Al Husseini, a former executive at Aramco, Saudi is producing flat out.
Ron P.
Not very.
A good honest reply, thank you for putting this information together. I don't think anyone has the definitive accurate assessment of countries in OPEC in general. That seems to be one of the purposes to the Oil Drum, to try to make the picture clearer.
Well if you watch each country's production very closely, and I do, you can get a general idea of what they are trying to do. After the price of oil crashed in the fall of 2008, OPEC cut production by almost 3.5 million barrels a day with almost every country participating in that cut. But one year later every country except Saudi, UAE and Kuwait were back to producing flat out. And those nine countries have been producing flat out ever since.
Then in February 2011 the revolution in Libya hit and their production dropped to near zero and Saudi, UAE and Kuwait ramped up production to make up for the Libyan decline. Then by late Spring 2012 Libyan production was back to flat out, though still not quite up to pre revolution levels.
By early summer 2012 every OPEC nation was back to producing flat out. I think it quite silly for the IEA to continue to insist that OPEC nations, other than Saudi, have any spar capacity at all. And obviously when a former high official in Aramco says that "Saudi is producing flat out" we should take him at his word. Every nation in OPEC is today producing every barrel of oil they possibly can produce. (Except for Iran where the embargo is keeping some oil off the market.)
Saudi, UAE and Kuwait and The Other Nine crude only production, crude only, in kb/d. Last point is October 2012. The data is from OPEC's Monthly Oil Market Report.
It may be of interest to some that "The Other Nine" peaked in December of 2007 and have been in gradual decline ever since.
Ron P.
How confident are you that a quote attributed to Sadad Al Husseini that "Saudi production is flat out" means that Saudi production is at capacity ?
I know that is what you want to believe, but are you willing to say that Saudi production won't exceed the current level(before Manifa production is started-up, of course)?
I was very confident that Saudi was producing flat out before I read the Al Husseini quote. Of course Saudi production will gyrate within a few thousand barrels per day. Maintenance and a lot of other things affect their month to month production. So of course Saudi production may exceed what they produced in October.
Saudi production in October, according to the MOMR's "secondary sources" was 9,695 kb/d, down 231 kb/d from their peak of 9,926 kb/d in June 2012. However the OMR reports that "direct communication" with Saudi puts their production at 9,724 kb/d in October, down 378 kb/d from their "direct communication" peak of 10,102 kb/d in April 2012.
I don't really think they will produce more than 10 million barrels per day before Manifa comes on line and it is not likely they will do it even then. It is interesting to note that Saudi is saying Manifa will increase its production capacity from 11 mb/d to 12.5 mb/d. Saudi says world’s 5th largest field to be ready in 2014
In other words Saudi is saying that they have just over 1 mb/d of spare capacity today and are looking to Manifa to increase that to what the IEA says they already have. But really Manifa will not likely cause any increase n Saudi production, it will only mask their decline for a year, possibly two years. Manifa: Saudi Arabia’s last giant, a confirmation of commodity constraints on global growth.
Current decline in Saudi's old fields is somewhere between .5 and 1 mb/d per year. Shaybah and Khurais have recently been covering that decline. Now they have Manifa and hopefully that will mask their decline for a year or two. Then decline from that point on.
Ron P.
Hi Ron,
I agree that Saudi output of C+C won't rise much above 10 Mb/d before Manifa comes online, after that I think they have a shot at 11.5 Mb/d.
Your guess at future Saudi output is brave, many have made such predictions in the past and Saudi Arabia continues to surprise. Few at the oil drum would have predicted in 2008 (including me) that Saudi Arabia would still be able to produce over 9.5 Mb/d of crude plus condensate for several months in 2012. From EIA data C+C was 9.9 Mb/d for the first 6 months of 2012.
When you suggest that Saudi Arabia is unlikely to produce over 10 million barrels per day in the future, I assume you mean crude plus condensate only(NGL, other liquids and processing gains not included) and that this level would be maintained for 3 months or more.
A more conservative forecast would suggest that Saudi Arabia will never reach the 11.5 million barrels per day of crude oil capacity that they will have after Manifa comes online fully. My guess is that you expect declines from older fields will reduce capacity by at least 1.5 Mb/d by the time Manifa reaches full output so that capacity will remain about where it is now.
If Iraq increases capacity at close to the level expected by the IEA (which I doubt), there will be less pressure on Saudi Arabia to be the supplier of last resort and you would be more likely to be correct.
Let's assume Iraq increases output much less than the central IEA scenario (following the lower output scenario). If the world economy does not go into terminal decline due to rising energy costs and financial crisis so that there is demand for oil at current real oil prices, I think Saudi Arabia may be able to maintain current capacity for five more years. In that case, the Manifa project would increase capacity by 1.5 Mb/d to about 11.5 Mb/d.
If they do, they might be able to reach 11.5 Mb/d if Manifa goes as planned. After 2017 I am doubtful that they could reach that level even under the rosy outlook I have outlined.
I am not sure if spare capacity is defined by the IEA as crude, crude plus condensate or all liquids. If they are talking about all liquids (the EIA's "total supply"), then Saudi Arabia has been around 11.5 Mb/d for most of 2012, according to the EIA, and 1 Mb/d of spare capacity would get us to the 12.5 Mb/d the IEA claims.
From an EIA "total supply" perspective, I doubt Saudi Arabia will produce more than 13 million barrels per day for a consecutive 3 month period in the future.
This is much less brave than Ron's prediction and is equivalent to predicting no more than 11.5 Mb/d of crude plus condensate for a three month period(assuming that NGL, other liquids, and processing gains don't increase from 2012 levels.)
Time will tell.
DC
Now that will be a trick sure enough. Manifa will bring 900 kb/d on line in three stages, over three years. And you expect that to raise their production by 1.5 mb/d? I wonder how they are going to pull that off?
I am not just surprised, I am shocked! Shocked that they are not producing a lot more. Go to Oil Megaprojects and look at all the new projects Saudi has brought on line. Since 2003 Saudi has brought 4,000,000 barrels per day of new oil. 2,710,000 barrels has been brought on line just since 2008. Yet they have only managed to keep production at relatively the same level they reached in 2008! Now that is shocking.
Well actually it is not all that shocking. I was being a little over dramatic. ;-) There is a really good reason that, even with all that new production, their production has not increased. Their decline rate is about 700,000 barrels per day per year.
Country Analysis Briefs: Saudi Arabia
However Saudi said in another article, that with massive infill drilling, they had gotten that decline rate down to near 2 percent. That was in 2006 however and while infill drilling can decrease the decline rate it increases the depletion rate. I would bet that even with all that infill drilling the decline rate is back up to near 5 to 8 percent now.
As far as Iraq goes, I agree with this analyst who writes for Forbes.
Iraq's Rise To No. 2 Oil Producer In OPEC Is Bad News For World
And yes, all my prognostications are for Crude + Condensate only. I don't count bottled gas as oil. My OPEC charts are crude only however. They are from the OPEC Oil Market Report and that is just the way they publish the data. Condensate is not included in their quota system so they report crude only.
Ron P.
Here are the Saudi normalized ECI values for 2005 to 2011, with 2005 level set to 100% (ECI = Ratio of total petroleum liquids production to liquids consumption, BP).
2005: 100%
2006: 94%
2007: 86%
2008: 82%
2009: 69%
2010: 65%
2011: 70%
At 18% (ECI value of 1.0, versus 5.6 in 2005), they would hit zero net oil exports.
As I said time will tell. I wouldn't be surprised at 10.9 Mb/d, but they produced close to 10 this year, claim they have 1 Mb/d of spare capacity (maybe its only 0.6 Mb/d) and will be adding .9 Mb/d (note that earlier you said it was 1.5 Mb/d) so if they can maintain current output with infill drilling, etc. maybe they will hit 11.5 Mb/d. Many have said they could not keep it up in the past, eventually they will be correct.
DC
Then, not now! I said: "From January 2009 until November of 2010 Saudi Arabia had about 1.5 million barrels per day of spare capacity. Now, according to Sadad Al Husseini, a former executive at Aramco, Saudi is producing flat out." That's right, now they have zero spare capacity, not 1.5 mb/d.
They are not maintaining current output with infill drilling. You, again, misread what I said. They claimed in 2006, that with infill drilling, they had gotten their decline rate down to almost 2 percent. But now it is likely quite a bit higher. They got their decline rate down to zero by bringing 2.7 million barrels per day of new oil mostly from Shaybah, Khurais.
Now they are bringing nothing on line and their decline rate is likely around 700,000 barrels per day per year. It is very unlikely that Manifa will make up for the current decline, especially since it will be well over one year before a single barrel is produced from Manifa. Even if their decline rate is only half that then Manifa will still not make up the difference.
Ron P.
Where is Saudi Aramco doing massive infill drilling ?
Tony, you and I have been down this road before: Tech Talk - Saudi Arabia Then and Now
Saudi Arabia’s Strategic Energy Initiative This was posted in 2006.
Saudi Arabian Rig Count

Notice that this accelerated drilling occurred right at the time (2005-2006) when they said they were spending billions in order to stem their decline rate.
And if you want proof of this drilling in Ghawar, you can find it here: Sattellite Oer The Desert
Ron P.
Interesting SA's "massive drilling program" uses 1/4 of the number of rigs that are in North Dakota.
waterman,
When it comes to rig counts, the US is in a world of its own. The US has more than half of the worlds drilling rigs, 1834 out of a total of 3458, as of October this year. It just goes to show how hard the US is working to maintain their production.
From what I have heard from people working in Saudi, Aramco is looking for every rig they can lay their hands on. They need to drill!
http://files.shareholder.com/downloads/BHI/2189783602x0x612220/16B283E1-...
Why don't we see an increase in rigs in KSA?
We do. Saudi Arabia Increasing Rig Count 28%, Baker Hughes CEO Says
The end of the year they are talking about is the year 2011. And then we have this dated Sep. 2012:
Saudi Arabia Has About 98 Onshore Drilling Rigs, Shoaibi Says
This is dated June 2012 and includes both onshore and offshore rigs.
Aramco to Raise Rig Count to Focus on Unconventional Gas
Ron P.
Waterpowerman - Rig count doesn't translate well to production. The KSA doesn't release details but my WAG is that one rig drilling in the KSA adds many times the rate and reserves as a ND well. And have a much better future. The range is huge. I just drilled 3 wells in Texas that will produce about 160 bopd total and around 140k bo. I can drill 3 Deep Water GOM wells that produce 30k bopd total and add 15 million bbls. Same 3 well count...very different result.
Hi Ron,
You said,
So you are correct that you did not say that Manifa would increase capacity by 1.5 Mb/d, but the above quote implies that Saudi Arabia claims that production capacity will be increased by 1.5 Mb/d rather than 0.9 Mb/d.
I am not claiming that Saudi Arabia will never decline, I think they will increase their depletion rate in an attempt to keep oil prices from rising too high if demand from emerging economies starts pushing up prices. Eventually there will be a technical limit to how high the depletion rate can rise, at that point the decline sets in and it may be quite steep.
You may think Saudi Arabia has already reached the point where depletion rates cannot rise any further, my guess is that it is about 5 years away.
Note that Hubbert Linearization from 1993 to 2011 using monthly EIA data and cumulative production of 68.5 Gb up to Dec 31, 1992 points to a URR of 220 Gb for Saudi Arabia. If the 2012 production rate continues at 9.9 Mb/d the depletion rate for 2012 would be about 4 %, if Saudi output linearly increases to 11.4 Mb/d in 2017, the depletion rate would rise to 6 %. These may be conservative because HL has tended to underestimate the URR for Saudi Arabia in the past.
If we use a higher URR of 240 Gb, which is the upper end of the 95 % confidence interval, but leave the other assumptions presented above the same,
the depletion rate is 3.3 % in 2012 and 4.7 % in 2017.
I am using Colin Campbell's definition of depletion rate which is annual production divided by reserves not yet produced. See http://www.greatchange.org/ov-campbell,outlook.html
DC
Yes I know what Saudi said about production capacity and Manifa raising it by 1.5 mb/d when they are claiming Manifa will only produce .9 mb/d. That was the very reason I quoted it, because it simply makes no sense whatsoever. But then what would you expect?
I don't put much faith in Hubbert Linearization for Saudi Arabia simply because there were so many years when Saudi deliberately cut production. I think Hubbert Linearization is only valid if a country produces flat out all the time. HL is just a rough guide and has its faults. It gives us a rough estimation of URR but only a very rough one. Different depletion rates for different kinds of fields can throw it off considerably.
Look, what you are doing is just giving it a WAG. And that is exactly what I am doing also. However I have been watching Saudi production for over ten years now and also reading everything ever published on the subject, both pro and con. I think my WAG is a very educated WAG. And that WAG is that Saudi is at the pinnacle of production and will began to decline well before this decade is out. And incidentally the IEA now expects Saudi production to fall also, though in the 2020s not in this decade. From Michael T. Klare in the Huffington Post:
The Good, the Bad, and the Really, Truly Ugly
Ron P.
EIA Iran Crude Oil and Lease Condensate Production, January 2000 to June 2012 (chart)
EIA Saudi Arabia Crude Oil and Lease Condensate Production, January 2000 to June 2012 (chart)
what I dont understand is a few years ago on TOD the experts did a bottom up analysis in Oil Megaprojects - new supply coming on
then combined this with the IEA survey which said decline in existing fields was about 5%
which indicated that by 2012 we would be well down the slope of declining production
and yet here we are chugging along in almost a steady plateau of 72MBD production for 5 years +
does that mean that many projects we unaccounted for in OM?
or decline rate was not what it seemed and IEA survey was wrong?
or new projects suddenly emerged with new technology?
or perhaps high prices drew forth new supply?
im just curious as to the possible error
I don't remember any such "bottom up analysis". However my memory may be fading a little. Could you please give us a reference so we can look it up? We need to know exactly what was predicted before we can ascertain exactly where any error in the TOD experts prognostications may lie.
Also just who are these TOD experts you speak of?
You may be thinking of a chart posted by "Ace" that showed non-OPEC production declining by now. However he was just one with one man's opinion. I really don't think there was ever an analysis by TOD "experts", implying more than one expert, ever done on TOD. However I could be mistaken. At any rate please give a better detail of exactly what analysis you are speaking of.
Ron P.
Hi Ron,
Edit: I misread the post thinking that Saudi forecasts were referred to rather than world forecasts. What follows looks at previous Saudi forecasts which was not the topic addressed by Ron that I replied to. Sorry to stray off topic but discussions of Saudi future output had been discussed previously so the post is misplaced.
What follows is my post before I realized my mistake:
My memory is somewhat fuzzy as well, so I looked at some old posts on Saudi forecasts. There are some pessimistic forecasts by Ace, which you mentioned and these have clearly underestimated Saudi output from 2007 to the present.
One of the best forecasts in 2007 was by Euan here:
http://europe.theoildrum.com/node/2910
He took a lot of flack at the time from WestTexas and others for example:
I also had done some HL analysis on Saudi Arabia despite the questions raised by Robert Rapier about its usefulness. For example this comment:
http://www.theoildrum.com/node/4792/439715
which proved to be too low. More recently I produced the following Saudi HL Plots:
https://sites.google.com/site/dc78image/images/sahl2010.png
https://sites.google.com/site/dc78image/images/ksahl2011.png
which shows that Rapier was correct about HL not being a solid method.
It would be interesting to hear what Euan thinks might happen to Saudi output in the future because his estimate was excellent in 2007.
DC
At a minimum, I think that Deffeyes, using HL, correctly picked a major inflection point in global crude oil production, when Yergin, circa 2005, was predicting a continued 3%/year rate of increase in productive "Capacity."
And in a similar fashion, it does appear that Saudi Arabia, after showing six years of annual crude production basically at, or below their 2005 annual rate of 9.6 mbpd, will probably exceed 9.6 mbpd in 2012 (EIA). Of course, at their 2002 to 2005 rate of increase in crude oil production, Saudi Arabia would have been at about 15 mbpd in 2011.
In any case, as noted up the thread, I suspect that in only six years it's possible that Saudi Arabia may have already shipped more than one-third of their post-2005 CNE (Cumulative Net Exports, total petroleum liquids).
As I have previously noted, a five year "Undulating Plateau" in production by the Six Country Case History countries* hid about a 50% decline in their combined post-1995 CNE.
I think that the relatively slow post-2005 decline in Global Net Exports (GNE) is hiding a catastrophic post-2005 Global CNE depletion rate, with the developing countries, led by China, so far at least consuming an increasing share of a declining volume of GNE.
*Indonesia, UK, Egypt, Vietnam, Argentina, Malaysia
Dcoyne78, apparently you also post under the handle "Polytropos" also. At any rate we are all trying to give it our best educated guess. And our education gets a little better each year.
Earlier I had underestimated the new fields that Saudi had to bring on line. I took Simmons' word that Khurais was almost tapped out. Well perhaps not but actual production from Khurais is still a closely guarded secret. I have no idea what they are getting from it except that with Khurais, and the oil from Shaybah and a few other much smaller fields they recently brought on line, they have managed to keep production at above 9.5 mb/d for this year.
I don't know what the future holds for Saudi production but if the Wiki Megaprojects is any indication they will not be able to hold current levels for much longer. They are counting on Manifa to keep production level but that is still over a year away and will come on line slowly, at about 300 kb/d per year for three years. I think their decline rate is higher than that.
It will be interesting to see what happens.
Ron P.
Ron,
I think the "secret" of Khurais production was the use of extensive fraccing. Not sure if that was advertised when Simmons wrote his book. But the trick with fraccing is it increases permeability in the local area, and can considerably increase the flow rate from each well, which as you only know too well speeds up depletion from the field. So we will have to see how long the production increases lasts, and whether Saudi has to has to run faster on the drilling tread mill as the decline rate increases after a relative short period of time.
As for Manifa, are there any major projects being mentioned to follow, or are they at the end of their major field developments? I can't say I have heard of anything.
Every major field they have, other than Shaybah which was discovered in the 90s, was discovered many decades ago. Manifa is the very last one to be brought on line. They have no more.
All of them, other than Manifa, was also brought on line many decades ago. Khurais was brought on line then put into mothballs due to low production.
Manifa was not brought on line due to the nature of the oil. It is heavy, sour and contaminated with vanadium. The oil is not really as bad as some articles would lead one to believe, yet it was bad enough that it would have been sold at a big discount to their other sweet stuff. And also recovering it is expensive as the current project shows. So they just held it off until the price justified it.
I am not sure about the Khurais fracking. I had not heard that before anywhere. The trouble was pressure I thought. This article is from April 2009.
Saudi Khurais Field: Looks Like Easy Oil May Be Gone from Arabia
Obviously "gallons" here should have been "barrels". Two million barrels per day is what they inject every day to get 1.2 million barrels per day of oil, if indeed that is what they are getting. Actually no one really knows.
List of Oil Fields
Ron P.
Ron,
I used the word "secret", tongue in cheek, but when I went looking for an article to backup my memory, it was hard to find. So here we go.
http://www.naturalhub.com/slweb/fading_of_the_oil_economy_oilfield_deple...
This is the reference used by Heading out. I am sure there are better references but they don't seem easy to find.
http://www.theoildrum.com/story/2006/8/25/22530/0433
Some circumstantial evidence I found,
Halliburton won the drilling contract, http://phx.corporate-ir.net/phoenix.zhtml?c=67605&p=irol-newsArticle&ID=...
The wells were single rather than multi-lateral wells,
I found two CVs for people who claimed to be working on the Khurais frac project.
Here is an extract of Halliburton's 2009 annual report, but it doesn't mention fraccing. Maybe it is a secret, lol.
It is strange how such a distinguishing feature of the Khurais project, such as fraccing, has been down played. To me when I first read about it a few years ago, it was the outstanding difference between the Saudi projects.
We will have wait and see how it all pans out
Toolpush, I don't know beans about drilling and fracking. But I suspect this is not the same kind of fracking they are doing in the Bakken. Khurais is a carbonate reservoir, not shale or sandstone. Fractures are a problem, not an asset. This article describes all the problems with fractures in Khurais. It is in the Oil & Gas Journal and clicking on the link will just get you an invitation to suscribe. But if you google the title it will bring up the article.
OGJ FOCUS: KHURAIS COMPLEX—1:
Fractures are a serious problem, especially in carbonate reservoir with water injection drive. They channel the water to the wellhead instead of oil.
I just really can't understand why they would be deliberately creating more fractures when they are such a problem. But then I am not an oil field geologist so what do I know?
Ron P.
Hi Ron,
I only post as dcoyne78. I agree it will be interesting to see what happens.
The country brief from the EIA that you linked to was interesting. Upon reading that, I think your estimate of no more than 10 Mb/d is probably correct.
My main point is that I had not expected in 2008 that Saudi Arabia would still be close to 10 Mb/d of C+C in 2012, I was wrong.
If Saudi Arabia can raise their depletion rate they might get to 11 or possibly 11.5 Mb/d after Manifa is fully online.
DC
Hi sorry for delay and no, there is only me posting under this name
I meant no disrespect and should have said contributors instead of experts because this is a crowd sourcing dialog, not a prediction, and there is value from the discussion.
(and note I am an observer, not a contributor)
The source, which I thought held the consensus at the time, was summarized in the graphs by Khebab
which combined many outlooks, and summarized them in mean, and mode, with confidence intervals
But I do think it would be useful to go back and note what has changed since the predictions of that time
new projects
projects overlooked
new technology
etc
which would help improve looking forward
Perhaps it was merely my imagination, but it was my understanding for some time that the general concensus on The Oil Drum when oil reached $147 barrel in July 2008, and the world economy collapsed that this was the first tickle of peak oil. This website is an open forum, so I won't pick names, call them experts, etc. but the culture of this site leaned toward the following hypothesis:
Oils unparalleled rise was the result of supply constraints, and Middle East (Iran) tensions. These factors were due primarily to a stagnant global oil supply since 2005 that led to a series of ever worsening oil price spikes every summer. The drop in oil prices would only exacerbate the decline of supply; if supply can't rise at $147 it CERTAINLY can't rise at $40-$60 (that price didn't last long!).
I'm not saying anyone was wrong, or pointing fingers (although, I was wrong, I'll readily admit that). Darwinian I must ask you, from July-November 2008 did you have moments where you thought "This is spinning out of control way faster than I'd fathomed, and its directly related to oil prices." To take it just a little further did you ever extrapolate what was happening and think, even for a second "By December 2012 peak oil will be undeniable, and accepted by policy makers".
I personally was and am shocked, truly shocked, that the American public and leadership still has no, zero, zip, notta of an inkling that the slow global growth of the last few years is directly attributable to historically high oil prices
US leaders (both political and intellectual) are well aware that high oil prices create a "headwind" for the economy, but the public has little awareness, due to media cooperation with the oil/FF industry's efforts to protect themselves from replacement.
US leaders (both political and intellectual)
we have intellectual leaders in the US?
The nature of the cooperation between media and FF industries is important to note. The media is a selling machine--that includes the news portion. It is hardly a big secret that consumer spending is a huge part of the engine that fires the US economy. Confidence in the future greatly affects consumer spending now. It is not in the interest of the selling machine to stress anything that will cause sustained economic headwinds.
In truth the media really doesn't care that much about what fuel sources we use (though no doubt it will slide whichever way the advertising money pulls it). However it certainly is not going to stress to the average Joe and Jill that the main reason tighter oil supplies have had a somewhat limited effect on their overall household cash flow in the last couple years is because another fossil fuel--natural gas--has bottomed out in price and thus heating and electricity use isn't taking near as big a piece of the pie it would have if there was no gas glut.
Spend now, don't worry about the future is the media message, that just happens to coincide nicely with FF industries' efforts to slow any erosion of their market shares in the energy sector (so my point is that it is more a case of coinciding interests than of a deliberate cooperative effort between the media and the FF industry, there is an important difference between the two modes of operation). Of course the FF industry protects itself well by spewing from the think tanks its funds (are they some of the intellectual leaders you speak of?) and from the politicians it buys. The sheer volume (in all senses of the word) spewed from those sources will mean they get far more than their share of news coverage. Money talks and money is inordinately distributed to a tiny fraction of the richest in the US these days...it doesn't appear many in that bunch think a better informed public is in their own interests.
we have intellectual leaders in the US?
Sure. Think of them as thought leaders, if you like. Very roughly and broadly speaking, there is what you might call a middle class of professionals, some of whom are intellectual professionals - journalists, writers, professors & teachers, economists, self-selected scientists, doctors, physicists, etc.
Economists and business journalists are in general very aware of the effect of oil prices on the economy. Professionals in general are pretty aware of climate change.
More later...
leaders implies leadership--haven't seen a whole lot coming from the class you mention--not on the oil supply/price issue anyway.
I do believe events have begun to overtake the noise and there is a momentun shift on climate change awareness. Greenland glacier melting 5 times faster than in 1990s or some version of the story was all over the media this week. The conclusions from the study will be repeated more regularly for now. Flooded subways, exploding substations and big sections of Manhattan going black have got more than a few people's attention. But a couple/few years of less dramatic weather events would dull the average memory quickly. We are much more focussed on changes in the weather than in the climate in our day to day.
leadership--haven't seen a whole lot coming from the class you mention
Yeah, they've been fairly intimidated. Nevetheless, the new CAFE regs are a real accomplishment. And, EVs have gotten a fair amount of support from this kind've crowd.
there is a momentun shift on climate change awareness.
Yes, things are shifting. The recent election helped - it showed that the right wing is not all powerful, even with Citizen's United.
Bloomberg's conversion is significant, I think - he's both a billionaire, a prominent politician and the owner of a lot of media, like Business Week.
I don't think there has ever been a general consensus on anything on The Oil Drum. We argue about everything and everyone has a different opinion. Your hypothesis is pretty well spot on. Oil supply did drop until prices rose again.
Brent has averaged just above $110 a barrel for two years now. These prices entice every producer and producing nation to produce every barrel possible. How long can it last? Everyone has an opinion and there is definitely no consensus anywhere that I can find. But I think we will hit the down slope of peak oil within the nest few years, most likely within two years. But that is only my opinion and I have consulted with no one other that my research in forming that opinion.
Gathering reliable data is a task within itself. Every source has its problems. JODI consults every nation and just reports that. The problem with JODI data is that not every nation reports. And some nations, like Iran and Venezuela in particular, just lie about their production. Venezuela lies because Chavez wants to show that he can produce just as much oil as he did before he fired the oil workers for striking. And Iran wants to say that the embargo is having no effect. They report, to JODI, about 1 million barrels a day more than every other reporting agency say they are producing.
So I have gathered the JODI data with data for nine nations from the EIA. Seven non-OPEC nations because they do not report at all to JODI are Kazakhstan, Syria, Vietnam, Sudan, Equatorial Guinea, Yemen and Gabon. And two OPEC nations I use EIA data for are Iran and Venezuela for the reason stated above.
The EIA just guesses for a lot of nations. I know this because for some nations they report the exact same production data for many months straight while the JODI data jumps around as it should. The data from the EIA behaves like that when they get good data, but when they don't they just guess and their guesses are always quite optimistic.
Below is what I think is the very best graph of Crude + Condensate published anywhere. It is in Kb/d with the last data point September 2012. All JODI data except for the nine nations of which I use EIA data.
That's it. You can make your own conclusions from the chart.
Ron P.
Love you graphs Ron! This one clearly shows the plateau that started in 2005, just as oil prices stared rising for real. To me, high prices combined with only a marginal increase in production is a clear signal that it's becoming increasingly difficult to produce oil. In my opinion, it will become even more difficult to produce oil in the future, which at some point will lead to decreasing production.
Ron, thanks for your graphs. One question. Your totals show global totals for C&C around 72 mbopd, whereas EAI is at around 75.3. Why is there a difference? Is the difference accounted for by the differences in JODI and IEA data, which you allude to in your text? Or are there other issues too?
Well the EIA reports every country in the world though most of them produce no oil at all. But many of them produce only a few barrels per day and JODI does not report most of these countries. So I suspect there are perhaps one to two hundred thousand barrels per day that JODI misses in those very small producers.
However the EIA reports data for every country which means that they must guess for many of them. I suspect that their guesses are often way too high. But there are also often several sources for a country's production numbers. For instance there are at least five, and likely many more, sources for OPEC production numbers. And about the same for non-OPEC numbers for large producers. The EIA, perhaps, chooses the most optimistic of these numbers.
Ron P.
the culture of this site leaned toward the following hypothesis:
Oils unparalleled rise was the result of supply constraints, and Middle East (Iran) tensions. These factors were due primarily to a stagnant global oil supply since 2005 that led to a series of ever worsening oil price spikes every summer. The drop in oil prices would only exacerbate the decline of supply; if supply can't rise at $147 it CERTAINLY can't rise at $40-$60 (that price didn't last long!).
I get a bit frustrated sometimes by the great divide between financial types and resource types. The financial types (economists) rarely have any clue about how the real world of resources and energy are "produced" and flow through the economy. They make up all their fantasy theories supporting their beliefs that resources aren't ultimately constraining to humanity and how technology will magically save us all.
On the other side are the engineer / scientist types who understand how resources are extracted and move through the economy, and how these are ultimately constraining to humanity, and about how we are "running out" of many important resources. But the scientist / engineer types miss out on a big part of the picture of how the boom / bust economic cycles work, and how these resources end up at the prices they end up at. To them, a dollar is a dollar. They don't factor in the fact that most dollars are actually imaginary credit, created out of thin air by banks, and that this is a major factor, in fact THE major factor, determining relatively short term (over a few years) pricing of everything. Underlying this of course are the general trends in resource depletion that get so much discussion here.
Typically on this site there is little discussion about the greater macro-economic financialization of everything, to the extent that it seems that rationalizations for price increases /drops end up being based on purely technical grounds. The resource types don't get that the financial system, i.e. what's ultimately pricing all these things, is the greatest ponzi scheme in the history of the world, devoid of almost any fundamental real world valuation. The monetary system is a complete and total farce. Ponzi schemes are by nature unstable and the efforts by central banks to keep this scheme propped up are having an overwhelming impact on what we see in the markets today.
So no, oil did NOT reach $147 because of supply constraints (at least not directly). Rather, this was a classic case of a financial bubble at its peak that then burst. The world's economy did NOT almost collapse in 2008 because of high oil prices. It almost collapsed because it was at the peak of a financial bubble in the real estate, equities, and every other market, brought about by artificially low interest rates.
In order to prevent this unprecedented deflationary collapse from completely imploding the financial system, central banks had to step in and basically start printing money, and to shift the insolvent balance sheets of the private sector onto the public sector, i.e. governments. This, combined with dropping interest rates to zero, resulted in another bubble forming whereby oil price rose again. But the debt to GDP ratios are now so high that economic growth has probably halted and now started to reverse, and the only way governments can run further deficits is to buy the debt with printed money. This bubble in bonds (dollars) has been somewhat offset by deflation from the collapsing economy, so that prices have not tanked yet. The financial system could not survive another crash like 2008. Of course, the Peak Oil problem is exacerbating all of this and ultimately prevents the world's economy from growing in real terms.
We are now at the next stage of the cycle and are due for another collapse as the debt to GDP ratios of governments around the world are just now beyond any sane level. There is no way this can ever be resolved without a total deflationary collapse. This would send oil prices plummeting. This is being prolonged, and ultimately intensified, by money printing where the central banks start printing money to buy up toxic assets to prevent this deflationary collapse. This is the definition of hyperinflation and in this case, after the inevitable initial deflationary shock waves ripple through the system, probably sometime in 2013, the printing presses will get fired up and we will see a dramatic decline in the purchasing power of currencies, and a dramatic rise in valuation of essential natural resources -- oil, precious metals, food, etc. Other resources like iron will probably go down in relative value because the economy will be in such shambles that no one will be building anything.
In general I agree with your assessment. In 2010 I predicted that the U.S credit rating would be downgraded (although, I predicted Moody's would move first... alas S&P did instead). I also predicted that the floodgates of U.S. ratings downgrades, financial collapse, and hyperinflation would erupt within 24 months after the first credit rating downgrade. That period has not passed, but i can now predict I was sorely overreacting. It is quite likely, however, that further credit rating downgrades will occur within that 24 month period; I'd say within the next 6-9 months.
I had first assumed that the U.S credit rating downgrade would be an emperor's new clothes kind of moment. The dow fell over 500 points the next trading day, but here's the thing. People fled into Treasuries (and gold) and out of equities. They bought Treasuries en masse when it was the exact thing being downgraded. I did not expect that.
So I began taking a look at Japan, as people had told me to do before. I thought Japan was different because of their trade surplus, and our egregious deficit. Now Japan has a trade deficit (a HUGE change), and their debt to GDP is over 200%. Yet, just as happened in the U.S. last year, people flock to buy their debt. The U.S. has and will ocntinue to be the least worst choice, and thus people (and the Fed!) will continue to buy our debt. The reality is that even though U.S. debt is a bad investment, Chinese debt is more risky, Japanese debt even worse, and European debt... well you get the point. You don't have to be the fastest runner to escape a bear attack, you just can't be the slowest, and the U.S. certainly isn't the slowest runner here.
In terms of game theory a hyperinflation scenario in the U.S. is impossible. I used to hold the complete opposite opinion, and it turned out that I was flat wrong.
I mostly agree. Except when you say that US hyperinflation is impossible. I agree that the US is still one of the fastest runners out there. People are saying Japan will hyperinflate first due to its huge debt to GDP ratio and the amount of printing that will be required to offset the deflation they will soon be seeing. But the world's currencies do not exist in isolation, it's all part of the same banker empire. If Japan hyperinflates then capital will flee to the next best currency, then that will cause that currency to rise, then deflation will happen there, then the central banks will be forced to print, then it will hyperinflate, then move on to the next currency, etc. Eventually the whole world's financial system will collapse.
The one thing that could change this scenario that is difficult to predict is what will happen with gold reserves when that comes out of the closet and we see how those secretive cards are played, i.e. who actually has possession of the world's gold, that mostly used to be held by the American people until the Federal Reserve (a private, unregulated bank) gained control of the people's money supply. Does China have most of it?
So at any point along this hyperinflation trajectory the countries that still have gold could peg their currencies to their gold reserves and prevent that freefall. This would at the very least result in a dramatic reduction in purchasing power of currencies compared with today.
Megaprojects does not count smaller oil wells. For example, it lists USA will add 50 kb/d in 2012, whereas EIA shows the USA to have added a net amount of ~250 kb/d of C+C during the first half of 2012. Megaprojects consistently underestimates the amount of production because it does not include all of the wells in development.
That applies for the US and Worldwide, but when considering OPEC output, the megaprojects probably captures 95 % of new output.
Your point stands however, megaprojects does not capture everything so it will tend to underestimate actual output.
DC
The disparity between the two must be some proxy measure of declining EROEI?
The problem with the megaprojects approach is primarily an error of ommision. Not all 'mega' projects make the megaprojects list. North Dakota bakken didn't make the list. That bench warmer is up to 662,428 bopd = 66 mega(>10,000 bpd)projects.
https://www.dmr.nd.gov/oilgas/stats/historicalbakkenoilstats.pdf
The arithmetic of plateu production is simple: Decline = megaprojects + not so megaprojects.
The real problem happens when megaprojects are used to justify the can't and won't - i.e. doom.
North Dakota bakken didn't make the list. That bench warmer is up to 662,428 bopd = 66 mega(>10,000 bpd)projects
Speaking of the Bakken bench warmer NYT ran this article the other day
After Drought, Reducing Water Flow Could Hurt Mississippi River Transport
[with my emphasis]
I haven't seen anything on just how much water the Bakken operations withdraw for their frac'ing, but water availability might have something to do with the frac backlog--the upper Missouri River drains pretty much the entire play. Hopefully the lion's share of the frac fluids are reconditioned and reused, but I've not seen data on the total water demands made as ND tight oil production moves toward 1mbd. Does anyone here know if water withdrawl limits are an issue for Bakken oil production?
80,000 barrels for a typical 35-40 stage frac. I don't know either, how much is recycled.
The Lodgepole/Bakken/Three Forks also produces water when frac'ed. I don't believe any of the produced water is usable for frac'in. Interesting though that the 'Bakken' of old produced very little water. In other words, water production is unique to frac'ed 'Bakken' wells.